Article

Molecular Descriptors—Spectral Property Relations for Characterizing Molecular Interactions in Binary and Ternary Solutions, Excited State Dipole Moment Estimation

by
Dana Ortansa Dorohoi
1,*,
Steluta Gosav
2,
Ana Cezarina Moroșanu
1,3,
Dan Gheorghe Dimitriu
1,*,
Gabriela Apreotesei
4 and
Teodora Gosav
5
1
Faculty of Physics, Alexandru Ioan Cuza University, 11 Carol I Blvd., 700506 Iași, Romania
2
Faculty of Sciences and Environment, Dunărea de Jos University, 800008 Galați, Romania
3
National College Petru Rares, 4 Stefan cel Mare Street, 610121 Piatra Neamt, Romania
4
Faculty of Machine Manufacturing and Industrial Management, Gheorghe Asachi University, 67 Dimitrie Mangeron Blvd., 700050 Iași, Romania
5
Faculty of General Medicine, Gr. T. Popa University of Medicine and Pharmacy, 16 Universității Street, 700115 Iași, Romania
*
Authors to whom correspondence should be addressed.
Symmetry 2023, 15(11), 2075; https://doi.org/10.3390/sym15112075
Submission received: 13 October 2023 / Revised: 3 November 2023 / Accepted: 12 November 2023 / Published: 15 November 2023
(This article belongs to the Collection Feature Papers in Chemistry)

Abstract

:
The nature and strength of the molecular interactions were established by solvatochromic studies of 22 binary and 42 ternary diluted solutions of pyridinium–carbethoxy–anilidomethylid (PCAnM). The visible absorption band of PCAnM, due to an intramolecular charge transfer (ICT) from the carbanion towards the heterocycle, shows a great sensitivity to the solvent nature. The spectral data are analysed by linear energy relationship (LERS) and the contribution of each type of interaction to the total spectral shift is estimated. The results from the solvatochromic study and those obtained by quantum mechanical computations were correlated in order to estimate the excited state dipole moment of the studied methylid. The decrease of the dipole moment by excitation emphasized in this study corresponds to the ICT nature of the visible absorption band of the solute. The ternary solutions of PCAnM achieved in mixtures of water with primary alcohols (ethanol and methanol) show the dependence of the visible band on the molar fraction of water and give the difference between the interaction energies in molecular pairs of the type water–methylid and alcohol–methylid, computed based on the statistical cell model of ternary solutions. The decrease in strength of the hydrogen bond between PCAnM and the protic solvent molecules was estimated in the following order: water > methanol > ethanol. The results from this study can be utilized in Organic Chemistry to generate knowledge of the interactions with solvents when cycloimmonium methylids are used as precursors to obtain new heterocycles and also in Quantum Chemistry to obtain a better description of their excited electronic states.

1. Introduction

Pyridinium–carbethoxy–anilido–methylid (PCAnM) is studied in this paper from both a computational and a spectral point of view in order to obtain information about the nature and strength of intermolecular interactions in solutions and to estimate its excited state dipole moment. In PCAnM, the positive nitrogen of the pyridinium ring is covalently bonded to a negative α-exo-cycle carbon, named carbanion [1,2,3]. Two electronegative atomic groups (carbethoxy and anilido) bonded to the ylid carbanion assure the stability of this cycloimmonium ylid [2].
The stability of cycloimmonium ylids is influenced by both the electronegativity of the carbanion substituents and the electron-withdrawing ability of the heterocycle [2,3].
The first ylid with cation pyridinium was synthetized by Kröhnke in 1935 from the bromide of N–phenacyl–pyridinium and potassium carbonate [1,4]. Pyridinium ylids are important precursors for obtaining new heterocycle compounds in Organic Chemistry [5,6] by dipolar cycloadditions [7,8,9,10]. A multitude of chemical syntheses, e.g., for indolizines, cyclopropanes, diazo-pyridines, 2,3-dihydrofuranes, nitrones, or azepines, use pyridinium ylids as building blocks [2].
The stability of pyridinium ylids is due to the electrostatic attraction between the oppositely charged parts of the molecules and the charges delocalization both on the heterocycle and on the carbanion, as well as the resonant structures of the molecules [2].
In pyridinium ylids, as in all cycloimmonium ylids, the carbanion hybridization is between sp2 (three equienergetic orbitals of carbanion are contained in the plane of heterocycle making angles of 120 degrees between them) and sp3 (four equienergetic orbitals of the ylid carbanion are oriented towards the picks of one tetrahedron, so the electron pair of non-participant electrons are contained in an orbital inclined relative to the heterocycle plane) depending on the nature of the carbanion substituents. For example, in pyridinium–dicyano–methylid and in pyridinium–dicarbethoxy–methylid [2,11], the carbanion hybridization is near sp2, meaning that its planar structure belongs to the C2v point group of symmetry, while in the carbanion monosubstituted pyridinium ylids the carbanion hybridization is near sp3 and the molecule carbanions are non-planar compared with those having symmetrically substituted carbanions.
PCAnM undergoes an intramolecular charge transfer from the carbanion toward the heterocycle when the visible photon is absorbed. In the absorption process, all pyridinium methylids undergo polarity changes and change or lose their colour [11,12]. Due to this fact, the pyridinium ylids and their salts are used to obtain various photochromatic materials [13,14,15], such as photochromic Merrifield resins [13]. The change in colour of the irradiated ylids is considered an indicator of acid-basic nature of the chemical reactions [2].
Pyridinium ylids have applications in Polymer Chemistry, generating photo resistors, water-soluble MID UV resist materials, or photochromic materials [13,14,15,16]. The water-insoluble acyl diazepine polymers [16] for the printing of plates, printed circuit boards, or photo resistors were obtained from polymer-containing pyridinium ylid moieties by actinic irradiation.
The visible electronic absorption band of pyridinium ylids, as well as of the other cycloimmonium ylids, being very sensitive to the solvent nature [11,12,17,18], can be used in the characterization of the local internal field (defined by Onsager [19]) in liquids by estimating the strength of the universal and specific interactions.
In this study, we intend to correlate the computed quantum mechanical properties with the solvatochromic data in order to estimate the excited state dipole moment of pyridinium–carbethoxy–anilido–methylid (PCAnM).
The statistical cell model of ternary solutions is applied here in order to estimate the strength of the specific interactions in molecular pairs of PCAnM with water and primary alcohols molecules. This estimation is important because there are a few methods able to measure the interaction energy between two molecules.

2. Theoretical Bases

The quantum mechanical computations can establish some molecular descriptors [20,21,22], such energetic and electro-optical parameters, which influence the intermolecular interactions in condensed media. For example, knowing the values of the lowest unoccupied molecular orbital (LUMO) and highest occupied molecular orbital (HOMO) energies, one can compute the energetic gap [20] giving the reactivity of the molecule; knowing the polar surface area (PSA), one can decide if the analyzed molecule can penetrate the cell membranes [21]. Alternatively, by analyzing the electrostatic potential map, one can establish the reactive centres of a molecule [20,22]. The molecular descriptors can be also used in drug identification [23,24].
The electro-optical parameters such as electric charges near the atoms, dipole moment, or polarizability influence the spectral behavior of the molecules, because they determine the stabilization (solvation) energy in various liquids. When a molecule is introduced into a solvent, it is under the local electric field (Onsager) created by the liquid molecules surrounding it. The solute concentration is very small in the solutions spectrally analyzed, so the solute molecules do not interact among them. Only the interactions between the solvent and solute molecules are evaluated in solvatochromic analyses.
The solvation energy depends both on the strength of the local reactive electric field and on the electro-optical descriptors of the solute molecules. The difference between the solvation energies of the solute (spectrally active molecule) in the electronic states responsible for the electronic band appearance is proportional to the spectral shift of the electronic band relative to its position in the spectrum of an isolated molecule (in its gaseous state).
The existent theories [25,26,27,28] regarding the solvent influence on the electronic bands take into consideration only the universal interactions (dipolar and dispersive ones), neglecting the possible specific interactions (hydrogen bonds, proton, or electron transfer, etc.) among the molecules in solutions. The spectral data corresponding to solutions in which specific interactions influence the solvation energy differ by those computed based on existent theories. In order to attain agreement between the experimental data and those computed, some empirical parameters of solvents were to describe the spectral shifts due to specific interactions.
Usually, the spectral shifts of the electronic bands in solutions compared with the gaseous state are described by relations of the type reported in Equation (1).
v ¯ c m 1 = v 0 c m 1 + C 1 f Ɛ + C 2 f n + C 3 β + C 4 α
In the multilinear dependence (1), the free term indicates the wavenumber in the isolated state of the spectrally active molecule, the following two terms were theoretically established and give the influence of the universal interactions between the solvent (considered a continuous dielectric) and the solute molecule. The last two terms from (1) were added empirically in order to describe the specific interaction influence on the electronic band position. The functions f Ɛ = Ɛ 1 Ɛ + 2 and f n = n 2 1 n 2 + 2 depend on the electric permittivity of the solvent, ε, and refractive index, n, respectively. The empirical parameters α and β [29] characterize the solvent ability to specifically interact with the solute molecule by donating or receiving protons (having acid or basic nature, respectively). The correlation coefficients from (1) can be estimated by statistical means [30,31] based on solvatochromic analysis.
The importance of this model for describing the solvatochromic behavior of the electronic spectra lies in the fact that the correlation coefficients, C 1 and C 2 , depend on the solute descriptors resulting from Equations (2) and (3) [11,12,31]:
C 1 = 2 µ g ( µ g µ e c o s φ ) a 3 + 3 k T α g α e a 3
C 2 = µ g µ e a 3 2 µ g ( µ g µ e c o s φ ) a 3 3 k T α g α e a 3 + 3 2 α g α e a 3 I u I v I u + I v .
In Equations (2) and (3), the notations indicate the dipole moments, µ g and µ e , the electric polarizabilities, α g and α e , in ground (g) and excited (e) electronic states of the solute, ionization potential, I, temperature, T, angle φ between the molecular dipole moments in the two electronic states responsible for the visible band appearance, and the solute molecular radius, a. The indices u and v refer to the solute and solvent molecules, respectively. The correlation coefficients C 1 and C 2 from (2) and (3) are usually expressed in erg = 10−7 Joule, dipole moments in ues·cm, the term 3kT in erg (k = 1.38·10−16 erg·K−1), and absolute temperature in K.
The molecular descriptors in the ground state of the solute can be estimated by quantum mechanical procedures. The values of the ground state ionization potentials and temperature at which experiments are conducted are also known. In (2) and (3), a is the solute molecular radius, approximated using Equation (4) (given the hypothesis that the molecule is a spherical entity):
a = 3 V A
Three unknown parameters are in Equations (2) and (3): electric dipole moment and electric polarizability in the solute excited state and the angle φ between the dipole moments in the electronic states responsible for ICT.
In the case of the solute molecules showing both absorption and emission electronic bands, the estimation of the excited state values of the dipole moment and electric polarizability as well as of the angle between the ground and excited state dipole moments becomes possible if one uses the values for the molecular descriptors computed by quantum means [32,33,34,35] for the ground electronic state and the values of the correlation coefficients in Equation (1) for both absorption and fluorescence.
In order to estimate the excited state dipole moment of PCAnM molecules, for which the fluorescence spectrum is not available, two methods were used. The results obtained following adoption of McRae’s hypothesis [25] and usage of the variational method [36] are compared here with those obtained using the solvatochromic model proposed by Takehiro Abe [26].
For the case of the solute molecules, showing only absorption band in the visible range, one can use the variational method [11,12,36] in order to establish the excited state dipole moment and its angle with the ground state dipole moment. This method [36], as per McRae’s hypothesis, uses the values of the correlation coefficients C 1 and C 2 estimated from the solvatochromic analysis and the descriptors of the solute molecule in its electronic ground state computed by quantum mechanical means. McRae [25] stipulates that, in the visible photon absorption process, the electric polarizability of solute does not change its value.
When C 1 + C 2 are expressed in erg (1 cm−1 = 1.98618 × 10⁻¹⁶ erg), the dipole moment is expressed in Debye (1 D = 10−18 ues·cm), the ionization potential is expressed in erg (1 eV = 1.6022 × 10⁻¹² erg), and the electric polarizability is expressed in cm3 (1 Å = 10−8 cm), from Equations (2) and (3) one obtains:
( C 1 + C 2 ) a 3 = µ g 2 µ e 2 + 3 2 I u I v I u + I u ( α g α e )
α g α e = 2 3 I u + I v I u I u C 1 + C 2 a 3 µ g 2 + µ e 2
Using the difference α g α e from (6), one obtains Equation (7) from Equation (2):
2 k T I u + I v I u I u µ e 2 2 µ g µ e c o s φ + 2 µ g 2 C 1 a 3 + 2 K T I u + I v I u I u C 1 + C 2 a 3 µ g 2 = 0
Equation (7), with the unknown parameter μe, must have a discriminator, Δ, greater than zero, in order to obtain real solutions for the excited dipole moment of the solute molecule.
= ( 2 µ g c o s φ ) 2 8 k T I u + I v I u I u 2 µ g 2 C 1 a 3 + 2 k T I u + I v I u I u C 1 + C 2 a 3 µ g 2
The solutions µ e 1,2 of Equation (7) depend on the angle φ, as it results from (9) and (8).
µ e 1,2 = 2 µ g c o s φ ± 2 k T I u + I v I u I u
When the angle φ is changed, there is a value for which the left side of Equation (6) becomes null. In this condition, the excited and the ground state polarizability of the solute are equal and, according to McRae’s hypothesis, one can consider the angle between the dipole moments of molecules in the two electronic states responsible for photon absorption as corresponding to ICT transition.
When the solute does not show a fluorescence spectrum, in McRae’s hypothesis, the variational method offers the possibility to estimate, within the limits of the solvatochromic analysis, the excited state dipole moment of the solute molecule and the angle φ.
In Abe’s model [26], both the dipole moment and the polarizability of the solute are considered variable in their interaction with photons. The results of the ABE model establish a correlation between the molecular parameters of the solute and solvent, taking into consideration their variation by excitation with the visible photons.
The final equation in Abe’s model shows that between the parameters A and B from (10) and (11) there exists a linear dependence expressed by Equation (12):
A = µ g 2 ( v ) + 3 2 α g ( v ) I g ( v ) I g u h c ν s I g v + I g u h c ν s 2 3 k T µ g 2 v p + α ( v ) ,
B = ν 0 ν s C + µ g 2 v + 3 2 α g ( v ) I g v I g u h c ν s I g v + I g u h c ν s α g ( u ) 2 3 k T µ g 2 v p + α ( v ) ,
µ e 2 u µ g 2 u + α e u A = B .
The constant C from Equation (7) can be computed as follows [26]:
C = p R u v ( p ) 6
C = 16 π 3 N A 2 9 ρ v M v 2 3 M u ρ u 1 3 + M v ρ v 1 3 4 + M u ρ u 1 3 + 3 M v ρ v 1 3 4 + M u ρ u 1 3 + 5 M v ρ v 1 3 4 +
The following notations were made in Equations (10)–(13): µ—electric dipole moment; α—molecular polarizability; I—ionization potential; ν—wavenumber in the maximum of the electronic absorption band; M—molar mass; ρ—density; T—absolute temperature; u and v—spectrally active molecule and solvent molecule, respectively; g and e—ground and excited electronic states of the solute molecule, respectively; NA—Avogadro’s number; k—Boltzmann constant.
In the dependence B vs. A from (12), the slope signifies the excited state polarizability, αe(u), of the solute molecule and the intercept is the difference between the squares of the solute molecule dipole moments in the electronic states responsible for the light absorption process, µ e 2 u µ g 2 u .
The model of Takehiro Abe can be applied when a linear dependence is established between the parameters A and B. Based on this dependence, the excited state dipole moment and polarizability can be estimated if the ground state descriptors of the solute molecule are determined by other methods.
Both methods for the estimation of the excited dipole moment of a molecule showing only the electronic absorption spectrum were developed from simplified hypotheses and will give different results depending on the omitted phenomena in their mathematical expressions.
A great number of papers based on solvatochromic analysis describe the solvent influence using only empirical parameters: π*, α, and β for the influence of the universal and specific interactions between solute and solvent molecule [27,29]:
v ¯ c m 1 = v 0 c m 1 + P π * + B β + A α
Unfortunately, the description of the solvent influence afforded by Equation (14) is made with empirical parameters and does not express the correlation coefficients P, B, and A as functions of the molecular descriptors of the solute. Reichardt [27] demonstrated that between the empirical parameter π* and the solvent parameters f(ε) and f(n) there is a linear dependence; therefore, the universal interactions from liquids can be estimated using the parameter π*.
In order to determine the difference w2w1 between the interaction energies in molecular pairs of the types water (1)—ylid and primary alcohol (2)—ylid, the statistical cell model of ternary solutions [37,38,39,40] was applied here. The ternary solutions of PCAnM were achieved by using mixtures of water with primary alcohols methanol and ethanol. Liquids were indexed using the numbers 1 and 2 after the value of the wavenumber in the maximum of the visible electronic absorption band of solute.
The competition between the two solvent molecules for the occupation of the preferential places (from an energetic point of view) near the solute molecule and the thermal motion in liquids cause the heterogeneity of ternary solutions [41]. The first solvation shell of solute can have different compositions, compared with the rest of the ternary solution.
The final equation obtained in the statistical cell model of the ternary solutions is of the type:
l n p 1 1 p 1 = l n x 1 1 x 1 + w 2 w 1 k T ,   x 1 0 , p 1 0 .
In Equation (15), p1 is the average statistical weight of the water molecules in the first solvation shell of the solute molecule, x1 is the molar fraction of the water molecules in ternary solution, w1 and w2 are the interaction energies in molecular pairs of the types water–solute and alcohol–solute. For the ternary studied solutions of the type water (1) + alcohol (2) + solute, where the indices 1 and 2 denominate the active solvent and the few active solvents from the interactions point of view.
The average statistical weights p1 and p2 = 1 − p1 of the two solvents in the first solvation shell of the solute molecule are computed (in the ternary cell model) using the wavenumbers ν1, ν2, and νt measured in binary solutions achieved in water (1), in alcohol (2) and in their mixtures (t), respectively, (ν1    ν2  νt) as follows:
p 1 = ν t ν 2 ν 1 ν 2   and   p 2 = ν 1 ν t ν 1 ν 2 .
The Equation (16) are used in the statistical cell model to estimate the ternary solution homogeneity. When p1x1, the first solvation shell of solute contains a higher number of molecules of type (1) compared with the rest of the ternary solution.
If a linear dependence of the type (15) is accomplished, the difference w2w1 can be estimated by the cut at origin in the graph l n p 1 1 p 1 vs. l n x 1 1 x 1 .
The models briefly described above were also used in the investigation of other solutes (spectrally active molecules) for both binary [11,12,18,31] and ternary [11,12,38,39,40] solutions.

3. Materials and Methods

The studied molecule, PCAnM, was prepared using the salt method [2] in the laboratories of Organic Chemistry of Alexandru Ioan Cuza University of Iași. The structure and purity of the substance were analyzed by spectral (NMR and FTIR) and chemical (elemental) analyses.
The structural formula of PCAnM is given in Scheme 1.
Our purpose was to establish some molecular parameters of this molecule in its ground electronic state using a quantum mechanical procedure and correlate them with the solvatochromic results in order to obtain information about its excited electronic state within the limits of existent theories.
The quantum mechanical analysis was conducted with the software Spartan’14 [42] using the EDF2/6-31G* density functional model [43]. The descriptors of PCAnM in water, ethanol, and toluene were computed using the continuum solvation model, called PM8 [44]. The results are given in Table 1.
The electronic spectra in the visible range were recorded using a Specord UV–Vis spectrophotometer Carl Zeiss Jena with data acquisition system. The position of the maximum of the visible electronic absorption band was established (with a precision of ± 5 cm−1) in 22 pure solvents, chosen with different electro-optical parameters, and in 42 mixtures of two protic solvents (water + ethanol and water + methanol) for which the solvent parameters n, ε, π*, α, and β are known from literature [27,29,45,46].
The solvent parameters and the experimentally determined wavenumbers in the maximum of the visible band of PCAnM in binary solutions are listed in Table 2. The binary solvent parameters for mixtures of water + ethanol and water + methanol were determined in [46] respectively. The values of the wavenumber in the maximum of the visible band of PCAnM are listed in the last column of Table 2.

4. Results and Discussions

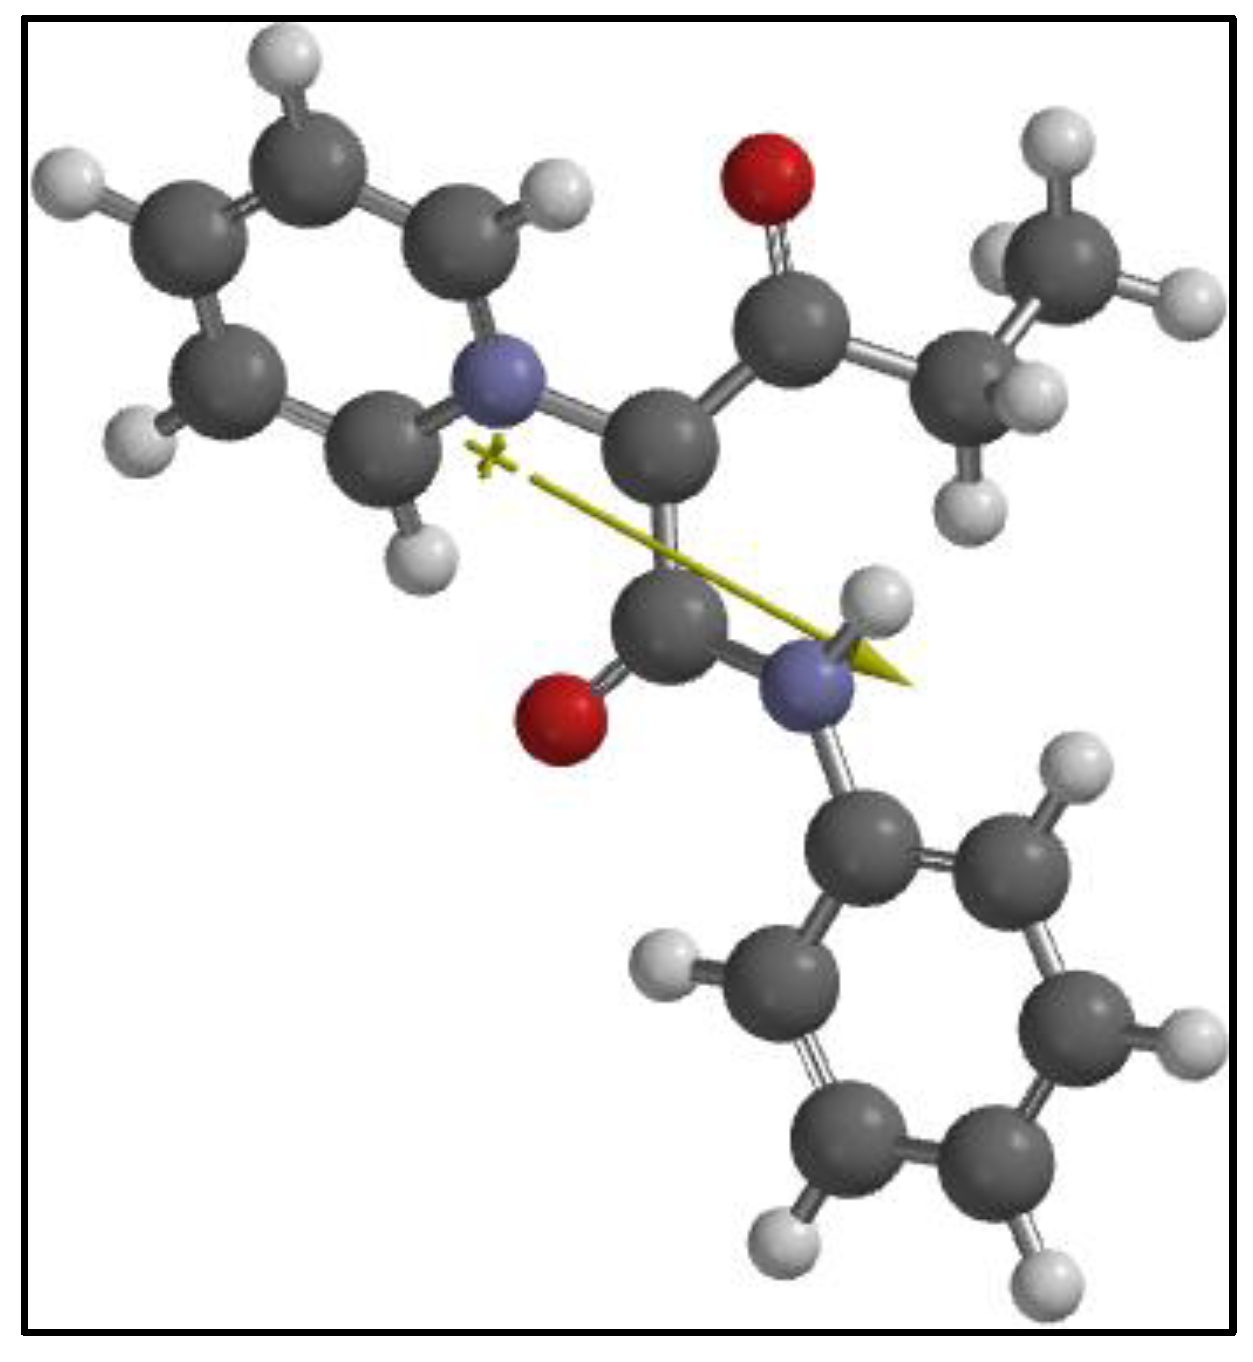
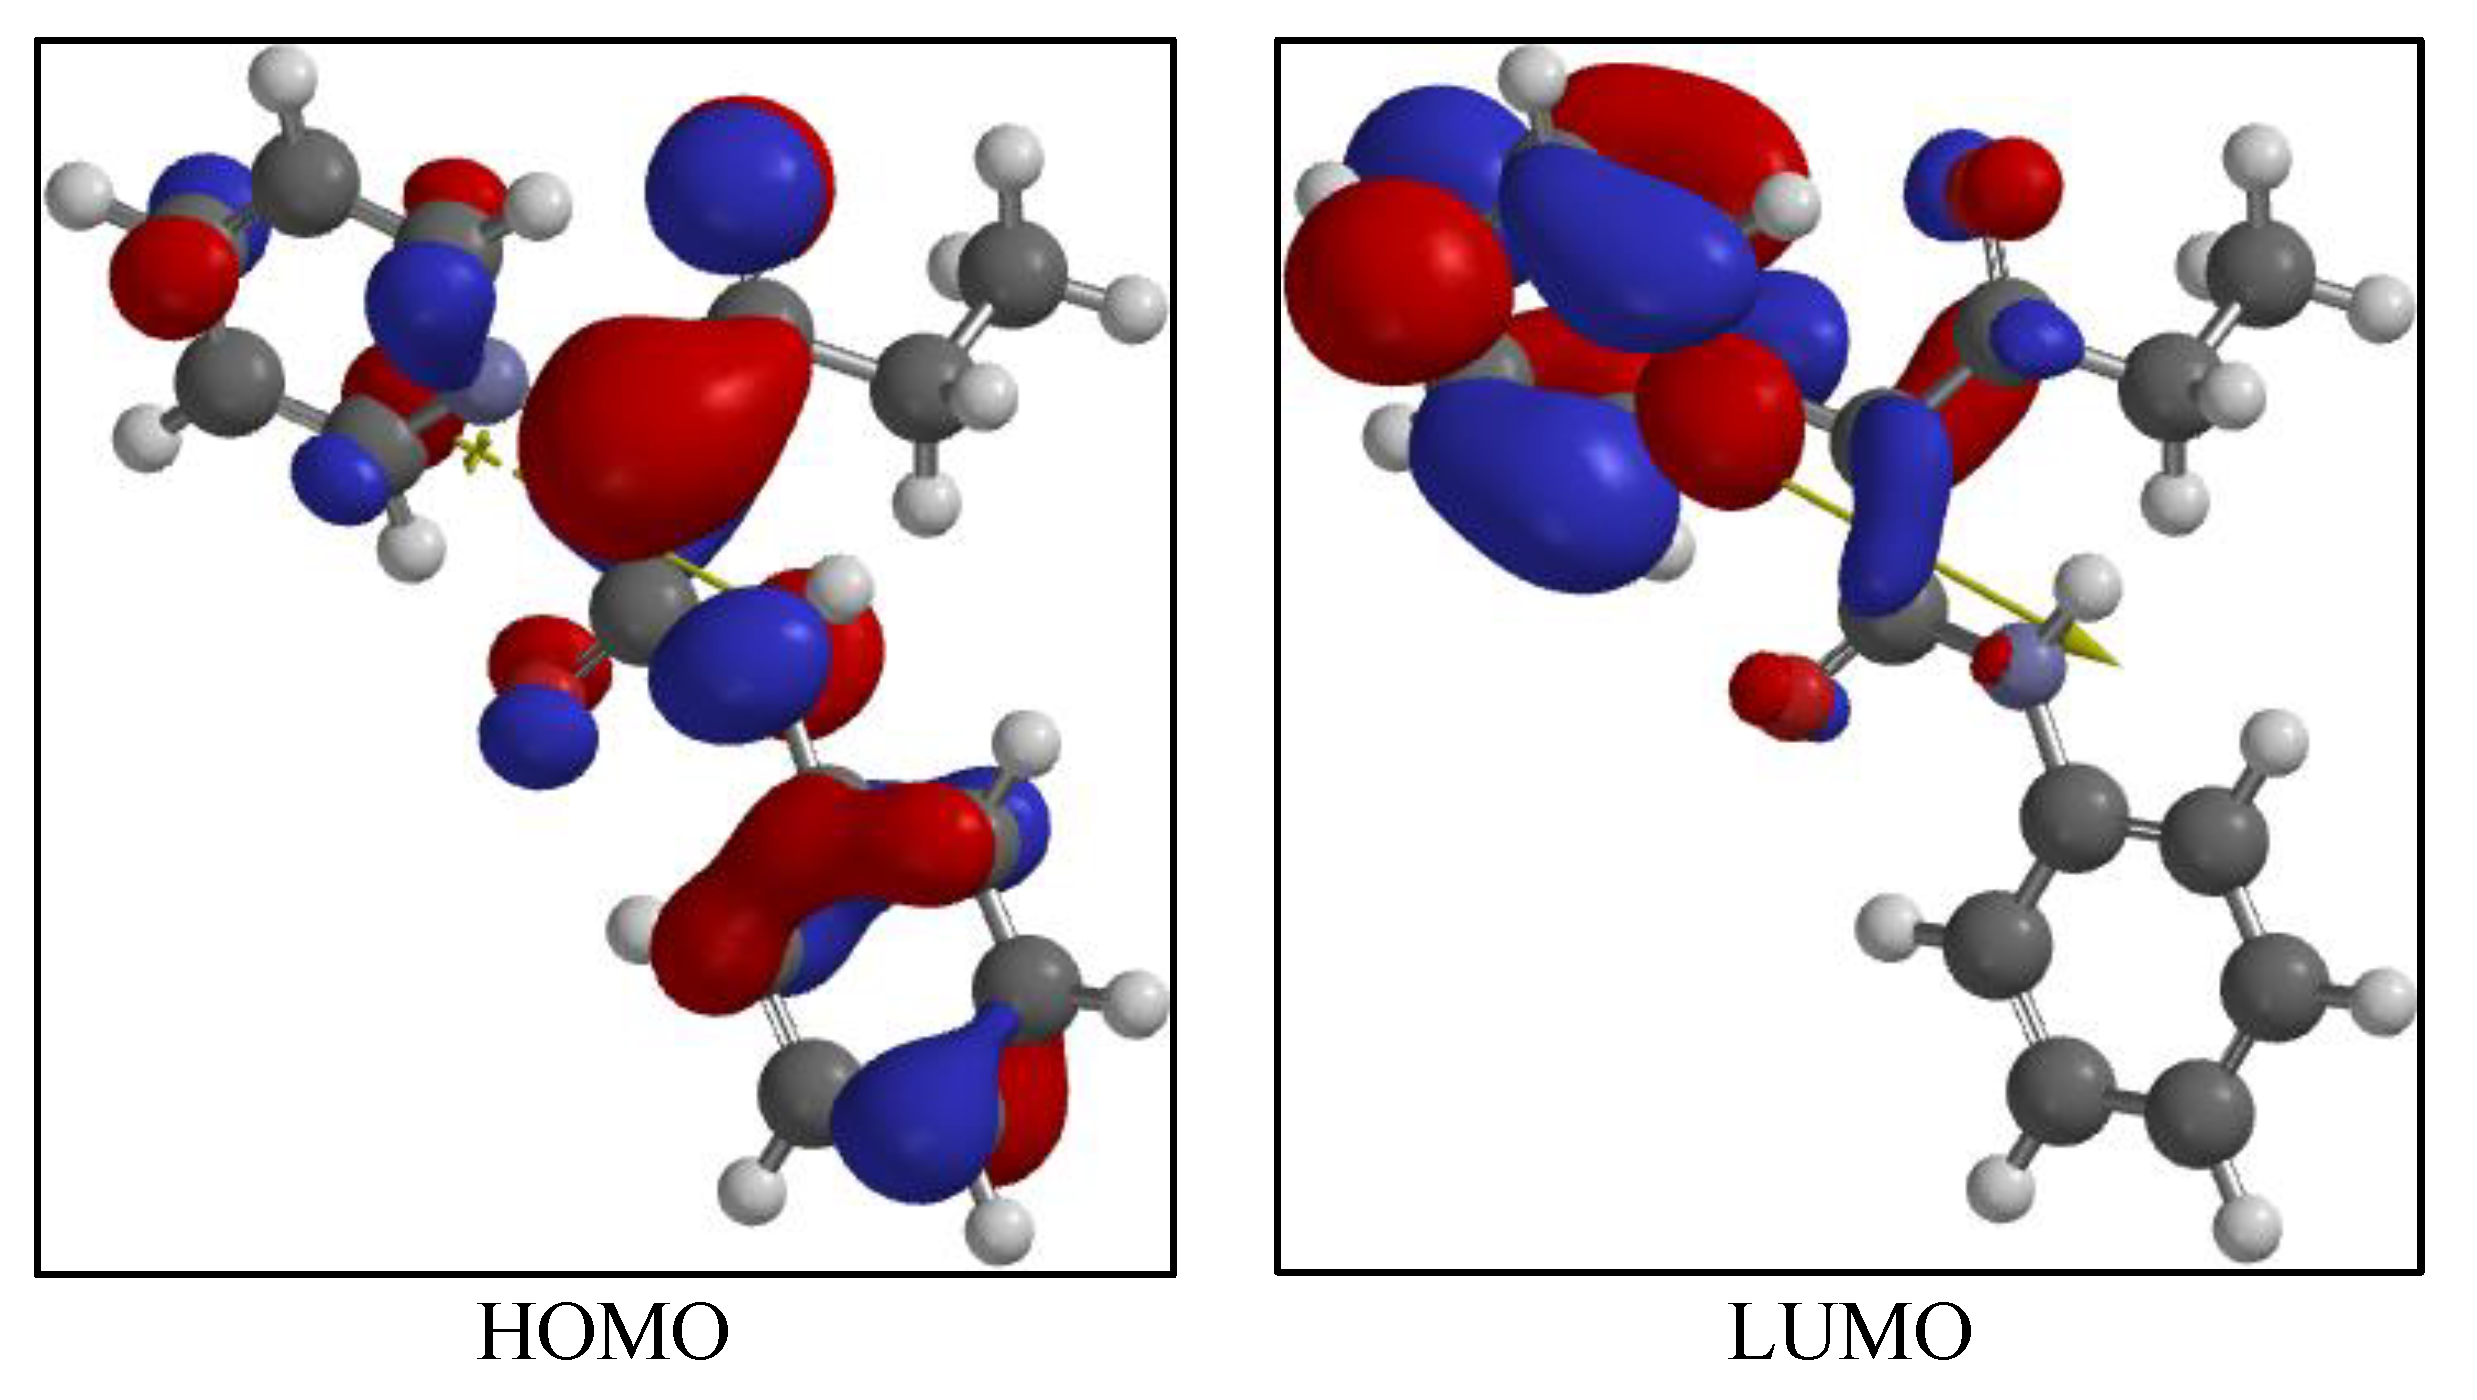
4.1. Computational Results

Some descriptors used in the estimation of the excited state dipole moment of the studied molecule are listed in Table 1. From this table it can be evinced that PCAnM is a dipolar, polarizable molecule able to participate in hydrogen bonds with the solvent protic molecules.
The computed data (by Spartan’14) given in Table 1 show the dipolar nature of the studied methylid, with the ground state dipole moment increasing when the molecule is introduced in polar liquids.
The HBA (Hydrogen Bond Acceptor) count indicates that there exist four places in the molecule in which a hydrogen bond can be realized by accepting protons of the protic solvents and only one place (HBD—Hydrogen Bond Donator is equal with unity) to donate protons to basic liquid molecule. This fact underlines the necessity to consider the presence of the specific interactions in PCAnM solutions in the analysis of solvatochromic results, such interactions being neglected in the theories [25,26] about the solvent influence on the electronic bands of the solute. The spatial arrangement of the atoms in PCAnM, given after optimization by Spartan’14, is illustrated in Figure 1.
The energy gap, ELUMOEHOMO, is influenced by the solvent nature, as indicated by the Spartan’14 computations (see Table 1). The maps of HOMO and LUMO (Figure 2) suggest the intramolecular charge transfer from the ylid carbanion toward the heterocycle [2,3].
The density of electrons increases on the heterocycle by transition from the ground (HOMO) to the excited state (LUMO) of PCAnM, as it can be observed in Figure 2.
The descriptors obtained by Spartan’14 for PCAnM (Table 1) are used in this study to estimate the excited state dipole moment of molecules.

4.2. Spectral Analysis

4.2.1. Binary Solutions—Solvent Influence on the Wavenumber in the Maximum of the ICT Visible Band of PCAnM

The wavenumbers in the maximum of the ICT visible band of PCAnM, listed in Table 2, show a hipsochromic shift in polar and protic solvents through comparison with nonpolar or aprotic ones. In Table 2, the solvent parameters used in the expression of the spectral shifts of the ICT visible band of PCAnM according to Equations (1) and (14) from chapter 2 are also listed.
The spectral data were correlated with the solvent parameters based on Equations (1) and (14) and the results are given in Figure 3 and Figure 4, respectively.
Based on Table 2 and Equation (1), Equation (17) was obtained:
ν (cm−1) = (21,965 ± 612) + (1358 ± 401)f(𝜀) + (2106 ± 1773)f(n)
+ (327 ± 234)β + (1792 ± 203)α
The characteristics of LERS (Linear Energy Relation Ship) are multiple R = 0.985, R square = 0.971, adj. R square = 0.963, and standard error = 199 cm−1.
Given the high values of ΔC3 in Equation (17), the solvent parameter β was eliminated and the new statistical analysis was written as follows:
ν (cm−1) = (22,600 ± 143) + (1257 ± 226)f(𝜀) + (−210 ± 19.72)f(n) + (1872 ± 203)α
Equation (18) expresses a better correlation between experimental and computed values for the wavenumbers in the maximum of the ICT visible band of PCAnM in binary solutions, and emphasizes the important role of orientation interactions and the presence of the specific interactions in the methylid solutions with protic solvents. The dependence of the computed wavenumbers versus the experimental ones using Equation (18) is illustrated in Figure 3.
In Figure 4, the computed wavenumbers, with respect to Equation (14), in the maximum of the visible electronic band of PCAnM, νcalc(cm−1), relative to the experimental values are plotted. The linear energy relationship, LERS (19), was obtained using the data from Table 2 and Equation (14).
ν (cm−1) = (22,642 ± 298) + (734 ± 391)π* + (912 ± 334)β + (1898 ± 247)α
The characteristics of LERS are multiple R = 0.978, R square = 0.958, adj. R square = 0.950, and standard error = 233 cm−1. The solvent parameters defined by Kamlet, Abboud, and Taft describe with good results the solvatochromic effect, but the coefficients multiplying the corresponding parameters are not expressed by molecular descriptors of the spectrally active molecule.
The contribution of each type of interaction for the solvents in Table 2 were estimated in cm−1 and in percentages using Equations (18) and (19). The results are given in Table 3.
From the data in Table 3, it is evinced that the universal interactions (orientation, induction, polarization, and dispersion) are predominant in the diluted solutions of PCAnM with aprotic solvent, while in the solutions with the protic solvents the specific interactions by hydrogen bonds become more important. This result confirms the basic nature of the PCAnM molecule.

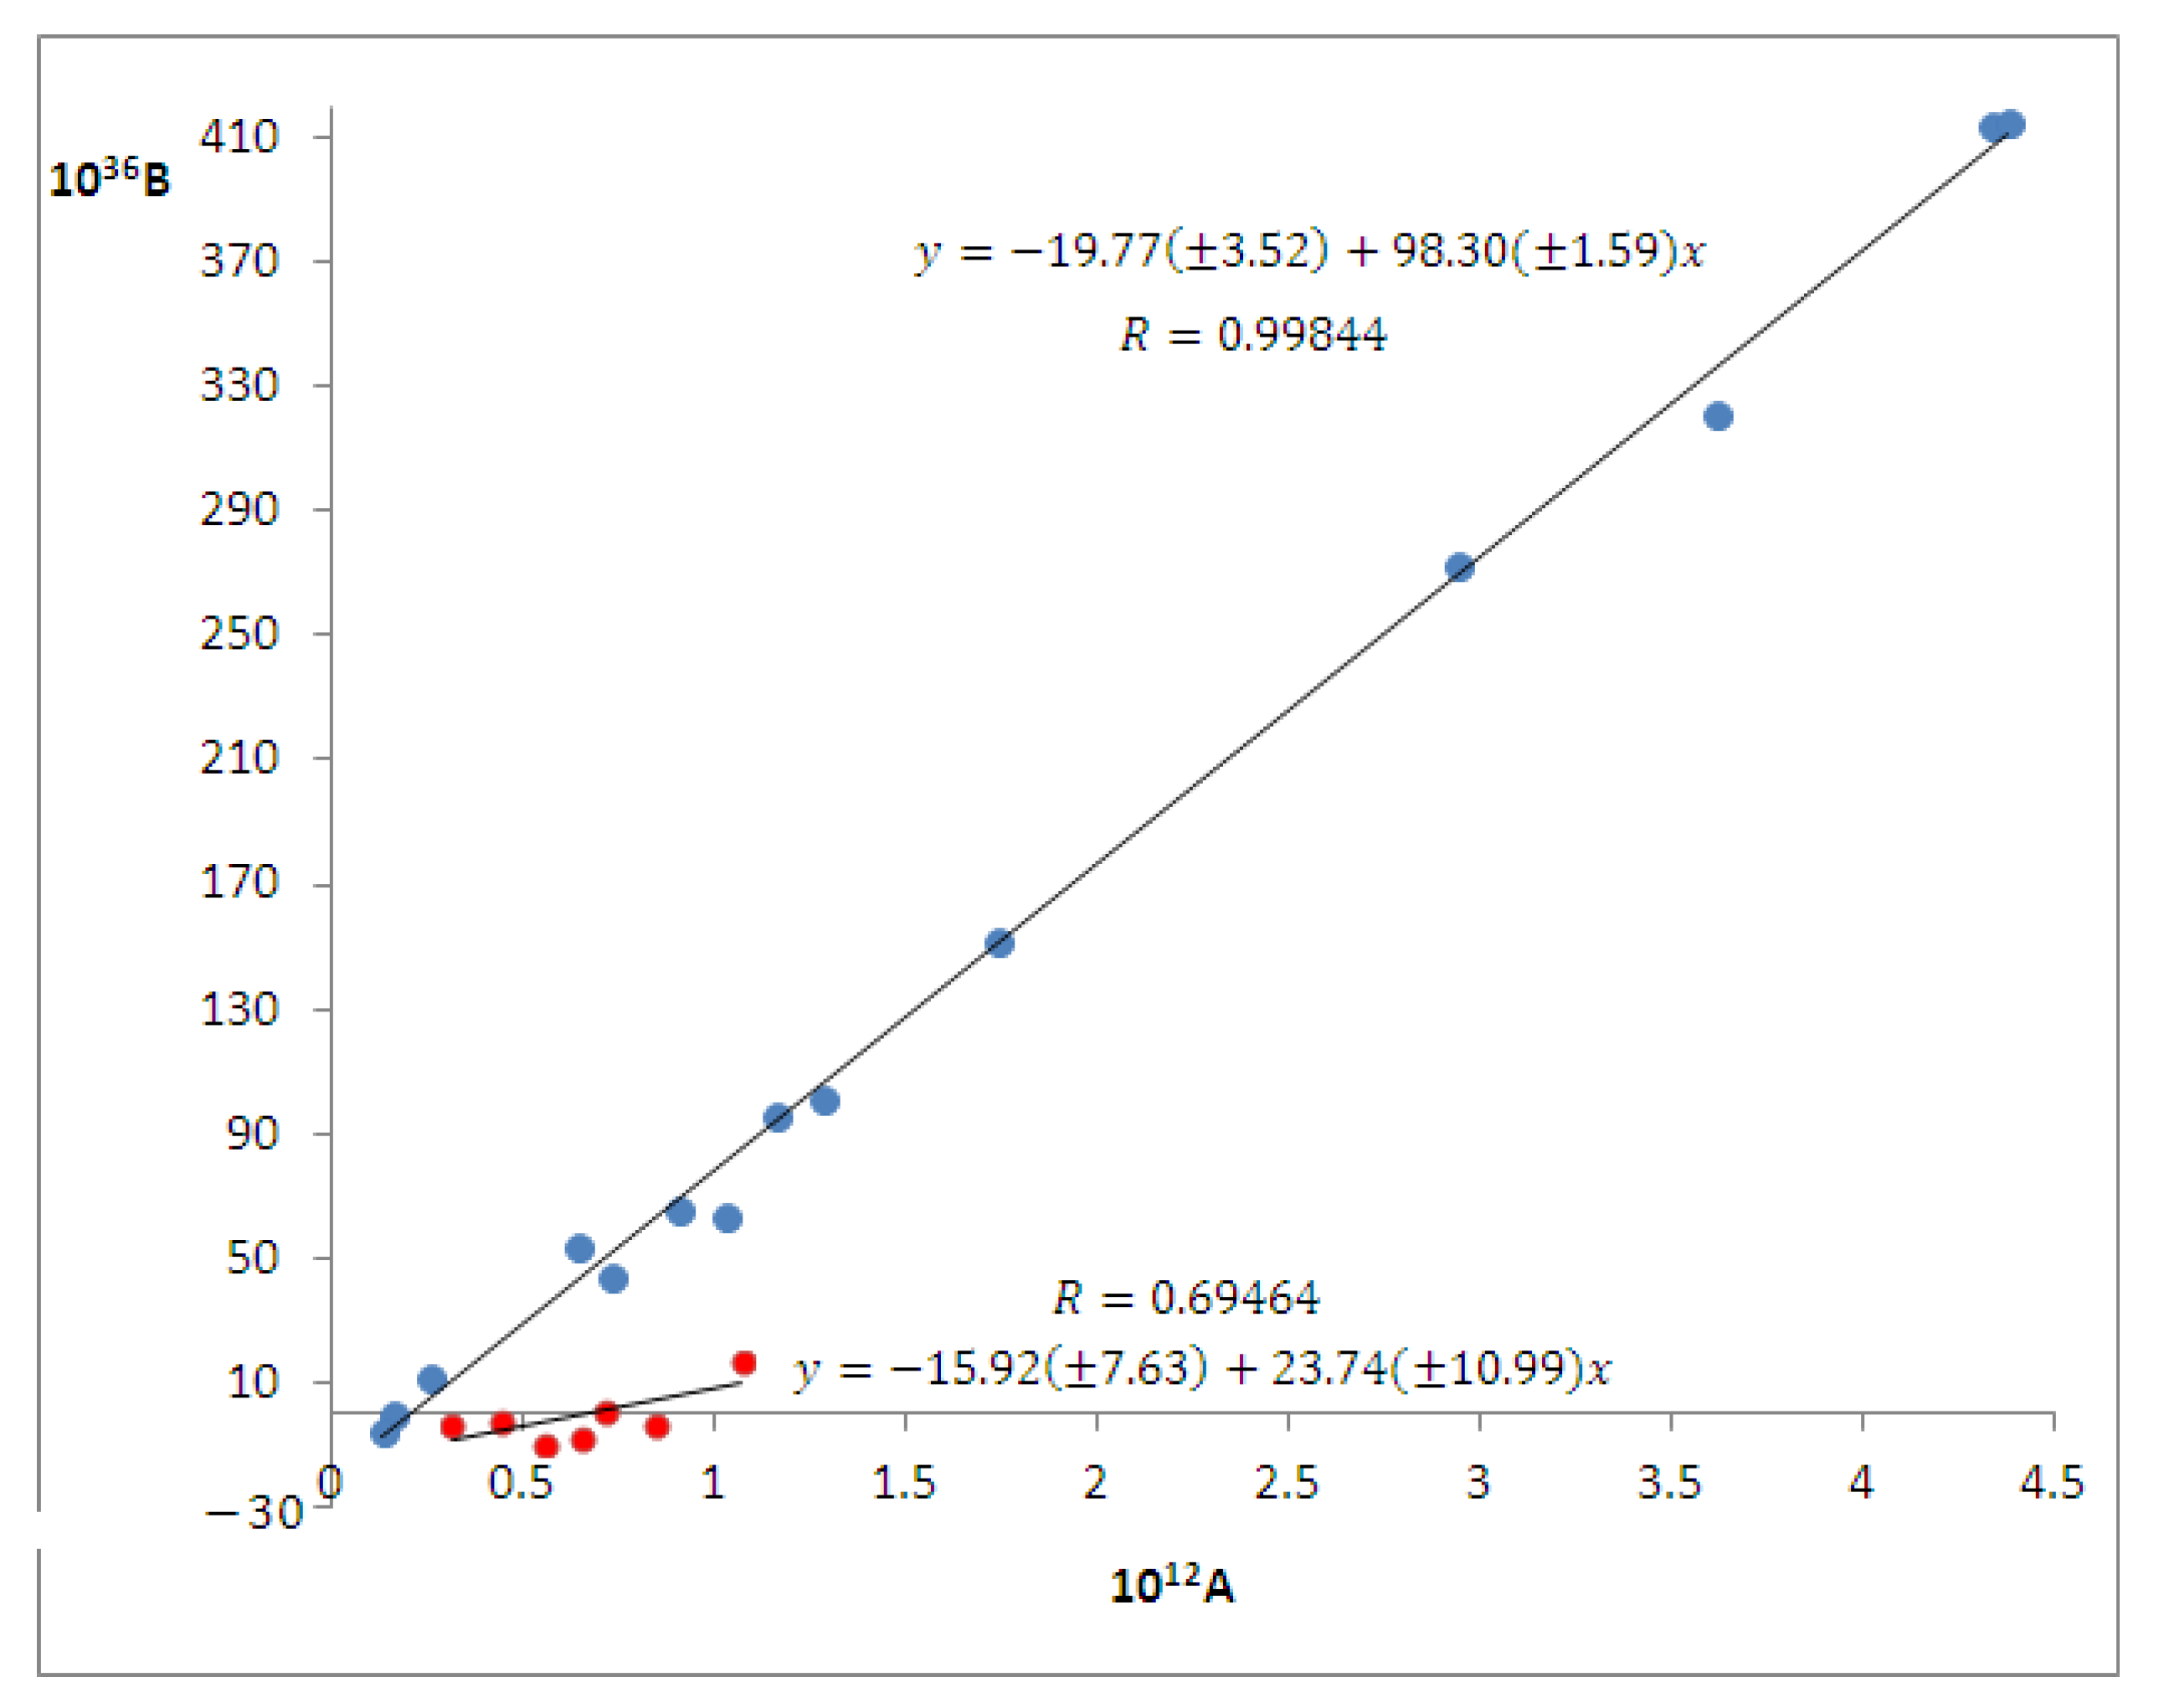
4.2.2. Dipole Moment of PCAnM Computed Based on Takehiro Abe’s Model

As it is observed in Equations (10) and (11) obtained by Abe in his model of the visible spectral shifts in diluted solutions, the solvent parameters (dipole moment and polarizability in ground electronic state, ionization potential from the ground electronic state, molar mass, density) from Table 4 were used. In Table 4, the wavenumbers in the maximum of the visible ICT band of PCAnM recorded in diluted solutions were added.
The spectral data and the solvent parameters from Table 4 were used to compute, based on Equations (10) and (11), the parameters A and B from the model proposed by Abe [26]. The dependence between B and A is illustrated in Figure 5, separately for aprotic (blue points) and protic (red points) solvents. In protic solvents (water and alcohols), PCAnM developed specific interactions via hydrogen bonds and these solvents are placed on another line in Figure 5, with a different slope and cut at the origin compared with the line containing the aprotic solvents.
The dependences obtained by LERS based on the model of Abe with the data from Table 4 are written bellow for the two categories of solvents:
B = (98.30 ± 1.59)A − (19.77 ± 3.53)
with R = 0.998, R square = 0.997, and adj. R square = 0.996 for the aprotic solvents, and
B = (23.74 ± 10.99)A − (15.92 ± 7.63)
with R = 0.979, R square = 0.958, and adj. R square = 0.956 for the protic solvents.
The negative values obtained for the difference between the squares of the excited and ground states of PCAnM dipole moments in Abe’s model, both for the protic and aprotic solvents, are in accordance with the supposition that the ICT is realized from the carbanion toward the heterocycle. The ICT process induces the decrease of the dipole moment in the excited state compared to the ground electronic state. For μg = 4.67 D in toluene, one obtains μe = 1.43 D for the aprotic solvents. In the case of the protic solvents, in which complexes formed by hydrogen bonds are made between ylid and solvent molecules, for μg = 5.61 D in water, one obtains μe = 3.94 D.
It can be observed that the electric polarizability of PCAnM computed in Abe’s model increases by visible absorption in the aprotic solvents, while in the protic solvents the excited state polarizability decreases compared with the ground state (see Table 1) of this molecule, probably due to the hydrogen bonds between the ylid and the solvent protic molecules.
According to Abe’s model, the dipole moment of PCAnM decreases in the photon absorption process both in protic and aprotic solvents and the excited polarizability differs from the ground state polarizability.

4.2.3. Excited State Dipole Moment of PCAnM Estimated Based on Variational Model

PCAnM is a molecule inactive in the fluorescence spectrum. For it, one can use the variational method [11,12] to estimate the excited dipole moment, based on solvatochromic analysis.
In order to compare the results obtained by using Abe’s model with those obtained using the variational model, let us make some simple mathematical correlations between the excited state dipole moment and polarizability of the solute molecule using the solvatochromic results.
Given the values of the correlation coefficients from Equation (19) and the data from Table 1, based on Equation (6), one obtains Equation (22):
α e = 65.8308 0.1237 µ e 2
The unknown parameter µ e in Equation (23) can be obtained based on Equations (23) and (6), using the data from Table 1:
0.0150 µ e 2 9.34 µ e c o s φ + 37.7592 = 0
Equation (23) has real solutions for μe only for angles φ for which its discriminator, = ( 9.34 c o s φ ) 2 2.2656 , is a positive quantity (for φ values in the range 0–82.2°). The solutions to Equation (23) can be obtained using Equation (24):
µ e 1,2 = 9.34 c o s φ ± 0.03
In Table 5, the values of the excited state dipole moment and polarizability of PCAnM are listed, obtained by solving Equation (23) and using Equation (24), respectively, to estimate αe when the angle φ between the dipole moments of the molecule in its ground and excited stats is altered.
For φ = 10.5°, μe = 4.14 D, and αe = 63.71 Å3, a value corresponding to the value computed for the ground state polarizability αg = 63.71 Å3 is obtained. Based on McRae’s hypothesis, according to which in the UV–Vis absorption process the molecular polarizability does not change its value, we can consider that this is the condition for the appearance of the ICT visible band of PCAnM.
The value of 4.14 D, obtained by variational method in the hypothesis α e = α g , is very close to the value obtained in the frame of the Abe’s model for the case of protic solvents. The values obtained using Abe’s model for the excited state dipole moments of PCAnM are 3.94 D in the case of protic solvents and 1.43 D for the aprotic solvents, if one considers the value 4.67 D computed in toluene and 5.61 D computed in water for PCAnM in its ground electronic state (Table 1).
Given the approximations according to which the two models are developed, one can consider the results obtained as being valuable. All values obtained by the two methods suggest the decrease of the dipole moment in the visible photon absorption, in accordance with the attribution of the visible absorption electronic band to an intramolecular charge transfer from the carbanion toward the heterocycle.

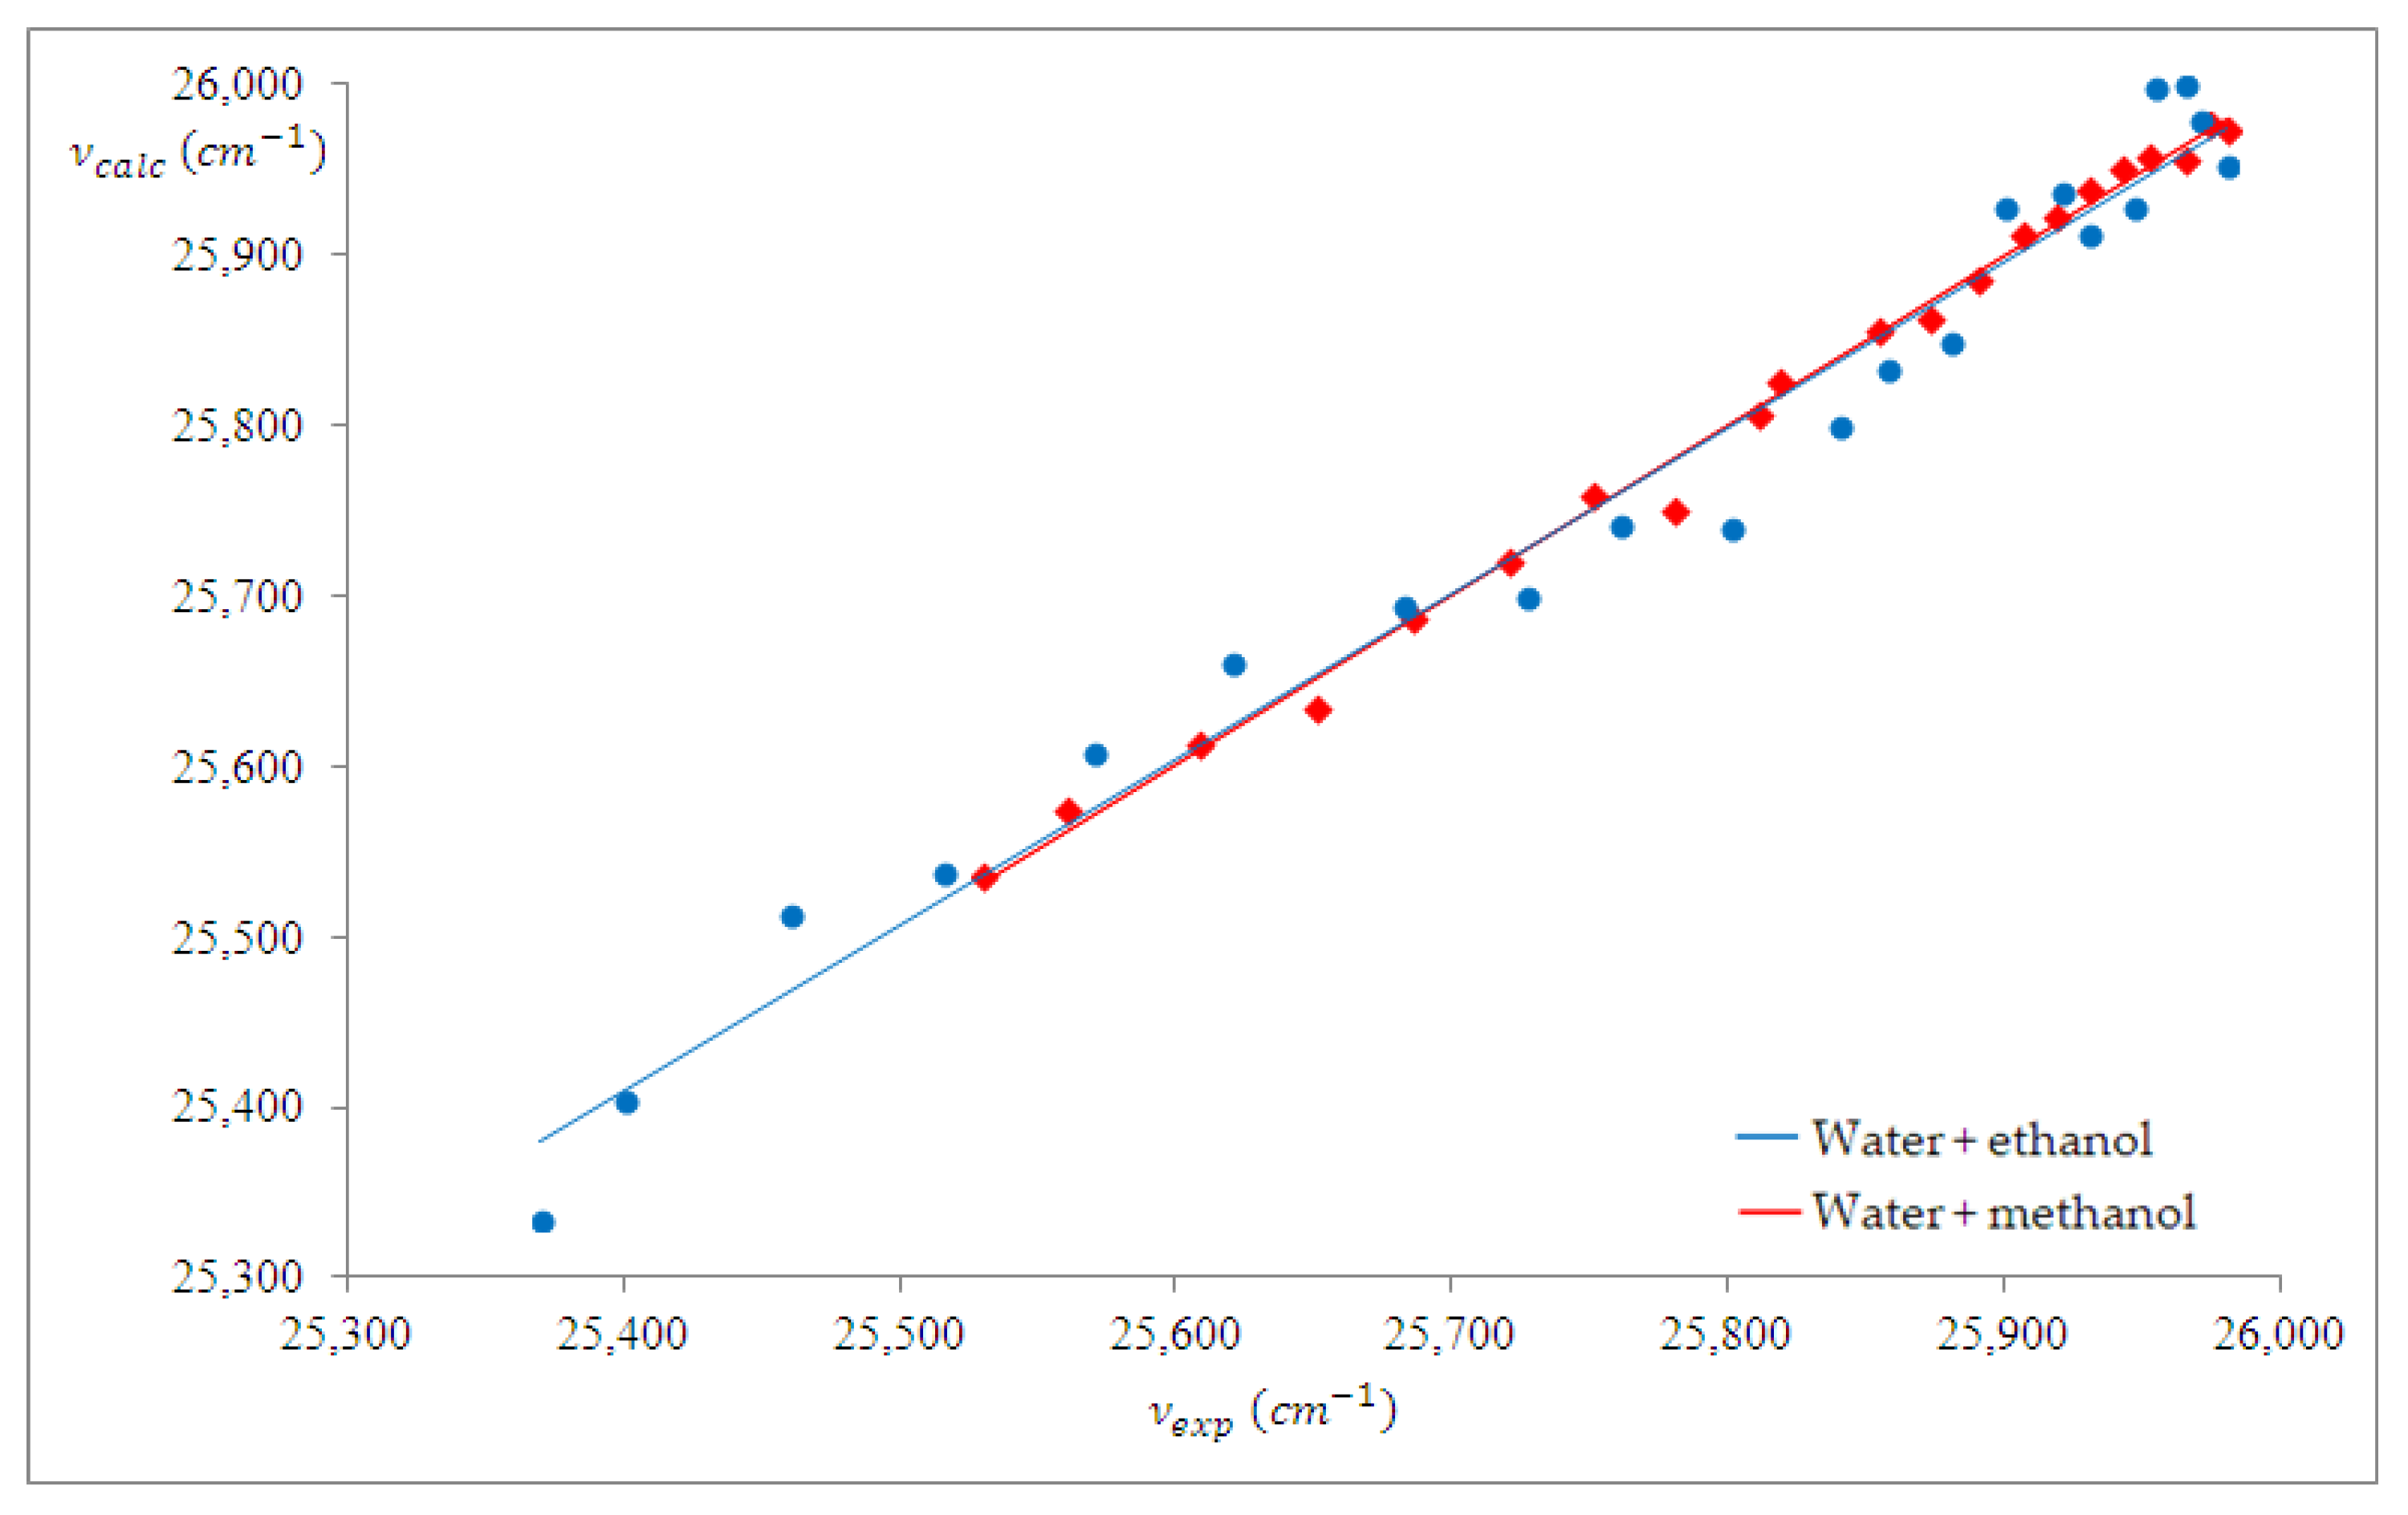
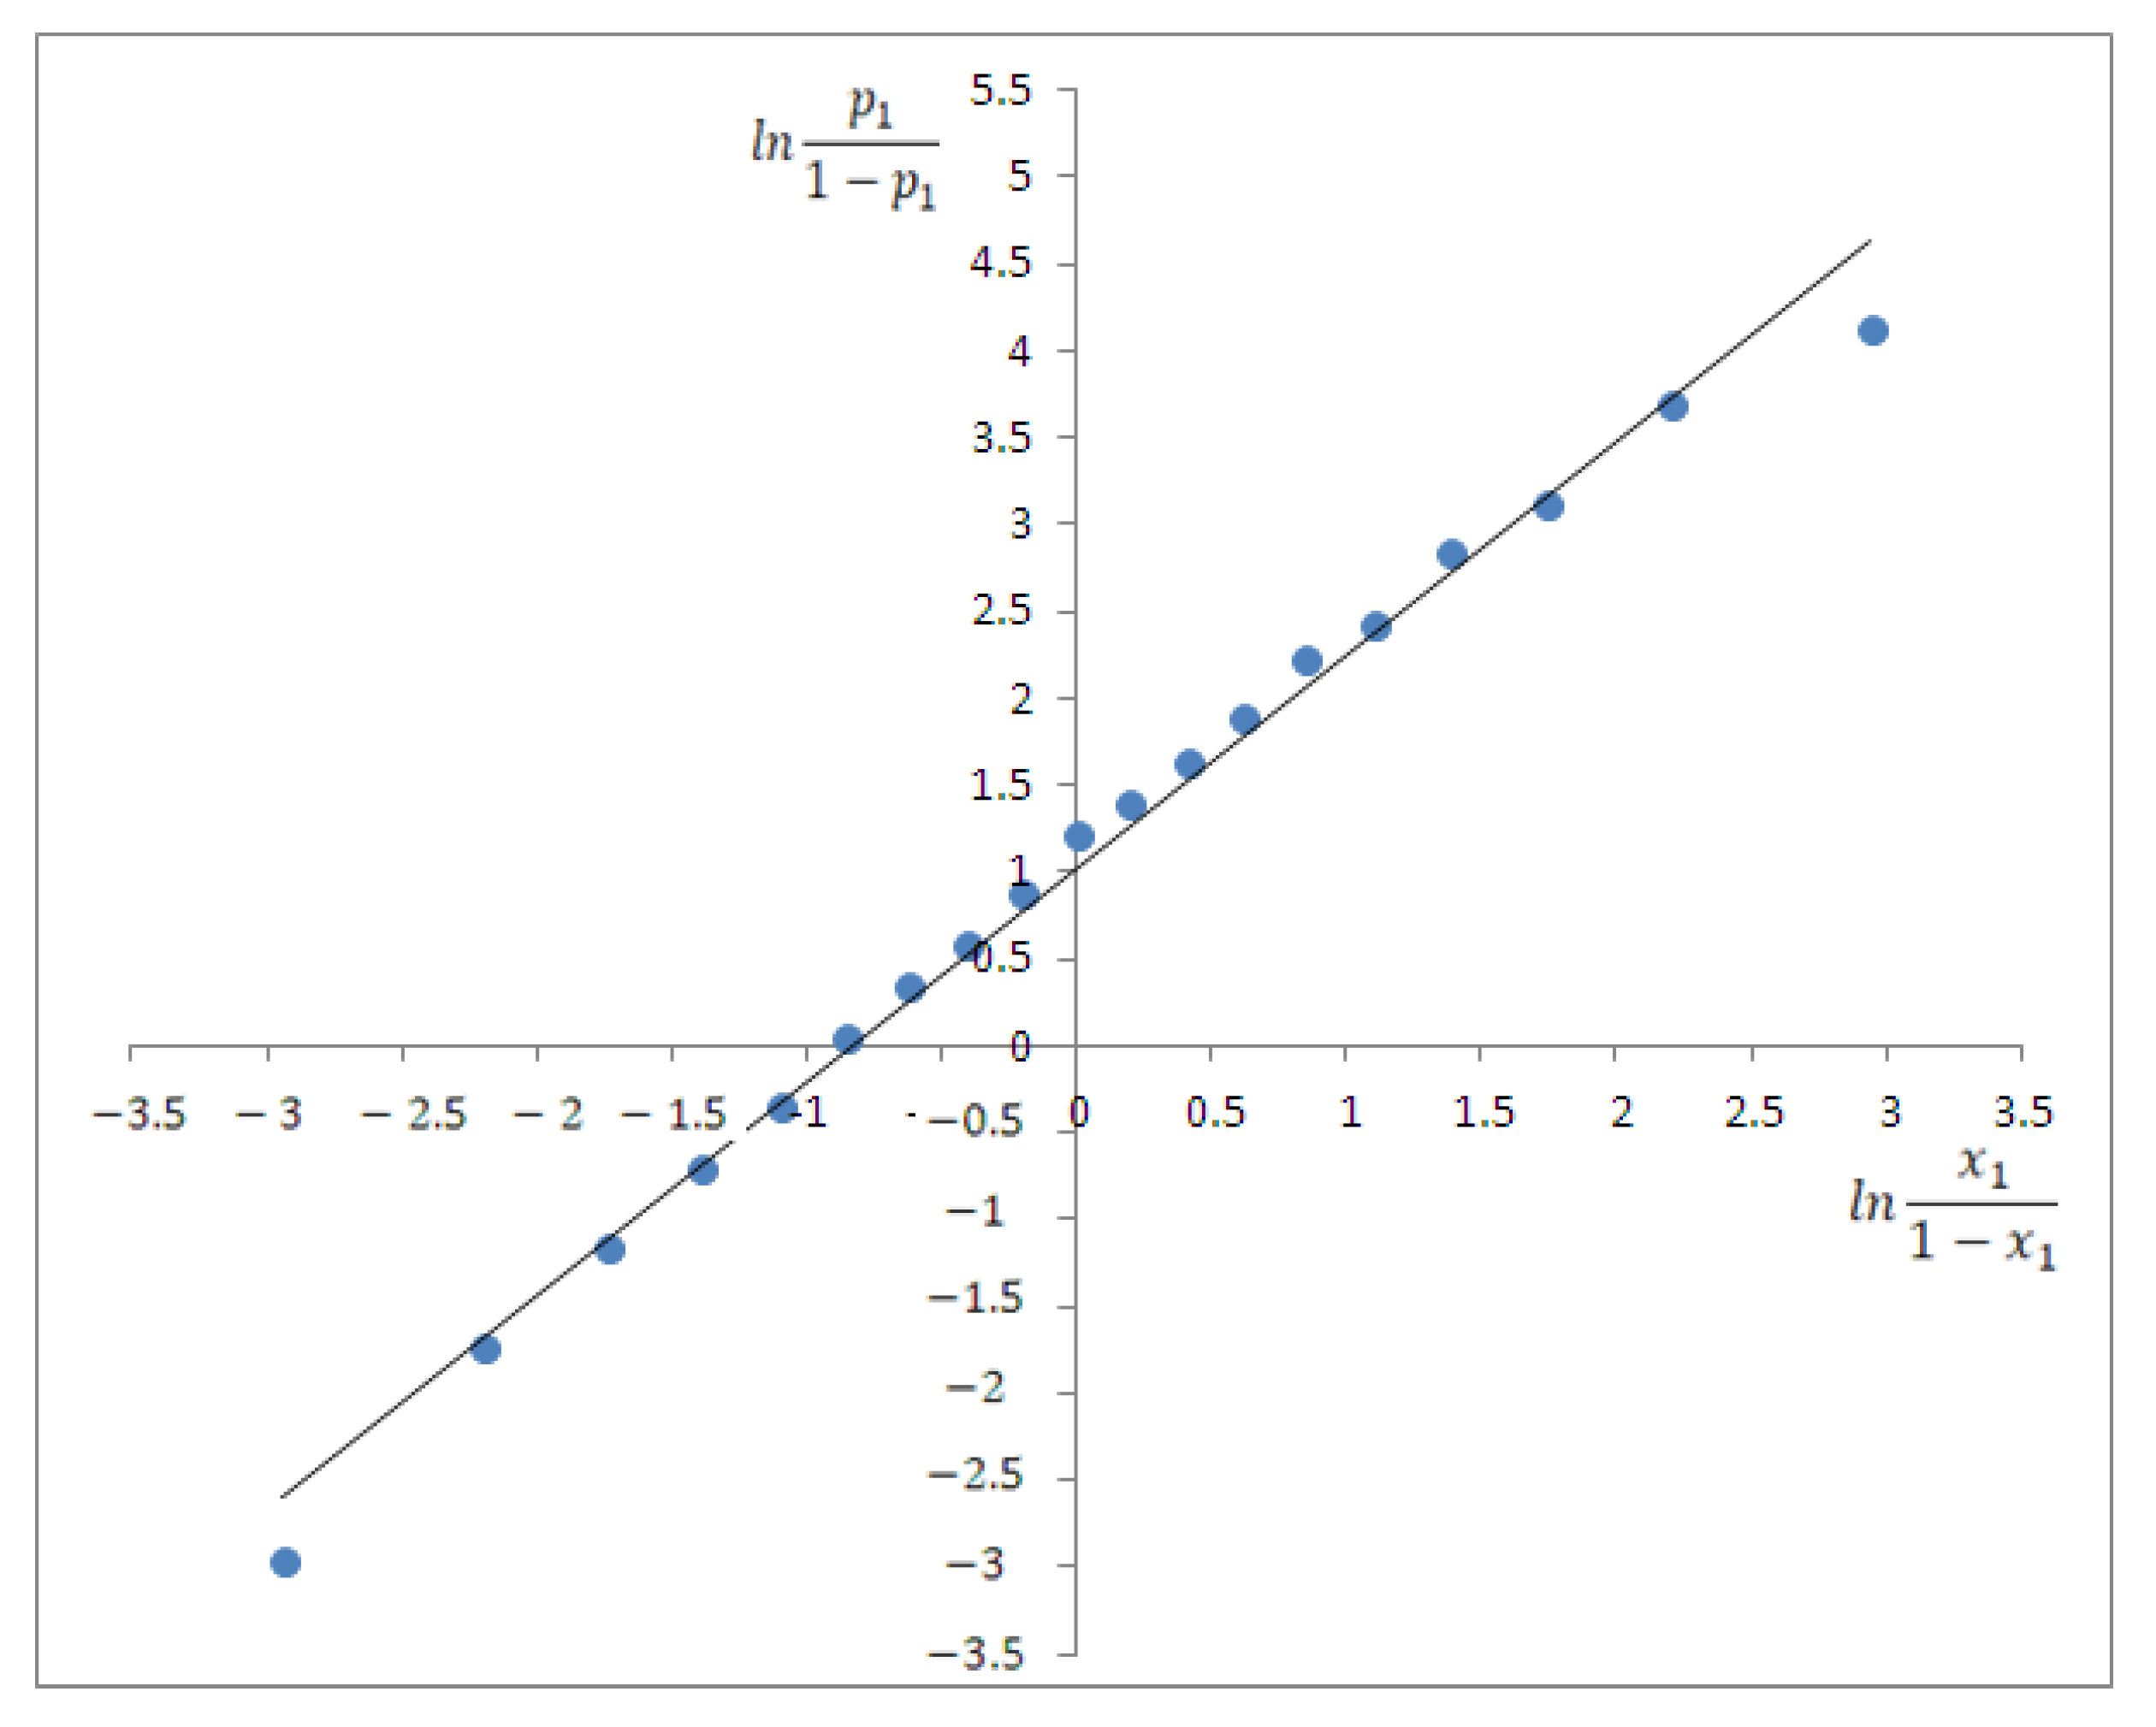
4.3. Spectral Analysis of Ternary Solutions

The ylid molecule PCAnM was also studied from a spectral point of view, in binary mixtures of the types water (1) + ethanol (2) and water (1) + methanol (2) for which the solvent parameters are known [46] (see Table 6 and Table 7). The numbers 1 and 2 denominate the solvents from the binary mixtures in order of the strength of their interactions with PCAnM: the highest wavenumber in the maximum of the visible absorption band of PCAnM is recorded in water and it is denoted by the number (1).
Given the importance of establishing the molar concentrations of the solvent mixtures used in measurements, the spectral data from Table 6 and Table 7 were obtained from the average of three experimental measurements.
The spectral study of the ternary solutions of PCAnM in mixtures of protic solvents allows to obtain information about the solution homogeneity [37,38] and the strength [39,40] of the interactions in molecular pairs of the type ylid–water and ylid–alcohol, based on the statistical cell model of the ternary solutions.
The solvent parameters π*, α, and β [29] of the binary solvents water + ethanol and water + methanol are known from the literature [43], and equations of the type (14) can be established using the data from Table 6 and Table 7 for the ternary solutions water + alcohol + PCAnM in binary mixtures water + ethanol and water + methanol. In the case of ternary solution water + ethanol + PCAnM, this relation is given in (25):
ν (cm−1) = (20,052 ± 834) + (2630 ± 248)π* + (829 ± 227)β + (3767 ± 573)α
The coefficients of the obtained LERS are multiple R = 0.987, R square = 0.974, adj. R square = 0.969, and standard error = 36 cm−1.
Equation (26) expresses the same LERS for the ternary solution water + methanol + PCAnM:
ν (cm−1) = (23,122 ± 346) + (1417 ± 95)π* + (381 ± 112)β + (1562 ± 222)α
The coefficients of the obtained LERS are multiple R = 0.997, R square = 0.995, adj. R square = 0.994, and standard error =11 cm−1.
Based on Equations (25) and (26), one can compute the values of the wavenumber in the maximum of the visible band of PCAnM for each composition of the ternary solution. The computed values using Equations (25) and (26) vs. the experimental values of the wavenumbers in the maximum of the visible band of PCAnM in ternary solutions of the type water + alcohol + ylid are plotted in Figure 6. From this figure it is evinced that the experimental data can be described by the empirical parameters introduced by Kamlet, Abboud, and Taft [29] and determined in [44] for binary solvents of the types water + ethanol and water + methanol. According to Equations (25) and (26), in ternary solutions, both universal interactions (described by the term *) and specific interactions (described by the terms and ) act.
For ternary solutions PCAnM + water (1) + methanol (2) and PCAnM + water (1) + ethanol (2), a linear dependence exists between the quantities l n p 1 1 p 1 and l n x 1 1 x 1 computed with data from Table 6 and Table 7. The dependences l n p 1 1 p 1 vs. l n x 1 1 x 1 established based on the statistical cell model of ternary solutions are given in Figure 7 and Figure 8.
Equation (15), established in the statistical cell model of ternary solutions [37,40], is accomplished for both liquid mixtures, as evidenced by Figure 7 and Figure 8.
By using the data from Table 6 and Table 7, the following equations were established:
l n p 1 1 p 1 = 1.02 ± 0.041 + ( 1.23 ± 0.028 ) l n x 1 1 x 1
with R = 0.996, R-square = 0.991, and adj. R-square = 0.990 for the ternary solution water + ethanol + PCAnM, and
l n p 1 1 p 1 = 0.89 ± 0.018 + ( 1.13 ± 0.062 ) l n x 1 1 x 1
with R = 0.999, R-square = 0.998, and adj. R-square = 0.997 for the ternary solution water + methanol + PCAnM.
The statistical cell model of ternary solutions can be applied to the mixtures water (1) + alcohol (2). The differences between the interaction energies in molecular pairs ylid–water and ylid–alcohol are written in Equations (27) and (28) as cut at the origin, and they are positive as it can be seen in Figure 7 and Figure 8. The difference w2w1 between the interaction energies in molecular pairs of the types water (1) –ylid and primary alcohol (2)–ylid, expressed in Joules are w2w1 = 4.126 × 10⁻²¹ J for the PCAnM + water + ethanol ternary solution and w2w1 = 3.600 × 10⁻²¹ J for the PCAnM + water (1) + methanol (2) solution. These values prove the fact that the specific interactions between the ylid molecules and those of methanol are higher in absolute values compared with the energy of interaction between the molecules of ylid and ethanol.

5. Conclusions

PCAnM is a polar and polarizable molecule with the ability to penetrate the cell membranes. It develops both universal and specific interactions with different solvents.
The solvatochromic study demonstrates the important role of the universal interactions in aprotic solvents and the great contribution of the specific interactions in which the ylid molecule receives protons from protic solvent molecules by weak hydrogen bonds.
If one compares the results obtained by the variational method and by Abe’s method, one can conclude that both methods emphasized a decrease in the molecular dipole moment by excitation, sustaining the attribution of the PCAnM visible band to an ICT process. The McRae’s hypothesis according to which the molecular polarizability of spectrally active molecule is invariable in the photon absorption process is not confirmed by results obtained with Abe’s model. According to Abe’s model, the excited state polarizability of PCAnM depends on the solvent nature, having smaller values in the protic solvents.
The study of the spectral properties of the ternary solutions allows us to affirm that, in the protic solvents (water + primary alcohol) used to achieve ternary solutions, the solute PCAnM molecules participate in hydrogen bonds with the solvent molecules and the strength of these interactions diminishes in the following order: water, methanol, and ethanol.
The statistical cell model of ternary solutions applied to water + primary alcohols ethanol and methanol allows to obtain numerical values for the different energies in molecular pairs PCAnM–ethanol and PCAnM–methanol, values for which other methods are not available.

Author Contributions

Conceptualization, D.O.D. and S.G.; methodology, A.C.M.; software, D.G.D., G.A. and D.O.D.; validation, D.G.D. and D.O.D.; formal analysis, S.G.; investigation, D.O.D. and S.G.; resources, D.O.D.; data curation, S.G and T.G.; writing—original draft preparation, D.O.D.; writing—review and editing, D.O.D.; visualization, D.G.D. and S.G.; supervision, D.O.D. and S.G.; project administration, D.O.D.; funding acquisition, not applicable. All authors have read and agreed to the published version of the manuscript.

Funding

This research received no external funding.

Data Availability Statement

The data presented in this study are available on request from the corresponding author.

Conflicts of Interest

The authors declare no conflict of interest.

References

  1. Johnson, A.W. Ylid Chemistry; Academic Press: New York, NY, USA, 1966. [Google Scholar]
  2. Zugravescu, I.; Petrovanu, M. N-Ylid Chemistry; McGraw Hill: New York, NY, USA, 1976. [Google Scholar]
  3. Dorohoi, D.O. Electronic spectra of N-ylids. J. Mol. Struct. 2004, 704, 31–43. [Google Scholar] [CrossRef]
  4. Kröhnke, F. Specific synthesis of pyridines and oligopyridines. Synthesis 1976, 1976, 1–24. [Google Scholar] [CrossRef]
  5. Seifi, M.; Bahonar, S.; Ebrahimipour, S.Y.; Simpson, J.; Dusek, M.; Eigner, V.; Sheibani, H. Combination of pyridinium and isoquinolinium ylides with phenylisocyanate and isothiocyanates: Synthesis, characterization, and X-ray crystal structures of mesoionic monosubstituted 3-oxo-propanamides or thioamides. Aust. J. Chem. 2015, 68, 1577–1582. [Google Scholar] [CrossRef]
  6. Sar, S.; Guha, S.; Prabakar, T.; Maiti, D.; Sen, S. Blue light-emitting diode-mediated in situ generation of pyridinium and isoquinolinium ylides from aryl diazoesters: Their application in the synthesis of diverse dihydroindilozine. J. Org. Chem. 2021, 86, 11736–11747. [Google Scholar] [CrossRef] [PubMed]
  7. Jacobs, J.; van Hende, E.; Claessens, S.; de Kimpe, N. Pyridinium ylids in heterocyclic synthesis. Curr. Org. Chem. 2011, 15, 1340–1362. [Google Scholar] [CrossRef]
  8. Pawda, A.; Austin, D.J.; Precedo, L.; Zhi, L. Cycloaddition reactions of pyridinium and related azomethine ylides. J. Org. Chem. 1993, 58, 1144–1150. [Google Scholar] [CrossRef]
  9. Allgäuer, D.S.; Mayer, P.; Mayr, H. Nucleophilicity parameters of pyridinium ylides and their use in mechanistic analyses. J. Am. Chem. Soc. 2013, 135, 15216–15224. [Google Scholar] [CrossRef] [PubMed]
  10. Bonte, S.; Ghenea, I.O.; Dinica, R.; Baussanne, I.; Demeunynck, M. Investigation of the pyridinium ylide-alkyne cycloaddition as a fluorogenic coupling reaction. Molecules 2016, 21, 332. [Google Scholar] [CrossRef]
  11. Dorohoi, D.O.; Creanga, D.E.; Dimitriu, D.G.; Morosanu, A.C.; Gritco-Todirascu, A.; Mariciuc, G.G.; Puica Melniciuc, N.; Ardelean, E.; Cheptea, C. Computational and spectral means for characterizing the intermolecular interactions in solutions and for estimating excited state dipole moment of solute. Symmetry 2020, 12, 1299. [Google Scholar] [CrossRef]
  12. Morosanu, A.C.; Gritco-Todirascu, A.; Creanga, D.E.; Dorohoi, D.O. Computational and solvatochromic study of pyridinium-acetyl-benzoyl-methylid (PABM). Spectrochim. Acta Part A Mol. Biomol. Spectrosc. 2018, 189, 307–315. [Google Scholar] [CrossRef]
  13. Albrecht, M.; Yulikov, M.; Kohn, T.; Jeschke, G.; Adams, J.; Schmidt, A. Pyridinium salts and ylides as partial structures of photoresponsive Merrifield resins. J. Mater. Chem. 2010, 20, 3025–3034. [Google Scholar] [CrossRef]
  14. Schwalm, R.; Bottcher, A.; Koch, H. MID UV resist materials containing pyridinium ylides. Proc. SPIE 1988, 0920, 21–26. [Google Scholar] [CrossRef]
  15. Streith, J. The photochemistry of N-iminopyridinium ylides in retrospect. From a simple concept to some applications. CHIMIA 1991, 45, 65–76. [Google Scholar] [CrossRef]
  16. Taylor, L.D.; Haubs, M.K.-J. Polymeric Pyridinium Ylide and Products from Same. European Patent EP0164100A2, 14 April 1993. [Google Scholar]
  17. Babusca, D.; Morosanu, A.C.; Dimitriu, D.G.; Dorohoi, D.O.; Cheptea, C. Spectroscopic and quantum-chemical study of molecular interactions of iso-quinolinium ylids in polar solutions. Mol. Cryst. Liq. Cryst. 2020, 698, 87–97. [Google Scholar] [CrossRef]
  18. Pop, V.; Dorohoi, D.O.; Holban, V. Molecular interactions in binary solutions of 4-aminophthalimide and 3-p-cumyl-pyridazinium-acetyl-benzoyl-methylid. Spectrochim. Acta Part A Mol. Biomol. Spectrosc. 1994, 50, 2281–2289. [Google Scholar] [CrossRef]
  19. Onsager, L. Electric moments of molecules in liquids. J. Am. Chem. Soc. 1936, 58, 1486–1493. [Google Scholar] [CrossRef]
  20. Fleming, I. Frontier Orbitals and Organic Chemical Reactions; John Wiley & Sons Chichester: Hoboken, NJ, USA, 1976. [Google Scholar]
  21. Hitchcock, S.A.; Pennington, L.D. Structure-brain exposure relationships. J. Med. Chem. 2006, 49, 7559–7583. [Google Scholar] [CrossRef] [PubMed]
  22. Young, D. Computational Chemistry: A Practical Guide for Appling Techniques to Real World Problems; John Wiley & Sons: New York, NY, USA, 2001; pp. 322–331. [Google Scholar]
  23. Gosav, S.; Praisler, M.; Dorohoi, D.O.; Popa, G. Structure-activity correlations for illicit amphetamines using ANN and constitutional descriptors. Talanta 2006, 70, 922–928. [Google Scholar] [CrossRef]
  24. Gosav, S.; Praisler, M.; Dorohoi, D.O. ANN expert system screening for illicit amphetamines using molecular descriptors. J. Mol. Struct. 2007, 834–836, 188–194. [Google Scholar] [CrossRef]
  25. McRae, E.G. Theory of solvent effects on molecular electronic spectra. Frequency shifts. J. Phys. Chem. 1957, 61, 562–572. [Google Scholar] [CrossRef]
  26. Abe, T. Theory of solvent effects on molecular electronic spectra. Frequency shifts. Bull. Chem. Soc. Jpn. 1965, 38, 1314–1318. [Google Scholar] [CrossRef]
  27. Reichardt, C. Solvents and Solvent Effects in Organic Chemistry, 3rd ed.; Wiley-VCH: Weinheim, Germany, 2003. [Google Scholar]
  28. Dorohoi, D.O. Physics of Liquid State; Gama: Iasi, Romania, 1993; ISBN 973-95120-8-9. (In Romanian) [Google Scholar]
  29. Kamlet, M.J.; Abboud, J.L.M.; Abraham, M.H.; Taft, R.W. Linear solvation energy relationships. 23. A comprehensive collection of the solvatochromic parameters π*, α, and β, and some methods for simplifying the generalized solvatochromic equation. J. Org. Chem. 1983, 48, 2877–2887. [Google Scholar] [CrossRef]
  30. Sıdır, İ.; Sıdır, Y.G. Investigation of the interactions of E-4-methoxycinnamic acid with solvents: Solvatochromism, electric dipole moment and pH effect. J. Mol. Struct. 2018, 249, 1161–1171. [Google Scholar] [CrossRef]
  31. Dorohoi, D.O.; Dimitriu, D.G.; Dimitriu, M.; Closca, V. Specific interactions in N-ylid solutions, studied by nuclear magnetic resonance and electronic absorption spectroscopy. J. Mol. Struct. 2013, 1044, 79–86. [Google Scholar] [CrossRef]
  32. Kawski, A. On the estimation of excited state dipole moments from solvatochromic shifts of absorption and fluorescence spectra. Z. Naturforsch. A 2002, 57, 255–262. [Google Scholar] [CrossRef]
  33. Kawski, A.; Bojarski, P. Comments on the determination of excited state dipole moment of molecules using the method of solvatochromism. Spectrochim. Acta Part A Mol. Biomol. Spectrosc. 2011, 82, 527–528. [Google Scholar] [CrossRef] [PubMed]
  34. Gahlaut, R.; Tewari, N.; Bridhkoti, J.P.; Joshi, N.K.; Joshi, H.C.; Pant, S. Determination of ground and excited states dipole moments of some naphthols using solvatochromic shift method. J. Mol. Liq. 2011, 163, 141–146. [Google Scholar] [CrossRef]
  35. Zakerhamidi, M.S.; Moghadam, M.; Ghanadzadeh, A.; Hosseini, S. Anisotropic and isotropic solvent effects on the dipole moment and photophysical properties of rhodamine dyes. J. Lumin. 2012, 132, 931–937. [Google Scholar] [CrossRef]
  36. Dorohoi, D.O. Excited state molecular parameters determined by spectral means. Ukr. J. Phys. 2018, 63, 701–708. [Google Scholar] [CrossRef]
  37. Pop, V.; Dorohoi, D.O.; Delibas, M. Considerations on the statistic model of the intermolecular interactions in ternary solutions. An. Stiint. Univ. Al. I. Cuza Iasi 1986, 32, 79–84. [Google Scholar]
  38. Dorohoi, D.O.; Avadanei, M.; Postolache, M. Characterization of the solvation spheres of some dipolar spectrally active molecules in binary solvents. Optoelectron. Adv. Mater. 2008, 2, 51–55. [Google Scholar]
  39. Avadanei, M.; Dorohoi, D.O. Interaction energy in pairs of pyridazinium ylide-solvent molecules estimated by spectral means within the cell ternary solution model. Ukr. J. Phys. 2012, 57, 118–123. [Google Scholar] [CrossRef]
  40. Closca, V.; Puica-Melniciuc, N.; Dorohoi, D.O. Specific interactions in hydroxyl ternary solutions of three carbanion monosubstituted 4-tolyl-1,2,4-triazol-1-ium-4-R-phenacylids studied by visible electronic absorption spectra. J. Mol. Struct. 2014, 200, 431–438. [Google Scholar] [CrossRef]
  41. Pavel, C.M.; Ambrosi, E.; Dimitriu, D.G.; Dorohoi, D.O. Complex formation and micro-heterogeneity in water-alcohol binary mixtures investigated by solvatochromic study. Eur. Phys. J. Spec. Top. 2023, 232, 415–425. [Google Scholar] [CrossRef]
  42. Hehre, W.; Ohlinger, S.; Klunzinger, P.; Deppmeier, B.; Driessen, A.; Johnson, J.; Ohsan, P. Spartan’14 for Windows, Macintosh and Linux. Tutorial and User’s Guide; Wavefunction Inc.: Irvine, CA, USA, 2014. [Google Scholar]
  43. Lin, C.Y.; George, M.W.; Gill, P.M.W. EDF2—A density functional for predicting molecular vibrational frequencies. Aust. J. Chem. 2004, 57, 365–370. [Google Scholar] [CrossRef]
  44. Marenich, A.V.; Olson, R.M.; Kelly, C.P.; Truhlar, G.D.; Ramer, J.C. Self-Consistent Reaction Field model for aqueous and Nonaqueous solutions based on accurate polarized partial charges. J. Chem. Theory Comput. 2007, 3, 2011–2033. [Google Scholar] [CrossRef] [PubMed]
  45. Kamlet-Taft Solvent Parameters. Available online: https://www.stenutz.eu/chem/kamlettaft.php (accessed on 3 October 2023).
  46. Buhvestov, U.; Rived, F.; Ràfols, C.; Bosch, E.; Rosés, M. Solute-solvent and solvent-solvent interactions in binary solvent mixtures. Part 7. Comparison of the enhancement of the water structure in alcohol-water mixtures measured by solvatochromic indicators. J. Phys. Org. Chem. 1998, 11, 185–192. [Google Scholar] [CrossRef]
Scheme 1. Structural formula of PCAnM.
Symmetry 15 02075 sch001
Figure 1. Spatial distribution of atoms in the optimized structure of PCAnM (carbon—black, nitrogen—blue, oxygen—red, hydrogen—white). The arrow indicates the orientation of the ground state dipole moment.
Symmetry 15 02075 g001
Figure 2. HOMO and LUMO for isolated PCAnM molecule.
Symmetry 15 02075 g002
Figure 3. ν c a l c (using Equation (18)) vs. ν e x p for binary solutions.
Symmetry 15 02075 g003
Figure 4. ν c a l c (using Equation (19)) vs. ν e x p for binary solutions.
Symmetry 15 02075 g004
Figure 5. Dependence of Abe’s parameters B vs. A for aprotic solvents (blue points) and protic solvents (red points), respectively, computed for the PCAnM molecule.
Symmetry 15 02075 g005
Figure 6. νcalc (cm−1) (using Equations (25) and (26)) vs. νexp (cm−1) for binary solvents water + ethanol and water + methanol.
Symmetry 15 02075 g006
Figure 7. l n p 1 1 p 1 vs. l n x 1 1 x 1 for PCAnM in binary mixture water + ethanol.
Symmetry 15 02075 g007
Figure 8. l n p 1 1 p 1 vs. l n x 1 1 x 1 for PCAnM in binary mixture water + methanol.
Symmetry 15 02075 g008
Table 1. Quantum mechanical characterization of the isolated PCAnM molecule (C16H16N2O2) by Spartan’14, density functional model EDF2, 6-31G*.
Molecular DescriptorVacuumWaterEthanolToluene
Energy (au)−878.644−878.668−878.676−878.668
EHOMO (eV)−5.12−5.27−5.19−5.02
ELUMO (eV)−1.98−1.80−1.77−1.79
E (eV)3.143.473.423.23
Dipole moment (D)3.435.615.634.67
Polarizability (Å3)63.7163.7163.7163.71
Area (Å2)299.43303.68303.14300.51
Volume (Å3)284.53285.50285.34284.82
PSA (Å2)30.00532.00231.67830.686
HBD Count1111
HBA Count4444
Table 2. Solvent parameters and the wavenumbers in the maximum of the ICT visible band of PCAnM.
No.Solventf(n)f(ε)π*αβν (cm−1)
1Dioxane0.3000.2860.550.000.3723,300
2Benzene0.2950.2990.590.000.1022,995
3o-Xylene0.2920.3020.410.000.1122,995
4Toluene0.2970.3020.540.000.1123,120
5Trichloroethylene0.2820.4480.530.000.5022,910
6Chloroform0.2670.5520.690.200.1023,680
7Anisole0.3000.5240.730.000.3223,340
8Cyclohexanol0.2760.8240.450.660.8425,060
9Chlorobenzene0.3070.6050.710.000.0723,370
10Dichloromethane0.2560.7270.820.200.1023,560
11n-Butyl alcohol0.2420.8330.470.840.8425,370
12Benzyl alcohol0.3110.8040.980.600.5225,270
13n-Propyl alcohol0.2400.8660.520.840.9025,390
14Ethanol0.2210.8950.860.860.7525,370
15Methanol0.2030.9090.600.980.6625,530
16Iso-Butyl alcohol0.2400.8520.400.690.8425,240
17Iso-Amyl acetate0.2410.5890.710.000.0723,510
18Ethyl acetate0.2280.6250.550.000.4523,730
19n-Butyl acetate0.2400.5770.460.000.4523,370
20Water0.2060.9641.091.170.4726,410
21Acetone0.2220.8680.620.080.4823,950
22Formamide0.2670.9730.970.970.7125,190
Table 3. Contribution of each type of interactions to the total spectral shift in PCAnM diluted solutions, computed with respect to Equations (18) and (19) and using data from Table 2.
No.SolventComputed from Equation (18)Computed from Equation (19)
C1f(ε)
(cm−1)
C1f(ε)
(%)
C4α
(cm−1)
C4α
(%)
*
(cm−1)
*
(%)

(cm−1)

(%)

(cm−1)

(%)
1Dioxane36010000404721552800
2Benzene3761000043383911700
3o-Xylene38010000301751002500
4Toluene3801000011254215415800
5Trichloroethylene5631000012584615055400
6Chloroform69466358345065291938039
7Anisole65910000536652923500
8Cyclohexanol1034471183533301276629159459
9Chlorobenzene76010000521801332000
10Dichloromethane91472358286025691938035
11n-Butyl alcohol1258461505543451376628159459
12Benzyl alcohol1256541075467193147420113949
13n-Propyl alcohol1089421505583821482129159457
14Ethanol1125421541586312268423163255
15Methanol1143391756614401560921186064
16Iso-Butyl alcohol1071461236542941276633131055
17Iso-Amyl acetate7401000052189641100
18Ethyl acetate78610000404504105000
19n-Butyl acetate72510000338454105500
20Water1212372097638002342913222164
21Acetone10918814312455444384115215
22Formamide1223411738597122264820184158
Table 4. Solvent parameters (used in Abe’s model) and the wavenumbers in the maximum of ICT visible band of PCAnM.
No.Solventμg (D)αg3)Ig (eV)M (g/mol)ρ (g/cm3)ν (cm−1)
1Dioxane09.449.5288.111.41723,300
2Benzene010.449.2578.110.86822,995
3o-Xylene0.6414.258.56106.170.88022,995
4Toluene0.3812.48.7292.140.86723,120
5Trichloroethylene0.809.759.45131.41.46022,910
6Chloroform1.158.2311.50119.381.44623,680
7Anisole1.3813.108.20108.140.99523,340
8Cyclohexanol1.4611.9410.0100.160.96225,060
9Chlorobenzene1.5013.09.07112.561.11023,370
10Dichloromethane1.606.6611.3284.931.33023,560
11n-Butyl alcohol1.668.889.9974.120.81025,370
12Benzyl alcohol1.6711.898.26108.141.04425,270
13n-Propyl alcohol1.686.6710.5260.09 0.80325,390
14Ethanol1.695.0610.7046.070.78925,370
15Methanol1.703.2110.8532.040.79225,527
16Iso-Butyl alcohol1.769.0710.1274.120.80225,240
17Iso-Amyl acetate1.7715.189.90130.180.88423,510
18Ethyl acetate1.789.7010.1188.110.90223,730
19n-Butyl acetate1.8413.4210.00116.160.88323,370
20Water1.851.512.59181.00026,413
21Acetone2.806.279.8958.080.97123,950
22Formamide3.734.0810.2045.041.13325,190
Table 5. Excited state dipole moment and polarizability of PCAnM for various angles φ.
φ (Degree)μe (D)αe3)
04.06963.78
84.109863.74
104.132963.73
10.54.139663.71
114.146663.70
154.213463.63
204.333463.50
304.706862.52
405.335462.31
506.390460.77
Table 6. Molar composition, x1, and π*, α, β binary solvent water (1) + ethanol (2) Kamlet–Abboud–Taft parameters; wavenumbers, ν (cm−1), in the maximum of the visible electronic absorption band of PCAnM; statistical average weight p1 of water molecules in the first solvation shell of PCAnM.
No. x 1 l n x 1 1 x 1 π * αβ p 1 l n p 1 1 p 1 ν (cm−1)
10.000-0.510.830.980.000-25,370
20.050−2.940.540.830.970.049−2.9725,400
30.100−2.200.570.840.960.148−1.7525,460
40.150−1.740.600.830.940.238−1.1625,515
50.200−1.390.630.830.930.329−0.7225,570
60.250−1.100.650.830.930.410−0.3625,620
70.300−0.850.680.820.920.5110.0525,682
80.350−0.620.700.810.910.5840.3425,726
90.400−0.410.730.800.910.6390.5725,760
100.450−0.200.750.790.890.7050.8725,800
110.5000.000.770.790.900.7701.2125,840
120.5500.200.800.780.890.7991.3825,857
130.6000.410.820.770.890.8361.6325,880
140.6500.620.850.770.890.8691.8925,900
150.7000.850.900.740.880.9012.2125,920
160.7501.100.940.710.860.9182.4225,930
170.8001.391.000.670.870.9442.8325,946
180.8501.741.060.640.900.9573.1125,954
190.9002.201.110.590.970.9753.6825,965
200.9502.941.130.541.110.9844.1225,970
211.000-1.130.501.261.000-25,980
Table 7. Molar composition, x1, and π*, α, β binary solvent water (1) + methanol (2) Kamlet–Abboud–Taft parameters; wavenumbers, ν (cm−1), in the maximum of the visible electronic absorption band of PCAnM; statistical average weight p1 of water molecules in the first solvation shell of PCAnM.
No. x 1 l n x 1 1 x 1 π * αβ p 1 l n p 1 1 p 1 ν (cm−1)
10.000-0.580.741.140.000-25,530
20.050−2.940.610.741.130.067−2.6325,560
30.100−2.200.640.741.120.173−1.5625,608
40.150−1.740.660.741.100.267−1.0125,650
50.200−1.390.700.741.090.344−0.6425,685
60.250−1.100.730.741.070.422−0.3125,720
70.300−0.850.760.741.060.489−0.0425,750
80.350−0.620.780.721.040.5560.2225,780
90.400−0.410.820.721.040.6220.5025,810
100.450−0.200.850.711.020.6400.5825,818
110.5000.000.880.701.030.7200.9425,854
120.5500.200.910.681.020.7601.1525,872
130.6000.410.950.661.010.8001.3925,890
140.6500.620.980.651.010.8361.6325,906
150.7000.851.010.631.010.8621.8325,918
160.7501.101.040.611.020.8892.0825,930
170.8001.391.060.591.060.9162.4025,942
180.8501.741.090.561.090.9382.7125,952
190.9002.201.110.541.090.9673.3725,965
200.9502.941.120.521.190.9864.3025,974
211.000-1.140.491.231.000-25,980
Disclaimer/Publisher’s Note: The statements, opinions and data contained in all publications are solely those of the individual author(s) and contributor(s) and not of MDPI and/or the editor(s). MDPI and/or the editor(s) disclaim responsibility for any injury to people or property resulting from any ideas, methods, instructions or products referred to in the content.

