Article

A Novel Technique of Extracting UCN Decay Lifetime from Storage Chamber Measurements Dominated by Scattering Losses

by
Prajwal Mohanmurthy
1,2,*,
Joseph Formaggio
2,
Daniel J. Salvat
3 and
Jeff A. Winger
4,*
1
Department of Physics, University of Chicago, Chicago, IL 60637, USA
2
Laboratory for Nuclear Science, Massachusetts Institute of Technology, Cambridge, MA 02139, USA
3
Center for Exploration of Energy and Matter, Department of Physics, Indiana University, Bloomington, IN 47408, USA
4
Department of Physics and Astronomy, Mississippi State University, Mississippi State, MS 39762, USA
*
Authors to whom correspondence should be addressed.
Symmetry 2023, 15(10), 1899; https://doi.org/10.3390/sym15101899
Submission received: 25 February 2023 / Revised: 21 June 2023 / Accepted: 11 August 2023 / Published: 10 October 2023
(This article belongs to the Special Issue Neutron Simulation and Neutron Scattering)

Abstract

:
The neutron’s lifetime is a critical parameter in the standard model. Its measurements, particularly measurements using both beamline and ultracold neutron storage techniques, have revealed significant tension. In this work, we review the status of the tension between various measurements, especially in light of the insights provided by the β -decay correlation measurements. We revisit the lifetime measurement in a material storage chamber, dominated by losses from scattering off the walls of the storage chamber. The neutron energy spectra and associated uncertainties were, for the first time, well-characterized using storage data alone. Such models have applications in the extraction of the mean time between wall bounces, which is a key parameter for neutron storage disappearance experiments in search of neutron oscillation. A comparison between the loss model and the number of neutrons stored in a single chamber allowed us to extract a neutron lifetime of τ n * = 880 ( + 158 / 78 ) stat . ( + 230 / 114 ) sys . s   ( 68.3 %   C . I . ) . Though the uncertainty of this lifetime is not competitive with currently available measurements, the highlight of this work is that we precisely identified the systematic sources of uncertainty that contribute to the neutron lifetime measurements in material storage bottles, namely from the uncertainty in the energy spectra, as well as from the storage chamber surface parameters of the Fermi potential and loss per bounce. In doing so, we highlight the underestimation of the uncertainties in the previous Monte Carlo simulations of experiments using the technique of ultracold neutron storage in material bottles.
PACS:
14.20.Dh; 21.65.+f; 21.10.Tg; 25.40.Dn

1. Introduction

Neutrons and protons constitute most of the mass in ordinary matter. Of the nucleons, neutrons dominate the mass of terrestrial matter due to an energetically preferred ratio of n / p 1 for heavy nuclei because of the electrical charge of the proton [1]. While the neutron is stable inside the nucleus, free neutrons decay into protons, electrons, and anti-electron neutrinos via the charged current mediated β -decay.
Fermi’s four-vector β -decay interaction involving the neutron, proton, electron, and anti-neutrino [2] was generalized to involve scalar (S), pseudoscalar (P), tensor (T), axial (A), and vector (V) terms [3,4]. In the modern context of electroweak theory [5,6,7], the Hamiltonian of the neutron decay can be written as a V-A interaction [8,9] by
H = G V p ¯ γ μ n G A p ¯ γ 5 γ μ n e ¯ γ μ 1 + γ 5 ν ,
where p ¯ , n, e ¯ , ν are the four spinors of the states involved in the neutron decay, G V = G F V u d , G A = G F V u d λ , G F = 1.1663787 ( 6 ) × 10 5 GeV 2 [10] is the Fermi coupling constant, V u d is the first element of the Cabibbo–Kobayashi–Maskawa (CKM) matrix that describes quark mixing [11,12], and λ = G A / G V . One could, in principle, add the pseudoscalar, scalar, and tensor interactions into Equation (1), but to date, there has been no evidence for such interactions. Strong constraints upon scalar and tensor interactions have been placed by studying the β -decay correlations [13,14].
Neutron lifetime measurements are dominated by experiments using the beamline and the ultracold neutron storage techniques. When ultracold neutrons are stored in material bottles, they can be lost to various processes, such as β -decay and up-scattering on material walls. In the past, neutron lifetime experiments using a disappearance measurement in material storage bottles isolated the wall scattering losses by comparing the storage in at least two different storage bottles, with varying volume-to-surface area ratios, or by characterizing the neutrons lost directly with the help of thermal neutron detectors placed outside the main storage chamber. This technique has been superseded by measurements performed with magneto-gravitational traps, which avoid the wall scattering losses altogether. In this work, for a storage measurement, we constructed a numerical loss model that included all the above channels of neutron losses. The input of a center of mass offset for the stored ultracold neutron, from the neutron electric dipole moment search, allowed us to further narrow the accepted parameter space. In this work, we reviewed the status of tension in neutron lifetime measurements. We further extracted, using an independent analysis, a neutron lifetime via storage data alone, while identifying contributions from various systematic effects in such a measurement. This was possible with the unprecedented control over systematic effects recently achieved. The goal of this work was aimed at understanding the various systematic effects in order to shed light on prior measurements, not to obtain a new leading neutron lifetime measurement.

1.1. Previous Measurements of the Neutron Lifetime

Neutron decay was first measured using reactor neutrons by ref. [15] and confirmed by ref. [16,17], using a coincidence measurement of the decay products. Thus far, the most dominant techniques for the neutron lifetime measurements have been (i) in a beamline, where the neutron flux is monitored, and the decay products of electrons, protons, or both are counted [18]; in the storage of ultracold neutrons (UCN) in (ii) material bottles, as in refs. [19,20,21,22], or (iii) magnetic bottles, as in refs. [23,24]. Neutron lifetime measurements were also made using cloud chambers, where both the decay electrons and protons were tracked [25]; time projection chambers, which could simultaneously measure the neutron flux as well as count the decay electrons and protons [26]; and using the neutron spectrometer aboard the Messenger spacecraft [27]. A detailed overview of the measurements may be found in refs. [28,29]. This work is relevant for measurements that used material storage bottles.
The first dedicated beamline measurements of the neutron lifetime were carried out by the Risö and Kurchatov group [30,31,32], where the latter two upgrades extracted the decay protons with an electric field before counting them. Similarly, β -decay spectroscopy measurements, where the decay electrons were counted, also led to measurements of the neutron lifetime [33]. The first neutron lifetime crisis emerged when the penning trap measurements at the Institut Laue-Langevin (ILL) [34,35] disagreed with the measurements in ref. [33]. However, the first crisis was resolved after several measurements corrected or updated the neutron lifetime [36,37], which ultimately confirmed the lower value at around 890 s. The PERKEO collaboration, known for their measurements of the β asymmetry in neutron decay, also published a value of the neutron lifetime in ref. [38]. The most recent measurements using the beamline technique came from efforts at the National Institute of Standards and Technology (NIST) [18,39,40], which used a quasi-penning trap and benefited from the very large cold neutron flux at NIST, culminating in the measurement of the lifetime precise to 2.2 s.
The first neutron lifetime measurements using UCNs were made at the SM-2 reactor using an aluminum storage bottle at room temperature [41], and the subsequent upgraded measurements spanned nearly a decade [42,43]. The neutron-counting systematic in these measurements is dominated by the up-scattering of UCN on the walls of the storage bottle; therefore, many efforts have employed various techniques to better characterize the scattering losses. The Mambo collaboration at ILL performed many neutron lifetime measurements using a bottle with variable geometry in order to characterize the UCN scattering losses [19,44,45,46]. The group at Petersburg Nuclear Physics Institute (PNPI) used a gravitrap, where neutrons were vertically trapped in a gravitational potential well to measure the lifetime by extrapolating the UCN velocity to zero [20,47,48,49]. The measurements by the ILL-Kurchatov group characterized the UCN scattering losses by placing a thermal neutron detector outside their trap [21,50,51,52], while an ILL-PNPI effort used two nested storage chambers of differing geometry [22,53], and ultimately brought down the uncertainty associated with the lifetime to 0.8 s.
The last category of measurements uses the technique of UCN storage in magnetic bottles, such that the wall scattering loss channels are avoided. The first measurement was performed using the NESTOR magnetic storage ring at ILL [54], and the subsequent upgrades [55,56,57] made the precision of these measurements competitive with the (then) best measurements using the previous two techniques. An independent effort by the ILL-PNPI group used a cylindrical storage vessel with permanent magnets trapping the UCNs in the transverse direction and solenoid magnetic along with gravity trapping them in the vertical (longitudinal) direction [23,58]. A notable effort using an Ioffe solenoid trap in which the UCNs were stored in superfluid 4 He has also reported lifetime measurements [59,60,61]. The most recent effort in this category uses a Halbach magnetic array to trap the neutrons in the transverse direction, and vertically, on the bottom, while trapping them on the top, by gravity [24,62,63], achieving an impressive precision of 0.36 s.
In this section, we also highlight the tension between various neutron lifetime measurements, particularly between the beamline and UCN storage techniques. We also shed additional light on the issue with the help of the experimentally measured values of λ and V u d .

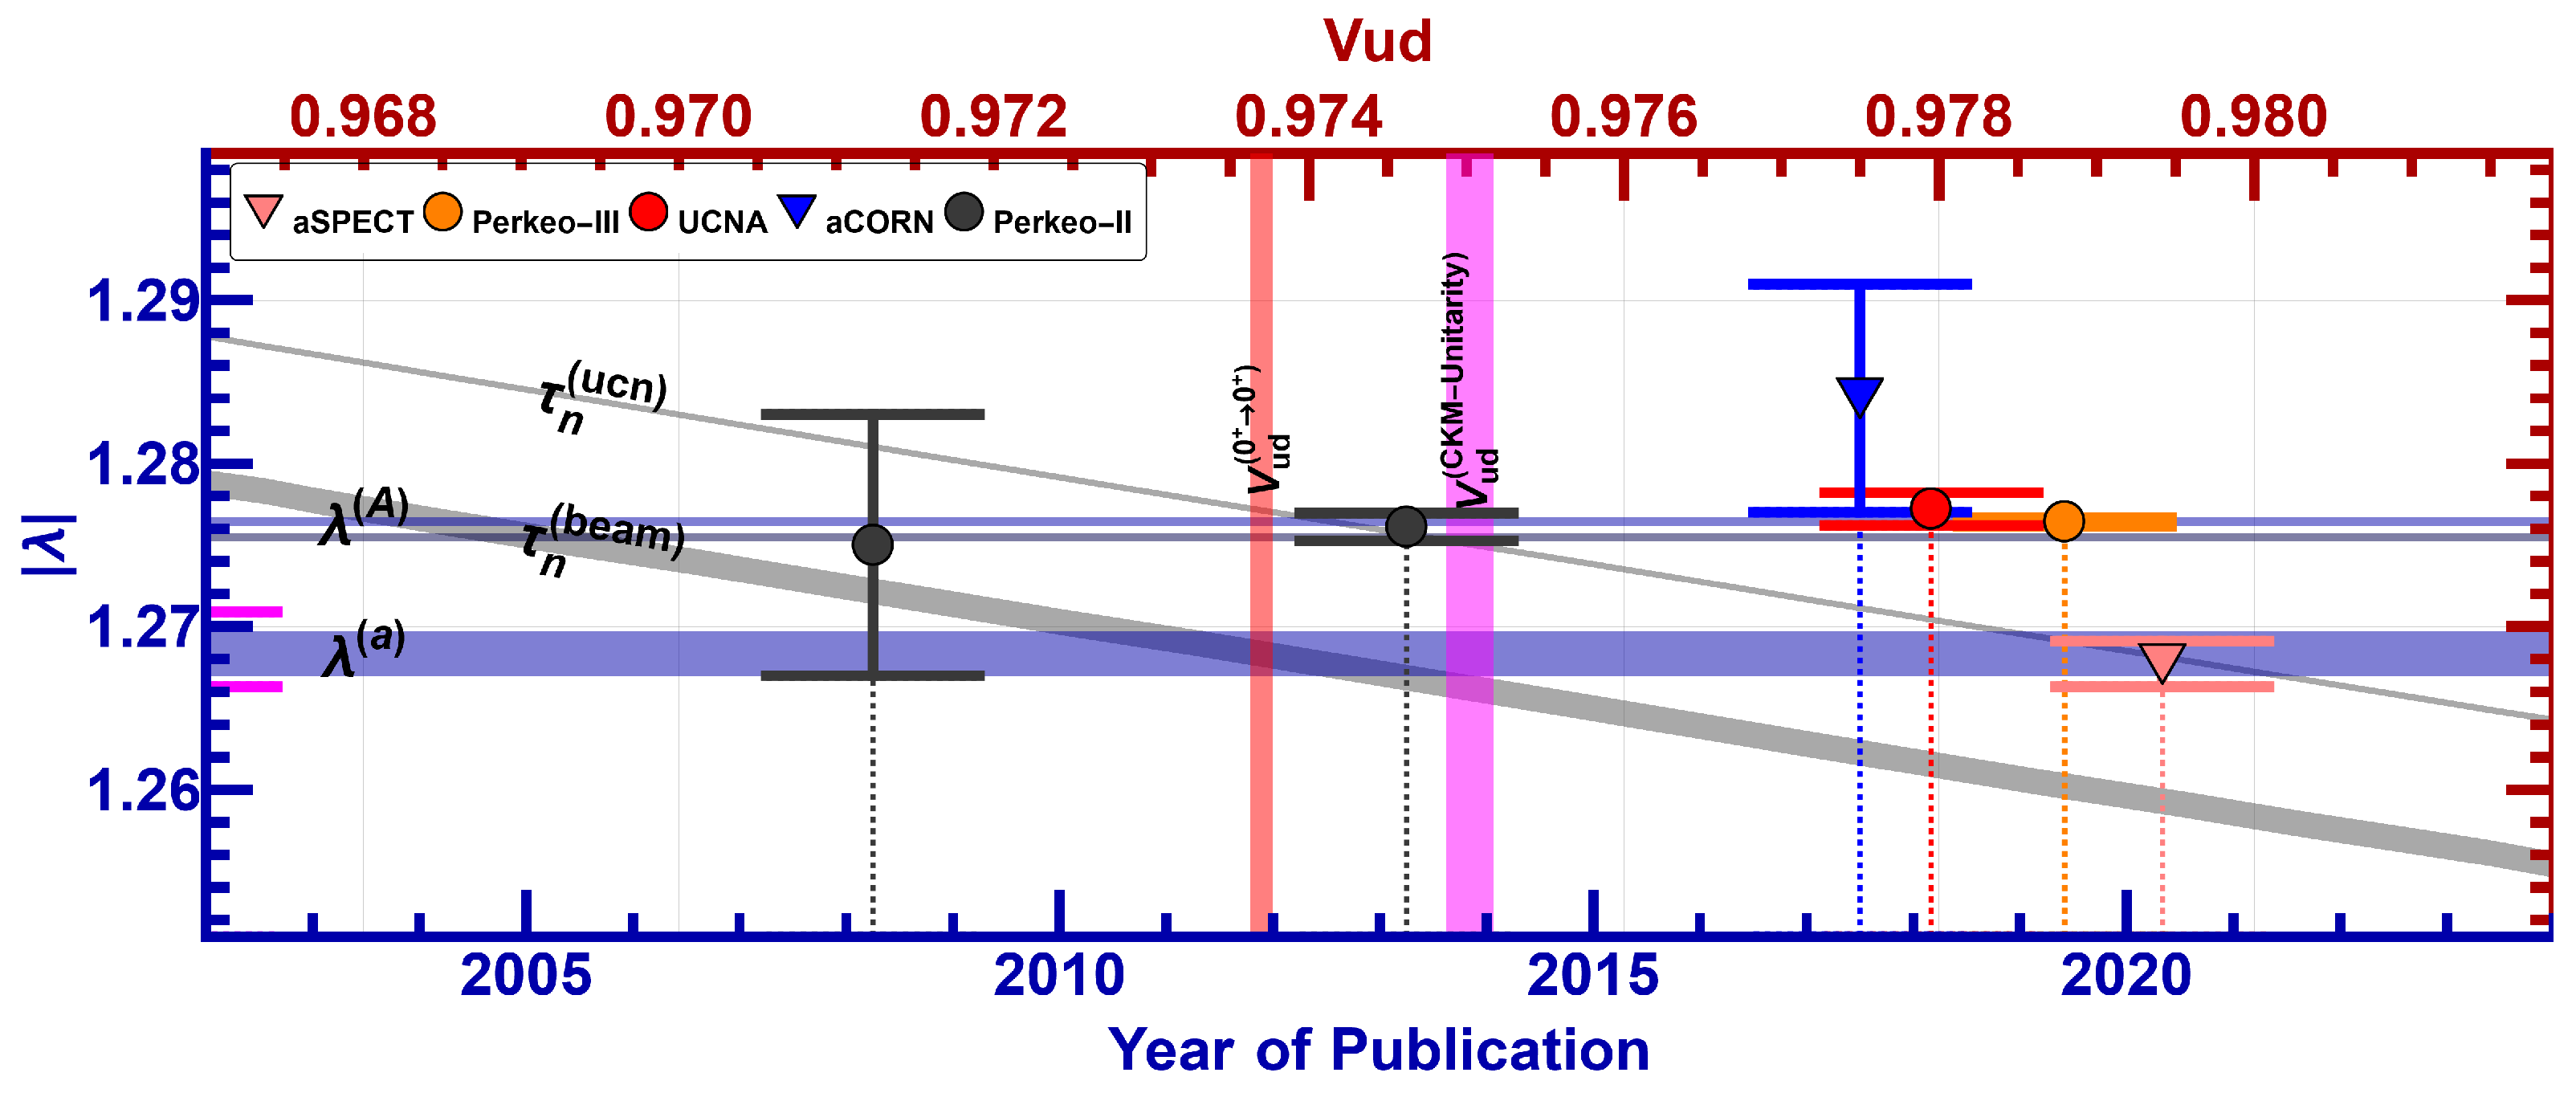
1.2. Tension between Beam-Line and UCN Lifetime Measurements

The outstanding neutron lifetime crisis emerged with one of the most precise measurements of the neutron lifetime, i.e., τ n = ( 878.50 ± 0.76 ) s in 2004 [53]. This value conflicted with the then global average lifetime of τ n = ( 885.7 ± 0.8 ) s [64]. By then, ref. [51] had already reported the first measurement with a lifetime precise of under 1 s; however, the measurement was subsequently adjusted by ref. [52] to a precision of 2.1 s due to corrections in the thermal neutron detector efficiency. Measurements by ref. [53] have since been confirmed by a series of experiments, as in refs. [23,24] and refs. [19,21,46] within 2 standard deviations. However, the latest experiment using UCNs and a new large gravitrap [20] by the same group only agree with their measurements in 2004, within 3 standard deviations.
The measurements of the neutron lifetime in refs. [19,20,21,22,46] are the most up-to-date iterations of the measurements using their respective apparatus and subsequent upgrades, where the technique employed was the UCN storage in material bottles. Similarly, measurements in refs. [23,24] were made using the UCN storage technique in magnetic bottles. The weighted average of these seven measurements [19,20,21,22,23,24,46] that used UCNs is
τ n ( UCN ) = ( 878.56 ± 0.29 ) s , χ 2 / n d f = 2.78 .
Considering these seven measurements, only the measurement in ref. [20] deviates from the average in Equation (2) by more than 3 standard deviations. Measurements in refs. [18,26,37], which used the technique of counting the neutron decay products in a beamline, all agree within one standard deviation. Their [18,26,37] weighted average is
τ n ( beam ) = ( 888.1 ± 2.0 ) s , χ 2 / n d f = 0.12 .
Since the uncertainty associated with the beamline measurements is over six times larger than that associated with the UCN measurements, and the UCN measurements are more recent, usually, the weighted average from the UCN measurements is preferred. (Certain measurements whose uncertainties are so large that they change the respective weighted averages by less than 1 % , e.g., measurements such as in ref. [26], have been left out of the averages, despite being the most up-to-date measurements from the particular apparatus).
The neutron lifetime averages from the UCN storage and beamline measurements, in Equations (2) and (3), respectively, disagree by about 4.5 standard deviations, and are, thus, incompatible. Without a way to reconcile the tension between the two families of measurements, the neutron’s lifetime crisis, which emerged with the measurement of ref. [53], remains to this day. A meta-analysis of this disagreement can be found in ref. [65]. Various explanations have been proposed to reconcile the two measurement families, including dark matter [66]; neutron–mirror-neutron oscillations [67]; and other exotic neutron decay channels [68,69]. However, it has also been pointed out by refs. [70,71] that exotic decay channels cannot be the reason for this disagreement.

1.3. Inputs into the Neutron Lifetime from Measurements of β -Decay Correlations

The Beta decay of free neutrons provides a way to precisely probe the weak interaction between the standard model, particularly the ratio between the axial-to-vector weak-coupling constant, λ , and the CKM matrix element, V u d . Such studies are conducted by measuring the various correlation coefficients between 4-momenta for the decay products of protons, electrons, and neutrinos. The rate of β -decay is linked to these correlation coefficients, as [72]
d w d E e 2 π ħ G F 2 V u d 2 ρ ( E e ) · 1 + 3 | λ | 2 · 1 + a p e · p ν E e E ν + σ n · A p e E e + B p ν E ν + C p p E p + N σ e ,
where w is the β -decay rate, ρ ( E e ) is the energy distribution of the electron, σ n is the polarization state of the initial neutron, σ e is the electron polarization state, A = 2 ( | λ | 2 + R e ( λ ) ) / ( 1 + 3 | λ | 2 ) is the β -electron asymmetry, a = ( 1 | λ | 2 ) / ( 1 + 3 | λ | 2 ) is the neutrino–electron correlation, B = 2 ( | λ | 2 | λ | ) / ( 1 + 3 | λ | 2 ) is the neutrino asymmetry, C = 0.27484 × ( 4 | λ | ) / ( 1 + 3 | λ | 2 ) is the proton asymmetry, and N = A γ and γ are the Lorentz boosts. Additional beyond the standard model contributions [13], such as T-odd terms or contributions from new scalar or tensor couplings, can be incorporated into Equation (4) [73,74,75]. Such terms are beyond the scope of this work. Recent progress in measuring the β -decay correlation coefficients is summarized in ref. [76].
Taking into account the radiative corrections to the neutron β -decay links the neutron lifetime, τ n , to the values of V u d , and the relative strength of the axial-to-vector coupling constant, λ , [69,77] through
τ n = 4908.7 ± 1.9 s | V u d | 2 1 + 3 | λ | 2 .
The neutron lifetime, therefore, offers direct input into the fundamental parameters of the standard model, like V u d and λ . The most precise measurements of λ come from the measurements of the parameters of A and a. Therefore, we can use the value of λ obtained from the measurement of the β -decay correlation coefficients along with independent measurements of V u d to shed some additional light on the issue of the disagreeing neutron lifetime measurements.
A weighted average of the most up-to-date measurements of λ is [64]
λ = ( 1.27550 ± 0.00049 ) , χ 2 / n d f = 4.28 .
However, measurements from before 2002 had larger than 10% systematic corrections [78]. Neglecting the measurements from before 2002, and ref. [79], which obtains λ through the correlation coefficient C, the weighted averages of λ from the three experiments [78,80,81] that measure A, and from the two experiments [82,83] that measure a are
λ ( A ) = ( 1.27643 ± 0.00051 ) , χ 2 / n d f = 0.06 ,
λ ( a ) = ( 1.2683 ± 0.0027 ) , χ 2 / n d f = 0.62 .
These averages for λ differ by 3 standard deviations and are, thus, incompatible. Since the average of λ obtained from experiments measuring A is over 5 times more precise than that from experiments measuring a, the global weighted average in Equation (6) is heavily weighted by the former measurements. The weighted averages in Equations (7) and (8), the five measurements used to calculate them, along with Equation (5) for the two values of the neutron lifetime in Equations (2) and (3), are presented in Figure 1.
Figure 1 also displays the values of V u d obtained from two independent methods, via 0 + 0 + super-allowed decays [64,84] and CKM unitarity ( V u d 2 + V u s 2 + V u b 2 = 1 ) by using the PDG-recommended values of V u s = 0.2221 ± 0.0013 [64] (the average of both inclusive and exclusive strangeness changing τ decays) and V u b = ( 3.82 ± 0.24 ) × 10 3 [64] (the average of both inclusive and exclusive B ¯ decays). These values are
V u d ( 0 + 0 + ) = ( 0.97370 ± 0.00014 ) , and
V u d ( CKM unitarity ) = 1 V u s 2 V u b 2 = ( 0.97502 ± 0.00030 ) .
These values of V u d also differ by over 4 standard deviations ( 4.4 σ ), and are, thus, incompatible. The evolving status of CKM unitarity can be found in refs. [85,86,87].
Looking at Figure 1, a case can be made for either of the two neutron lifetimes. The UCN neutron lifetime, taken with the value of V u d obtained from 0 + 0 + super-allowed decays, and the value of λ from experiments measuring A, is consistent in the 95 % confidence region. On the other hand, the beam neutron lifetime taken with the value of V u d , obtained from either 0 + 0 + super-allowed decays as well as CKM unitarity, and the value of λ from experiments measuring a, is consistent in the 68.3 % confidence region. Also, the UCN neutron lifetime is consistent within the 68.3 % confidence region when taken together with the value of V u d obtained from CKM unitarity, and the global value of λ in Equation (6).

2. Data and Apparatus

We used data from ref. [88], which utilized the ultra-cold neutron (UCN) source [89,90] at the Paul Scherrer Institute (PSI) and the neutron electric dipole moment (nEDM) apparatus [91,92]. For this work, unpolarized UCNs through the south beam line were employed. The UCNs were stored in a cylindrical chamber of height, h = 12.000 ( 1 ) cm, and radius, R = 23.500 ( 1 ) cm. After a period of storage, the remaining UCNs were counted by a detector system. The electric and magnetic fields were turned off. The residual magnetic field was constrained to less than 0.36 μ T [88].
Further information regarding the 199 Hg and 133 Cs magnetometers used in the nEDM experiment at PSI can be found in refs. [93,94], and the neutron detector system is described in refs. [95,96]. Information regarding the magnetic field and its compensation may be found in refs. [97,98,99], and details of the settings used, while data may be found in ref. [92].

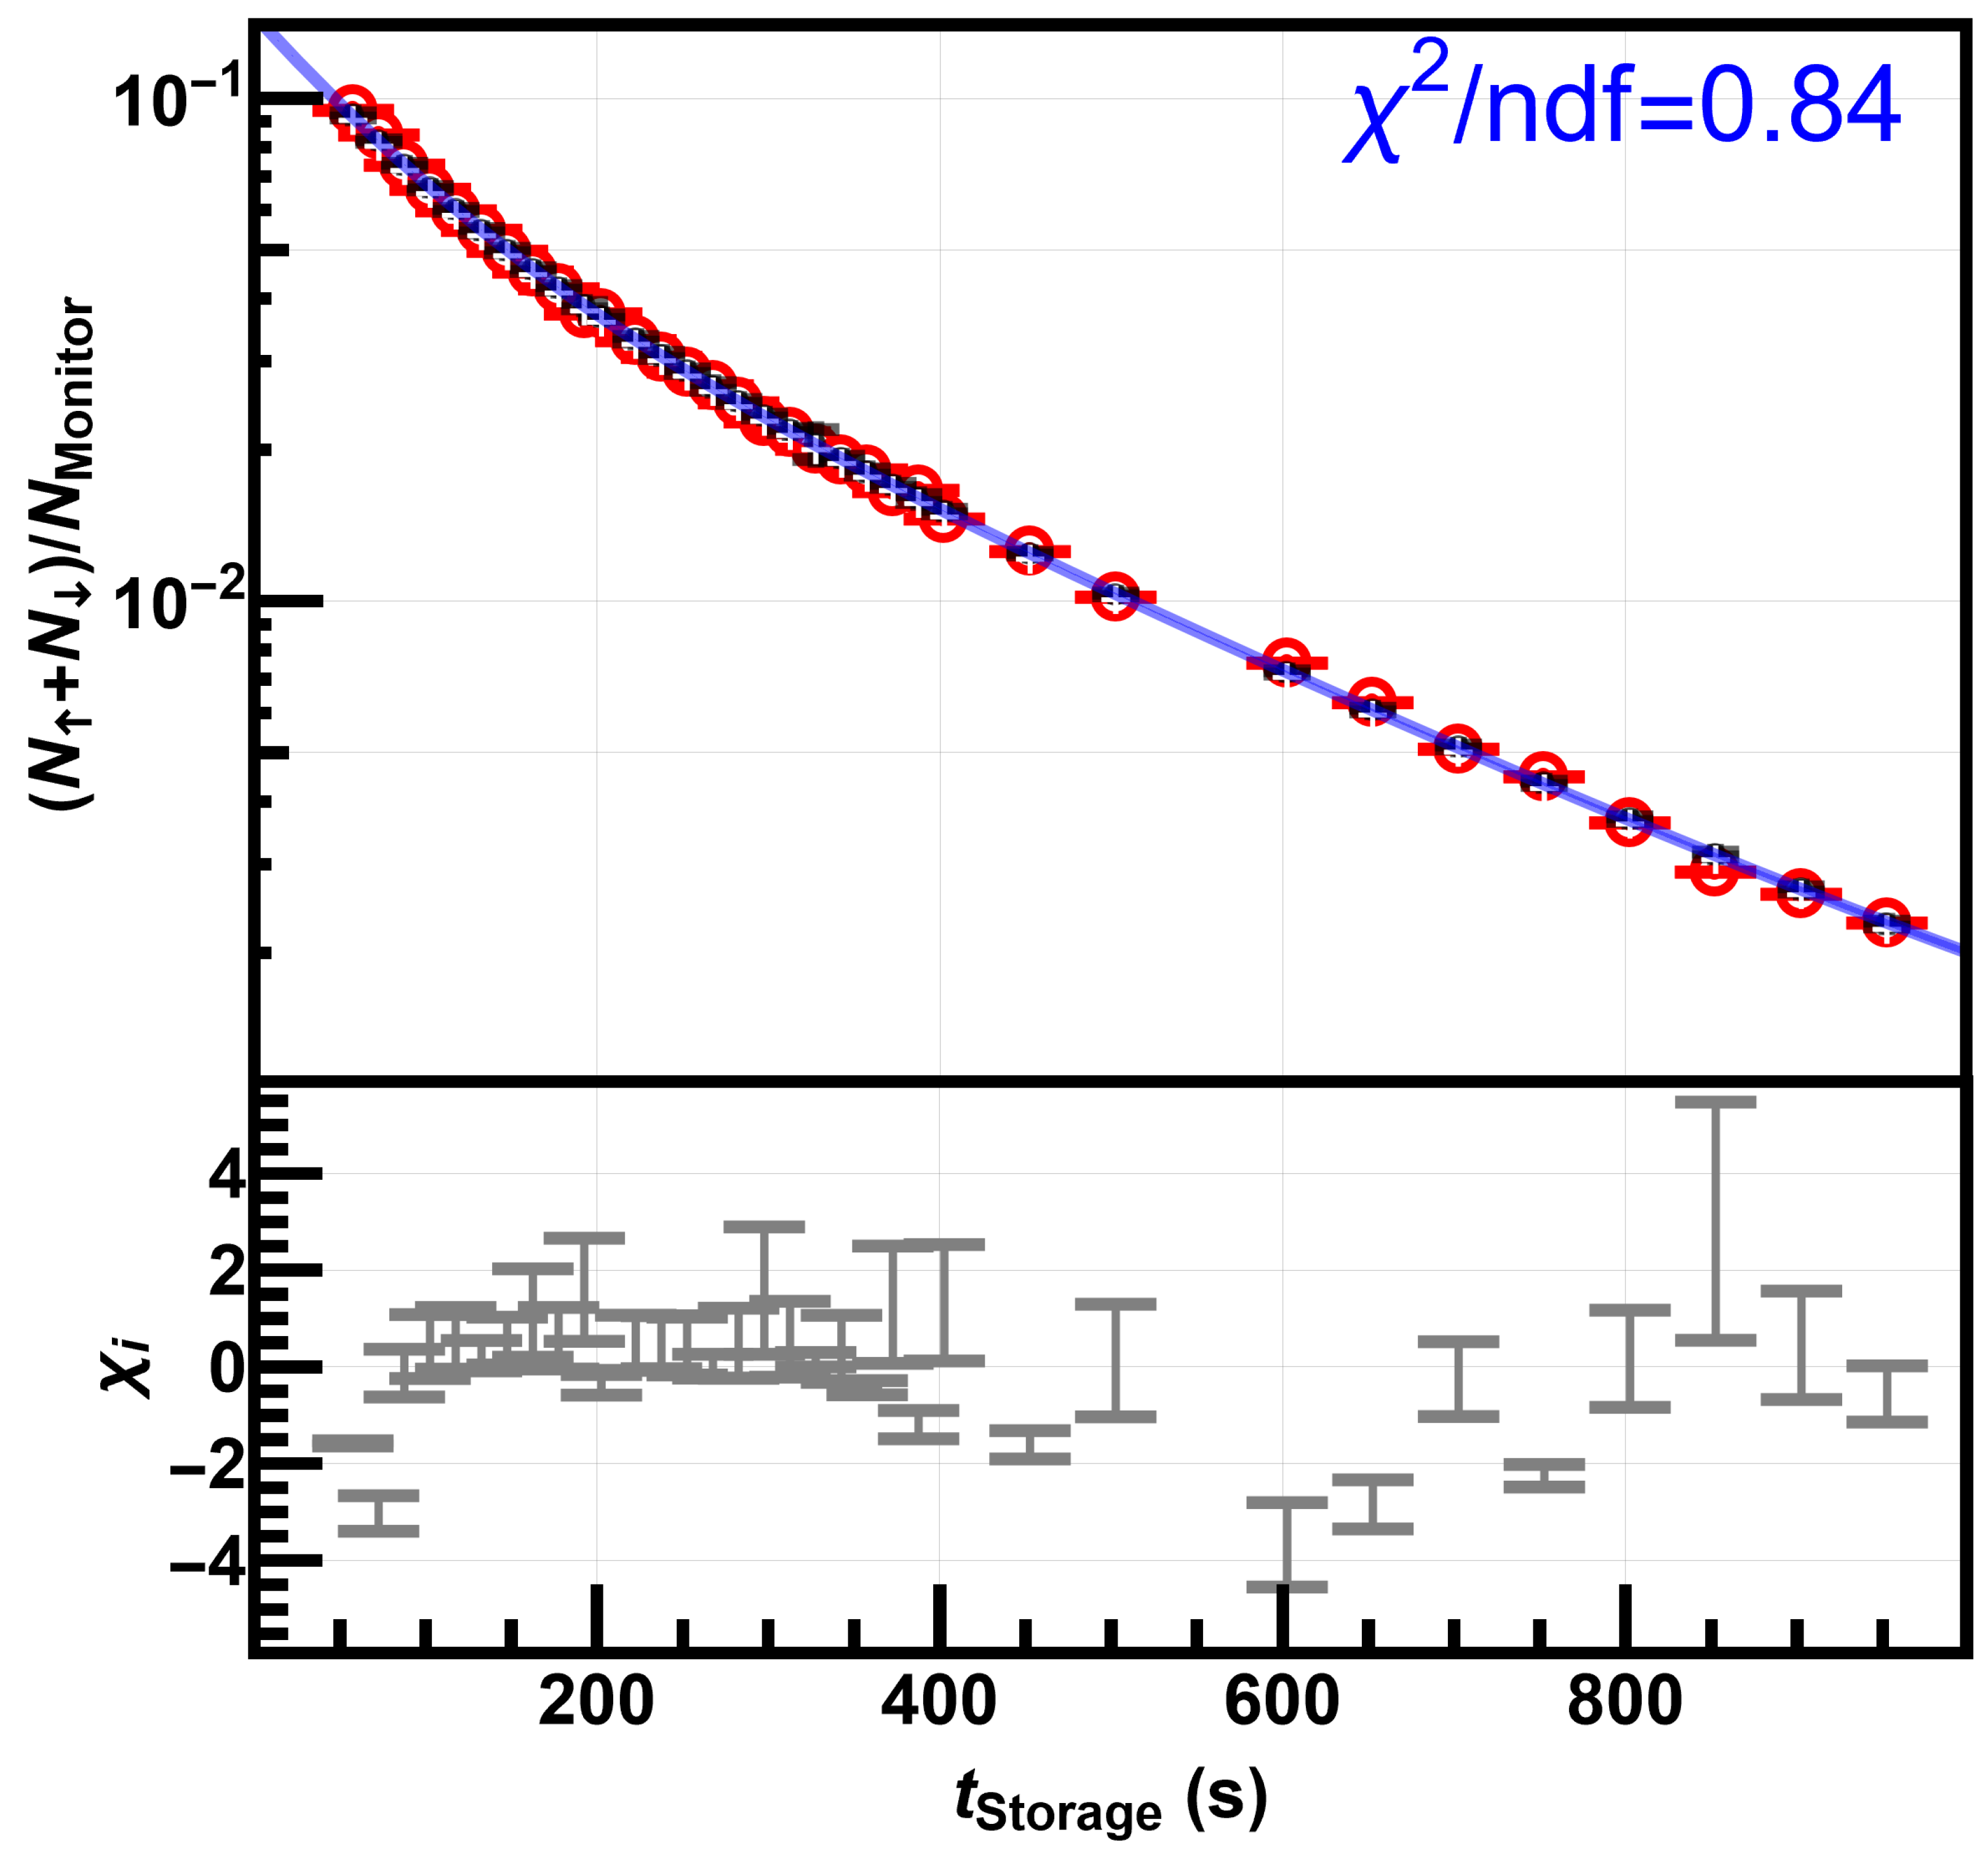
3. Analysis: Fitting the Loss Model to the UCN Storage Curve

The analysis presented here uses the storage data reported in ref. [88] (blue curve in Figure 7) which is represented here in Figure 2 (Top), in conjunction with the Kassiopeia simulation toolkit [100], specifically the version adapted for use in UCN simulations presented in ref. [101]. Unpolarized UCNs were stored for a fixed storage time, t s , before being counted by the detector systems. The total number of neutrons counted after a storage time was normalized using the source monitor, to account for the varying neutron fluxes from the source. The normalized neutron count, as a function of storage time, is usually referred to as the storage curve. It is sufficient to use a sum of two exponential functions, of the form n ( t s ) = n 0 + n fast exp t s / T fast + n slow exp t s / T slow , to fit these data with a good χ 2 / n d f = 0.84 . Here, n ( t s ) are the normalized neutron counts. The two fitted time constants are
T fast = 80.6062 ( 2 ) s and T slow = 271.57161 ( 3 ) s .
The short time constant roughly represents the quick loss of higher energy UCNs, and the longer time constant roughly represents the scale of time over which neutrons are lost in the chamber due to various effects, such as neutron decay, and losses due to scattering off the walls. In order to isolate the neutron decay’s lifetime, a model for the other loss channels is required. This section describes the loss model for the stored UCNs. The model is based on losses when the UCNs scatter inside the storage chamber. It involves characterizing the energy spectra of the stored UCNs, and then constraining the model with the center of mass offset obtained in the nEDM analysis, before finally presenting the possible values of the neutron lifetime that would be consistent with the loss model.
An ensemble of UCNs stored in the storage chamber has an energy distribution determined by the spectrum from the UCN source, the time of storage, t s , and the storage chamber wall surface quality. The storage lifetime resulting from different losses can be written as follows:
1 τ s = 1 τ n + 1 τ μ + ,
where τ n is the free neutron decay lifetime, and τ μ corresponds to the loss channel due to scattering off the walls. Further losses can be due to the absorption or leakage of neutrons, but these sources are negligible in the context of the sensitivity of this effort. Parameter μ is linked to the energy-independent loss coefficient, η s , and is calculated by averaging over all angles of incidence [102], yielding
μ ( E coll ) = 2 η s V F E coll asin E coll V F V F E coll 1 ,
where E coll is the UCN kinetic energy at the point of collision. Note that each material has a unique value of η s , and Fermi potential, V F , associated with it.
The neutron loss channel in this apparatus is dominated by scattering off the wall surfaces. In order to isolate the loss channel due to neutron decay, the method presented here involves fitting a well-characterized, energy-dependent, wall-scattering loss model to the number of stored UCNs in the chamber, as a function of storage time, in order to estimate the neutron lifetime. This method is functionally similar to the work presented in ref. [103], where a similar loss model was employed to extract the mean time between consecutive collisions of stored UCNs to be used in ref. [104]. In ref. [103], η s was allowed to be a free parameter, and the value of the neutron lifetime was fixed to τ n = 879.4 s. In this work, we fixed the values of η S to the values in the literature and allowed τ n to be a free parameter. In refs. [103], a common energy-independent loss coefficient η S was used. Here, care was taken to associate each surface with its specific value of η S and the Fermi potential, V F . During storage, the UCNs may scatter off a layer of deuterated polystyrene (dPS), coating the circular inner surfaces of the cylinder, or scattering off a layer of diamond-like carbon (DLC), coating the flat ends of the cylinder. The values of η S and V F associated with the two materials are listed in Table 1.

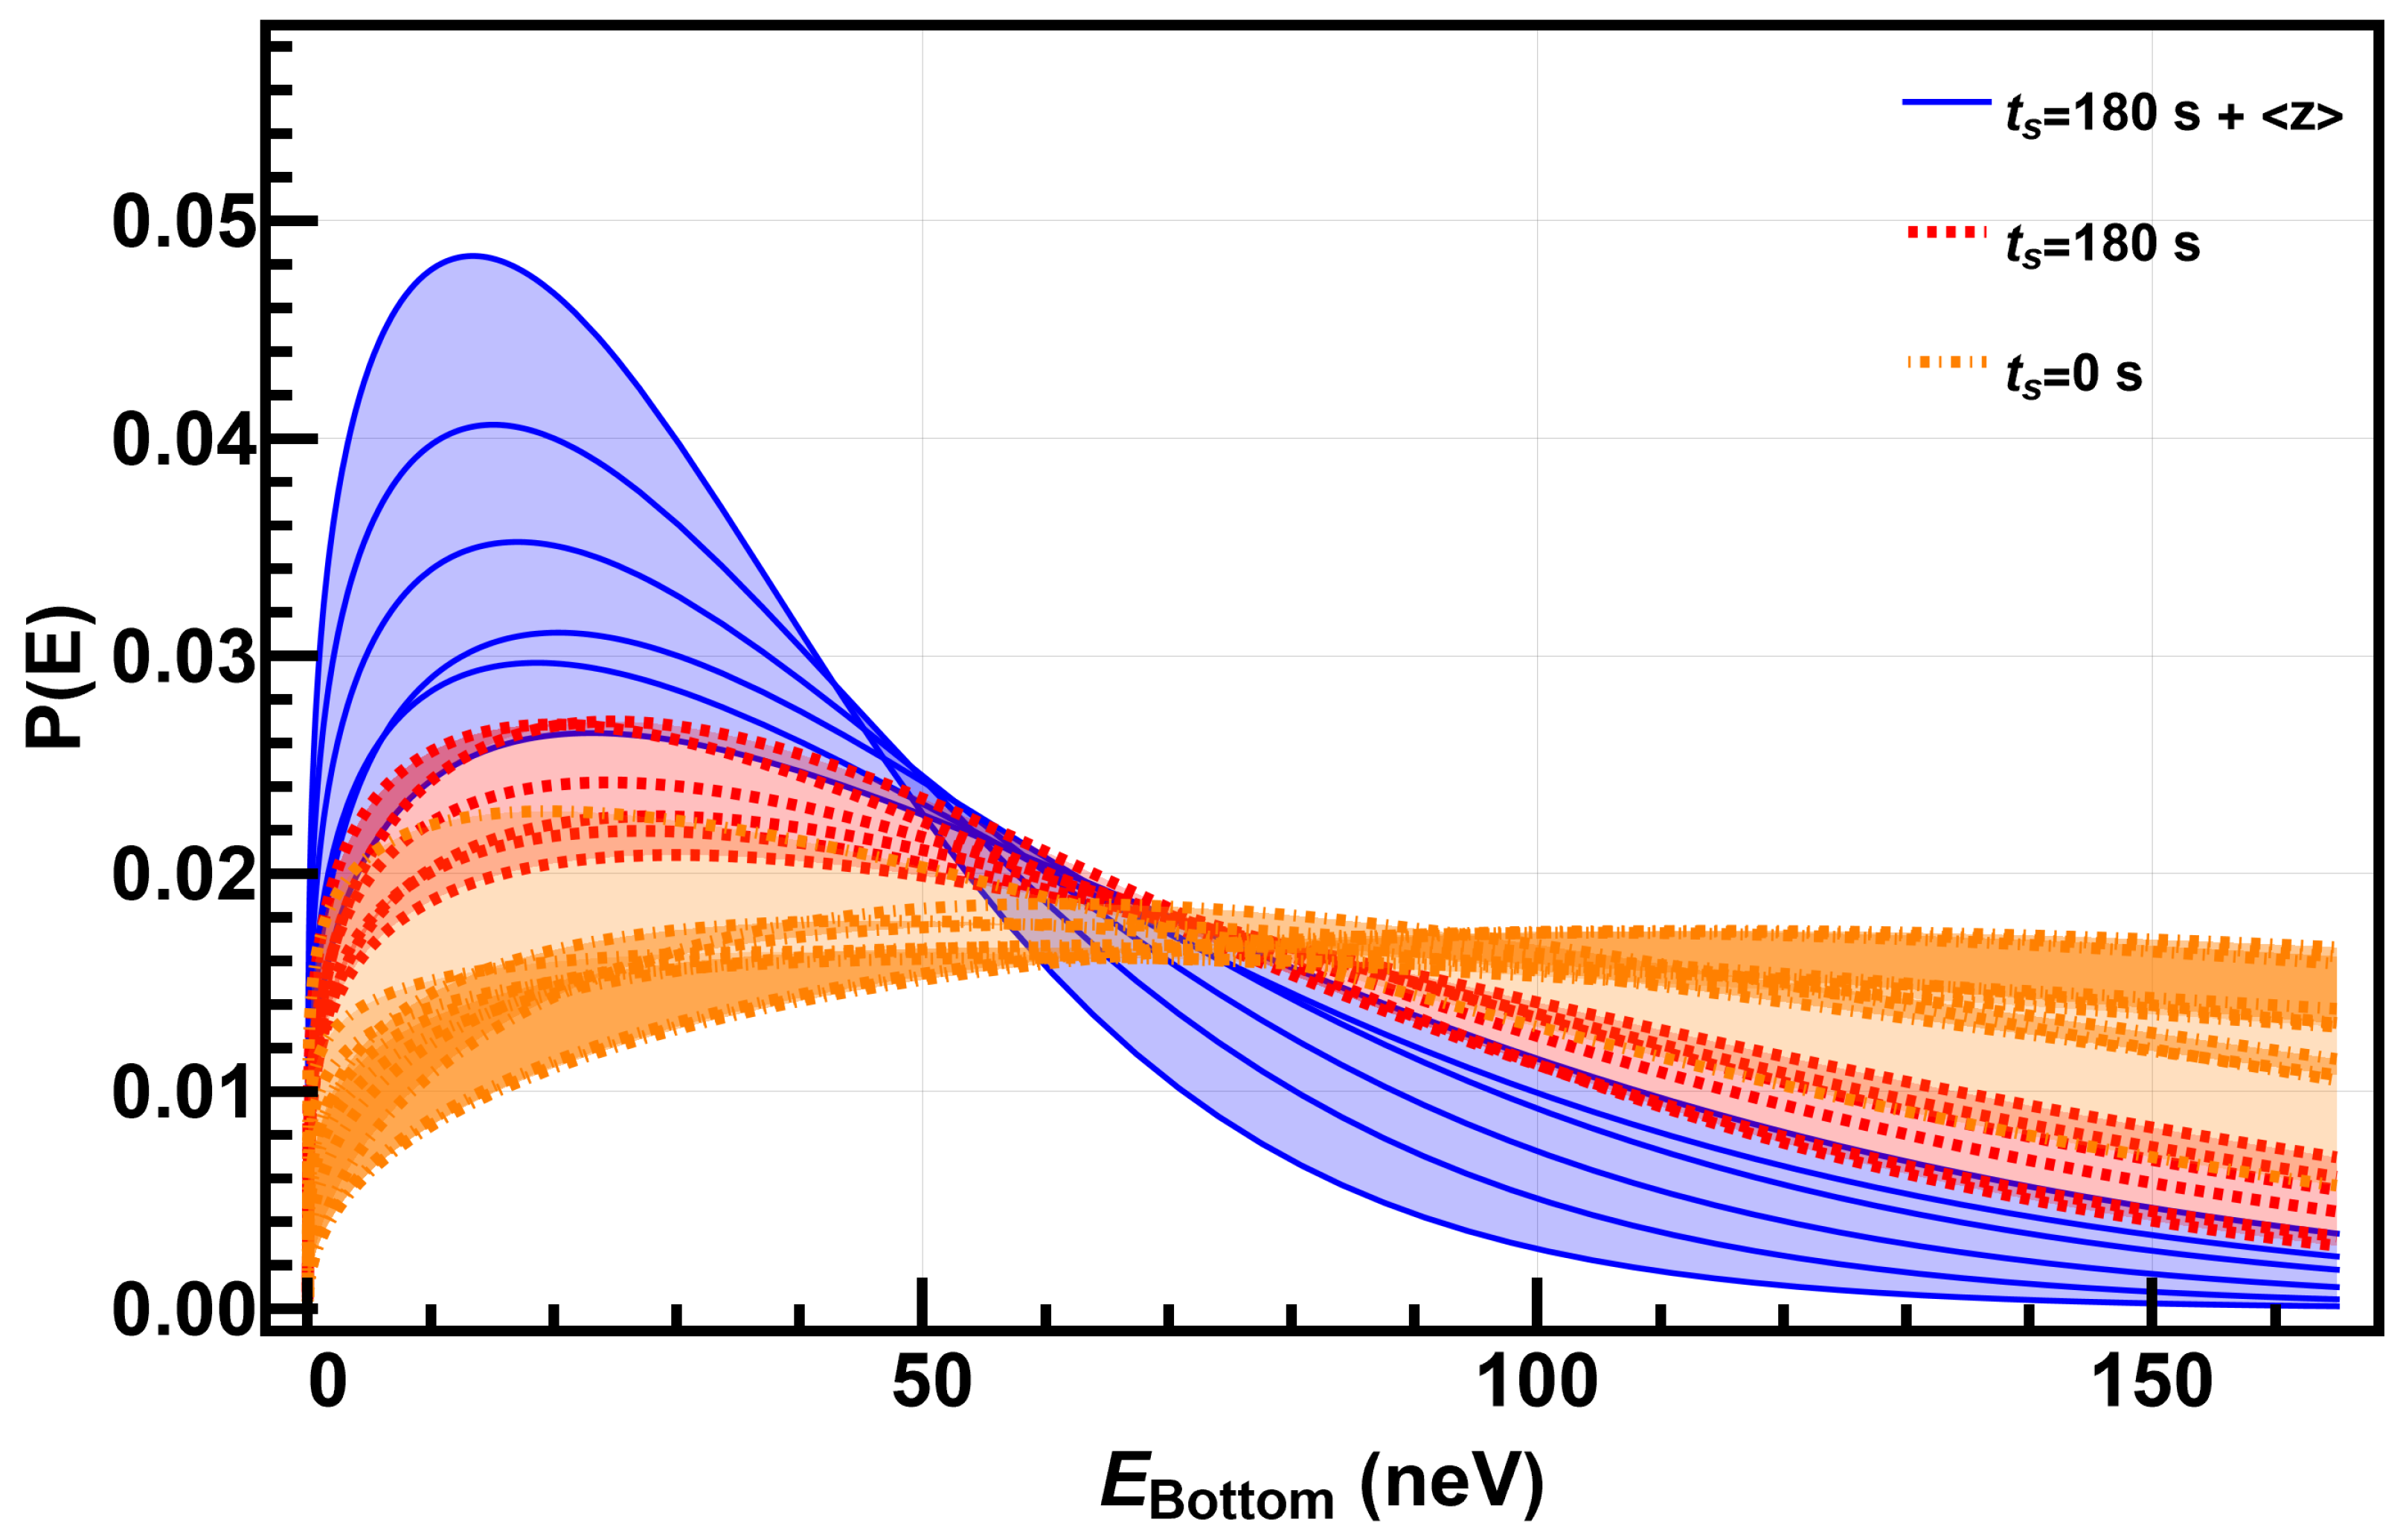
3.1. Characterization of the Energy Spectra

A loss model based on scattering off walls demands characterization of the energy spectra of the UCNs. We use a four-parameter energy distribution, as a function of energy for the UCNs at the bottom of the storage chamber, E ( h = 0 ) , and at the beginning of storage phase (at t s = 0 ), using
P ( E ) = P 0 E ρ 1 + exp E E p w ,
where P 0 is a scaling constant, ρ is the exponent of the leading edge of the distribution, E p is an upper energy cut-off value, and w is a smearing parameter of the energy’s cut-off value. This distribution is truncated at the lowest Fermi surface potential that the stored UCNs see. In our case, this would be dPS with V F = 165 neV [107,108], since the UCNs with energy above the Fermi surface potential of dPS are lost during storage. The energy spectrum in Equation (14) is a modified version of that used in ref. [109], but here, exponent ρ is a free parameter, and the energy range extends down to zero. Further details about the model can be found in refs. [103,109].
In order to quantify the loss rate from wall collisions, the following quantities are defined [102]: (i) mean free path, given by λ = 4 V / A , where V / A is the ratio of the volume-to-surface area; (ii) bounce rate, given by ν ( E coll ) = ( 1 / λ ) ( 2 E coll ) / m n , where E coll E bottom m n g h is the collision kinetic energy at a point of height, h ; and (iii) the loss probability per bounce, given by Equation (13). Then, the UCN loss rate from the wall collisions is given by 1 / τ μ = ν ( E coll ) · μ ( E coll ) .
The energy spectrum at any time t s > 0 is calculated by evolving the spectra at time t s = 0 , according to
P ( E , t s ) = P ( E ) exp t s · ν ( E ) · μ ( E ) .
Finally, Equation (15) is integrated over energy, E, in order to calculate the decay curve measured in Figure 2 (Top),
n ( t s ) = d E · P ( E , t s ) .
The model decay curve in Equation (16) allows us to find the distribution of the 5 free parameters of { P 0 , ρ , E p , w ; τ n } that best reproduces the measured decay curve shown in Figure 2 (Top). In Figure 2 (top), the numerical model values of the decay curve, at the storage times where the experimental data points are also available, obtained by using the above formalism, have also been plotted. Note that these numerical model values plotted in Figure 2 (top) are for a single set of the best-fit parameters with the lowest reduced χ 2 . However, a wide range of parameter sets, which also fit the decay curve data points within an acceptable reduced χ 2 , could be sampled. The range of residuals resulting from the parameter sets that pass both the Fisher statistical test (to be discussed later in this section) and the center of mass constraint (to be discussed in the next section) are shown in Figure 2 (Bottom).
We employed the Kassiopeia toolkit [101] to determine the confidence intervals of the sampled parameters in the model, via Monte Carlo (MC) sampling. The 5 free parameters, { P 0 , ρ , E p , w ; τ n } , were sampled to generate a set of initial energy spectra, according to Equation (14), which then evolved according to Equation (15), each giving rise to a numerical storage curve given in Equation (16). Comparing the computed storage curves (from different sets of 5 free parameters) with the measured storage curve from Figure 2 (top) allows us to compute a reduced χ 2 for each sampled set of 5 parameters. In order to select sets of 5 free parameters based on the associated χ 2 , we employed the Fisher statistical test [64,110], which requires
χ 2 χ min 2 1 + ν 1 ν 2 ν 1 F ν 1 , ( ν 2 ν 1 ) α ,
where F ν 1 , ( ν 2 ν 1 ) α is the Fisher function corresponding to a confidence level of 1 α , ν 1 = 5 is the number of model parameters, ν 2 = 34 is the number of data points measured in Figure 2 (top), and χ min 2 is the minimum χ 2 obtained from all the iterations of the MC sampling of the free parameters. This process of selecting the sampled spectra is similar to the process described in ref. [103]. Example spectra that were selected using this process can be found in Figure 3.
While choosing the parameters of the Fermi potential of the surfaces, V F , and the energy-independent loss per bounce parameter, η S , we considered 99 % confidence intervals of the distributions in Table 1. We sampled values of the neutron lifetime, τ n , from a range starting at a storage time where the data were available, up to nearly twice the neutron lifetime in the literature, i.e., in the range between ( 50 , 1800 ) s. The other parameters of E p and w were sampled from a range of values between ( 0 , 250 ) neV, since these parameters do not constrain the UCN storage curve when sampled near the upper limit of the range. Choosing an upper limit for the sampling of parameters E p and w that is well above the Fermi potential of the surfaces is sufficiently conservative. For a perfect Maxwell distribution, the value of the exponent is ρ = 1 / 2 [102], but it is relaxed to be a free parameter around the ideal value to accommodate spectra that are not strictly Maxwellian [111]. Lastly, the parameter of P 0 is simply a normalization that does not change the shape of the spectrum.

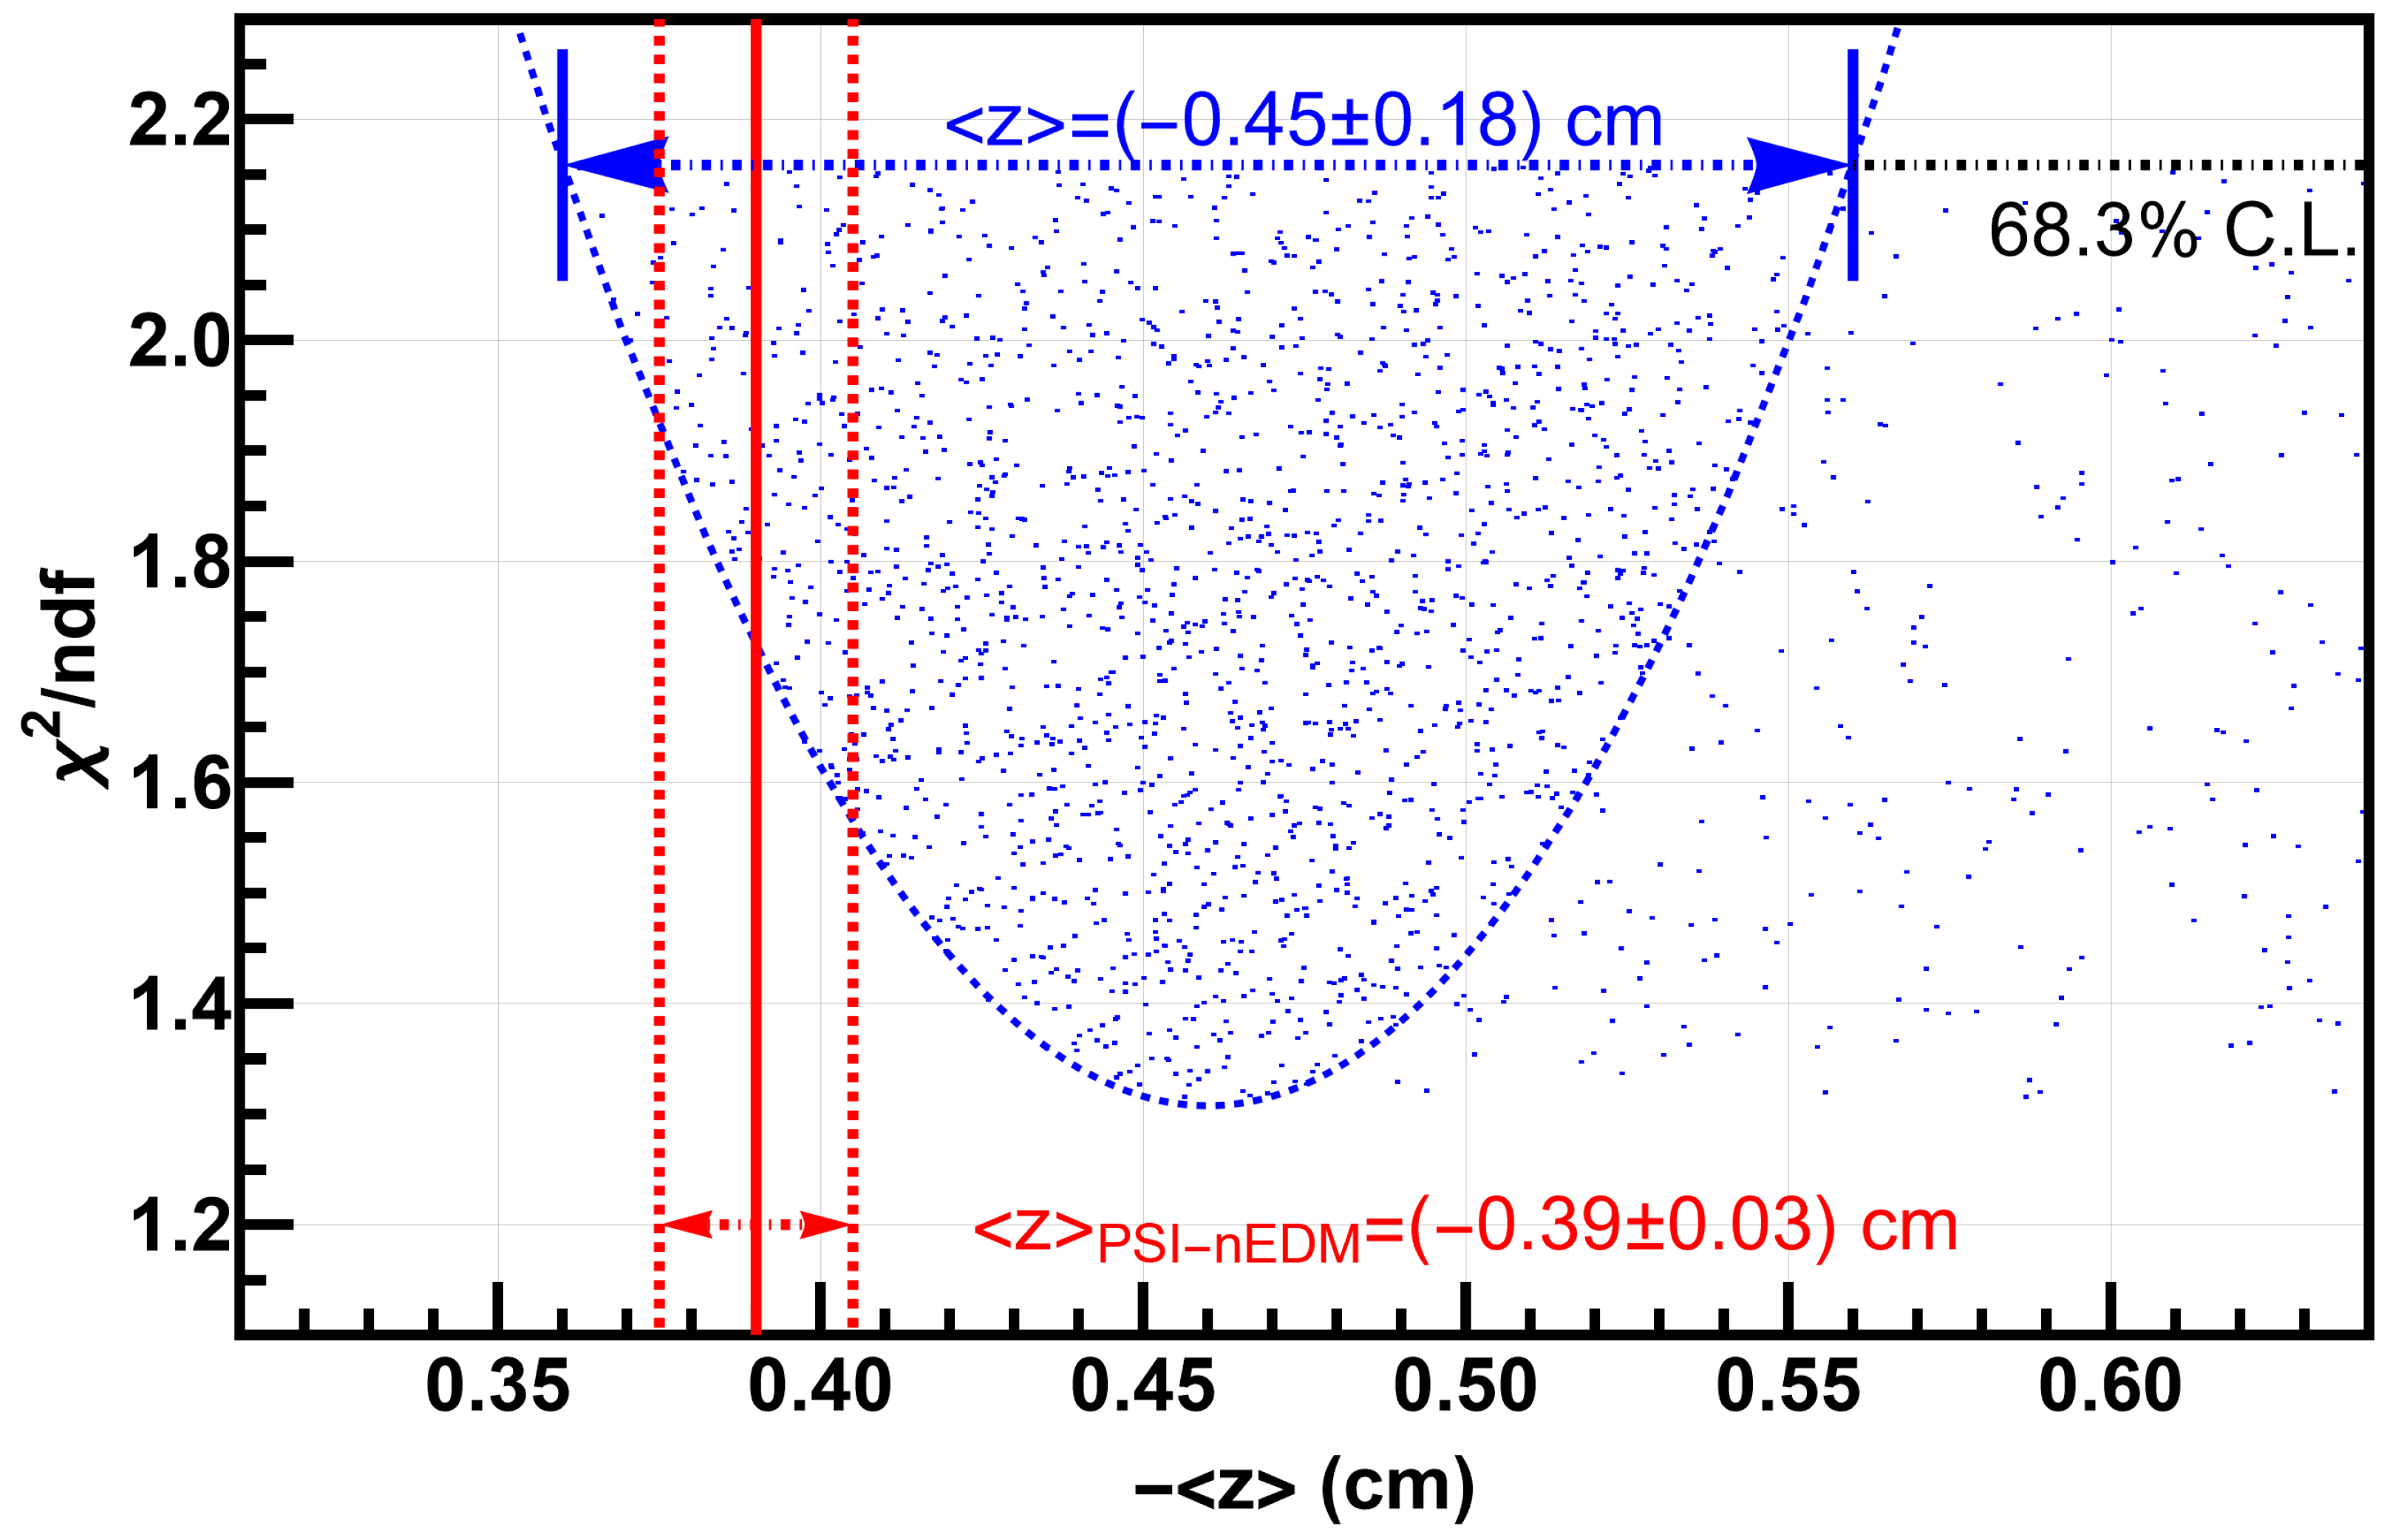
3.2. Constraints upon the UCN Center of Mass Offset

Moments of the density distribution for the stored UCNs are key characterizing features of the ensemble of stored UCNs. The vertical striation of UCNs stored in a cylindrical chamber has been well-characterized [109,112]. The loss model developed in this work can be further constrained by the center of mass of the stored UCNs. The average height of the UCNs is given by [113,114]
z = E k k 0.6 + 0.6 1 k 5 / 3 H 2 ,
where k = 1 when E < m n g ( H = 12 cm ) , and k = 1 ( 1 m g H / E ) 3 / 2 , otherwise. The associated center of mass, z (defined w.r.t. to the geometric center of the storage chamber), has been plotted against the associated reduced χ 2 (limited to 68.3 % C.L.) in Figure 4. For stable solutions in the parameter space, i.e., excluding the sparsely populated regions, we obtain the following for the 68.3 % C.I.
z = ( 0.45 ± 0.18 ) cm .
The center of mass, z , has already been independently extracted by the nEDM analysis [115]. In order to improve our constraint on the energy spectra, the 5 free parameters, and the neutron lifetime, the value of [115]
z PSI - nEDM = ( 0.39 ± 0.03 ) cm ,
from the nEDM analysis was used. Even though the nEDM experiment dealt with polarized UCNs, and this effort deals with unpolarized UCNs, it has been previously shown that the energy spectra of the UCNs do not significantly vary between polarized and unpolarized species [103,104].
When selecting for families of energy spectra, we also calculated the center of mass for the corresponding sampled parameters; the sampled parameters and corresponding energy spectra were retained only when the center of mass fell within the region indicated by Equation (20). For example, the sample spectra, calculated for t s = 180 s of the storage, satisfying only the Fisher statistical test (with 68.3 % C.L.), are shown in Figure 3 as red curves. A second subset of example spectra using the additional constraint from the center of mass and the Fisher statistical test is shown in the same figure (by blue curves). Similarly, the range of residuals plotted in Figure 2 (bottom) was obtained after applying the Fisher statistical test as well as the constraint from the center of mass offset. We also applied the same constraint from the center of mass offset along with a Fisher statistical test when treating the neutron lifetime in the next section.

3.3. Neutron Lifetime Extraction

The neutron lifetime is one of the five free parameters in the neutron storage loss model described in the previous sections. A reduced χ 2 was associated with each set of 5 sampled parameters. Figure 5 shows the reduced χ 2 associated with each sampled value of the neutron lifetime, indicated as red dots. Once the loss channel due to scattering off the walls has been well-characterized, the next most dominant loss channel is due to the neutron β -decay. Consequently, after accounting for the neutrons lost to scattering off the walls, the reduced χ 2 has a minimum around the neutron lifetime. Each unique value of the neutron lifetime may have multiple values of reduced χ 2 associated with it, owing to the other 4 sampled parameters in the model. Selecting the set of 5 parameters that result in a good overall reduced χ 2 using the Fisher statistical test narrows the samples down. The samples that were narrowed down by testing for the center of mass condition coming from the nEDM analysis and the Fisher test are shown in blue in Figure 5. Samples that passed the Fisher test but did not satisfy the center of mass condition in Equation (20) are marked in black in Figure 5. Ultimately, the best-reduced χ 2 for each value of the neutron lifetime was studied to obtain the values of the neutron lifetime that are consistent with the storage data shown in Figure 2 (top).
The Fisher test was further used to compare the global minimum reduced χ 2 with the minimum reduced χ 2 for each unique value of the sampled lifetime, as indicated by the inset in Figure 5, to obtain the confidence interval
τ n * = 880 138 + 279 s   ( 68.3 %   C . L . ) .
A global minimum χ 2 / n d f = 1.31 was obtained at the sampling value of τ n = 879.7 s. This best-reduced χ 2 is consistent with the values reported from other models in refs. [103,109].
The above numerical MC sampling was repeated over 250 times. The standard deviation of the minimum reduced χ 2 for each unique lifetime value from a repetition of the process is shown as a shaded region in the inset of Figure 5, and the mean is shown as the solid blue line. The uncertainty from repeatability impacted the result in Equation (21) by less than 1 % , showing that the sample size considered is sufficiently large enough and the uncertainty related to the numerical sampling is negligible.

4. Discussion of the Sources of Errors

In this section, we will discuss the sources of the uncertainty contributions to the result shown in Equation (21). The input parameters whose uncertainties are numerically propagated into the uncertainty of the lifetime, are (i) the normalized neutron counts, n i , in Figure 1 (top); (ii) the energy-independent loss per bounce, η S DLC , dPS , in Table 1; and (iii) the Fermi potential of the surfaces, V F DLC , dPS , in Table 1. The uncertainties associated with the normalized neutron counts come from propagating the counting (Poisson) uncertainties of the emptying and monitor counts [88]. In order to understand the propagation of these sources of uncertainty to the uncertainty in the value of the neutron lifetime, all but one uncertainty was set to zero, and the MC process described in the previous section was run. This is similar to the process that was employed in ref. [104], used to understand the contribution of the individual parameter’s uncertainty to the uncertainty of the final value. The resulting uncertainties are presented in Table 2.
Since the uncertainties are asymmetric around the central value, Table 2 presents two values, each corresponding to one side of the central value. While it is possible to obtain a factor of 2–3 improvement in the uncertainty associated with the neutron lifetime extracted, by improving the uncertainties in the input parameters of n, η S , and V F , by an order of magnitude, it is still not feasible to bring the final uncertainty in the neutron lifetime extracted from this analysis down to a few seconds using this dataset.
The other sources of uncertainty that have not been uniquely shown but are nonetheless implicit in Table 2 are the uncertainties from (i) the lengths of time for which the storage curve data were collected, (ii) the intervals in which the data were collected, and (iii) the uncertainty associated with z . Given the capacity of the storage chamber in this experiment coupled with the limitations of the neutron density of the source, it was not possible to store a statistically significant number of neutrons beyond about 1000 s. Fitting the loss model using storage data that were at least twice as long as the final neutron lifetime, [ 50 , 950 ] s, was essential to capture the effects of neutron β -decay using this model. The minimum intervals at which the data were collected were limited by the time it took to fill and close the storage chamber by moving the mechanical UCN switch and the UCN shutter below the storage chamber. Neutrons may decay while they are filled or emptied out of the storage chamber, so a time period of 2 τ fill , empty ( 22.6 ± 0.4 ) s [88] was added to the time interval defined in the data acquisition system, in order to obtain an effective storage time, t s . Here, τ fill , empty is the filling or emptying time constant. Ultimately the time intervals at which the storage curve data are collected will be limited by the uncertainty associated with the filling or emptying time constant.
Taking the above effects into consideration and using a toy dataset for the storage curve, in order to obtain a measurement of the neutron lifetime using the method described to a precision of 1 % , storage curve data would need to be collected by at least three times the neutron lifetime with a frequency of 1 s. At this level of precision, loss channels due to absorption and imperfect storage, due to leakage, would need to be equally well-characterized. In addition, the sources of uncertainties coming from the input parameters of n, η S , and V F would need to be improved by nearly 2 orders of magnitude. In terms of the neutron count, this implies that the number of neutrons counted after storage needs to be improved by nearly 4 orders of magnitude, owing to the counting statistics that dictate the associated uncertainty. Therefore, scaling this technique is particularly not viable to achieve an uncertainty in the neutron lifetime below 1 s. Nonetheless, this technique has the capacity to shed light on the various systematic sources that contribute to the final uncertainty in the neutron lifetime.

5. Conclusions

The statistical uncertainty portion of the neutron lifetime in Equation (21) can be attributed to the uncertainty arising from the neutron counting statistics of the normalized neutron counts in Figure 5, indicated in Table 2. The systematic uncertainty portion of the neutron lifetime can be attributed to the uncertainty arising from the combination of uncertainties in parameters η S and V F . The result in Equation (21) can then be written as a sum of the statistical and systematic errors, as
τ n * = 880 ( + 158 / 78 ) stat . ( + 230 / 114 ) sys . s   ( 68.3 %   C . L . ) .
This result may also be interpreted in terms of an interval at 95 % C.L. by τ n * ( 688 , 1400 ) s.
Other MC simulations of the neutron lifetime measurements already exist, particularly in refs. [116,117]. Ref. [116] corrects the value in ref. [44] by around 6 s, by including the quasi-elastic scattering of UCNs over a liquid wall, and ref. [117] corrects the value of the lifetime in ref. [51] by a similar amount. These MC simulations use the same techniques used by the corresponding experiments, where the loss factor associated with UCNs bouncing off walls in the storage chamber is accounted for by extrapolating the inverse of the mean free path to zero.
These simulations also characterize the energy spectrum of a UCN as a function of storage time but fail to incorporate the uncertainty of the energy spectra. In our simulation, as described in this paper, the storage curve is directly (numerically) fitted to the loss model in order to characterize the loss channel from UCNs bouncing off the walls of the storage chamber. The uncertainties from parameters η s and V F (besides the uncertainties from the other two degrees of freedom in our loss model, E p and w), taken together, contribute to a large uncertainty in the energy spectra of UCNs. Such uncertainty in the energy spectra leads to a large possible range for the acceptable number of times UCNs may have bounced off the walls during storage. A large uncertainty in the energy spectra makes characterizing the loss channel due to UCNs scattering off the wall surfaces harder and makes the associated uncertainties larger. Large uncertainty in the energy spectra also implies that a larger spread of the neutron lifetime may be consistent with the storage curve data. Extrapolation of the inverse of the mean free path to zero, in order to extract the neutron lifetime, requires a clear understanding of the bounce rate and the associated loss channel. In order to characterize the loss channel due to scattering off the walls, extremely fine storage curve data collected at small intervals on the order 1 s are vital. Extrapolation of the inverse of the mean free path to zero, using storage curve data at a few storage times, may be inadequate. Therefore, the previous MC simulations of UCN storage experiments underestimated their uncertainties.
The technique of characterizing the energy spectra of stored UCNs, presented in this work, is useful in extracting the mean time between consecutive collisions [103,104], which is a key parameter for neutron storage disappearance experiments in search of neutron oscillation. Previous efforts to characterize the energy spectra of stored UCNs have relied on the application of a spin echo technique to polarized UCNs [109], whereas, the technique presented here utilized unpolarized UCNs to extract the energy spectra, which may also be helpful in other experiments using unpolarized neutrons.
The nEDM experiment that this effort used was not designed or optimized to measure the neutron lifetime. Just like the early UCN storage experiments, this effort was dominated by losses due to neutrons scattering off the walls of the storage chamber. But, we were—for the first time—able to develop a full-fledged loss model that includes channels of loss due to scattering off the walls, the imperfect storage of UCNs in the storage chamber, and neutron β decay. The primary improvement presented here is the accounting for, and propagation of, the sources of uncertainty related to characterizing the family of energy spectra for the UCNs based on storage time.

Author Contributions

Conceptualization, P.M.; methodology, P.M.; software, P.M. and J.F.; validation, J.F., J.A.W. and D.J.S.; formal analysis, P.M.; writing—original draft preparation, P.M. and J.A.W.; writing—review and editing, J.A.W., D.J.S. and J.F.; visualization, P.M.; supervision, J.A.W. and J.F.; funding acquisition, P.M., J.A.W. and J.F. All authors have read and agreed to the published version of the manuscript.

Funding

P.M. would like to acknowledge support from the SERI-FCS, award no. 2015.0594, Sigma Xi grant nos. G2017100190747806 and G2019100190747806, and the Ivy Plus Exchange program. J.W. is supported by the Office of Science, US Department of Energy, under grant nos. DE-SC00-144448. D.J.S. acknowledges support from NSF grant no. PHY-2209481.

Institutional Review Board Statement

Not applicable.

Informed Consent Statement

Not applicable.

Data Availability Statement

Not applicable.

Acknowledgments

We would like to acknowledge the grid computing resource provided by the Research Computing Center at the University of Chicago [118]. We would like to thank Z. Tang (LANL) and D. Dutta (St. U.) for productive discussions about neutron lifetime measurements and possible applications of this work, respectively. We would also like to highlight Z. Bogorad’s (Stanford) contributions to ref. [101], which in turn made this work possible, as well as G. Zsigmond (PSI), whose guidance in ref. [103] was vital.

Conflicts of Interest

The authors declare no conflict of interest.

References

  1. Von Weizsäcker, C.F. Zur Theorie der Kernmassen. Zeit. Für Phys. 1935, 96, 431. [Google Scholar] [CrossRef]
  2. Fermi, E. Versuch einer Theorie der β-Strahlen. Zeit. Für Phys. 1934, 88, 161. [Google Scholar] [CrossRef]
  3. Gamow, G.; Teller, E. Selection Rules for the β-Disintegration. Phys. Rev. 1936, 49, 895. [Google Scholar] [CrossRef]
  4. Lee, T.D.; Yang, C.-N. Question of Parity Conservation in Weak Interactions. Phys. Rev. 1956, 104, 254. [Google Scholar] [CrossRef]
  5. Salam, A.; Ward, J.C. Electromagnetic and weak interactions. Phys. Lett. 1964, 13, 168. [Google Scholar] [CrossRef]
  6. Weinberg, S. A Model of Leptons. Phys. Rev. Lett. 1967, 19, 1264. [Google Scholar] [CrossRef]
  7. Glashow, S.L.; Iliopoulos, J. Divergences of Massive Yang-Mills Theories. Phys. Rev. D 1971, 3, 1043. [Google Scholar] [CrossRef]
  8. Feynman, R.P.; Gell-Mann, M. Theory of the Fermi Interaction. Phys. Rev. 1958, 109, 193. [Google Scholar] [CrossRef]
  9. Sudarshan, E.C.G.; Marshak, R.E. Chirality Invariance and the Universal Fermi Interaction. Phys. Rev. 1958, 109, 1860. [Google Scholar] [CrossRef]
  10. (CODATA) Mohr, P.J.; Newell, D.B.; Taylor, B.N. CODATA Recommended Values of the Fundamental Physical Constants. J. Phys. Chem. Ref. Data 2016, 45, 043102. [Google Scholar] [CrossRef]
  11. Cabibbo, N. Unitary Symmetry and Leptonic Decays. Phys. Rev. Lett. 1963, 10, 531. [Google Scholar] [CrossRef]
  12. Kobayashi, M.; Maskawa, T. CP-Violation in the Renormalizable Theory of Weak Interaction. Progr. Theor. Phys. 1973, 49, 652. [Google Scholar] [CrossRef]
  13. Severijns, N.; Beck, M.; Naviliat-Cuncic, O. Tests of the standard electroweak model in nuclear beta decay. Rev. Mod. Phys. 2006, 78, 991. [Google Scholar] [CrossRef]
  14. Cirigliano, V.; Gardner, S.; Holstein, B.R. Beta decays and non-standard interactions in the LHC era. Prog. Part. Nucl. Phys. 2013, 71, 93. [Google Scholar] [CrossRef]
  15. Snell, A.H.; Pleasonton, F.; McCord, R.V. Radioactive Decay of the Neutron. Phys. Rev. 1950, 78, 310. [Google Scholar] [CrossRef]
  16. Robson, J.M. Radioactive Decay of the Neutron. Phys. Rev. 1950, 78, 311. [Google Scholar] [CrossRef]
  17. Robson, J.M. The Radioactive Decay of the Neutron. Phys. Rev. 1951, 83, 349. [Google Scholar] [CrossRef]
  18. Yue, A.T.; Dewey, M.S.; Gilliam, D.M.; Greene, G.L.; Laptev, A.B.; Nico, J.S.; Snow, W.M.; Wietfeldt, F.E. Improved Determination of the Neutron Lifetime. Phys. Rev. Lett. 2013, 111, 222501. [Google Scholar] [CrossRef]
  19. Steyerl, A.; Pendlebury, J.M.; Kaufman, C.; Malik, S.S.; Desai, A.M. Quasielastic Scattering in the Interaction of Ultracold Neutrons with a Liquid Wall and Application in a Reanalysis of the Mambo I Neutron-Lifetime Experiment. Phys. Rev. C 2012, 85, 065503. [Google Scholar] [CrossRef]
  20. Serebrov, A.P.; Kolomensky, E.A.; Fomin, A.K.; Krasnoshchekova, I.A.; Vassiljev, A.V.; Prudnikov, D.M.; Shoka, I.V.; Chechkin, A.V.; Chaikovskiy, M.E.; Varlamov, V.E.; et al. Neutron Lifetime Measurements with a Large Gravitational Trap for Ultracold Neutrons. Phys. Rev. C 2018, 97, 055503. [Google Scholar] [CrossRef]
  21. Arzumanov, S.; Bondarenko, L.; Chernyavskya, S.; Geltenbort, P.; Morozova, V.; Nesvizhevsky, V.V.; Panin, Y.; Strepetova, A. A measurement of the neutron lifetime using the method of storage of ultracold neutrons and detection of inelastically up-scattered neutrons. Phys. Lett. B 2015, 745, 79. [Google Scholar] [CrossRef]
  22. Serebrov, A.P.; Varlamov, V.E.; Kharitonov, A.G.; Fomin, A.K.; Pokotilovski, Y.N.; Geltenbort, P.; Krasnoschekova, I.A.; Lasakov, M.S.; Taldaev, R.R.; Vassiljev, A.V.; et al. Neutron lifetime measurements using gravitationally trapped ultracold neutrons. Phys. Rev. C 2008, 78, 035505. [Google Scholar] [CrossRef]
  23. Ezhov, V.F.; Andreeva, A.Z.; Ban, G.; Bazarova, B.A.; Geltenbort, P.; Glushkova, A.G.; Knyazkov, V.A.; Kovrizhnykhe, N.A.; Krygina, G.B.; Naviliat-Cuncic, O.; et al. Measurement of the Neutron Lifetime with Ultracold Neutrons Stored in a Magneto-Gravitational Trap. JETP Lett. 2018, 107, 671. [Google Scholar] [CrossRef]
  24. Gonzalez, F.M.; Fries, E.M.; Cude-Woods, C.; Bailey, T.; Blatnik, M.; Broussard, L.J.; Callahan, N.B.; Choi, J.H.; Clayton, S.M.; Currie, S.A.; et al. Improved neutron lifetime measurement with UCNτ. Phys. Rev. Lett. 2021, 127, 162501. [Google Scholar] [CrossRef]
  25. D’Angelo, N. Cloud-Chamber Measurement of the Half-Life of the Neutron. Phys. Rev. 1959, 114, 285. [Google Scholar] [CrossRef]
  26. Kossakowski, R.; Grivot, P.; Liaud, P.; Schreckenbach, K.; Azuelos, G. Neutron Lifetime Measurement with a Helium-Filled Time Projection Chamber. Nucl. Phys. A 1989, 503, 473. [Google Scholar] [CrossRef]
  27. Wilson, J.T.; Lawrence, D.J.; Peplowski, P.N.; Eke, V.R.; Kegerreis, J.A. Space-Based Measurement of the Neutron Lifetime Using Data from the Neutron Spectrometer on NASA’s MESSENGER Mission. Phys. Rev. Res. 2020, 2, 023316. [Google Scholar] [CrossRef]
  28. Wietfeldt, F.E.; Greene, G.L. Colloquium: The neutron lifetime. Rev. Mod. Phys. 2011, 83, 1173. [Google Scholar] [CrossRef]
  29. Wietfeldt, F. Measurements of the Neutron Lifetime. Atoms 2018, 6, 70. [Google Scholar] [CrossRef]
  30. Spivak, P.E.; Sosnovsky, A.N.; Prokofiev, Y.A.; Sokolov, V.S. Neutron Lifetime, in Report of the United Nations Delegation to the International Conference on the Peaceful Uses of Atomic Energy. In Neutron Lifetime; Page, N., Ed.; Report of the United Nations Delegation to the International Conference on the Peaceful Uses of Atomic Energy; United Nations: San Francisco, CA, USA, 1956; p. 33. [Google Scholar] [CrossRef]
  31. Sosnovsky, A.N.; Spivak, P.E.; Prokofiev, Y.A.; Kutikov, I.E.; Dobrinin, Y.P. Measurement of the Neutron Life-Time. Phys. Rev. C 1959, 10, 395. [Google Scholar] [CrossRef]
  32. Bondarenko, L.N.; Kurguzov, V.V.; Prokof’ev, Y.A.; Rogov, E.V.; Spivak, P.E. Measurement of the Neutron Half-Life. JETP Lett. 1978, 28, 303–307. Available online: https://www.osti.gov/biblio/6466740 (accessed on 3 February 2021).
  33. Christensen, C.J.; Nielsen, A.; Bahnsen, A.; Brown, W.K.; Rustad, B.M. Free-Neutron Beta-Decay Half-Life. Phys. Rev. D 1972, 5, 1628. [Google Scholar] [CrossRef]
  34. Byrne, J.; Morse, J.; Smith, K.F.; Shaikh, F.; Green, K.; Greene, G.L. A New Measurement of the Neutron Lifetime. Phys. Lett. B 1980, 92, 274. [Google Scholar] [CrossRef]
  35. Byrne, J.; Dawber, P.G.; Spain, A.; Williams, A.P.; Dewey, M.S.; Gilliam, D.M.; Greene, G.L.; Lamaze, G.P.; Scott, R.D.; Pauwels, J.; et al. Measurement of the neutron lifetime by counting trapped protons. Phys. Rev. Lett. 1990, 65, 289. [Google Scholar] [CrossRef]
  36. Spivak, P.E. Neutron Lifetime Obtained from Atomic-Energy-Institute Experiment [JETP Lett. 28, 303 (1978)]. JETP Lett. 1988, 67, 1735–1740. Available online: https://inis.iaea.org/search/search.aspx?orig_q=RN:22027615 (accessed on 4 February 2021).
  37. Byrne, J.; Dawber, P.G.; Habeck, C.G.; Smidt, S.J.; Spain, J.A.; Williams, A.P. A Revised Value for the Neutron Lifetime Measured Using a Penning Trap. Euro. Phys. Lett. 1996, 33, 187. [Google Scholar] [CrossRef]
  38. Last, J.; Arnold, M.; Döhner, J.; Dubbers, D.; Freedman, S.J. Pulsed-Beam Neutron-Lifetime Measurement. Phys. Rev. Lett. 1988, 60, 995. [Google Scholar] [CrossRef] [PubMed]
  39. Dewey, M.S.; Gilliam, D.M.; Nico, J.S.; Wietfeldt, F.E.; Fei, X.; Snow, W.M.; Greene, G.L.; Pauwels, J.; Eykens, R.; Lamberty, A.; et al. Measurement of the Neutron Lifetime Using a Proton Trap. Phys. Rev. Lett. 2003, 91, 152302. [Google Scholar] [CrossRef] [PubMed]
  40. Nico, J.S.; Dewey, M.S.; Gilliam, D.M.; Wietfeldt, F.E.; Fei, X.; Snow, W.M.; Greene, G.L.; Pauwels, J.; Eykens, R.; Lamberty, A.; et al. Measurement of the neutron lifetime by counting trapped protons in a cold neutron beam. Phys. Rev. C 2005, 71, 055502. [Google Scholar] [CrossRef]
  41. Kosvintsev, Y.Y.; Kushnir, Y.A.; Morozov, V.I.; Terekhov, G.I. Use of Ultracold Neutrons for Measurement of the Neutron Lifetime. JETP Lett. 1980, 31, 236–240. Available online: https://www.osti.gov/biblio/5239030 (accessed on 4 February 2021).
  42. Kosvintsev, Y.Y.; Morozov, V.I.; Terekhov, G.I. Measurement of neutron lifetime through storage of ultracold neutrons. JETP Lett. 1986, 44, 571. Available online: https://ui.adsabs.harvard.edu/abs/1986ZhPmR..44..444K (accessed on 4 February 2021).
  43. Morozov, V.I. Neutron lifetime determination by ultracold neutron storage. Nucl. Instrum. Methods Phys. Res. A 1989, 284, 108. [Google Scholar] [CrossRef]
  44. Mampe, W.; Ageron, P.; Bates, C.; Pendlebury, J.M.; Steyerl, A. Neutron Lifetime Measured with Stored Ultracold Neutrons. Phys. Rev. Lett. 1989, 63, 593. [Google Scholar] [CrossRef]
  45. Pichlmaier, A.; Butterworth, J.; Geltenbort, P.; Nagel, H.; Nesvizhevsky, V.; Neumaier, S.; Schreckenbach, K.; Steichele, E.; Varlamov, V. MAMBO II: Neutron Lifetime Measurement with Storage of Ultra Cold Neutrons. Nucl. Instrum. Methods Phys. Res. A 2000, 440, 517. [Google Scholar] [CrossRef]
  46. Pichlmaier, A.; Varlamov, V.; Schreckenbach, K.; Geltenbort, P. Neutron Lifetime Measurement with the UCN Trap-in-Trap MAMBO II. Phys. Lett. B 2010, 693, 221. [Google Scholar] [CrossRef]
  47. Kharitonov, A.G.; Nesvizhevsky, V.V.; Serebrov, A.P.; Taldaev, R.R.; Varlamov, V.E.; Vasilyev, A.V.; Alfimenkov, V.P.; Lushchikov, V.I.; Shvetsov, V.N.; Strelkov, A.V. Preliminary Results of Neutron Lifetime Measurements with Gravitational UCN Trap. Nucl. Instrum. Methods Phys. Res. A 1989, 284, 98. [Google Scholar] [CrossRef]
  48. Alfimenkov, V.P.; Varlamov, V.E.; Vasilev, A.V.; Gudkov, V.P.; Valery, S. Measurement of Neutron Lifetime with a Gravitational Trap for Ultracold Neutrons. JETP Lett. 1990, 52, 373. Available online: http://www.jetpletters.ac.ru/ps/1158/article_17515.shtml (accessed on 6 February 2021).
  49. Nesvizhevskii, V.V.; Serebrov, A.P.; Tal’daev, R.R.; Kharitonov, A.G.; Alfimenkov, V.P.; Strelkov, A.V.; Shvetsov, V.N. Measurement of the Neutron Lifetime in a Gravitational Trap and Analysis of Experimental Errors. Sov. Phys. JETP 1992, 75, 405. Available online: https://inspirehep.net/literature/346975 (accessed on 4 February 2021).
  50. Mampe, W.; Mampe, W.; Bondarenko, L.N.; Morozov, V.I.; Panin, Y.N.; Fomin, A.I. Measuring Neutron Lifetime by Storing Ultracold Neutrons and Detecting Inelastically Scattered Neutrons. JETP Lett. 1993, 57, 82. [Google Scholar]
  51. Arzumanov, S.; Bondarenko, L.; Chernyavsky, S.; Drexel, W.; Fomin, A.; Geltenbort, P.; Morozov, V.; Panin, Y.; Pendlebury, J.; Schreckenbach, K. Neutron Life Time Value Measured by Storing Ultracold Neutrons with Detection of Inelastically Scattered Neutrons. Phys. Lett. B 2000, 483, 15. [Google Scholar] [CrossRef]
  52. Arzumanov, S.S.; Bondarenko, L.N.; Morozov, V.I.; Panin, Y.N.; Chernyavsky, S.M. Analysis and Correction of the Measurement of the Neutron Lifetime. JETP Lett. 2012, 95, 224. [Google Scholar] [CrossRef]
  53. Serebrov, A.; Varlamov, V.; Kharitonov, A.; Fomin, A.; Pokotilovski, Y.; Geltenbort, P.; Butterworth, J.; Krasnoschekova, I.; Lasakov, M.; Tal’daev, R.; et al. Measurement of the Neutron Lifetime Using a Gravitational Trap and a Low-Temperature Fomblin Coating. Phys. Lett. B 2005, 605, 72. [Google Scholar] [CrossRef]
  54. Kügler, K.-J.; Paul, W.; Trinks, U. A magnetic storage ring for neutrons. Phys. Lett. B 1978, 72, 422. [Google Scholar] [CrossRef]
  55. Kügler, K.-J.; Moritz, K.; Paul, W.; Trinks, U. Nestor—A magnetic storage ring for slow neutrons. Nucl. Instrum. Methods Phys. Res. A 1985, 228, 240. [Google Scholar] [CrossRef]
  56. Paul, W.; Anton, F.; Paul, L.; Paul, S.; Mampe, W. Measurement of the Neutron Lifetime in a Magnetic Storage Ring. Zeit. Für Phys. C 1989, 45, 25. [Google Scholar] [CrossRef]
  57. Anton, F.; Paul, W.; Mampe, W.; Paul, L.; Paul, S. Measurement of the Neutron Lifetime by Magnetic Storage of Free Neutrons. Nucl. Instrum. Methods Phys. Res. A 1989, 284, 101. [Google Scholar] [CrossRef]
  58. Ezhov, V.F.; Andreev, A.Z.; Ban, G.; Bazarov, B.A.; Geltenbort, P.; Hartman, F.J.; Glushkov, A.G.; Groshev, M.G.; Knyazkov, V.A.; Kovrizhnykh, N.A.; et al. Magnetic storage of UCN for a measurement of the neutron lifetime. Nucl. Instrum. Methods Phys. Res. A 2009, 611, 167. [Google Scholar] [CrossRef]
  59. Huffman, P.R.; Brome, C.R.; Butterworth, J.S.; Coakley, K.J.; Dewey, M.S.; Dzhosyuk, S.N.; Golub, R.; Greene, G.L.; Habicht, K.; Lamoreaux, S.K.; et al. Magnetic trapping of neutrons. Nature 2000, 403, 62. [Google Scholar] [CrossRef]
  60. Brome, C.R.; Butterworth, J.S.; Dzhosyuk, S.N.; Mattoni, C.E.; McKinsey, D.N.; Doyle, J.M.; Huffman, P.R.; Dewey, M.S.; Wietfeldt, F.E.; Golub, R.; et al. Magnetic trapping of ultracold neutrons. Phys. Rev. C 2001, 63, 055502. [Google Scholar] [CrossRef]
  61. Yang, L. Towards Precision Measurement of the Neutron Lifetime Using Magnetically Trapped Neutrons. Ph.D. Thesis, Harvard University, Cambridge, MA, USA, 2006. Available online: https://ui.adsabs.harvard.edu/abs/2006PhDT........30Y (accessed on 6 February 2021).
  62. Leung, K.K.H.; Geltenbort, P.; Ivanov, S.; Rosenau, F.; Zimmer, O. Neutron Lifetime Measurements and Effective Spectral Cleaning with an Ultracold Neutron Trap Using a Vertical Halbach Octupole Permanent Magnet Array. Phys. Rev. C 2016, 94, 045502. [Google Scholar] [CrossRef]
  63. Pattie, R.W., Jr.; Callahan, N.B.; Cude-Woods, C.; Adamek, E.R.; Broussard, L.J.; Clayton, S.M.; Currie, S.A.; Dees, E.B.; Ding, X.; Engel, E.M.; et al. (UCN-τ Collaboration) Measurement of the neutron lifetime using a magneto-gravitational trap and in situ detection. Science 2018, 360, 627. [Google Scholar] [CrossRef] [PubMed]
  64. (Particle Data Group) Zyla, P.A.; Barnett, R.M.; Beringer, J.; Dahl, O.; Dwyer, D.A.; Groom, D.E.; Lin, C.-J.; Lugovsky, K.S.; Pianori, E.; Robinson, D.J.; et al. Review of Particle Physics. Prog. Theor. Exp. Phys. 2020, 8, 083C01. [Google Scholar] [CrossRef]
  65. Rajan, A.; Desai, S. A meta-analysis of neutron lifetime measurements. Prog. Theor. Exp. Phys. 2020, 2020, 013C01. [Google Scholar] [CrossRef]
  66. Fornal, B.; Grinstein, B. Dark Matter Interpretation of the Neutron Decay Anomaly. Phys. Rev. Lett. 2018, 120, 191801. [Google Scholar] [CrossRef]
  67. Berezhiani, Z. Neutron lifetime puzzle and neutron-mirror neutron oscillation. Euro. Phys. J. C 2019, 79, 484. [Google Scholar] [CrossRef]
  68. Berezhiani, Z. Neutron lifetime and dark decay of the neutron and hydrogen. Lett. High Energy Phys. 2019, 2, 10. [Google Scholar] [CrossRef]
  69. Czarnecki, A.; Marciano, W.J.; Sirlin, A. Neutron Lifetime and Axial Coupling Connection. Phys. Rev. Lett. 2018, 120, 202002. [Google Scholar] [CrossRef]
  70. Dubbers, D.; Saul, H.; Märkisch, B.; Soldner, T.; Abele, H. Exotic Decay Channels Are Not the Cause of the Neutron Lifetime Anomaly. Phys. Lett. B 2019, 791, 6. [Google Scholar] [CrossRef]
  71. Broussard, L.J.; Barrow, J.L.; DeBeer-Schmitt, L.; Dennis, T.; Fitzsimmons, M.R.; Frost, M.J.; Gilbert, C.E.; Gonzalez, F.M.; Heilbronn, L.; Iverson, E.B.; et al. Experimental Search for Neutron to Mirror Neutron Oscillations as an Explanation of the Neutron Lifetime Anomaly. Phys. Rev. Lett. 2022, 128, 212503. [Google Scholar] [CrossRef]
  72. Jackson, J.D.; Treiman, S.B.; Wyld, H.W. Possible Tests of Time Reversal Invariance in Beta Decay. Phys. Rev. 1957, 106, 517. [Google Scholar] [CrossRef]
  73. Nico, J.S. Neutron beta decay. J. Phys. G 2009, 36, 104001. [Google Scholar] [CrossRef]
  74. Hickerson, K.P.; Sun, X.; Bagdasarova, Y.; Bravo-Berguño, D.; Broussard, L.J.; Brown, M.A.-P.; Carr, R.; Currie, S.; Ding, X.; Filippone, B.W.; et al. First direct constraints on Fierz interference in free-neutron β decay. Phys. Rev. C 2017, 96, 042501. [Google Scholar] [CrossRef]
  75. Saul, H.; Roick, C.; Abele, H.; Mest, H.; Klopf, M.; Petukhov, A.K.; Soldner, T.; Wang, X.; Werder, D.; Märkisch, B. Limit on the Fierz Interference Term B from a Measurement of the Beta Asymmetry in Neutron Decay. Phys. Rev. Lett. 2020, 125, 112501. [Google Scholar] [CrossRef] [PubMed]
  76. González-Alonso, M.; Naviliat-Cuncic, O.; Severijns, N. New physics searches in nuclear and neutron β decay. Prog. Part. Nucl. Phys. 2019, 104, 165. [Google Scholar] [CrossRef]
  77. Marciano, W.J.; Sirlin, A. Improved calculation of electroweak radiative corrections and the value of Vud. Phys. Rev. Lett. 2006, 96, 032002. [Google Scholar] [CrossRef]
  78. Brown, M.A.-P.; Dees, E.B.; Adamek, E.; Allgeier, B.; Blatnik, M.; Bowles, T.J.; Broussard, L.J.; Carr, R.; Clayton, S.; Cude-Woods, C.; et al. New result for the neutron β-asymmetry parameter A0 from UCNA. Phys. Rev. C 2018, 97, 035505. [Google Scholar] [CrossRef]
  79. Schumann, M.; Schumann, M.; Kreuz, M.; Deissenroth, M.; Glück, F.; Krempel, J.; Märkisch, B.; Mund, D.; Petoukhov, A.; Soldner, T. Measurement of the Proton Asymmetry Parameter in Neutron Beta Decay. Phys. Rev. Lett. 2008, 100, 151801. [Google Scholar] [CrossRef]
  80. Märkisch, B.; Mest, H.; Saul, H.; Wang, X.; Abele, H.; Dubbers, D.; Klopf, M.; Petoukhov, A.; Roick, C.; Soldner, T.; et al. Measurement of the Weak Axial-Vector Coupling Constant in the Decay of Free Neutrons Using a Pulsed Cold Neutron Beam. Phys. Rev. Lett. 2019, 122, 242501. [Google Scholar] [CrossRef]
  81. Mund, D.; Märkisch, B.; Deissenroth, M.; Krempel, J.; Schumann, M.; Abele, H.; Petoukhov, A.; Soldner, T. Determination of the Weak Axial Vector Coupling λ=gA/gV from a Measurement of the β-Asymmetry Parameter A in Neutron Beta Decay. Phys. Rev. Lett. 2013, 110, 172502. [Google Scholar] [CrossRef]
  82. Darius, G.; Byron, W.A.; DeAngelis, C.R.; Hassan, M.T.; Wietfeldt, F.E.; Collett, B.; Joneset, G.L.; Dewey, M.S.; Mendenhall, M.P.; Nico, J.S.; et al. Measurement of the Electron-Antineutrino Angular Correlation in Neutron β Decay. Phys. Rev. Lett. 2017, 119, 042502. [Google Scholar] [CrossRef]
  83. Beck, M.; Ayala Guardia, F.; Borg, M.; Kahlenberg, J.; Muñoz Horta, R.; Schmidt, C.; Wunderle, A.; Heil, W.; Maisonobe, R.; Simson, M.; et al. Improved determination of the β-νe¯ angular correlation coefficient a in free neutron decay with the SPECT spectrometer. Phys. Rev. C 2020, 101, 055506. [Google Scholar] [CrossRef]
  84. Hardy, J.C.; Towner, I.S. Superallowed 0+→0+ nuclear β decays: 2014 critical survey, with precise results for Vud and CKM unitarity. Phys. Rev. C 2015, 91, 025501. [Google Scholar] [CrossRef]
  85. Towner, I.S.; Hardy, J.C. The evaluation of Vud and its impact on the unitarity of the Cabibbo–Kobayashi–Maskawa quark-mixing matrix. Rep. Prog. Phys. 2010, 73, 046301. [Google Scholar] [CrossRef]
  86. Hardy, J.C.; Towner, I.S. CKM unitarity normalization tests, present and future. Ann. Phys. 2013, 525, 443. [Google Scholar] [CrossRef]
  87. Belfatto, B.; Beradze, R.; Berezhiani, Z. The CKM unitarity problem: A trace of new physics at the TeV scale? Euro. Phys. J. C 2020, 80, 149. [Google Scholar] [CrossRef]
  88. Abel, C.; Ayres, N.; Bison, G.; Bodek, K.; Bondar, V.; Chiu, P.-J.; Daum, M.; Emmenegger, S.; Flaux, P.; Ferraris-Bouchez, L.; et al. Statistical sensitivity of the nEDM apparatus at PSI to neutron mirror-neutron oscillations. EPJ Web Conf. 2019, 219, 07001. [Google Scholar] [CrossRef]
  89. Anghel, A.; Atchison, F.; Blau, B.; van den Brandt, B.; Daum, M.; Doelling, R.; Dubs, M.; Duperrex, P.-A.; Fuchs, A.; George, D.; et al. The PSI ultra-cold neutron source. Nucl. Instrum. Methods Phys. Res. A 2009, 611, 272. [Google Scholar] [CrossRef]
  90. Lauss, B.; Blau, B. UCN, the ultracold neutron source – neutrons for particle physics. Sci. Post Phys. Proc. 2021, 5, 4. [Google Scholar] [CrossRef]
  91. Baker, C.A.; Chibane, Y.; Chouder, M.; Geltenbort, P.; Green, K.; Harris, P.G.; Heckel, B.R.; Iaydjiev, P.; Ivanov, S.N.; Kilvington, I.; et al. Apparatus for measurement of the electric dipole moment of the neutron using a cohabiting atomic-mercury magnetometer. Nucl. Instrum. Methods Phys. Res. A 2014, 736, 184. [Google Scholar] [CrossRef]
  92. Abel, C.; Ayres, N.; Ban, G.; Bison, G.; Bodek, K.; Bondar, V.; Chanel, E.; Chiu, P.-J.; Daum, M.; Emmenegger, S.; et al. nEDM experiment at PSI: Data-taking strategy and sensitivity of the dataset. EPJ Web Conf. 2019, 219, 02001. [Google Scholar] [CrossRef]
  93. Ban, G.; Bison, G.; Bodek, K.; Daum, M.; Fertl, M.; Franke, B.; Grujić, Z.D.; Heil, W.; Horras, M.; Kasprzak, M.; et al. Demonstration of sensitivity increase in mercury free-spin-precession magnetometers due to laser-based readout for neutron electric dipole moment searches. Nucl. Instrum. Methods Phys. Res. A 2018, 896, 129. [Google Scholar] [CrossRef]
  94. Abel, C.; Afach, S.; Ayres, N.J.; Ban, G.; Bison, G.; Bodek, K.; Bondar, V.; Chanel, E.; Chiu, P.-J.; Crawford, C.B.; et al. Optically pumped Cs magnetometers enabling a high-sensitivity search for the neutron electric dipole moment. Phys. Rev. A 2020, 101, 053419. [Google Scholar] [CrossRef]
  95. Afach, S.; Ban, G.; Bison, G.; Bodek, K.; Chowdhuri, Z.; Daum, M.; Fertl, M.; Franke, B.; Geltenbort, P.; Grujić, Z.D.; et al. A device for simultaneous spin analysis of ultracold neutrons. Euro. Phys. J. A 2015, 51, 143. [Google Scholar] [CrossRef]
  96. Ban, G.; Bison, G.; Bodek, K.; Chowdhuri, Z.; Geltenbort, P.; Griffith, W.C.; Hélaine, V.; Henneck, R.; Kasprzak, M.; Kermaidic, Y.; et al. Ultracold neutron detection with 6Li-doped glass scintillators. Euro. Phys. J. A 2016, 52, 326. [Google Scholar] [CrossRef]
  97. Abel, C.; Ayres, N.J.; Baker, T.; Ban, G.; Bison, G.; Bodek, K.; Bondar, V.; Crawford, C.B.; Chiu, P.-J.; Chanel, E.; et al. Magnetic field uniformity in neutron electric dipole moment experiments. Phys. Rev. A 2019, 99, 042112. [Google Scholar] [CrossRef]
  98. Abel, C.; Ayres, N.J.; Ban, G.; Bison, G.; Bodek, K.; Bondar, V.; Chanel, E.; Chiu, P.-J.; Clément, B.; Crawford, C.B.; et al. Mapping of the magnetic field to correct systematic effects in a neutron electric dipole moment experiment. Phys. Rev. A 2022, 106, 032808. [Google Scholar] [CrossRef]
  99. Afach, S.; Bison, G.; Bodek, K.; Burri, F.; Chowdhuri, Z.; Daum, M.; Fertl, M.; Franke, B.; Grujić, Z.; Hélaine, V.; et al. Dynamic stabilization of the magnetic field surrounding the neutron electric dipole moment spectrometer at the Paul Scherrer Institute. J. Appl. Phys. 2014, 116, 084510. [Google Scholar] [CrossRef]
  100. Kassiopeia Toolkit. Available online: https://github.com/KATRIN-Experiment/Kassiopeia (accessed on 1 February 2023).
  101. Bogorad, Z.; Mohanmurthy, P.; Formaggio, J.A. Ultracold neutron storage simulation using the Kassiopeia software package. New J. Phys. 2022, 24, 023007. [Google Scholar] [CrossRef]
  102. Golub, R.; Richardson, D.; Lamoreaux, S.K. Ultra-Cold Neutrons; CRC Press: Boca Raton, FL, USA, 1991. [Google Scholar] [CrossRef]
  103. Mohanmurthy, P. A Search for Neutron to Mirror-Neutron Oscillations. Ph.D Thesis, ETH Zurich, Zürich, Switzerland, 2019. [Google Scholar] [CrossRef]
  104. Abel, C.; Ayres, N.J.; Ban, G.; Bison, G.; Bodek, K.; Bondar, V.; Chanel, E.; Chiu, P.-J.; Crawford, C.; Daum, M.; et al. A search for neutron to mirror-neutron oscillations using the nEDM apparatus at PSI. Phys. Lett. B 2021, 812, 135993. [Google Scholar] [CrossRef]
  105. Atchison, F.; Blau, B.; Daum, M.; Fierlinger, P.; Geltenbort, P.; Gupta, M.; Henneck, R.; Heule, S.; Kasprzak, M.; Knecht, A.; et al. Measurement of the Fermi potential of diamond-like carbon and other materials. Nucl. Instrum. Methods Phys. Res. B 2007, 260, 647. [Google Scholar] [CrossRef]
  106. Atchison, F.; Blau, B.; Daum, M.; Fierlinger, P.; Geltenbort, P.; Henneck, R.; Heule, S.; Kasprzak, M.; Kirch, K.; Kohlik, K.; et al. Storage of ultracold neutrons in a volume coated with diamondlike carbon. Phys. Rev. C 2006, 74, 055501. [Google Scholar] [CrossRef]
  107. Bondar, V.; Chesnevskaya, S.; Daum, M.; Franke, B.; Geltenbort, P.; Göltl, L.; Gutsmiedl, E.; Karch, J.; Kasprzak, M.; Kessler, G.; et al. Losses and depolarization of ultracold neutrons on neutron guide and storage materials. Phys. Rev. C 2017, 96, 035205. [Google Scholar] [CrossRef]
  108. Bodek, K.; Daum, M.; Hennecka, R.; Heule, S.; Kasprzak, M.; Kircha, K.; Knecht, A.; Kuzńiak, M.; Lauss, B.; Meier, M.; et al. Storage of ultracold neutrons in high resistivity, non-magnetic materials with high Fermi potential. Nucl. Instrum. Methods Phys. Res. A 2008, 597, 222. [Google Scholar] [CrossRef]
  109. Afach, S.; Ayres, N.J.; Ban, G.; Bison, G.; Bodek, K.; Chowdhuri, Z.; Daum, M.; Fertl, M.; Franke, B.; Griffith, W.C.; et al. Observation of Gravitationally Induced Vertical Striation of Polarized Ultracold Neutrons by Spin-Echo Spectroscopy. Phys. Rev. Lett. 2015, 115, 162502. [Google Scholar] [CrossRef] [PubMed]
  110. James, F. Statistical Methods in Experimental Physics, 2nd ed.; World Scientific: Singapore, 2006. [Google Scholar] [CrossRef]
  111. Zsigmond, G. The MCUCN simulation code for ultracold neutron physics. Nucl. Instrum. Methods Phys. Res. A 2018, 881, 16. [Google Scholar] [CrossRef]
  112. Afach, S.; Ayres, N.J.; Baker, C.A.; Ban, G.; Bison, G.; Bodek, K.; Fertl, M.; Franke, B.; Geltenbort, P.; Green, K.; et al. Gravitational depolarization of ultracold neutrons: Comparison with data. Phys. Rev. D 2015, 92, 052008. [Google Scholar] [CrossRef]
  113. Harris, P.G.; Pendlebury, J.M.; Devenish, N.E. Gravitationally enhanced depolarization of ultracold neutrons in magnetic-field gradients. Phys. Rev. D 2014, 89, 016011. [Google Scholar] [CrossRef]
  114. Pendlebury, J.M.; Richardson, D.J. Effects of gravity on the storage of ultracold neutrons. Nucl. Instrum. Methods Phys. Res. A 1994, 337, 504. [Google Scholar] [CrossRef]
  115. Abel, C.; Afach, S.; Ayres, N.J.; Baker, C.A.; Ban, G.; Bison, G.; Bodek, K.; Bondar, V.; Burghoff, M.; Chanel, E.; et al. Measurement of the Permanent Electric Dipole Moment of the Neutron. Phys. Rev. Lett. 2020, 124, 081803. [Google Scholar] [CrossRef]
  116. Serebrov, A.P.; Fomin, A.K. Monte Carlo simulation of quasi-elastic scattering and above-barrier neutrons in the neutron lifetime experiment MAMBO I. JETP Lett. 2009, 90, 555. [Google Scholar] [CrossRef]
  117. Serebrov, A.P.; Fomin, A.K. Neutron lifetime from a new evaluation of ultracold neutron storage experiments. Phys. Rev. C 2010, 82. [Google Scholar] [CrossRef]
  118. Research Computing Center at the University of Chicago. Available online: https://rcc.uchicago.edu/ (accessed on 3 February 2021).
Figure 1. The figure shows the measured values of V u d and λ in light of the neutron lifetime measurements. The diagonal gray bars are the two neutron lifetime measurements plotted according to Equation (5), as a function of λ ( V u d ) . The horizontal blue bars are weighted averages of the measured values of λ from experiments measuring β -decay correlation coefficients of A (Perkeo-III, 2019 [80]; UCNA, 2018 [78]; Perkeo-II, 2013 [81]) and a (aCORN, 2017 [82]; aSPECT, 2020 [83]); the whole horizontal gray bar shows the global average value of λ shown in Equation (6). The vertical red bar represents V u d from the global analysis of 0 + 0 +   β -decay in Equation (9), and the vertical magenta bar represents V u d obtained from CKM unitarity in Equation (10). Note that the data points representing measurements of λ are plotted as functions of the publication date, and do not correspond to the top-horizontal axis, which represents a scale of V u d . A post-2002 measurement of λ via C by ref. [79] (2008) is also shown.
Symmetry 15 01899 g001
Figure 2. (Top) The decay curve showing the monitor-normalized neutrons counted as functions of storage time, t s . The black (cross) data points are the experimental values measured using the nEDM storage chamber. Each red (circle) data point (Top) represents the best value of n ( t s ) in Equation (16), for a particular storage time, obtained using the numerical loss model, as explained in the text. The blue curve (and the associated reduced χ 2 ) corresponds to the double exponential fit yielding the lifetimes in Equation (11). (Bottom) Plot showing the range of residuals obtained by comparing each of the experimental values (black crosses) with a set of numerical loss model values of n ( t s ) in Equation (16) (the best value of which is shown as red circles).
Symmetry 15 01899 g002
Figure 3. Plot showing sample sets of energy distributions for the UCNs. The red curves represent those that used parameters of { P 0 , ρ , E p , w ; τ n } that only passed the Fisher statistical test in Equation (17) within a 68.3% C.L. The curves in orange represent the spectra at the beginning of storage, t s = 0 . The blue curves indicate those that, in addition to the Fisher test, also pass the center of mass constraint from Equation (20) at t s = 180 s of the storage time.
Symmetry 15 01899 g003
Figure 4. Plot showing the center of mass, z , values as blue points, along with their associated reduced χ 2 , for every set of five parameters sampled that passed the Fisher statistical test. A 68.3 % C.I. was extracted from the numerical loss model alone and has graphically been indicated here, as well as in Equation (19). The dotted blue line indicates the envelop of the dense stable solutions, along with the uncertainty (68.3% C.I.) of z value obtained in this model, which has been reported in Equation (19). The red vertical lines indicate the additional condition in Equation (20) used to further narrow down the accepted parameter space. The solid red line indicates the central value and the dotted red lines indicate the uncertainty (68.3% C.I.), both for the z value in Equation (20).
Symmetry 15 01899 g004
Figure 5. Plot showing the values of sampled τ n and the corresponding value of reduced χ 2 . Since there are four other freely sampled parameters of { P 0 , ρ , E p , w } in the model, each value of τ n may have multiple values of reduced χ 2 associated with it. The red points represent all the sampled points, the black points represent samples that only passed the Fisher statistical test in Equation (17), and the blue points also satisfy the center of mass constraint in Equation (20). The blue line envelops the stable solution region, and its relevant features are focused on in the inset figure, without the sample (red, black, and blue) data points. The inset shows the best-reduced χ 2 as a function of the sampled values of τ n in solid blue line, where the blue shaded region is the 68.3 % C.I. uncertainty obtained from repeating the MC sampling.
Symmetry 15 01899 g005
Table 1. Important surface parameters used in the loss model. The circular inner surface of the cylindrical UCN storage chamber is coated with dPS, and the flat inner surfaces are coated with DLC.
Param. V F (neV) η S
Surface
DLC ( 220 ± 10 ) [105] ( 3.1 ± 0.9 ) × 10 4 [106]
dPS ( 165 ± 10 ) [107] ( 3.0 ± 1.0 ) × 10 4 [108]
Table 2. Table showing the uncertainty contributions ( 68.3 % ) of the parameters of V F , n, and η S , to the value of τ n * extracted in Equation (21).
Errors from + σ τ n * (s) σ τ n * (s)
Statistical:n15878
Systematic: η S 226112
V F 4221
Total: 279138
Disclaimer/Publisher’s Note: The statements, opinions and data contained in all publications are solely those of the individual author(s) and contributor(s) and not of MDPI and/or the editor(s). MDPI and/or the editor(s) disclaim responsibility for any injury to people or property resulting from any ideas, methods, instructions or products referred to in the content.

