Article

A Novel Evolutionary Algorithm: One-Dimensional Subspaces Optimization Algorithm (1D-SOA)

by
Gabriela Berenice Díaz-Cortés
1 and
René Luna-García
2,*
1
Instituto Mexicano del Petroléo, Eje Céntral Lázaro Cárdenas 152, Col. San Bartolo Atepehuacan, Mexico City 07730, Mexico
2
Centro de Investigación en Computación, Instituto Politécnico Nacional, Esq. Miguel Othón de Mendizábal, Av. Juan de Díos Bátiz, Col. Nueva Industrial, Mexico City 07738, Mexico
*
Author to whom correspondence should be addressed.
Symmetry 2023, 15(10), 1873; https://doi.org/10.3390/sym15101873
Submission received: 9 June 2023 / Revised: 3 October 2023 / Accepted: 3 October 2023 / Published: 5 October 2023
(This article belongs to the Topic Applied Metaheuristic Computing: 2nd Volume)

Abstract

:
This paper introduces an evolutionary algorithm for n-dimensional single objective optimization problems: One-Dimensional Subspaces Optimization Algorithm (1D-SOA). The algorithm starts with an initial population in randomly selected positions. For each individual, a percentage of the total number of dimensions is selected, each dimension corresponding to a one-dimensional subspace. Later, it performs a symmetric search for the nearest local optima in all the selected one-dimensional subspaces (1D-S), for each individual at a time. The search stops if the new position does not improve the value of the objective function over all the selected 1D-S. The performance of the algorithm was compared against 11 algorithms and tested with 30 benchmark functions in 2 dimensions (D) and 30D. The proposed algorithm showed a better performance than all other studied algorithms for large dimensions.

1. Introduction

Everyday life requires finding optimal solutions in a faster way to reduce costs and computational times, and to increase productivity or revenues. Finding the best or less costly route, setting up an optimal schedule, reducing production times, and controlling engineering systems are some examples of optimization problems. Therefore, optimization techniques are relevant in broad areas of life, which makes the continuous research and improvement in existing algorithms necessary [1,2,3,4].
Global optimization is concerned with finding the global solution for which the objective function obtains its smallest value. Formally, global optimization seeks a global solution of a constrained optimization model.
When only one function is optimized, the problem is referred to as a single objective optimization problem, while if two or more fitness functions are optimized, it is called a multiobjective problem.
The fitness function is regarded as a mapping x f ( x ) , where x R n is a multidimensional decision variable, and  f ( x ) R is part of the objective space Ω . Thus, we have a mapping R n R . Given a function f ( x ) R , the solution to the optimization problem is a vector x , such that the fitness function is close to its optimum value, i.e., it satisfies | f ( x ) f ( x m i n / m a x ) | < ϵ , where x m i n / m a x is the vector that gives the minimum or maximum value of the objective function, that is, the vector that minimizes or maximizes the objective function.
Among others, metaheuristic methods are efficient techniques to solve optimization problems [5]. These methods use an iterative process to improve an initial solution up to a selected termination criterion, within a reasonable time and with low computational costs. There are several classifications for metaheuristics; Beheshti et al. [6] classify them as nature [1,7,8,9,10,11,12,13,14,15,16,17] and non-nature inspired [2,18,19,20], population-based, single point search, dynamic and static objective function, single and various neighborhood structures, and memory usage and memory-less methods, among others.
Population-based metaheuristic algorithms have been broadly studied for global searches, as they can handle high-dimensional optimization problems. They present exploration and exploitation capabilities where exploration is related to the generation of new individuals in unexplored regions of the search space, while exploitation focuses the search in the neighborhood of known solutions [21]. Too much of the former can lead to an inefficient search, and too much of the latter can lead to a propensity to focus the search too quickly, losing many possible solutions [22].
A good balance between exploration and exploitation is required to avoid the trapping of the particles into local optima (premature convergence), and to find a good optimal solution in a few iterations [23]. Recent works try to incorporate local search with exploration to achieve the better performance of the algorithms. The most popular heuristic algorithms are the particle swarm optimization algorithm (PSO) [18,24,25] and the Differential Evolution Algorithm [26,27], which have been modified numerous times to improve their local and global search capabilities [28,29,30]. In a study by Sun et al. [31], the Whale Optimization Algorithm (WOA) is modified to perform a more detailed local search. The Butterfly Optimization Algorithm (BOA) is also improved by Li et al. [1] to achieve a balance between exploration and exploitation. The Polar Bear Optimization Algorithm (PBO) [9] was proposed, taking into account an efficient birth and death mechanism to improve global and local search.
In recent years, new algorithms have been proposed with new local and global search models, some examples of these are: Artificial ecosystem-based optimization (AEO) [32], Jellyfish-inspired metaheuristic (JF) [33], Chaos Game Oprimizer (CGO) [34], Zebra Optimization Algorithm (ZOA), [35], Chameleon Swarm Algorithm (CSA) [36], Serval Optimization Algorithm (SOA) [37], optimization problems based on walruses behavior (OWB) [38], LSHADE-SPACMA Algorithm [39], Coronavirus Optimization Algorithm (COA) [40], Gaining-Sharing Knowledge Based Algorithm With Adaptive Parameters (APKBS) [41], and Improving Multi-Objective Differential Evolution Algorithm (IMODE) [42], etc.
Some of the most efficient metaheuristics are the Evolutionary Algorithms (EAs), which are flexible enough to solve different types of problems due to their exploration and exploitation capabilities. They are distinguished from Genetic Algorithms (GA) in the way they combine information through evolutionary operators that evolve the population, obtaining a set of new solutions [43]. These methods can solve problems of high computational complexity or high dimensional problems.
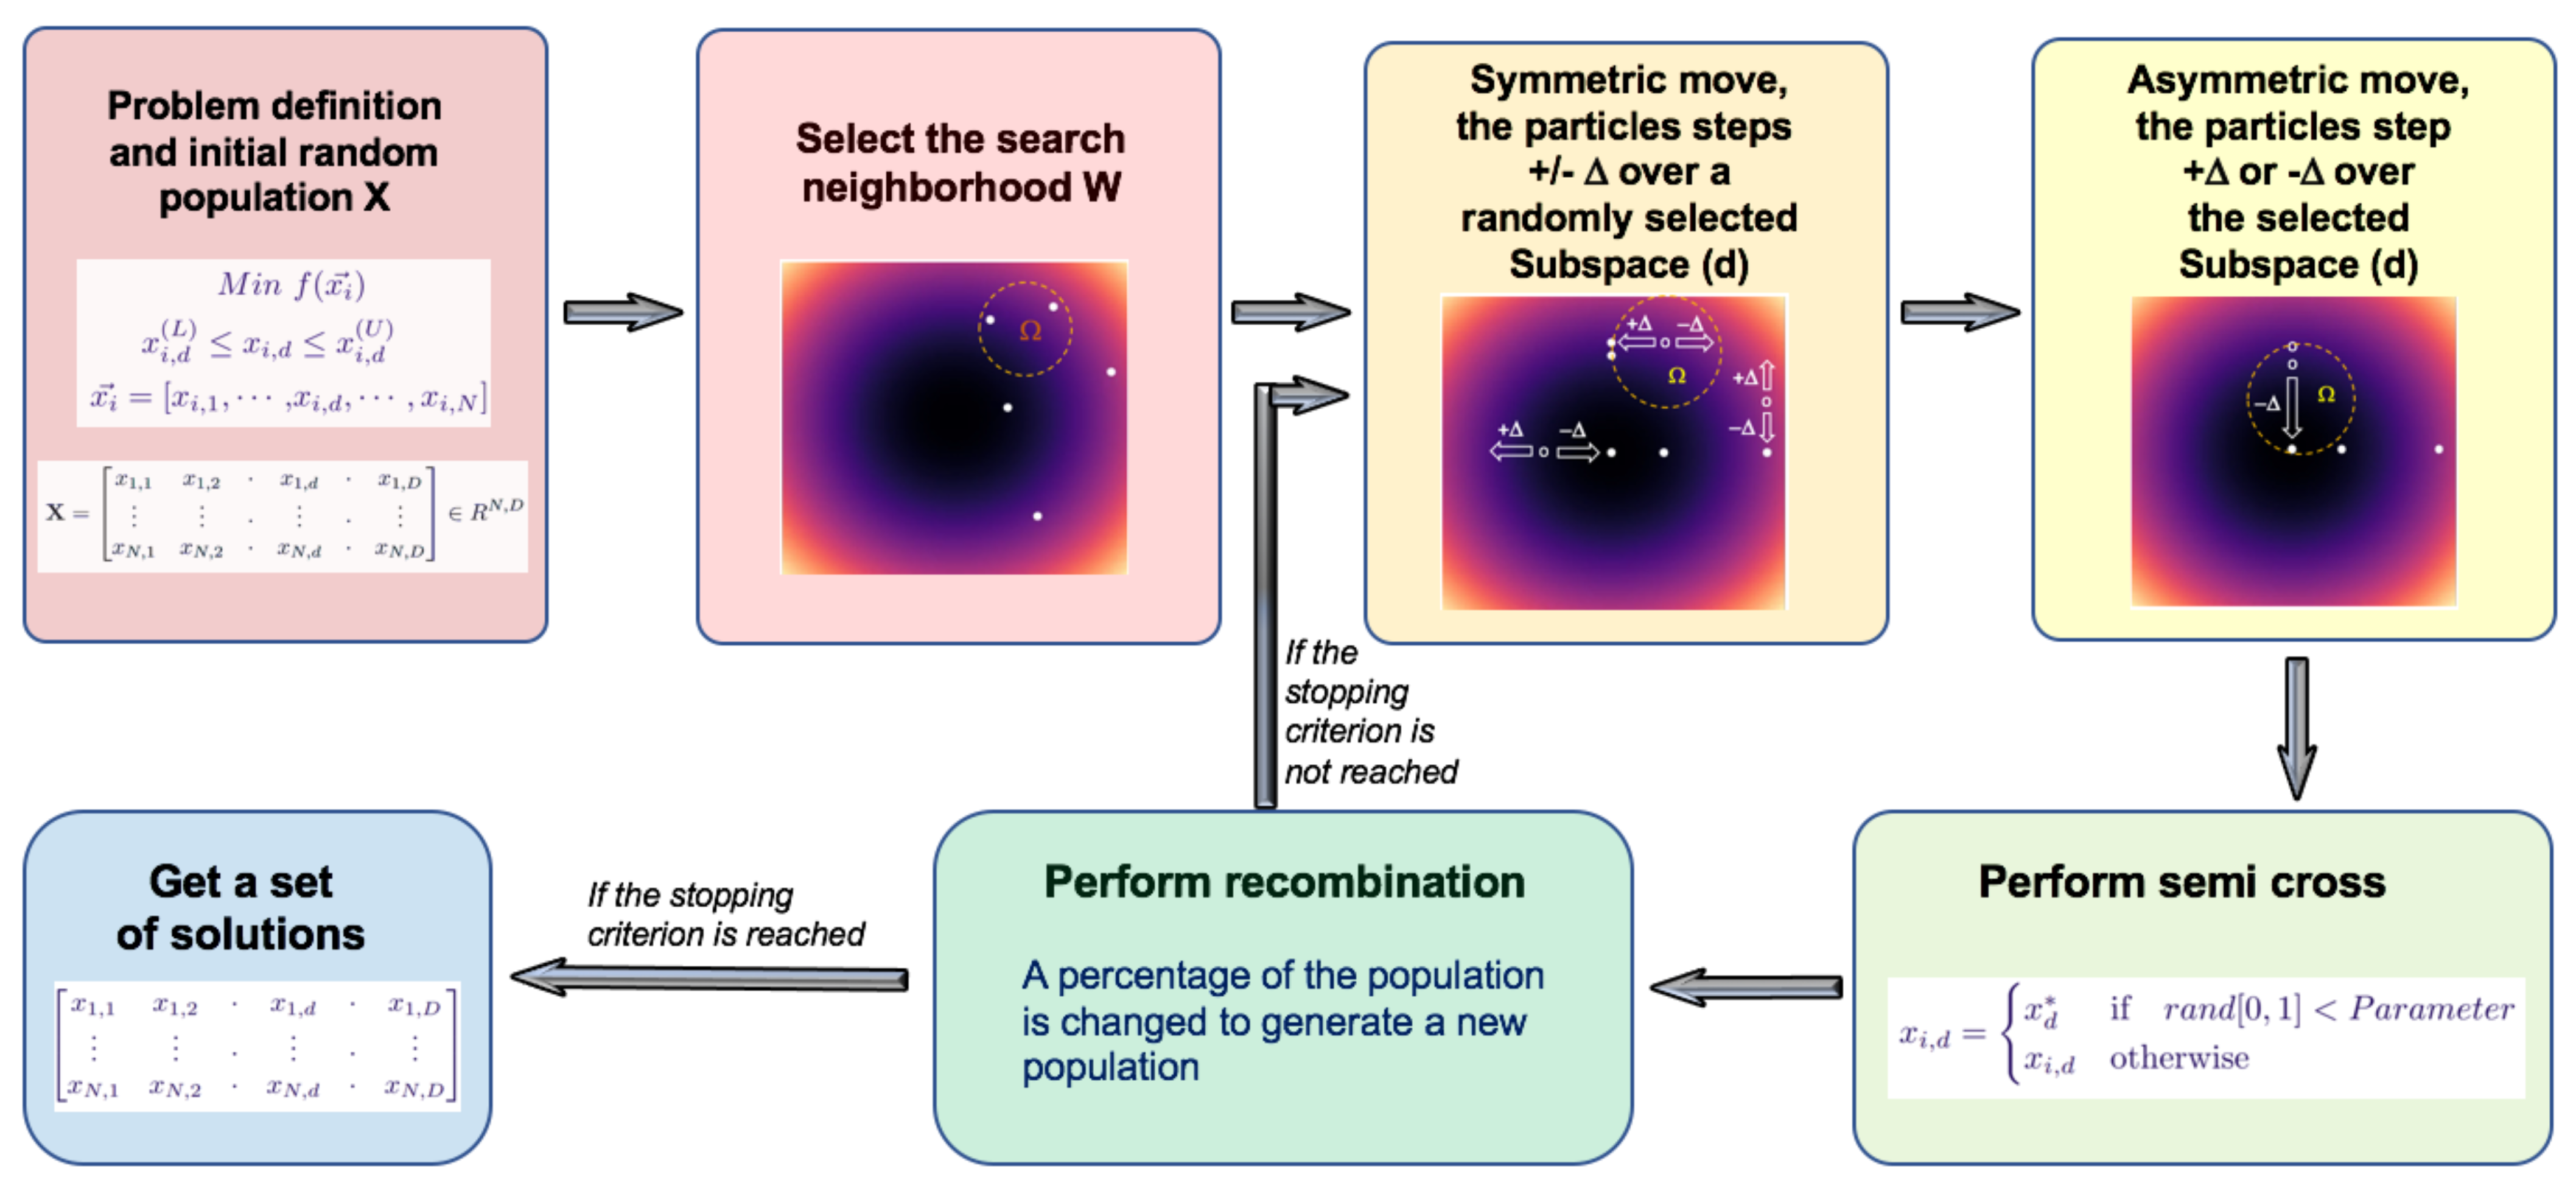
This work proposes a novel optimization method of the evolutionary type: the One-Dimensional Subspaces Optimization Algorithm (1D-SOA). This algorithm performs an exhaustive local search or exploitation, by updating the position of each individual of a randomly generated population, over a selected direction. This search generates a large number of optimal local sets. The search neighborhood is changed randomly, increasing, in this way, the local search space. Nevertheless, this is not the only characteristic of the algorithm. During the whole process, it also performs exploration, by generating diversity via the recombination of the initial population, which favors a convergence towards the global optimum. The algorithm is tested for single-objective optimization problems. More details of the algorithm are presented in Section 3.
This work is structured as follows, in Section 2, the theory related to single objective optimization problems is presented. Later, in Section 3, 1D-SOA is introduced, together with details about its implementation and some EAs used for comparison. After that, the results and discussion are presented in Section 4. Finally, the conclusions and references are given in Section 5.

2. Optimization

In this section, the theory of unconstrained optimization is presented. Additionally, some concepts related to metaheuristic optimization are introduced.

2.1. Unconstrained Single Objective Optimization

Unconstrained single-objective optimization problems are defined in terms of the decision variables, the objective function to be optimized, and the set of feasible solutions. The set of all feasible solutions is called the feasible region or search space, and it is commonly denoted by Ω . The decision variables are numerical quantities related to the optimization problem. These quantities are denoted as x d with d = 1 , 2 , , D [44,45]. The vector x Ω composed of D decision variables is represented by the following:
x = x 1 , x 2 , , x D T .
The objective function, which is a function of the decision variables, is minimized or maximized according to the problem’s criteria. The restrictions are related to the limits of the variables, that is, they restrict each decision variable x d in the decision space, within a lower range x d ( L ) and an upper range x d ( U ) . The formal definition is presented below.
The unconstrained single-objective optimization problem is defined as follows:
M i n / M a x f ( x ) , x d ( L ) x d x d ( U ) .
If the objective function is linear, it is considered a linear problem, otherwise, it is non-linear [46]. This work addresses unconstrained non-linear optimization problems; in particular, the optimization of a set of benchmark functions is studied.

2.2. Metaheuristics

Metaheuristics are optimization methods that combine local improvement procedures and high-level strategies to escape from local optima, performing a robust search in the solution space. These algorithms have stochastic behavior and mimic biological or physical processes. The fundamental phases of the metaheuristics are as follows [47]:
  • Initialize population;
  • Define stop condition;
  • Evaluate fitness function;
  • Update and move agents;
  • Return the global best solution.
Each metaheuristic defines a particular movement of the population according to the process they want to mimic. Depending on the part of the search space that the method covers, the algorithm can find local or global optima. Next, some concepts related to the search methodology performed by some metaheuristics, in particular used by 1D-SOA, are presented.

2.2.1. Local Search

Local search algorithms explore the neighborhood of the current point to find a better solution, i.e., the local optimum. The search starts with a random feasible point, then, a generation or movement mechanism is successively applied to optimize the fitness function. If a better solution is found, it becomes the current solution. This procedure is repeated up to a stopping criterion. Local search heuristics select one or, at most, two neighborhoods for improving the current solution (i.e., k m a x 2 ), and they converge to local optima [3].

2.2.2. Exploration

EAs usually converge to local optima. However, the search space may contain much better solutions in other regions. Additionally, the optima can be duplicated, leading to uniformity. Therefore, to find an optimal solution, the EAs should keep moving to unexplored regions trying to reach a better solution. This can be done by mutating duplicates, via the use of a recombination operation to replace part of the population [23]. The process of moving to distant or unexplored regions is commonly known as exploration.

2.2.3. Variable Neighborhood Search

Variable neighborhood search (VNS) is a metaheuristic for solving global optimization problems, based on a systematic change of neighborhood. This method continues the search after finding the first local minimum by selecting a new neighborhood to escape the local valley.
The neighborhoods search is based on the empirical idea that a local optimum can be related to the global one, for example by sharing some components of the position. Therefore, a study of the neighborhoods of a local optimum can lead to the discovery of a better one. The neighborhoods are denoted as N k , k = 1 , . . . , k m a x , where the selection of a neighborhood depends on the framework, which can be stochastic, deterministic, or a combination of both [3]. Reaching the global optimum is more likely if the search is performed in various neighborhoods rather than a single structure.

2.2.4. Swarm Intelligence

Swarm Intelligence (SI) is a branch of Computational Intelligence (CI) that originated from the study of the social behavior of insects, animals, and human societies (individuals) [3,47,48]. A SI system consists of a population of individuals or agents that controls their behavior autonomously, and each individual represents a possible solution.
For the swarm, there is no central coordination and it can consist of a few to up to thousands of agents interacting among themselves and with the environment, without a change of control architecture. Therefore, SI systems are robust and scalable. Furthermore, no single agent is essential for the swarm, which gives the swarm its characteristic flexibility [3,23,47]. SI algorithms evolve a population of possible problem solutions which improve with each iteration, therefore, they are considered to be an EA [23]. The method introduced in this work is a population-based evolutionary algorithm that performs a search for better solutions on a randomly selected dimension d. The particles present communication among themselves, which makes it a Swarm Intelligence system, details about the algorithm are presented in the next section.

3. Methodology

In this section, the basic ideas behind 1D-SOA, together with the implementation of the algorithm, are presented.
1D-SOA:
  • Initialization: 1D-SOA starts by randomly generating an initial D-dimensional population within the given search space. The fitness value of each individual or particle x i R D is computed, and the best particle is spotted x .
    The initial population is a set of N individuals, denoted by P ( 0 ) = { x 1 , x 2 , , x N } , with
    x i = x i , 1 , x i , 2 , , x i , d , , x i , D T Ω ,
    where the subscript i , d , where d [ 1 , D ] in x i , d represents the d-th component of the i-th particle x i .
  • Symmetric selection of search direction d o f f : Once the initial population is constructed, a dimension d o f f is chosen, and the position of the particles is updated a step Δ over the selected 1D-S. To select the dimension, D t e s t directions are randomly generated and tested by moving the particle s t e p s times symmetrically. The direction with the best value of the objective function is selected as the search direction ( d o f f ). The values D t e s t and s t e p s can be selected by the user.
  • Step Δ: 1D-SOA includes a Variable Neighborhood Search (VNS) with two neighborhoods ( N 1 and N 2 ). The size of N 1 depends on a parameter C n e i g h . The step in this neighborhood is chosen randomly according to Gaussian distribution with mean 0 and variance C n e i g h .
    Δ = | r a n d [ 0 , C n e i g h ] | N 1 .
    For N 2 , a smaller random parameter C n e i g h l , is used with mean 0 and variance C n e i g h l .
    Δ = | r a n d [ 0 , C n e i g h l ] ) N 2 .
    This second neighborhood performs a more local search. The neighborhood is selected for each particle, depending on a random criterion denoted as P n s , referred to as the probability of neighborhood search. For the selection, a random number from a uniform distribution from 0 to 1 is obtained; if the number is smaller than P n s , the search is performed in N 1 , otherwise it is performed in N 2 . This criterion is presented in Equation (4):
    Δ = Δ N 1 , if r a n d [ 0 , 1 ] < P n s , Δ N 2 , otherwise .
    Once the neighborhood is selected, the value of the delta is updated as follows:
    Δ = Δ | r a n d [ 0 , 1 ] | .
  • Asymmetric movement operator: The position of the particle varies asymmetrically during the iteration process. That is, it moves only in the direction where the objective function improves. For a particle x i at the t-th iteration, it is denoted by
    x i ( t ) = x i , 1 ( t ) e ^ 1 + x i , 2 ( t ) e ^ 2 + + x i , d ( t ) e ^ d + + x i , D ( t ) e ^ D ,
    where e ^ d is the canonical normal vector in the d-th dimension. Similarly, the position of the same particle at time t + 1 is
    x i ( t + 1 ) = x i , 1 ( t ) e ^ 1 + x i , 2 ( t ) e ^ 2 + + x i , d ( t + 1 ) e ^ d + + x i , D ( t ) e ^ D .
    The position of each individual x i is updated over the selected dimension (see Equation (6)). That is, for a dimension d o f f , with  1 < d o f f < D , there is a change on the current d o f f component of the position vector of the individuals x i , d o f f ( t ) x i , d o f f ( t + 1 ) as follows:
    x i , d o f f ( t + 1 ) = x i , d o f f ( t ) ± Δ .
    The sign (+) or (−) of the update corresponds to the direction where the objective function improves. Combining Equations (6) and (7), the updated position at the ( t + 1 ) -th iteration is given by
    x ( t + 1 ) = x 1 ( t ) e ^ 1 + x 2 ( t ) e ^ 2 + + ( x d ( t ) ± Δ ) e ^ d + + x D ( t ) e ^ D .
    If the particle does not improve its objective function after two consecutive movements by a value ϵ , that is
    ( f ( x ( t + 1 ) ) f ( x ( t ) ) ) < ϵ ,
    the value of the delta is updated as
    Δ = Δ / 2 .
  • Semi cross: The probability of semi-cross is denoted by P s x ; if this criterion is satisfied, the worst N p a r x particles are selected. Later, the  d o f f -th component of the i-th particle, x i , d o f f , i { 1 , , N p a r x } , is substituted by the d o f f -th component of the best particle x d o f f , as presented in Equation (11)
    x i , d o f f = x d o f f if r a n d [ 0 , 1 ] < P s x x i , d o f f otherwise , i { 1 , , N p a r x } .
  • Recombination: The worst N r e c = N r D particles of the new population P ( i + 1 ) , where N r is the percentage of the initial population to recombine, is replaced by a set of recombined elements if the new elements lead to a better solution. The new population becomes
    P ( i + 1 ) = { x 1 ( i + 1 ) , x 2 ( i + 1 ) , . . . , x r ( i + 1 ) , . . . , x t ( i + 1 ) } ,
    where x r ( i + 1 ) , . . . , x t ( i + 1 ) are recombined elements.
    Recombination operator: Each selected element x α P is recombined as follows,
    R ( x α ) = x α r 1 ( x x α ) ,
    where r 1 is a random number between 0 and 1.
  • Stopping criterion: The stopping criterion is a selected number of generations.
  • Solutions: After the optimization cycle, a set S of optimal solutions of the problem is obtained
    S = { x 1 s o l , x 2 s o l , . . . , x N 1 s o l , x N s o l } .
The implementation of 1D-SOA is presented in Algorithm 1 and in Figure 1. The definition of the variables presented in this section and in Algorithm 1 are presented in Table 1. It is worth mentioning that, for the variables required for the 1D-SOA algorithm, only two of them change with the problem, the rest can be taken as fixed in any optimization problem.
Algorithm 1 One-Dimensional Search Optimization Algorithm (1D-SOA)
Input: N, D, M a x G , P n s , N d i m s , M a x ϵ , P s x , N p a r x , N r for the definitions see Table 1.
Output: A set of optimal solutions S.
  1:
P ( 0 ) P % Create a random initial population P ( 0 ) of N individuals ( x i R D ).
  2:
for generation = 1 to G  do
  3:
   for particle =1 to N do
  4:
     if  U n i f o r m R a n d [ 0 , 1 ] < P n s  then
  5:
         Δ N 1
  6:
     else
  7:
         Δ N 2 % Select the search neighborhood
  8:
     end if
  9:
     for  d = 1 to N d i m s  do
10:
        Symmetric selection of the search dimension d o f f
11:
         Δ = Δ a b s ( G a u s s R a n d [ 0 , 1 ] ) . % Update the step Δ
12:
        Asymmetric movement of the particles on dimension d o f f in direction ± Δ .
13:
        while ( f ( x i ( t + 1 ) ) f ( x i ( t ) ) < ϵ || I t e p s i l o n < M a x ϵ ) do
14:
           x i , d o f f ( t + 1 ) = x i , d o f f ( t ) ± Δ
15:
        end while
16:
        if  U n i f o r m R a n d [ 0 , 1 ] < P s x  then
17:
          for particle in Nparx do
18:
              x i , d o f f ( t + 1 ) = x , d o f f ( t + 1 ) % Perform semi cross
19:
          end for
20:
        end if
21:
        for particle in Nr*D do
22:
           x α = x α r 1 ( x x α ) % Perform recombination
23:
        end for
24:
     end for
25:
   end for
26:
   % Save the set S of solutions.
27:
end for

4. Results and Discussion

This section contains the results of the experiments performed to study the behavior of the 1D-SOA algorithm introduced in this work. The performance of 1D-SOA was compared against the heuristic algorithms from the python library SwarmPackagePy [49]; in particular, the studied algorithms from this library are Artificial Bee Algorithm (ABA) [50], Bat Algorithm (BA) [51], Bacterial Foraging Optimization (BFO) [52], Cat Swarm Optimization (CA) [17], Chicken Swarm Optimization (CHSO) [10], Cuckoo Search Optimization (CU) [13], Firefly algorithm (FA) [15], Fireworks Algorithm (FWA) [20], Gravitational Search Algorithm (GSA) [19], Grey Wolf Optimizer (GWO) [19], Particle Swarm Optimization (PSO) [18], and Social Spider Algorithm (SSA) [14]. Additionally, we include in the comparison some state-of-the-art algorithms: Mean particle Swarm Optimisation (MPSO) [53], Artificial ecosystem-based optimization (AEO) [32], Jellyfish inspired metaheuristic (JF) [33], Chaos Game Optimizer (CGO) [34], and Zebra Optimization Algorithm (ZOA) [35].
All algorithms require a basic number of input parameters: the number of individuals (N), dimension (D), number of maximum iterations ( N I t s ), and lower ( x ( L ) ) and upper ( x ( U ) ) limits in the search space. Additionally, some algorithms need a specific set of extra control parameters. Table 2 shows the specific parameters, together with the most common values used in the literature and this work. A brief discussion of the selection of parameters used for the MPSO, FWA, and CHSO is presented in Appendix A. For the 1D-SOA Algorithm, besides the parameters presented in the above-mentioned table, it is required to define the following fixed variables, N p x = 0.5 , P s x = 0.2 , P n s = 0.1 , P d i m = 0.5 , and N r = 0.2 that we recommend not to change, as they work for all the studied problems. The 30 studied benchmark functions are presented in the Appendix C, Table A8, Table A9 and Table A10. This table contains the search space, the optimal solution vector x = [ x 1 , x 2 , , x D ] , and the function evaluated at this vector f ( x ) , i.e., the optimum. Additionally, for the 1D-SOA method, it is required to select two parameters, C n e i g h and C n e i g h l ; the values of these parameters are presented in the same tables.
The comparison was made for different dimensions, in particular D = { 2 , 30 } .
For the experiments, a statistical analysis of the performance of the algorithms was performed and the algorithms were compared from 100 runs for each function. From the 100 runs, the best solution and the mean of the 100 runs were obtained for the statistic at an approximated value of 1 e 8 ; for the functions that do not reach this value, the 100 iterations were taken.
The initial population varied for each dimension; for dimensions less or equal to 10 the initial population was 10, while for larger dimensions the initial population corresponds to the dimension. Next, we present the results for dimensions 2 and 30.
In Figure 2, all the algorithms are presented for 30 D for the ackley, ackley_2, rastrigin, and schwefel 2.20 functions. It can be noticed that the algorithms with slightly better performance are: 1D-SOA, FWA, ZOA, AEO, MPSO, and CHSO. For the rest of the algorithms, most of the time they do not converge in the required number of iterations. Therefore, to have more clarity in the plots and tables, only the algorithms mentioned above are presented. In Figure 3 and Figure 4, the convergence for different steps for six search directions, and for various search directions and five steps, are presented. It is worth noticing from the plots that the convergence slightly improves with more search steps and more search directions. However, the computational work increases, therefore the parameters selected were five steps and 20% of the dimensions as search dimensions, as these parameters have a good balance between work and performance (see Table 1).

4.1. Results for 2D Experiments

The complete results of this section are presented in the Appendix B, Table A1, Table A2 and Table A3, that show the value that reaches the best solution out of the 100 runs, the averaged value reached, and the standard deviation for all the algorithms. The algorithm with the best performance has the darker corresponding value. If two algorithms have the same value, the one with faster convergence in the plots is selected. Additionally, two statistical tests were performed and included in these tables, the t-test [23], and the alternative to the Mann–Witney U Test, suggested by Mark Wineberg and Steffen Christensen, that is a non-parametric test based on the ranking of the results [54]. According to the non-parametric tests performed, most of the freedom degrees are close to 100, and the t statistic ranges from 3.3 to 49, which, from the Tables given in [54], indicates that the probability that the null hypotheses is wrong is over 99.8%; this implies that our results can be trusted. A summary of the results obtained for dimension 2 is presented in Table 3. In this table, we can observe that the best performance for the best solution was obtained for the 1D-SOA, while for the mean of the solutions, the best performance was achieved by the FWA. The convergence of the algorithms 1D-SOA, FWA, ZOA, AEO, MPSO, and CHSO for some functions is shown in Figure 5.
From the figures, it was observed that there exist two different behaviors of the algorithms depending on the function. For the first kind, all the algorithms converge at a similar rate, this behavior is observed for most of the functions, in particular, the functions: f 0 , f 1 , f 3 , f 4 , f 5 , f 9 , f 10 , f 14 , f 15 , f 16 , f 17 , f 18 , f 20 , f 21 , f 22 , f 23 , f 24 , f 25 , f 26 , f 26 , f 27 , and f 29 . For the second kind, the convergence is very slow for all the algorithms, except for one or two algorithms; this happens for functions f 2 , f 6 , f 7 , f 8 , f 11 , f 12 , f 13 , f 19 , and f 28 .

4.2. Results for 30D

The complete results of this section are presented in the Appendix B, Table A4, Table A5 and Table A6, that show the value that reaches the best solution out of the 100 runs, the averaged value reached, and the standard deviation for all the algorithms. As in the previous case (2D), the two statistical tests were performed and included in the tables. According to the non-parametric tests performed, most of the freedom degrees are close to or larger than 100, and the t statistic ranges from 3.7 to 52, which, from Tables [54], indicates that the probability that the null hypothesis is wrong is over 99.8%; this implies that our results can be trusted. A summary of the results obtained for dimension 30 is presented in Table 4. This table shows that the best performance for the best and mean solution was obtained for the 1D-SOA, followed by the FWA. The convergence of the algorithms 1D-SOA, FWA, ZOA, AEO, MPSO, and CHSO for some functions is shown in Figure 6.
For 30D, the CHSO algorithm shows a general performance that is worse than the 2D case. As in the previous case, different behaviors of the algorithms depending on the function are observed. For most of the functions, the convergence is similar for all the algorithms, in particular, for the functions: f 3 , f 6 , f 9 , f 10 , f 12 , f 20 , f 21 , f 22 , f 23 , f 25 , and f 26 . There is also a case where the 1D-SOA, FWA, ZOA, AEO, and MPSO present similar performances, but the CHSO fails to converge, the functions with this behavior are: f 0 , f 1 , f 2 , f 4 , f 5 , f 14 , f 15 , f 16 , f 17 , f 24 , and f 26 . Finally, there is a case where only one or two functions converge or converge faster than the rest, this happens for functions: f 7 , f 8 , f 11 , f 13 , f 18 , f 19 , and f 27 . For functions f 28 and f 29 , 1D-SOA does not converge. However, for functions f 7 , f 8 , f 11 , and f 13 only 1D-SOA converges.

4.3. Experiments with Functions with the Optimal Solution Not in Zero

The minimal value of the functions studied in the previous sections have a minimum f ( x ) = 0 located in x = [ 0 , . . . , 0 ] . However, some of them have the optimum in a different position. In this section, the functions with a non-zero optimum are studied; they are presented in Table A11, together with their optimal value. The functions f 7 and f 8 can be generalized to D dimensions and they are studied in the previous section; only the minimum value was shifted to zero, therefore we only show their convergence plots if they are not shifted towards zero in Figure 7. The rest of the functions are only defined in 2D. The results are presented in Table A7. For some of the functions studied in this section, the CHSO algorithm showed problems computing the solution, therefore, the studied algorithms are 1D-SOA, FWA, ZOA, AEO, and MPSO. The convergence plots are presented in Figure 8.
Regarding the best value, for these functions, most of the results are similar for all the algorithms, except for f 32 and f 36 , where FWA for f 32 and 1D-SOA for f 36 converge slightly faster than the rest to the optimum. For the Mean value, FWA reaches values closer to the optimum.

5. Conclusions

This work introduces the one-dimensional search optimization algorithm (1D-SOA) for solving optimization problems. This algorithm optimizes an initial population over a randomly selected dimension. It selects the search direction by moving symmetrically in the one-dimensional subspace (1D-S) created by the selected dimension. After the direction of the search is selected, the individuals move asymmetrically to find the local optima in the 1D-S. The algorithm includes exploitation by diminishing the size of the step to perform a local search. It also performs exploration by recombining the particles. To study the performance and efficiency of the proposed algorithm, it was compared against another 11 algorithms for 30 benchmark functions for various dimensions.
The comparison was made for two cases: (1) the best values reached by the algorithms, and (2) the mean performance out of 100 runs. For the best value, the best performance was observed for the 1D-SOA, for which 43.3% of the functions were in 2D, 70% in 30D; followed by the FWA with 26.6% in 2D, 16.6% in 30D; the CHSO with 20% in 2D; and the AEO with 6.6% in 30D. For the mean convergence, FWA showed a better performance with 53.3%, followed by the 1D-SOA with 33.3% of the functions in 2D. In 30D, the best performance was observed by the 1D-SOA algorithm with 63.3%, followed by the FWA with 33.3%. A t-test and a non-parametric test were performed to check the validity of the results.
The functions with non-zero optimum were studied for 2D, and the results were similar for the best solution except for the f 32 and f 36 functions, where the best performance was obtained with the FWA and the 1D-SOA algorithms. The FWA showed the best performance for the mean solutions.
From the results, it can be concluded that the best performance was achieved with the proposed algorithm (1D-SOA) in 30D, followed by the fireworks algorithm (FWA). For most of the functions, the convergence was similar for 2D. However, for larger dimensions, the chicken swarm optimization (CHSO) algorithm worsens its performance, while 1D-SOA showed a better performance. Furthermore, for some functions, 1D-SOA was the only algorithm that converged in large dimensions.
A fixed set of parameters was chosen for 1D-SOA to compare it against the other algorithms. However, these parameters can be adapted for diverse optimization problems. It is suggested to carry out an analysis of the parameters to find the most adequate ones for a given problem.

Author Contributions

Conceptualization, G.B.D.-C.; methodology, G.B.D.-C. and R.L.-G.; software, G.B.D.-C. and R.L.-G.; investigation, R.L.-G.; writing—original draft preparation, G.B.D.-C.; writing—review and editing, R.L.-G.; supervision, R.L.-G. All authors have read and agreed to the published version of the manuscript.

Funding

This research was funded by the Institute Politécnico Nacional through the project SIP20220354.

Data Availability Statement

Not applicable.

Acknowledgments

We thank CONACyT for their partial support of the present work.

Conflicts of Interest

The authors declare no conflict of interest.

Abbreviations

The following abbreviations are used in this manuscript:
MDPIMultidisciplinary Digital Publishing Institute
1D-SOAOne-Dimensional Search Algorithm
ABAArtificial Bee Algorithm
BABat Algorithm
BFOBacterial Foraging Optimization
CACat Swarm Optimization
CHSOChicken Swarm Optimization
CUCuckoo Search Optimization
FAFirefly algorithm
FWAFireworks Algorithm
GSAGravitational Search Algorithm
SSASocial Spider Algorithm
PSOParticle Swarm Optimization
MPSOMean Particle Swarm Optimization
AEOArtificial ecosystem-based optimization
JFJellyfish-inspired metaheuristic
CGOChaos Game Optimizer (CGO)
ZOAZebra Optimization Algorithm (ZOA)
CSAChameleon Swarm Algorithm
SOAServal Optimization Algorithm
OWBOptimization based on walrus behavior
COACoronavirus Optimization Algorithm
EA4EIGEigen Crossover in Cooperative Model of Evolutionary Algorithms
APGSKGaining–Sharing Knowledge-Based Algorithm With Adaptive Parameters
IMODEImproving Multi-Objective Differential Evolution Algorithm
DDimension
NNumber of individuals
G Generation
M a x G Maximum number of generations
ϵ Difference between previous and actual point
I t e p s i l o n Maximum allowed difference between previous and actual point
M a x ϵ Maximum allowed difference between previous and actual point
i t N I Counter for non improvement of the solution
M a x N I Maximum allowed number of non improvements of the solution
x m i n Minimum allowed value of the function
x m a x Maximum allowed value of the function
C n e i g h Neighborhood parameter
C n e i g h l Local neighborhood parameter
Δ Search step
D t e s t Random test directions to select the direction with the largest improvement
   s t e p s Number of steps given in each test direction
   N p x Percentage of particles on which to perform semi cross
   P s x Probability of semi cross
   P n s Probability of neighborhood search
   P d i m Number of search dimensions
   N r Percentage of particles to recombine

Appendix A. Experiments with Diverse Parameters for the Studied Algorithms

A subset of functions and diverse parameters were selected in order to test and find the best internal parameters for the MPSO, CHOA, and FWA. For MPSO, the studied parameters are values in the range proposed by the authors of references [49,53]. The parameters varied are the c 1 and c 2 , which are the ratios between the cognitive and social components. The results are presented in Figure A1 for 30D. It is observed that the best values are c 1 = 2 and c 2 = 2 , presented in Table 2 and used in this work.
Figure A1. Convergence of the MPSO algorithm for diverse parameters 30D.
Symmetry 15 01873 g0a1
For the CHSO algorithm, the studied parameters are G, the time to upgrade the relationships, and FL, which shows that, whether a chicken follows the mother or not, in the range proposed by the authors of reference [49] and reference [55], the results are presented in Figure A2. It is observed that, for the mean, there is not large variation when the parameters are changed. Therefore, the parameters used are, again, the default of the SwarmPackagePy [49], as shown in Table 2.
Figure A2. Convergence of the CHSO algorithm for diverse parameters for 30D.
Symmetry 15 01873 g0a2
Figure A3. Convergence of the FWA algorithm for diverse parameters for 30D.
Symmetry 15 01873 g0a3
For the FWA algorithm, the m 1 and m 2 parameters were varied in the ranges given by the authors of references [49,55]. The results are shown in Figure A3 for 30D, where it can be observed that there is no large difference for different parameters, therefore the default of the SwarmPackagePy 1.0.0a5 is used; they are presented in Table 2.

Appendix B. Results for the Selected Algorithms

Table A1. Experimental results of various algorithms and benchmark functions for 2D.
BestMeanStddt d np t np
f 0 1D-SOA0.04.9 e 12 1.4 e 11
FWA4.4 e 16 5.2 e 16 5.0 e 16 993.51018.2
ZOA1.1 e 11 7.8 e 9 1.8 e 8 994.21018.2
AEO9.1 e 8 2.2 e 4 6.3 e 4 993.41018.2
MPSO5.2 e 6 9.4 e 4 1.4 e 3 996.91018.2
CHSO4.4 e 16 6.6 e 3 1.7 e 2 993.81018.2
f 1 1D-SOA5.1 e 11 7.4 e 6 6.7 e 5
FWA2.2 e 10 5.0 e 6 1.3 e 5 1063.6 e 1 1978.1
ZOA7.5 e 6 5.8 e 3 1.0 e 2 995.71978.1
AEO1.0 e 3 1.5 e 1 2.4 e 1 996.21978.1
MPSO5.4 e 3 5.3 e 1 5.9 e 1 999.01978.1
CHSO2.7 e 3 3.54.4997.91978.1
f 2 1D-SOA2.8 e 13 5.5 e 10 1.4 e 9
FWA7.5 e 16 8.0 e 8 3.7 e 7 992.11848.8
ZOA7.5 e 7 2.2 e 3 6.5 e 3 993.31848.8
AEO3.1 e 5 2.5 e 2 6.6 e 2 993.81848.8
MPSO2.6 e 5 6.8 e 2 1.3 e 1 995.21848.8
CHSO3.3 e 9 9.3 e 2 2.1 e 1 994.41848.8
f 3 1D-SOA2.5 e 23 2.1 e 16 9.4 e 16
FWA7.8 e 23 1.3 e 12 4.6 e 12 992.91534.9
ZOA2.1 e 11 9.6 e 8 2.8 e 7 983.41534.9
AEO3.8 e 9 6.7 e 5 1.8 e 4 993.81534.9
MPSO5.7 e 8 3.1 e 4 6.2 e 4 995.01534.9
CHSO0.04.7 e 4 3.3 e 3 991.41534.9
f 4 1D-SOA9.2 e 21 2.3 e 3 2.1 e 2
FWA1.0 e 13 1.6 e 3 1.3 e 2 1682.7 e 1 1968.9
ZOA5.3 e 4 7.72.1 e 1 993.71968.9
AEO2.5 e 2 5.0 e 2 1.2 e 3 994.01968.9
MPSO3.5 e 1 6.1 e 4 3.4 e 5 991.81968.9
CHSO3.9 e 1 1.1 e 6 5.1 e 6 992.11968.9
f 5 1D-SOA2.2 e 26 2.9 e 14 2.2 e 13
FWA4.8 e 18 1.6 e 9 9.8 e 9 991.61771.5 e 1
ZOA4.3 e 13 5.9 e 6 1.3 e 5 994.61771.5 e 1
AEO2.8 e 8 2.2 e 3 1.8 e 2 991.21771.5 e 1
MPSO2.8 e 6 3.9 e 3 1.0 e 2 993.81771.5 e 1
CHSO8.8 e 7 2.3 e 2 4.9 e 2 994.61771.5 e 1
f 6 1D-SOA0.05.5 e 3 5.9 e 3
1199.0
FWA0.01.5 e 4 1.0 e 3 1059.01199.0
ZOA5.4 e 12 1.5 e 2 1.4 e 2 1306.21199.0
AEO1.0 e 5 8.5 e 2 7.2 e 2 1001.1 e 1 1199.0
MPSO8.2 e 8 1.6 e 1 1.1 e 1 991.4 e 1 1199.0
CHSO5.7 e 4 2.2 e 1 2.3 e 1 999.61199.0
f 7 1D-SOA3.2 e 12 6.6 e 3 5.0 e 2
FWA1.3 e 5 1.0 e 2 1.3 e 2 1116.9 e 1 991.0
ZOA0.02.9 e 1 6.2 e 1 1004.5991.0
AEO0.00.00.0981.3991.0
MPSO1.3 e 3 9.9 e 2 1.1 e 1 1397.7991.0
CHSO0.01.6 e 1 5.2 e 1 1002.9991.0
f 8 1D-SOA2.1 e 12 5.4 e 9 2.8 e 8
FWA1.6 e 3 1.3 e 2 9.7 e 3 991.3 e 1 993.6
ZOA0.05.6 e 1 5.0 e 1 991.1 e 1 993.6
AEO0.00.00.0991.9993.6
MPSO4.3 e 2 3.8 e 1 2.2 e 1 991.7 e 1 993.6
CHSO0.01.5 e 1 3.6 e 1 994.3993.6
Table A2. Experimental results of various algorithms and benchmark functions for 2D.
BestMeanStddt d np t np
f 9 1D-SOA1.9 e 48 1.6 e 35 1.5 e 34
FWA1.1 e 49 2.6 e 27 1.6 e 26 991.61531.4
ZOA3.4 e 26 9.0 e 16 7.1 e 15 991.31531.4
AEO4.0 e 23 3.9 e 10 2.4 e 9 991.61531.4
MPSO1.5 e 18 9.8 e 9 3.9 e 8 992.51531.4
CHSO1.2 e 54 1.4 e 7 1.3 e 6 991.01531.4
f 10 1D-SOA0.05.3 e 17 3.0 e 16
FWA0.01.4 e 16 9.9 e 16 1178.5 e 1 1921.3
ZOA1.5 e 12 9.8 e 2 3.0 e 1 993.31921.3
AEO1.9 e 10 5.6 e 1 9.1 e 1 996.21921.3
MPSO1.2 e 6 1.31.5988.71921.3
CHSO3.6 e 15 1.42.0997.01921.3
f 11 1D-SOA1.7 e 6 2.0 e 2 2.7 e 2
FWA6.2 e 6 7.2 e 3 1.2 e 2 1374.41976.4 e 1
ZOA5.2 e 8 1.8 e 1 2.1 e 1 1027.41976.4 e 1
AEO1.9 e 16 4.2 e 8 2.8 e 7 997.51976.4 e 1
MPSO1.6 e 3 9.2 e 2 8.1 e 2 1208.41976.4 e 1
CHSO2.5 e 6 1.0 e 1 1.6 e 1 1045.11976.4 e 1
f 12 1D-SOA1.0 e 1 9.4 e 1 5.5 e 1
FWA1.8 e 91 1.3 e 69 1.3 e 68 991.7 e 1 991.7 e 1
ZOA1.3 e 38 5.0 e 3 2.2 e 2 991.7 e 1 991.7 e 1
AEO9.5 e 24 1.0 e 3 9.9 e 3 991.7 e 1 991.7 e 1
MPSO6.6 e 21 1.9 e 2 3.5 e 2 991.7 e 1 991.7 e 1
CHSO9.5 e 17 3.1 e 2 4.5 e 2 1001.7 e 1 991.7 e 1
f 13 1D-SOA2.5 e 5 2.41.7 e 1
FWA5.4 e 4 1.2 e 1 4.2 e 1 1282.11228.3
ZOA9.1 e 2 2.0 e 2 1.2 e 2 1031.7 e 1 1228.3
AEO1.2 e 1 1.5 e 2 1.1 e 2 1031.4 e 1 1228.3
MPSO4.22.5 e 2 1.2 e 2 1022.1 e 1 1228.3
CHSO-4.1 e 2 3.2 e 2 1.3 e 2 1022.4 e 1 1228.3
f 14 1D-SOA3.5 e 12 7.2 e 9 1.2 e 8
FWA4.7 e 12 2.7 e 6 8.2 e 6 993.31751.1 e 1
ZOA2.9 e 5 3.3 e 3 3.6 e 3 999.01751.1 e 1
AEO5.5 e 5 1.1 e 1 1.2 e 1 999.11751.1 e 1
MPSO6.7 e 3 4.6 e 1 5.3 e 1 998.71751.1 e 1
CHSO4.1 e 3 2.33.7986.41751.1 e 1
f 15 1D-SOA1.3 e 9 1.0 e 6 2.9 e 6
FWA7.3 e 20 9.8 e 13 5.9 e 12 993.51263.8
ZOA1.8 e 10 7.3 e 7 1.2 e 6 1319.1 e 1 1263.8
AEO3.5 e 6 1.7 e 3 6.1 e 3 992.71263.8
MPSO1.7 e 5 7.8 e 3 1.2 e 2 996.21263.8
CHSO9.3 e 6 2.6 e 1 6.7 e 1 993.91263.8
f 16 1D-SOA2.4 e 14 7.3 e 11 1.5 e 10
FWA1.4 e 21 5.1 e 13 2.7 e 12 994.81971.9 e 1
ZOA9.1 e 10 7.0 e 7 2.0 e 6 993.51971.9 e 1
AEO1.2 e 6 1.2 e 3 2.5 e 3 994.91971.9 e 1
MPSO4.9 e 7 1.8 e 2 3.4 e 2 995.21971.9 e 1
CHSO1.7 e 6 1.3 e 1 3.2 e 1 994.21971.9 e 1
f 17 1D-SOA4.8 e 100 4.8 e 72 4.6 e 71
FWA5.1 e 107 1.9 e 49 1.9 e 48 981.01713.6
ZOA2.2 e 53 1.3 e 28 8.7 e 28 991.51713.6
AEO3.2 e 50 8.0 e 13 7.9 e 12 991.01713.6
MPSO1.8 e 33 9.5 e 8 6.6 e 7 981.51713.6
CHSO4.1 e 60 2.6 e 3 2.2 e 4 981.21713.6
f 18 1D-SOA4.7 e 8 1.95.2
FWA8.9 e 14 2.5 e 4 1.1 e 3 993.61441.2
ZOA1.4 e 6 1.8 e 1 3.6 e 1 993.21441.2
AEO4.0 e 4 4.11.2 e 1 1331.71441.2
MPSO5.9 e 3 9.82.4 e 1 1073.21441.2
CHSO0.07.4 e 1 1.4 e 2 995.11441.2
Table A3. Experimental results of various algorithms and benchmark functions for 2D.
BestMeanStddt d np t np
f 19 1D-SOA0.01.6 e 1 3.2 e 1
FWA5.8 e 11 1.6 e 2 1.1 e 1 1224.21761.5 e 1
ZOA2.4 e 12 1.2 e 1 2.9 e 1 1959.3 e 1 1761.5 e 1
AEO0.04.4 e 17 4.4 e 16 985.01761.5 e 1
MPSO7.7 e 5 5.9 e 2 5.8 e 2 1053.11761.5 e 1
CHSO3.3 e 14 1.3 e 1 4.7 e 1 1744.7 e 1 1761.5 e 1
f 20 1D-SOA4.5 e 24 2.3 e 10 1.5 e 9
FWA2.6 e 24 1.4 e 13 5.3 e 13 991.51906.3
ZOA3.8 e 12 1.8 e 7 5.0 e 7 993.51906.3
AEO6.3 e 12 1.3 e 4 3.4 e 4 993.91906.3
MPSO4.4 e 8 9.9 e 4 2.8 e 3 993.61906.3
CHSO1.2 e 10 1.5 e 2 5.7 e 2 992.61906.3
f 21 1D-SOA4.1 e 23 2.9 e 17
FWA4.8 e 22 1.4 e 12 1.1 e 11 991.31768.6
ZOA1.7 e 11 7.2 e 7 2.1 e 6 983.51768.6
AEO2.0 e 10 3.9 e 4 1.1 e 3 993.51768.6
MPSO2.1 e 8 5.1 e 3 1.1 e 2 994.51768.6
CHSO8.0 e 17 1.3 e 1 4.4 e 1 983.01768.6
f 22 1D-SOA1.2 e 17 3.7 e 4 2.1 e 3
FWA2.5 e 14 9.0 e 8 3.4 e 7 991.71924.8
ZOA7.3 e 9 2.4 e 5 9.1 e 5 991.61924.8
AEO3.8 e 8 2.3 e 4 4.5 e 4 1076.2 e 1 1924.8
MPSO2.9 e 7 7.5 e 4 1.3 e 3 1661.51924.8
CHSO2.4 e 13 1.6 e 4 9.4 e 4 1378.8 e 1 1924.8
f 23 1D-SOA0.00.00.0
FWA0.00.00.0
ZOA0.00.00.0
AEO0.00.00.0
MPSO0.00.00.0
CHSO0.00.00.0
f 24 1D-SOA5.5 e 23 2.2 e 1 1.1 e 2
FWA3.7 e 23 6.0 e 8 5.0 e 7 992.11694.7
ZOA8.4 e 7 1.5 e 2 5.3 e 2 992.11694.7
AEO2.6 e 5 1.5 e 1 3.7 e 1 1236.9 e 1 1694.7
MPSO2.0 e 3 2.1 e 2 6.9 e 2 1032.71694.7
CHSO2.2 e 5 4.0 e 3 2.5 e 4 991.61694.7
f 25 1D-SOA0.01.8 e 3 1.2 e 2
FWA0.03.1 e 8 1.5 e 7 991.41957.6
ZOA7.5 e 8 3.2 e 2 5.5 e 2 1095.41957.6
AEO1.3 e 5 1.1 e 1 1.0 e 1 1011.0 e 1 1957.6
MPSO8.3 e 6 1.9 e 1 1.4 e 1 1001.3 e 1 1957.6
CHSO0.07.6 e 2 1.2 e 1 1016.31957.6
f 26 1D-SOA3.9 e 14 9.1 e 4 5.5 e 3
FWA6.0 e 13 1.5 e 8 4.8 e 8 991.71763.5
ZOA6.0 e 8 3.2 e 5 9.3 e 5 991.61763.5
AEO5.2 e 6 1.5 e 3 2.3 e 3 1339.7 e 1 1763.5
MPSO3.6 e 5 8.8 e 3 1.4 e 2 1285.31763.5
CHSO6.9 e 11 5.2 e 2 1.2 e 1 994.31763.5
f 27 1D-SOA1.1 e 8 1.8 e 1 1.6 e 1
FWA5.4 e 11 1.2 e 5 4.3 e 5 991.1 e 1 1806.1
ZOA4.1 e 5 3.8 e 2 9.1 e 2 1547.61806.1
AEO6.8 e 4 1.3 e 1 1.5 e 1 1972.11806.1
MPSO1.4 e 3 1.4 e 1 1.2 e 1 1842.01806.1
CHSO0.01.6 e 1 1.6 e 1 1971.01806.1
f 28 1D-SOA7.3 e 11 2.4 e 1 4.3 e 1
FWA3.1 e 11 6.9 e 7 2.3 e 6 995.61742.9
ZOA-1.0-8.5 e 1 3.2 e 1 1822.1 e 1 1742.9
AEO-1.0-6.5 e 1 4.2 e 1 1971.5 e 1 1742.9
MPSO6.4 e 4 5.6 e 1 3.9 e 1 1965.61742.9
CHSO0.04.5 e 1 4.3 e 1 1973.51742.9
f 29 1D-SOA1.8 e 13 1.8 e 1 6.4 e 1
FWA2.2 e 22 2.9 e 12 1.4 e 11 992.81818.6
ZOA3.2 e 12 8.3 e 7 1.7 e 6 992.81818.6
AEO1.2 e 8 7.6 e 4 2.2 e 3 992.81818.6
MPSO3.5 e 6 3.0 e 3 7.8 e 3 992.71818.6
CHSO0.04.4 e 2 1.2 e 1 1052.11818.6
Table A4. Experimental results of various algorithms and benchmark functions for 30D.
BestMeanStddt d np t np
f 0 1D-SOA1.7 e 12 1.3 e 11 2.4 e 11
FWA3.1 e 12 2.6 e 9 5.9 e 9 994.41942.0 e 1
ZOA8.3 e 5 5.3 e 4 3.2 e 4 991.7 e 1 1942.0 e 1
AEO2.1 e 7 6.0 e 3 1.0 e 2 995.91942.0 e 1
MPSO7.1 e 4 9.2 e 3 1.5 e 2 985.91942.0 e 1
CHSO1.0 e 1 1.1 e 1 2.2995.0 e 1 1942.0 e 1
f 1 1D-SOA4.0 e 12 2.5 e 11 1.9 e 11
FWA2.8 e 9 3.3 e 6 4.8 e 6 996.81972.4 e 1
ZOA4.0 e 3 2.9 e 2 1.9 e 2 991.5 e 1 1972.4 e 1
AEO5.6 e 4 1.9 e 1 3.4 e 1 985.71972.4 e 1
MPSO4.2 e 2 2.1 e 1 1.5 e 1 991.4 e 1 1972.4 e 1
CHSO2.8 e 1 7.4 e 1 1.7 e 1 994.3 e 1 1972.4 e 1
f 2 1D-SOA1.7 e 14 6.7 e 14 3.0 e 13
FWA8.7 e 56 1.7 e 49 6.1 e 49 992.3992.5 e 1
ZOA2.4 e 22 2.0 e 7 2.0 e 6 991.0992.5 e 1
AEO2.3 e 21 1.2 e 15 4.2 e 15 992.2992.5 e 1
MPSO7.9 e 19 1.1 e 16 5.5 e 16 992.3992.5 e 1
CHSO8.1 e 277 7.6 e 3 1.3 e 2 996.0992.5 e 1
f 3 1D-SOA6.9 e 17 4.0 e 14 7.4 e 14
FWA3.1 e 9 2.7 e 5 4.4 e 5 996.11681.7 e 1
ZOA1.1 e 3 2.2 e 2 2.0 e 2 981.1 e 1 1681.7 e 1
AEO5.6 e 8 4.2 e 2 6.8 e 2 996.11681.7 e 1
MPSO1.2 e 2 2.17.0983.01681.7 e 1
CHSO8.5 e 4 1.11.9995.81681.7 e 1
f 4 1D-SOA4.2 e 17 8.3 e 3 3.4 e 2
FWA1.7 e 1 3.0 e 5 6.3 e 5 994.81701.7 e 1
ZOA3.8 e 6 4.9 e 7 4.0 e 7 991.2 e 1 1701.7 e 1
AEO4.6 e 5 1.7 e 8 4.4 e 8 993.81701.7 e 1
MPSO2.3 e 7 2.6 e 8 3.1 e 8 998.31701.7 e 1
CHSO5.1 e 9 2.2 e 10 7.1 e 9 993.1 e 1 1701.7 e 1
f 5 1D-SOA3.7 e 10 4.1 e 3 9.3 e 3
FWA3.1 e 13 2.8 e 7 1.2 e 6 994.51448.6
ZOA4.0 e 3 1.2 e 1 1.4 e 1 998.11448.6
AEO2.7 e 5 4.1 e 1 3.9 e 1 991.0 e 1 1448.6
MPSO4.9 e 2 6.2 e 1 3.9 e 1 991.6 e 1 1448.6
CHSO9.68.4 e 1 3.8 e 1 992.2 e 1 1448.6
f 6 1D-SOA2.02.00.0
FWA1.3 e 10 3.8 e 20 2.4 e 21 991.6993.6 e 1
ZOA1.6 e 24 1.1 e 32 6.9 e 32 991.6993.6 e 1
AEO0.01.3 e 5 4.9 e 5 982.6993.6 e 1
MPSO6.6 e 23 2.5 e 31 1.1 e 32 992.2993.6 e 1
CHSO3.2 e 16 8.3 e 28 5.3 e 29 981.6993.6 e 1
f 7 1D-SOA8.4 e 15 2.2 e 6 1.6 e 5
FWA8.5 e 11 4.5 e 18 2.7 e 19 991.7982.5 e 1
ZOA1.5 e 24 1.5 e 31 6.0 e 31 992.6982.5 e 1
AEO0.05.5 e 5 4.3 e 6 991.3982.5 e 1
MPSO7.4 e 22 6.9 e 30 3.3 e 31 982.1982.5 e 1
CHSO1.3 e 17 4.3 e 28 4.0 e 29 991.1982.5 e 1
f 8 1D-SOA1.6 e 34 4.8 e 29 2.9 e 28
FWA2.5 e 18 7.0 e 10 3.0 e 9 992.31411.1 e 1
ZOA5.7 e 8 1.0 e 5 1.6 e 5 996.21411.1 e 1
AEO1.3 e 12 1.1 e 3 8.4 e 3 991.31411.1 e 1
MPSO2.9 e 7 3.8 e 3 1.7 e 2 992.21411.1 e 1
CHSO1.4 e 13 1.19.9991.11411.1 e 1
f 9 1D-SOA2.8 e 14 7.3 e 1 8.1 e 1
FWA6.8 e 13 1.1 e 7 4.5 e 7 999.01443.4
ZOA4.4 e 2 6.91.8 e 1 993.51443.4
AEO3.5 e 5 1.6 e 1 4.1 e 1 993.61443.4
MPSO4.1 e 2 3.49.51002.81443.4
CHSO2.8 e 1 1.5 e 2 4.3 e 1 993.4 e 1 1443.4
Table A5. Experimental results of various algorithms and benchmark functions for 30D.
BestMeanStddt d np t np
f 10 1D-SOA3.4 e 4 8.37.8
FWA2.6 e 1 2.7 e 1 5.1 e 1 992.4 e 1 1327.6
ZOA2.8 e 1 2.9 e 1 9.6 e 2 992.6 e 1 1327.6
AEO2.5 e 1 2.7 e 1 4.1 e 1 992.4 e 1 1327.6
MPSO2.8 e 1 2.9 e 1 2.2 e 1 992.6 e 1 1327.6
CHSO2.8 e 1 2.9 e 1 2.8 e 1 992.6 e 1 1327.6
f 11 1D-SOA3.4 e 4 8.37.80.0
FWA2.6 e 1 2.7 e 1 5.1 e 1 1.0 e 2 2.4 e 1 1.3 e 2 7.6
ZOA2.8 e 1 2.9 e 1 9.6 e 2 9.9 e 1 2.6 e 1 1.3 e 2 7.6
AEO2.5 e 1 2.7 e 1 4.1 e 1 1.0 e 2 2.4 e 1 1.3 e 2 7.6
MPSO2.8 e 1 2.9 e 1 2.2 e 1 9.9 e 1 2.6 e 1 1.3 e 2 7.6
CHSO2.8 e 1 2.9 e 1 2.8 e 1 9.9 e 1 2.6 e 1 1.3 e 2 7.6
f 12 1D-SOA2.94.05.9 e 1
FWA3.9 e 51 2.9 e 2 4.5 e 2 1006.8 e 1 988.3
ZOA1.0 e 1 1.0 e 1 1.9 e 9 996.7 e 1 988.3
AEO2.1 e 20 1.2 e 4 1.1 e 3 996.8 e 1 988.3
MPSO1.0 e 1 1.6 e 1 6.5 e 2 1016.5 e 1 988.3
CHSO1.5 e 1 9.7 e 1 4.0 e 1 1744.3 e 1 988.3
f 13 1D-SOA1.4 e 6 1.1 e 5 1.2 e 5
FWA5.6 e 4 5.9 e 2 5.3 e 2 991.1 e 1 1902.1 e 1
ZOA2.79.34.5992.1 e 1 1902.1 e 1
AEO7.6 e 3 2.1 e 1 2.3 e 1 999.21902.1 e 1
MPSO7.31.9 e 1 5.5993.4 e 1 1902.1 e 1
CHSO1.8 e 2 3.7 e 2 7.4 e 1 995.0 e 1 1902.1 e 1
f 14 1D-SOA5.2 e 1 1.13.1 e 1
FWA1.2 e 48 1.0 e 39 3.9 e 39 993.6 e 1 991.7 e 1
ZOA7.2 e 19 1.4 e 16 2.3 e 16 993.6 e 1 991.7 e 1
AEO4.9 e 19 3.9 e 14 1.8 e 13 993.6 e 1 991.7 e 1
MPSO8.9 e 17 5.0 e 14 1.7 e 13 993.6 e 1 991.7 e 1
CHSO1.1 e 1 4.9 e 1 1.7 e 1 992.8 e 1 991.7 e 1
f 15 1D-SOA1.0 e 15 1.8 e 12 1.1 e 11
FWA6.5 e 9 1.0 e 6 1.9 e 6 995.31972.4 e 1
ZOA1.4 e 2 8.5 e 2 6.6 e 2 981.3 e 1 1972.4 e 1
AEO2.6 e 3 1.22.7994.61972.4 e 1
MPSO8.7 e 2 4.2 e 1 2.5 e 1 981.7 e 1 1972.4 e 1
CHSO3.1 e 1 1.6 e 2 7.0 e 1 992.3 e 1 1972.4 e 1
f 16 1D-SOA3.9 e 156 2.4 e 141 1.8 e 140
FWA4.0 e 146 1.7 e 85 1.7 e 84 1.01972.4 e 1
ZOA9.0 e 54 1.7 e 40 9.4 e 40 991.81972.4 e 1
AEO3.6 e 78 6.5 e 30 6.2 e 29 991.11972.4 e 1
MPSO7.1 e 44 2.9 e 25 2.1 e 24 991.31972.4 e 1
CHSO2.0 e 5 2.4 e 8 2.9 e 8 998.21972.4 e 1
f 17 1D-SOA3.6 e 3 8.9 e 3 1.3 e 3
FWA8.9 e 5 1.13.9997.0 e 1 991.6 e 1
ZOA1.6 e 1 3.1 e 2 2.2 e 2 1056.7 e 1 991.6 e 1
AEO1.2 e 3 7.4 e 1 2.2 e 2 1046.9 e 1 991.6 e 1
MPSO1.5 e 2 2.3 e 4 1.1 e 4 1011.2 e 1 991.6 e 1
CHSO1.3 e 4 2.6 e 4 6.4 e 3 1062.7 e 1 991.6 e 1
f 18 1D-SOA1.1 e 2 2.34.8 e 1
FWA6.1 e 4 2.3 e 3 1.8 e 3 994.9 e 1 1204.8
ZOA3.53.59.4 e 3 992.4 e 1 1204.8
AEO1.7 e 1 1.71.11344.81204.8
MPSO3.53.51.8 e 3 992.5 e 1 1204.8
CHSO3.13.48.0 e 2 1042.3 e 1 1204.8
f 19 1D-SOA4.7 e 15 5.5 e 10 1.9 e 9
FWA7.7 e 9 2.5 e 5 9.0 e 5 992.81741.8 e 1
ZOA2.8 e 3 2.4 e 2 2.2 e 2 991.1 e 1 1741.8 e 1
AEO9.0 e 8 1.1 e 1 2.2 e 1 994.91741.8 e 1
MPSO1.9 e 2 1.5 e 1 1.8 e 1 998.41741.8 e 1
CHSO1.0 e 1 5.1 e 1 1.4 e 1 993.5 e 1 1741.8 e 1
Table A6. Experimental results of various algorithms and benchmark functions for 30D.
BestMeanStddt d np t np
f 20 1D-SOA8.9 e 15 1.8 e 12 3.7 e 12
FWA8.1 e 7 9.9 e 4 2.2 e 3 984.51852.0 e 1
ZOA1.4 e 1 1.51.5991.0 e 1 1852.0 e 1
AEO1.1 e 3 6.21.2 e 1 995.11852.0 e 1
MPSO5.1 e 1 1.3 e 1 2.3 e 1 985.71852.0 e 1
CHSO1.0 e 3 2.6 e 3 9.0 e 2 992.9 e 1 1852.0 e 1
f 21 1D-SOA4.1 e 16 1.1 e 9 5.1 e 9
FWA1.1 e 11 4.7 e 6 1.1 e 5 994.31392.4
ZOA3.0 e 7 1.0 e 4 1.7 e 4 996.01392.4
AEO1.5 e 9 5.0 e 3 2.7 e 2 991.91392.4
MPSO4.1 e 6 2.2 e 2 4.9 e 2 994.41392.4
CHSO2.3 e 12 3.0 e 2 1.6 e 1 991.91392.4
f 22 1D-SOA4.0 e 14 1.55.9
FWA6.9 e 7 8.8 e 2 1.9 e 1 992.31693.1
ZOA6.04.9 e 1 3.6 e 1 1041.3 e 1 1693.1
AEO1.3 e 2 4.5 e 2 9.3 e 2 994.91693.1
MPSO2.7 e 1 1.4 e 3 3.6 e 3 993.91693.1
CHSO6.9 e 3 3.2 e 4 1.0 e 4 993.1 e 1 1693.1
f 23 1D-SOA0.00.00.0
FWA0.00.00.0
ZOA0.00.00.0
AEO0.00.00.0
MPSO0.00.00.0
CHSO0.00.00.0
f 24 1D-SOA6.8 e 9 2.2 e 2 1.2 e 2
FWA3.7 e 7 2.3 e 4 3.2 e 4 991.8 e 1 1521.3 e 1
ZOA1.4 e 1 5.0 e 1 1.2 e 1 1004.0 e 1 1521.3 e 1
AEO3.1 e 4 5.7 e 1 2.6 e 1 992.1 e 1 1521.3 e 1
MPSO1.5 e 1 7.6 e 1 1.0 e 1 1017.1 e 1 1521.3 e 1
CHSO2.7 e 1 3.9 e 1 6.4 e 2 1055.7 e 1 1521.3 e 1
f 25 1D-SOA2.8 e 13 4.8 e 8 1.5 e 7
FWA6.1 e 12 1.5 e 6 6.8 e 6 992.21956.4
ZOA9.8 e 7 4.9 e 4 6.6 e 4 997.41956.4
AEO2.2 e 5 1.8 e 2 5.3 e 2 993.41956.4
MPSO1.0 e 3 4.7 e 3 4.5 e 4 991.01956.4
CHSO6.3 e 5 4.2 e 12 2.0 e 13 992.11956.4
f 26 1D-SOA3.5 e 12 3.7 e 12 2.0 e 13
FWA6.5 e 9 7.8 e 8 6.4 e 8 991.2 e 1 991.7 e 1
ZOA9.5 e 8 2.5 e 6 2.8 e 6 999.0991.7 e 1
AEO3.5 e 12 2.0 e 11 1.1 e 11 991.6 e 1 991.7 e 1
MPSO1.1 e 6 2.0 e 4 2.9 e 4 997.0991.7 e 1
CHSO0.04.7 e 9 3.5 e 8 991.4991.7 e 1
f 27 1D-SOA1.01.00.0
FWA1.01.03.6 e 12 9.9 e 1 3.3 e 1 0.09.9 e 1
ZOA3.8 e 11 1.8 e 10 1.1 e 10 9.9 e 1 9.1 e 10 9.1 e 9 9.9 e 1
AEO−9.1 e 1 −2.8 e 2 1.3 e 1 9.9 e 1 7.6 e 1 7.99.9 e 1
MPSO1.01.03.4 e 9 9.9 e 1 1.3 e 1 0.09.9 e 1
CHSO1.01.05.7 e 10 9.9 e 1 1.0 e 1 0.09.9 e 1
f 28 1D-SOA1.9 e 2 3.7 e 2 5.5 e 1
FWA1.7 e 4 8.9 e 1 1.5996.8 e 1 991.6 e 1
ZOA9.8 e 1 1.5 e 1 7.91036.5 e 1 991.6 e 1
AEO2.7 e 3 1.0 e 1 4.2 e 1 1855.3 e 1 991.6 e 1
MPSO6.5 e 1 1.9 e 4 1.1 e 5 991.6991.6 e 1
CHSO2.0 e 2 1.1 e 3 3.0 e 3 992.3991.6 e 1
f 29 1D-SOA1.9 e 2 3.7 e 2 5.5 e 1
FWA1.7 e 4 8.9 e 1 1.59.9 e 1 6.8 e 1 9.9 e 1 1.6 e 1
ZOA9.8 e 1 1.5 e 1 7.91.0 e 2 6.5 e 1 9.9 e 1 1.6 e 1
AEO2.7 e 3 1.0 e 1 4.2 e 1 1.9 e 2 5.3 e 1 9.9 e 1 1.6 e 1
MPSO6.5 e 1 1.9 e 4 1.1 e 5 9.9 e 1 1.69.9 e 1 1.6 e 1
CHSO2.0 e 2 1.1 e 3 3.0 e 3 9.9 e 1 2.39.9 e 1 1.6 e 1
Table A7. Experimental results of various algorithms and benchmark functions for 2D, for functions with non-zero optimum.
BestMeanStddt d np t np
f 30 1D-SOA−1.0−1.01.3 e 3
FWA−1.0−1.01.1 e 13 991.51584.1
ZOA−1.0−1.04.8 e 9 991.51584.1
AEO−1.0−1.03.1 e 6 991.51584.1
MPSO−1.0−1.02.2 e 5 991.41584.1
f 31 1D-SOA3.08.61.0 e 1
FWA3.04.66.41683.41769.1
ZOA3.01.5 e 1 1.9 e 1 1493.01769.1
AEO3.06.41.3 e 1 1871.41769.1
MPSO3.11.3 e 1 1.4 e 1 1802.71769.1
f 32 1D-SOA1.12.4 e 3 5.9 e 3
FWA1.01.41.6994.11856.8
ZOA1.04.6 e 1 1.3 e 2 994.01856.8
AEO1.52.5 e 2 5.7 e 2 1003.71856.8
MPSO1.26.6 e 2 1.9 e 3 1192.81856.8
f 33 1D-SOA−1.0−9.4 e 1 2.4 e 1
FWA−1.0−1.04.8 e 6 992.5982.2 e 1
ZOA−1.0−9.5 e 1 2.2 e 1 1963.1 e 1 982.2 e 1
AEO−1.0−1.04.5 e 14 992.5982.2 e 1
MPSO−1.0−9.3 e 1 6.7 e 2 1145.8 e 1 982.2 e 1
f 34 1D-SOA1.244 e 2 1.387 e 2 1.671 e 1
FWA1.244 e 2 1.262 e 2 2.35210271915
ZOA1.244 e 2 1.463 e 2 4.155 e 1 13011915
AEO1.244 e 2 1.417 e 2 2.493 e 1 17311915
MPSO1.250 e 2 1.845 e 2 4.020 e 1 132101915
f 35 1D-SOA9.0 e 1 1.02.5 e 2
FWA9.0 e 1 9.0 e 1 2.3 e 3 1003.8 e 1 1938.9
ZOA9.0 e 1 9.6 e 1 4.9 e 2 1486.71938.9
AEO9.0 e 1 1.04.1 e 2 1653.7 e 1 1938.9
MPSO9.0 e 1 1.05.6 e 2 1384.11938.9
f 36 1D-SOA−3456−2884
FWA−3455−3450199951650
ZOA−3455−2234145218431650
AEO−3455−1520155517871650
MPSO−3452−725344711951650
f 37 1D-SOA−7.833 e 1 −7.830 e 1 2.513 e 1
FWA−7.833 e 1 −7.832 e 1 2.713 e 2 101 1107
ZOA−7.833 e 1 −7.201 e 1 7.6589981107
AEO−7.833 e 1 −7.657 e 1 4.3049941107
MPSO−7.820 e 1 −7.256 e 1 5.40899101107

Appendix C. Benchmark Functions

Table A8. Benchmark functions.
FunctionSearch Space, Ω Optimal Solution, x *Optimum, f ( x * ) C neigh C neigh l
f 0 ( x ) : Ackley [56,57,58][−32.768, 32.768] [ 0 , 0 ] D 0 0.5 0.01
f 0 ( x ) = 20 e x p 0.2 1 D i D x i 2 e x p 1 D i D c o s ( 2 π x i ) + 20 + e x p ( 1 )
f 1 ( x ) : Ackley 2 [58] [ 32 , 32 ] D [ 0 , 0 ] D 05 0.1
f 1 ( x ) = 200 1 e x p 0.02 i D x i 2
f 2 ( x ) : Alpine 1 [58] [ 10 , 10 ] D [ 0 , 0 ] D 0 0.5 0.1
f 2 ( x ) = i n | x i sin ( x i ) + 0.1 x i |
f 3 ( x ) : Brown [58] [ 1 , 4 ] D [ 0 , 0 ] D 0 0.5 0.1
f 3 ( x ) = i = 1 D 1 ( x i 2 ) ( x i + 1 2 + 1 ) + ( x i + 1 2 ) ( x i 2 + 1 )
f 4 ( x ) : Cigar [20] [ 100 , 100 ] D [ 0 , 0 ] D 0 0.5 0.0001
f 4 ( x ) = x 1 2 + 10 6 i = 2 D x i 2
f 5 ( x ) : Ellipse [20] [ 100 , 100 ] D [ 0 , 0 ] D 0 0.5 0.01
f 5 ( x ) = i D 10 4 i 1 D 1 x i 2
f 6 ( x ) : Griewank [20] [ 600 , 600 ] D [ 0 , 0 ] D 025015
f 6 ( x ) = 1 4000 i D x i 2 i D cos ( x i i ) + 1
f 7 ( x ) : Mishra 1 [59] [ 1 , 1 ] D [ 1 , 1 ] D 0 0.5 0.01
f 7 ( x ) = 1 + D i D 1 x i D i D 1 x i 2
f 8 ( x ) : Mishra 2 [59] [ 1 , 1 ] D [ 1 , 1 ] D 0 0.5 0.01
f 8 ( x ) = ( 1 + g n ) g n 2 , g n = D i D 1 ( x i + x i + 1 2 )
f 9 ( x ) : Quartic [58] [ 1.28 , 1.28 ] D [ 0 , 0 ] D 0 1.28 0.2
f 9 ( x ) = i D i x i 4
f 10 ( x ) : Rastrigin [56,57] [ 5.12 , 5.12 ] D [ 0 , 0 ] D 052
f 10 ( x ) = 10 D + i D x i 2 10 c o s ( 2 π x i )
f 11 ( x ) : Rosenbrock [23] [ 2.048 , 2.048 ] D [ 1 , 1 ] D 03 0.5
f 11 ( x ) = i D 1 [ 100 ( x i + 1 x i 2 ) 2 + ( x i 1 ) 2 ]
* The super-index D refers to a D dimensional vector.
Table A9. Benchmark functions.
FunctionSearch Space, Ω Optimal Solution, x *Optimum, f ( x * ) C neigh C neigh l
f 12 ( x ) : Salomon [58] [ 100 , 100 ] D [ 0 , 0 ] D 0 0.01 0.001
f 12 ( x ) = 1 c o s 2 π i D x i 2 + 0.1 i D x i 2
f 13 ( x ) : Schwefel [23] [ 500 , 500 ] D [ 420.9687 , 420.9687 ] D 0500250
f 13 ( x ) = 418.9829 D i D x i s i n | x i |
f 14 ( x ) : Schwefel 2.20 [58] [ 100 , 100 ] D [ 0 , 0 ] D 052
f 14 ( x ) = i D | x i |
f 15 ( x ) : Schwefel 2.21 [23,58] [ 100 , 100 ] D [ 0 , 0 ] D 0 0.5 0.01
f 15 ( x ) = max ( | x i | )
f 16 ( x ) : Schwefel 2.22 [58] [ 100 , 100 ] D [ 0 , 0 ] D 0502
f 16 ( x ) = i D | x i | + i D | x i |
f 17 ( x ) : Schwefel 2.23 [58] [ 10 , 10 ] D [ 0 , 0 ] D 0105
f 17 ( x ) = i D x i 10
f 18 ( x ) : Schwefel Double Sum [23,58] [ 65.536 , 65.536 ] D [ 0 , 0 ] D 051
f 18 ( x ) = i D ( j = 1 i x j ) 2
f 19 ( x ) : Sinusoidal [59] [ 0 , 180 ] D [ 0 , 0 ] D 05 0.1
f 19 ( x ) = A + 1 A i D sin ( x i Z ) + i D sin [ B ( x i Z ) ] , A = 2.5 , B = 5 , Z = 30
f 20 ( x ) : Sphere [56,57,58] [ 5.12 , 5.12 ] D [ 0 , 0 ] D 0 0.5 0.01
f 20 ( x ) = i D x i 2
f 21 ( x ) : Sum Squares [58] [ 10 , 10 ] D [ 0 , 0 ] D 0105
f 21 ( x ) = i D i x i 2
f 22 ( x ) : Sum of Different Powers [29] [ 1 , 1 ] D [ 0 , 0 ] D 0 0.5 0.01
f 22 ( x ) = | x i | i + 1
f 23 ( x ) : Step [23] [ 5 , 5 ] D [ 0 , 0 ] D 051
f 23 ( x ) = i D f l o o r ( x i + 0.5 ) 2
f 24 ( x ) : Tablet [20] [ 100 , 100 ] D [ 0 , 0 ] D 0 0.5 0.001
f 24 ( x ) = 10 4 x 1 2 + i = 2 D x i 2
* The super-index D refers to a D dimensional vector.
Table A10. Benchmark functions.
FunctionsSearch Space, Ω Optimal Solution, x *Optimum, f ( x * )
f 25 ( x ) : Wavy [58] [ π , π ] D [ 0 , 0 ] D 0 π / 2 1
f 25 ( x ) = 1 1 D i D cos ( 10 x i ) e x p x i 2 / 2
f 26 ( x ) : XinShe Yang [60] [ 5 , 5 ] D [ 0 , 0 ] D 0 0.5 0.001
f 26 ( x ) = | x i | i
f 27 ( x ) : XinShe Yang N.2 [60] [ 2 π , 2 π ] D [ 0 , 0 ] D 0 2 π π
f 27 ( x ) = i D | x i | e x p i D s i n ( x i 2 )
f 28 ( x ) : XinShe Yang N.4 [60] [ 10 , 10 ] D [ 0 , 0 ] D 0 0.5 0.2
f 28 ( x ) = i D s i n 2 ( x i ) e x p ( i D x i 2 ) e x p i D s i n 2 | x i | + 1
f 29 ( x ) : Zakharov [58] [ 5 , 10 ] D [ 0 , 0 ] D 01 0.001
f 29 ( x ) = i D x i 2 + i D 0.5 i x i 2 + i D 0.5 i x i 4
Figure A4. Benchmark functions studied in this paper.
Symmetry 15 01873 g0a4
Table A11. Non-zero benchmark functions.
FunctionSearch Space, Ω Optimal Solution, x *Optimum, f ( x * ) C neigh C neigh l
D-dimensional functions
f 7 ( x ) : Mishra 1 [59] [ 1 , 1 ] D [ 1 , 1 ] D 2 0.5 0.01
f 7 ( x ) = 1 + D i D 1 x i D i D 1 x i
f 8 ( x ) : Mishra 2 [59] [ 1 , 1 ] D [ 1 , 1 ] D 2 0.5 0.01
f 8 ( x ) = ( 1 + g n ) g n , g n = D i D 1 ( x i + x i + 1 2 )
2-dimensional functions
f 30 ( x ) : Exponential [58] [ 1 , 1 ] D [ 0 , 0 ] 1 0.05 0.001
f 30 ( x ) = 1 + D i D 1 x i D i D 1 x i
f 31 ( x ) : Goldstein Price [32] [ 2 , 2 ] D [ 0 , 1 ] D 3 0.06 0.01
f 31 ( x ) = [ 1 + ( x 1 + x 2 + 1 ) 2 ( 19 14 x 1 + 3 x 1 2 14 x 2 + 6 x 1 x 2 + 3 x 2 2 ) ] ×
× [ 30 + ( 2 x 1 3 x 2 ) 2 ( 18 32 x 1 + 12 x 1 2 + 48 x 2 36 x 1 x 2 + 27 x 2 2 ) ]
f 32 ( x ) : Bartels Conn [58] [ 500 , 500 ] D [ 0 , 0 ] 110 0.01
f 32 ( x ) = | x 1 2 + x 2 2 + x 1 x 2 |
f 33 ( x ) :Easom [58] [ 100 , 100 ] D [ 0 , 1 ] D 37040
f 33 ( x ) = c o s ( x 1 ) c o s ( x 2 ) e x p [ ( x 1 π ) 2 ( x 2 π ) 2 ]
f 34 ( x ) : Jennrich-Sampson [58] [ 1 , 1 ] D [ 0.257825 ] D 124.3612 0.05 0.001
f 34 ( x ) = i = 1 10 ( 2 + 2 i ( e i x 1 + e i x 2 ) 2
f 35 ( x ) : Price 2 [58] [ 10 , 10 ] D [ 0 ] D 0.9 0.05 0.0001
f 35 ( x ) = 1 + s i n 2 ( x 1 ) + s i n 2 ( x 2 ) 0.1 e x p x 1 2 x 2 2
f 36 ( x ) : Schwefel 2.36 [58] [ 0 , 500 ] D [ 12 ] D 3456 5 0.01
f 36 ( x ) = x 1 x 2 ( 72 2 x 1 2 x 2 )
f 37 ( x ) : Styblinski-Tang [58] [ 5 , 5 ] D [ 2.903534 ] D 78.332 5 0.01
f 37 ( x ) = 1 2 i = 1 2 ( x i 4 16 x i 2 + 5 x i )
* The super-index D refers to a D dimensional vector.

References

  1. Li, G.; Shuang, F.; Zhao, P.; Le, C. An improved butterfly optimization algorithm for engineering design problems using the cross-entropy method. Symmetry 2019, 11, 1049. [Google Scholar] [CrossRef]
  2. Talatahari, S.; Azizi, M.; Gandomi, A.H. Material generation algorithm: A novel metaheuristic algorithm for optimization of engineering problems. Processes 2021, 9, 859. [Google Scholar] [CrossRef]
  3. Gendreau, M.; Potvin, J.Y. Handbook of Metaheuristics; Springer: Berlin/Heidelberg, Germany, 2010; Volume 2. [Google Scholar] [CrossRef]
  4. Cruz-Reyes, L.; Quiroz C, M.; F Alvim, A.C.; Fraire Huacuja, H.J.; Gómez S, C.; Torres-Jiménez, J. Efficient Hybrid Grouping Heuristics for the Bin Packing Problem. Comput. Sist. 2012, 16, 349–360. [Google Scholar]
  5. Navas, M.M.; Urbaneja, A.J.N. Metaheurísticas multiobjetivo adaptativas. Comput. Sist. 2013, 17, 53–62. [Google Scholar]
  6. Beheshti, Z.; Shamsuddin, S.M.H. A review of population-based meta-heuristic algorithms. Int. J. Adv. Soft Comput. Appl. 2013, 5, 1–35. [Google Scholar]
  7. Faridmehr, I.; Nehdi, M.L.; Davoudkhani, I.F.; Poolad, A. Mountaineering Team-Based Optimization: A Novel Human-Based Metaheuristic Algorithm. Mathematics 2023, 11, 1273. [Google Scholar] [CrossRef]
  8. Mohammadi-Balani, A.; Nayeri, M.D.; Azar, A.; Taghizadeh-Yazdi, M. Golden eagle optimizer: A nature-inspired metaheuristic algorithm. Comput. Ind. Eng. 2021, 152, 107050. [Google Scholar] [CrossRef]
  9. Połap, D.; Woźniak, M. Polar bear optimization algorithm: Meta-heuristic with fast population movement and dynamic birth and death mechanism. Symmetry 2017, 9, 203. [Google Scholar] [CrossRef]
  10. Meng, X.; Liu, Y.; Gao, X.; Zhang, H. A new bio-inspired algorithm: Chicken swarm optimization. In Proceedings of the International Conference in Swarm Intelligence, Hefei, China, 17–20 October 2014; Springer: Berlin/Heidelberg, Germany, 2014; pp. 86–94. [Google Scholar] [CrossRef]
  11. Abualigah, L.; Yousri, D.; Abd Elaziz, M.; Ewees, A.A.; Al-Qaness, M.A.; Gandomi, A.H. Aquila optimizer: A novel meta-heuristic optimization algorithm. Comput. Ind. Eng. 2021, 157, 107250. [Google Scholar] [CrossRef]
  12. Mirjalili, S.; Mirjalili, S.M.; Lewis, A. Grey wolf optimizer. Adv. Eng. Softw. 2014, 69, 46–61. [Google Scholar] [CrossRef]
  13. Yang, X.S.; Deb, S. Multiobjective cuckoo search for design optimization. Comput. Oper. Res. 2013, 40, 1616–1624. [Google Scholar] [CrossRef]
  14. James, J.; Li, V.O. A social spider algorithm for global optimization. Appl. Soft Comput. 2015, 30, 614–627. [Google Scholar] [CrossRef]
  15. Yang, X.S.; Slowik, A. Firefly algorithm. In Swarm Intelligence Algorithms; CRC Press: Boca Raton, FL, USA, 2020; pp. 163–174. [Google Scholar]
  16. Pierezan, J.; Coelho, L.D.S. Coyote optimization algorithm: A new metaheuristic for global optimization problems. In Proceedings of the 2018 IEEE Congress on Evolutionary Computation (CEC), Rio de Janeiro, Brazil, 8–13 July 2018; pp. 1–8. [Google Scholar] [CrossRef]
  17. Chu, S.C.; Tsai, P.W.; Pan, J.S. Cat swarm optimization. In Proceedings of the Pacific Rim International Conference on Artificial Intelligence, Guilin, China, 7–11 August 2006; Springer: Berlin/Heidelberg, Germany, 2006; pp. 854–858. [Google Scholar] [CrossRef]
  18. Kennedy, J.; Eberhart, R. Particle swarm optimization. In Proceedings of the ICNN′95—International Conference on Neural Networks, Perth, Australia, 27 November–1 December 1995; Volume 4, pp. 1942–1948. [Google Scholar] [CrossRef]
  19. Rashedi, E.; Nezamabadi-Pour, H.; Saryazdi, S. GSA: A gravitational search algorithm. Inf. Sci. 2009, 179, 2232–2248. [Google Scholar] [CrossRef]
  20. Tan, Y.; Zhu, Y. Fireworks Algorithm for Optimization. In Proceedings of the Advances in Swarm Intelligence, First International Conference, ICSI 2010, Beijing, China, 12–15 June 2010; Proceedings, Part I. Tan, Y., Shi, Y., Tan, K.C., Eds.; Springer: Berlin/Heidelberg, Germany, 2010; Volume 6145, pp. 355–364. [Google Scholar] [CrossRef]
  21. Eiben, A.E.; Smith, J.E. Introduction to Evolutionary Computing; Springer: Berlin/Heidelberg, Germany, 2003; Volume 53. [Google Scholar] [CrossRef]
  22. Eiben, A.E.; Schippers, C.A. Introduction to Evolutionary Computing. Fundamenta Informaticae; Elsevier: Amsterdam, The Netherlands, 1998; Volume 35, pp. 1–4. [Google Scholar]
  23. Simon, D. Evolutionary Optimization Algorithms; John Wiley & Sons: Hoboken, NJ, USA, 2013. [Google Scholar]
  24. Garcia-Gonzalo, E.; Fernandez-Martinez, J.L. A brief historical review of particle swarm optimization (PSO). J. Bioinform. Intell. Control 2012, 1, 3–16. [Google Scholar] [CrossRef]
  25. Ramírez-Ochoa, D.D.; Pérez-Domínguez, L.A.; Martínez-Gómez, E.A.; Luviano-Cruz, D. PSO, a swarm intelligence-based evolutionary algorithm as a decision-making strategy: A review. Symmetry 2022, 14, 455. [Google Scholar] [CrossRef]
  26. Storn, R.; Price, K. Differential evolution-a simple and efficient heuristic for global optimization over continuous spaces. J. Glob. Optim. 1997, 11, 341. [Google Scholar] [CrossRef]
  27. Opara, K.R.; Arabas, J. Differential Evolution: A survey of theoretical analyses. Swarm Evol. Comput. 2019, 44, 546–558. [Google Scholar] [CrossRef]
  28. Ma, Z.; Yuan, X.; Han, S.; Sun, D.; Ma, Y. Improved chaotic particle swarm optimization algorithm with more symmetric distribution for numerical function optimization. Symmetry 2019, 11, 876. [Google Scholar] [CrossRef]
  29. Özcan, H. Comparison of particle swarm and differential evolution optimization algorithms considering various benchmark functions. Politek. Derg. 2017, 20, 899–905. [Google Scholar] [CrossRef]
  30. Deng, W.; Shang, S.; Cai, X.; Zhao, H.; Song, Y.; Xu, J. An improved differential evolution algorithm and its application in optimization problem. Soft Comput. 2021, 25, 5277–5298. [Google Scholar] [CrossRef]
  31. Sun, W.Z.; Wang, J.S.; Wei, X. An improved whale optimization algorithm based on different searching paths and perceptual disturbance. Symmetry 2018, 10, 210. [Google Scholar] [CrossRef]
  32. Zhao, W.; Wang, L.; Zhang, Z. Artificial ecosystem-based optimization: A novel nature-inspired meta-heuristic algorithm. Neural Comput. Appl. 2020, 32, 9383–9425. [Google Scholar] [CrossRef]
  33. Chou, J.S.; Truong, D.N. A novel metaheuristic optimizer inspired by behavior of jellyfish in ocean. Appl. Math. Comput. 2021, 389, 125535. [Google Scholar] [CrossRef]
  34. Talatahari, S.; Azizi, M. Chaos game optimization: A novel metaheuristic algorithm. Artif. Intell. Rev. 2021, 54, 917–1004. [Google Scholar] [CrossRef]
  35. Trojovská, E.; Dehghani, M.; Trojovský, P. Zebra Optimization Algorithm: A New Bio-Inspired Optimization Algorithm for Solving Optimization Algorithm. IEEE Access 2022, 10, 49445–49473. [Google Scholar] [CrossRef]
  36. Braik, M. Chameleon Swarm Algorithm: A Bio-inspired Optimizer for Solving Engineering Design Problems. Expert Syst. Appl. 2021, 174, 114685. [Google Scholar] [CrossRef]
  37. Dehghani, M.; Trojovsky, P. Serval Optimization Algorithm: A New Bio-Inspired Approach for Solving Optimization Problems. Biomimetics 2022, 7, 204. [Google Scholar] [CrossRef]
  38. Trojovský, P.D. A new bio-inspired metaheuristic algorithm for solving optimization problems based on walruses behavior. Sci. Rep. 2023, 13, 8775. [Google Scholar] [CrossRef]
  39. Hadi, A.; Wagdy, A.; Jambi, K. Single-Objective Real-Parameter Optimization: Enhanced LSHADE-SPACMA Algorithm. In Heuristics for Optimization and Learning; Springer: Berlin/Heidelberg, Germany, 2021; pp. 103–121. [Google Scholar] [CrossRef]
  40. Martínez-Álvarez, F.; Cortés, G.; Torres, J.; Gutiérrez-Avilés, D.; Melgar-García, L.; Pérez-Chacón, R.; Rubio-Escudero, C.; Riquelme, J.; Troncoso, A. Coronavirus Optimization Algorithm: A Bioinspired Metaheuristic Based on the COVID-19 Propagation Model. Big Data 2020, 8, 308–322. [Google Scholar] [CrossRef]
  41. Wagdy, A.; Hadi, A.; Agrawal, P.; Sallam, K.; Khater, A. Gaining-Sharing Knowledge Based Algorithm with Adaptive Parameters Hybrid with IMODE Algorithm for Solving CEC 2021 Benchmark Problems. In Proceedings of the 2021 IEEE Congress on Evolutionary Computation (CEC), Kraków, Poland, 28 June–1 July 2021; pp. 841–848. [Google Scholar] [CrossRef]
  42. Shan-Fan, J.; Wu-Xiong, S.; Zhuo-Wang, J.; Long-Gong, C. IMODE: Improving Multi-Objective Differential Evolution Algorithm. In Proceedings of the 2008 Fourth International Conference on Natural Computation, Jinan, China, 18–20 October 2008; Volume 1, pp. 212–216. [Google Scholar] [CrossRef]
  43. Civicioglu, P. Backtracking search optimization algorithm for numerical optimization problems. Appl. Math. Comput. 2013, 219, 8121–8144. [Google Scholar] [CrossRef]
  44. Coello, C.A.C.; Lamont, G.B.; Van Veldhuizen, D.A. Evolutionary Algorithms for Solving Multi-Objective Problems; Springer: Berlin/Heidelberg, Germany, 2007; Volume 5. [Google Scholar]
  45. Luc, D.T.; Luc, D.T. Linear Programming. In Multiobjective Linear Programming: An Introduction; Springer: Berlin/Heidelberg, Germany, 2016; pp. 49–82. [Google Scholar] [CrossRef]
  46. Deb, K. Multi-objective optimization. In Search Methodologies; Springer: Berlin/Heidelberg, Germany, 2014; pp. 403–449. [Google Scholar] [CrossRef]
  47. Brezočnik, L.; Fister J, I.; Podgorelec, V. Swarm intelligence algorithms for feature selection: A review. Appl. Sci. 2018, 8, 1521. [Google Scholar] [CrossRef]
  48. Engelbrecht, A.P. Computational Intelligence: An Introduction; John Wiley & Sons: Hoboken, NJ, USA, 2007. [Google Scholar]
  49. SISDevelop. SwarmPackagePy a Swarm-Based Optimization Algorithms Package for Python. 2017. Available online: https://github.com/SISDevelop/SwarmPackagePy/ (accessed on 1 January 2023).
  50. Karaboga, D.; Gorkemli, B.; Ozturk, C.; Karaboga, N. A comprehensive survey: Artificial bee colony (ABC) algorithm and applications. Artif. Intell. Rev. 2014, 42, 21–57. [Google Scholar] [CrossRef]
  51. Yang, X.S.; He, X. Bat algorithm: Literature review and applications. Int. J. Bio-Inspired Comput. 2013, 5, 141–149. [Google Scholar] [CrossRef]
  52. Passino, K.M. Bacterial foraging optimization. In Innovations and Developments of Swarm Intelligence Applications; IGI Global: Hershey, PA, USA, 2012; pp. 219–234. [Google Scholar] [CrossRef]
  53. Deep, K.; Bansal, J. Mean particle swarm optimization for function optimization. Int. J. Comput. Intell. Stud. 2009, 1, 72–92. [Google Scholar] [CrossRef]
  54. Luke, S. Essentials of Metaheuristics, 2nd ed.; Lulu: Morrisville, NC, USA, 2013; Available online: http://cs.gmu.edu/∼sean/book/metaheuristics/ (accessed on 1 January 2023).
  55. Chahar, V.; Chhabra, J.; Kumar, D. Optimal Choice of Parameters for Fireworks Algorithm. Procedia Comput. Sci. 2015, 70, 334–340. [Google Scholar] [CrossRef]
  56. Liang, J.J.; Qin, A.K.; Suganthan, P.N.; Baskar, S. Comprehensive learning particle swarm optimizer for global optimization of multimodal functions. IEEE Trans. Evol. Comput. 2006, 10, 281–295. [Google Scholar] [CrossRef]
  57. Nickabadi, A.; Ebadzadeh, M.M.; Safabakhsh, R. A novel particle swarm optimization algorithm with adaptive inertia weight. Appl. Soft Comput. 2011, 11, 3658–3670. [Google Scholar] [CrossRef]
  58. Jamil, M.; Yang, X.S. A literature survey of benchmark functions for global optimization problems. Int. J. Math. Model. Numer. Optim. 2013, 4, 150–194. [Google Scholar] [CrossRef]
  59. Gao, Z.M.; Zhao, J.; Hu, Y.R.; Chen, H.F. The challenge for the nature-inspired global optimization algorithms: Non-symmetric benchmark functions. IEEE Access 2021, 9, 106317–106339. [Google Scholar] [CrossRef]
  60. Al-Roomi, A.R. Unconstrained Single-Objective Benchmark Functions Repository; Dalhousie University, Electrical and Computer Engineering: Halifax, NS, Canada, 2015. [Google Scholar]
Figure 1. Basic algorithmic structure of 1D-SOA.
Symmetry 15 01873 g001
Figure 2. Convergence of the ackley, ackley _ 2 , rastrigin, and schwefel 2.20 functions for all the algorithms in 30 D.
Symmetry 15 01873 g002aSymmetry 15 01873 g002b
Figure 3. Convergence of the ackley function for various number of steps, 1D-SOA algorithm.
Symmetry 15 01873 g003
Figure 4. Convergence of the ackley function for various search directions, 1D-SOA algorithm.
Symmetry 15 01873 g004
Figure 5. Convergence of the FWA, ZOA, AEO, MPSO, CHSO, and 1D-SOA algorithms for various functions in 2D.
Symmetry 15 01873 g005
Figure 6. Convergence of the FWA, ZOA, AEO, MPSO, CHSO, and 1D-SOA algorithms for various functions in 30D.
Symmetry 15 01873 g006
Figure 7. Convergence of the 1D-SOA algorithms for functions with a non-zero optimum for functions f 7 and f 8 .
Symmetry 15 01873 g007
Figure 8. Convergence of the FWA, ZOA, AEO, MPSO, and 1D-SOA algorithms for various functions with a non-zero optimum in 2D.
Symmetry 15 01873 g008
Table 1. Definitions of variables.
VariableMeaningValue
Variables required for all the algorithms
DDimension2, 30, 60
NNumber of individuals10 for 2, 5, and 10, D for the rest
M a x G Maximum number of generations100
x d ( L ) Lower bound of x in the dimension dDepends on the function (Table A8, Table A9 and Table A10)
x d ( U ) Upper bound of x in the dimension dDepends on the function (Table A8, Table A9 and Table A10)
x m i n R N Vector that minimizes the objective function, optimal solution for a minimization problemDepends on the function (Table A8, Table A9 and Table A10)
x i R N Particle
Variables of 1D-SOA that depend on the problem
C n e i g h Neighborhood parameterDepends on the function (Table A8, Table A9 and Table A10)
C n e i g h l Local neighborhood parameterDepends on the function (Table A8, Table A9 and Table A10)
Variables of 1D-SOA that do not change
D t e s t Random test directions to select the direction with the largest improvement 20 % D
s t e p s Number of steps given in each test direction5
M a x ϵ Maximum allowed difference between previous and actual point 1 e 2
M a x N I Maximum allowed number of not improvements of the solution20
N p x Percentage of particles to perform semi cross on 50 %
P s x Probability of semi cross 20 %
P n s Probability of neighborhood search 10 %
P d i m Number of search dimensions 50 % D
N r Percentage of particles to recombine 20 % D
Table 2. Evolutionary algorithms used in this work, together with the extra parameters required.
AlgorithmParameters
Bat Algorithm (BA) [51] r 0 = 0.9 , V 0 = 0.5 , f m i n = 0, f m a x = 0.02 , a l p h a = 0.9 , c s i = 0.9
Bacterial Foraging Optimization (BFO) [52] N c = 2 , N s = 12 , C = 0.2 , P e d = 1.15
Cat Swarm Optimization (CA) [17] M r = 10 , s m p = 2 , s p c = F a l s e , c d c = 1 , s r d = 0.1 , w = 0.1 , c = 1.05 , c s i = 0.6
Chicken Swarm Optimization (CHSO) [10] G = 5 , F L = 0.5
Cuckoo Search Optimization (CU) [13] p a = 0.25 , n e s t = 100
Firefly algorithm (FA) [15] c s i = 1 , p s i = 1 , a l p h a 0 = 1 , a l p h a 1 1 = 0.1 , n o r m 0 = 0 , n o r m 1 = 0.1
Fireworks Algorithm (FWA) [20] m 1 = 7 , m 2 = 7 , e p s = 0.001 , a m p = 2 , a = 0.3 , b = 3
Gravitational Search Algorithm (GSA) [19] G 0 = 3
Mean particle Swarm Optimisation (MPSO) [53] w = 0.7 , c 1 = 1 , c 2 = 1 .
Particle Swarm Optimization (PSO) [18] w = 0.7 , c 1 = 1 , c 2 = 1 .
Social Spider Algorithm (SSA) [14] p f = 0.4
One-Dimensional Search Algorithm (1D-SOA) C n e i g h , C n e i g h l , see Table A8, Table A9 and Table A10
Table 3. Performance of the algorithms 2D.
1D-SOAFWAZOAAEOMPSOCHSO
No. of best values13 (43.3%)8 (26.6%)03 (10%)06 (20%)
No. of mean values10 (33.3%)16 (53.3%)04 (13.3%)00
Table 4. Performance of the algorithms 30D.
1D-SOAFWAZOAAEOMPSOCHSO
No. of best values21 (70%)5 (16.6%)1 (3.33%)2 (6.66%)01 (3.33%)
No. of mean values19 (63.3%)10 (33.3%)01 (3.33%)00
Disclaimer/Publisher’s Note: The statements, opinions and data contained in all publications are solely those of the individual author(s) and contributor(s) and not of MDPI and/or the editor(s). MDPI and/or the editor(s) disclaim responsibility for any injury to people or property resulting from any ideas, methods, instructions or products referred to in the content.

