
A CNN Approach for Emotion Recognition via EEG
 ,
,
Abstract
:1. Introduction
- Advancing ER Technology: The research contributes to the field of ER by applying CNNs to EEG data. This approach leverages the power of deep learning to improve the accuracy and sensitivity of ER, potentially surpassing traditional methods.
- Utilizing EEG Signals: EEG data offers a unique window into the human brain’s emotional states. By focusing on EEG signals, the research taps into valuable physiological data that can reveal subtle emotional nuances, providing a deeper understanding of emotions.
- Dataset Selection—SEED and DEAP: The choice of using the SEED and DEAP datasets adds credibility and relevance to the research. SEED contains labeled EEG data related to specific emotional states, while DEAP includes multimodal data, allowing you to explore the integration of EEG with other physiological signals.
- Improving Model Generalization: The research aims to improve the generalization of models. By applying CNNs to EEG data, it develops models that can adapt to a broader range of emotional contexts, enhancing their real-world applicability.
- Potential Real-time Applications: The application ER of CNNs to EEG data opens the door to real-time or near-real-time ER. This has implications for affective computing, human–computer interaction, and other domains where timely emotional feedback is valuable.
2. Related Work
3. Proposed Work
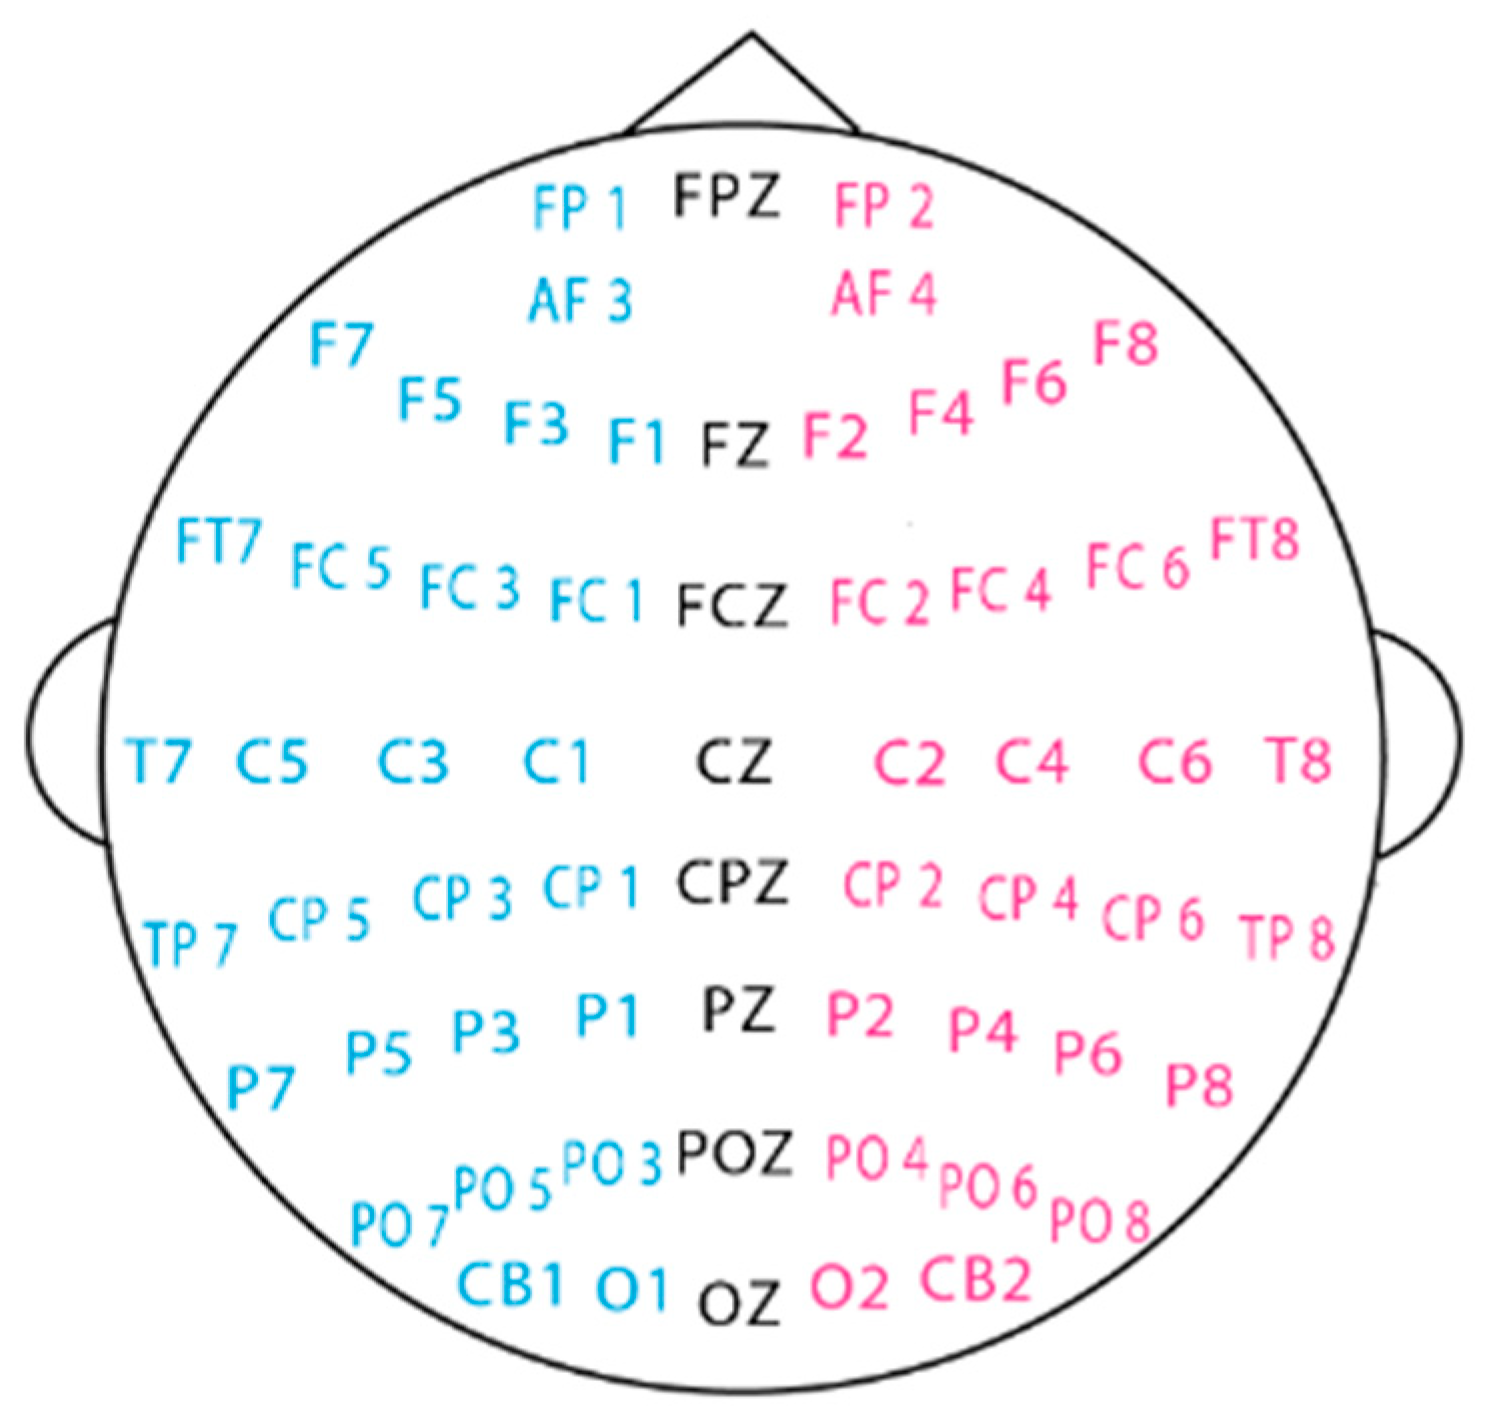
3.1. EEG Data Acquisition
3.2. Data Preprocessing
- Remove noise and artifacts [32]: EEG signals are susceptible to noise and artifacts, such as eye blinks, muscle movements, and environmental interference [4]. Implement suitable filtering methods, including notch filters, band-pass filters, and high-pass filters, to eliminate undesirable noise and artifacts [33].
3.3. Feature Extraction
- Preprocessed EEG Data: Before extracting PSD features, the raw EEG data are preprocessed to remove noise, artifacts, and baseline drift. Common preprocessing techniques include filtering, artifact removal, and normalization as mentioned in the preprocessing subsection before.
- Windowing: Windowing the EEG signal from the DEEP or SEED dataset for use with a CNN involves dividing the continuous EEG data into smaller overlapping windows or segments. Each window () represents a specific time interval of brain activity, and this process allows the CNN to capture local and temporal variations in the EEG signal. Windowing the EEG signal can be represented as shown in Equation (1).where each window is of size . The starting time of each window is determined by the overlap size in Equation (2).where is a continuous time-domain EEG signal from datasets, represents duration of each window, and represents overlap between adjacent windows [37]. The windows are usually fed into the CNN as individual inputs for ER. The CNN will learn and recognize patterns in each window, and the overlap between adjacent windows ensures that temporal variations in the EEG signal are captured effectively.
- Fourier Transform: For each EEG window, the fast Fourier transform (FFT) is employed to transform the signal from the time domain to the frequency domain. The FFT computes the complex amplitudes of distinct frequency components inherent in the EEG signal [38]. The frequency domain depiction acquired through FFT can serve as a feature in ER endeavors. The FFT is sampled at a rate of 128 Hz. Equation (3) outlines the methodology for constructing the period gram for each block [34].
- 4.
- Power Spectrum Calculation: PSD symbolizes the dispersion of power throughout distinct frequency bands within a signal [30]. Within the framework of EEG-ER through CNNs, the PSD is determined from the EEG signal utilizing the FFT. This representation denotes the squared magnitude of frequency components, normalized by the size of the window . The computed PSD values capture the power distribution across different frequency bands in the EEG signal, which are essential for identifying patterns associated with different emotional states.
- 5.
- Frequency Bands: The power spectrum undergoes partitioning into multiple frequency bands using the Welch technique [34], encompassing alpha, beta, theta, and gamma bands, while excluding the computation of the delta band (slow and fast delta waves) which were detected in the ranges 0–2 Hz and 2–4 Hz, respectively, as shown in Figure 7. Delta bands detect deep sleep status which is not vital in our research; as such, the DEAP preprocessed signals were filtered between 4 and 45 Hz.
3.4. Classification
- Input layers, which receive the preprocessed EEG data, which include features such as PSD obtained from the EEG signals.
- Hidden layers, which consist of many layers: (a) Convolutional layers, which are used to detect spatial and temporal patterns in the frequency–domain features of EEG data. These layers consist of filters (i.e., kernels) that slide over the input data to extract relevant features; (b) Activation function layer (e.g., ReLU), which is applied after each convolutional layer to introduce non-linearity and enhance the model’s learning capacity; (c) Pooling layers, which undertake down-sampling of the feature maps, aiming to decrease computational intricacy and enhance translation invariance. The adoption of max pooling or average pooling techniques is a prevalent practice [20]; (d) Batch normalization layer, which stabilizes training and speeds up convergence in the CNN; and (e) Dropout layer (optional layer), which prevents over-fitting and enhances model generalization by randomly dropping out neurons during training.
- Fully connected layers and the activation layer, where fully connected layers are utilized to establish a mapping from high-level features to emotion classes. The count of neurons in the output layer aligns with the number of emotional states intended for classification. Furthermore, the output layer is endowed with the SoftMax activation function, generating probability scores for each emotion class. This facilitates the model’s capacity to formulate class predictions.

- Binary Cross-Entropy Loss, also known as Log Loss.
- Mean Squared Error (MSE) Loss.
- Connectionist Temporal Classification (CTC) Loss.
4. Results and Discussion
4.1. Evaluation Metrics
4.2. Datasets
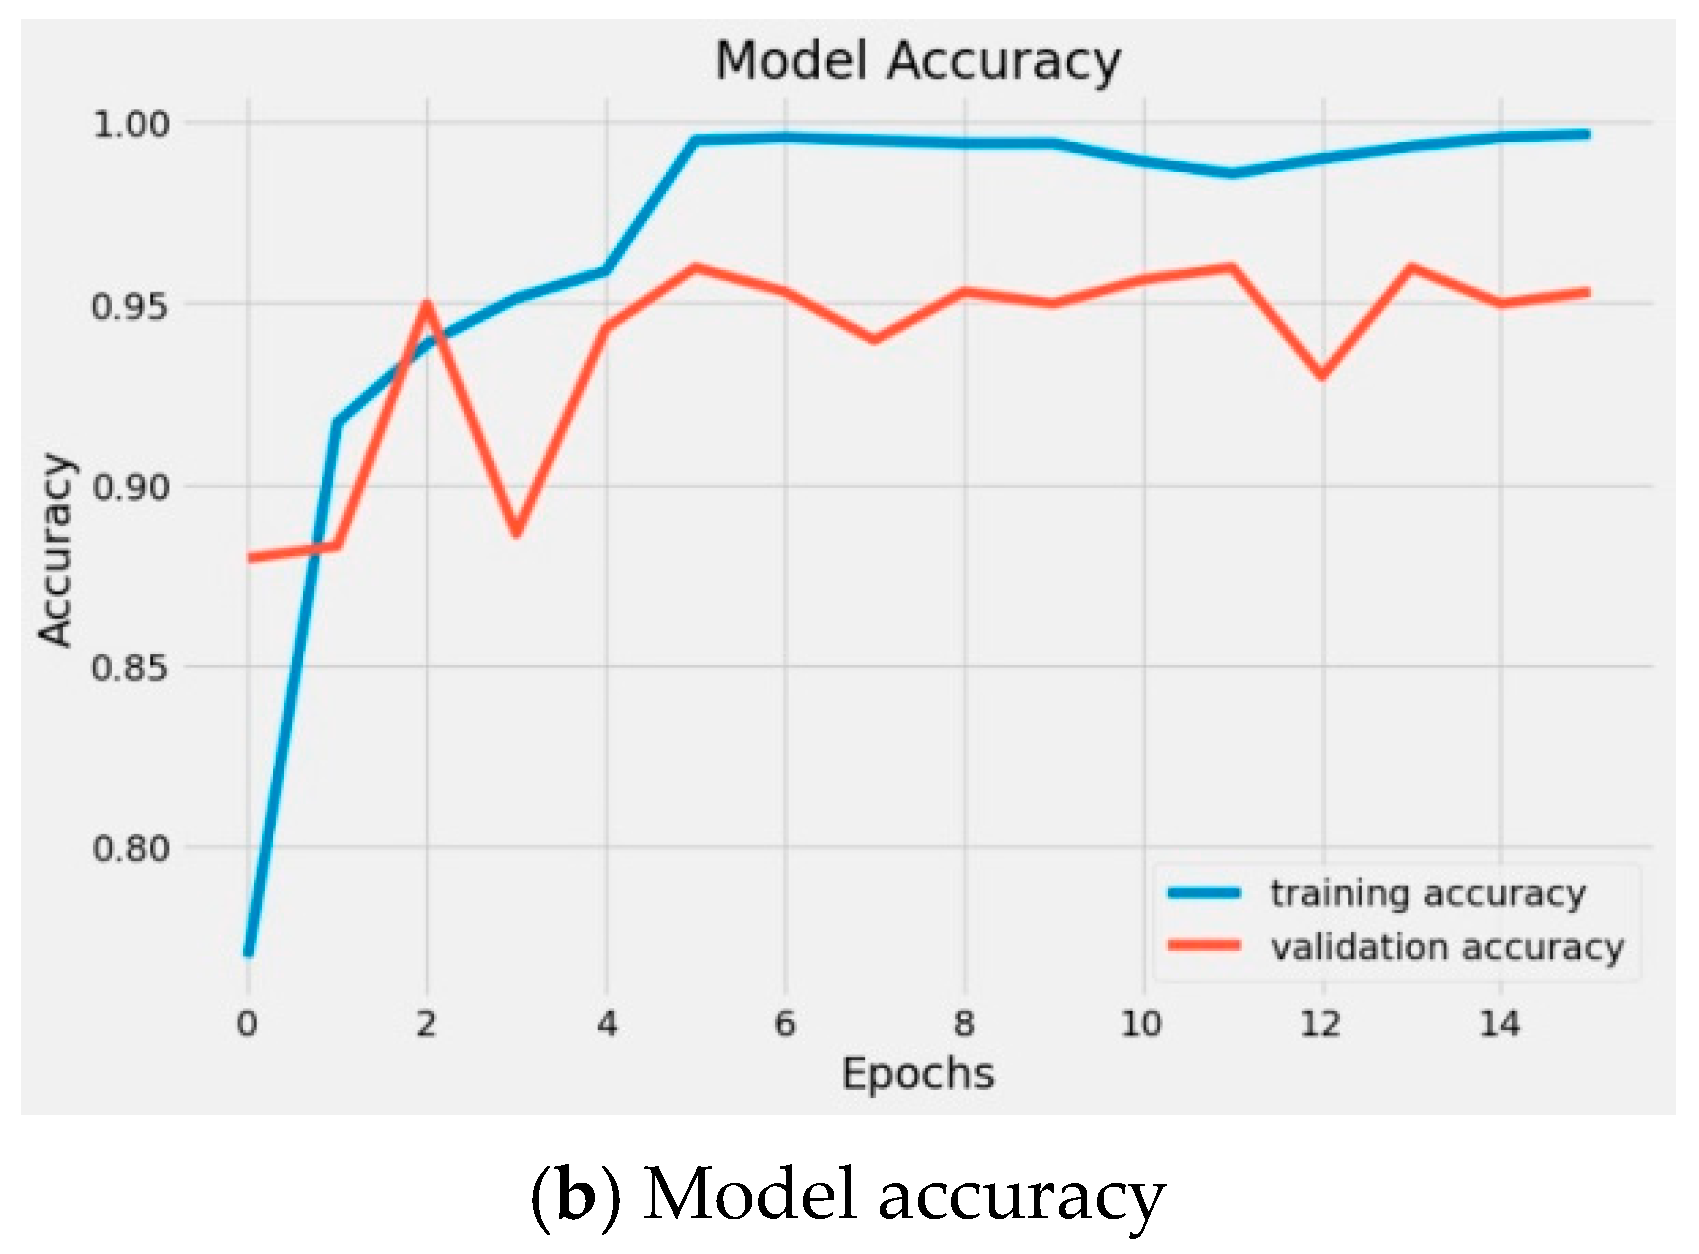
4.3. Training Model
4.4. Result Analysis
5. Conclusions
Author Contributions
Funding
Data Availability Statement
Acknowledgments
Conflicts of Interest
References
- Zaman, K.; Sun, Z.; Shah, S.M.; Shoaib, M.; Pei, L.; Hussain, A. Driver Emotions Recognition Based on Improved Faster R-CNN and Neural Architectural Search Network. Symmetry 2022, 14, 687. [Google Scholar] [CrossRef]
- Schaaff, K.; Schultz, T. Towards emotion recognition from electroencephalographic signals. In Proceedings of the 2009 3rd International Conference on Affective Computing and Intelligent Interaction and Workshops, Amsterdam, The Netherlands, 10–12 September 2009; pp. 1–6. [Google Scholar]
- Soleymani, M.; Asghari-Esfeden, S.; Fu, Y.; Pantic, M. Analysis of EEG Signals and Facial Expressions for Continuous Emotion Detection. IEEE Trans. Affect. Comput. 2016, 7, 17–28. [Google Scholar] [CrossRef]
- Luo, X.; Fu, Q.J.; Galvin, J.J., III. Cochlear Implants Special Issue Article: Vocal Emotion Recognition by Normal-Hearing Listeners and Cochlear Implant Users. Trends Amplif. 2007, 11, 301–315. [Google Scholar] [CrossRef]
- Black, M.J.; Yacoob, Y. Recognizing Facial Expressions in Image Sequences Using Local Parameterized Models of Image Motion. Int. J. Comput. Vis. 1997, 25, 23–48. [Google Scholar] [CrossRef]
- Aznan, N.K.N.; Bonner, S.; Connolly, J.; Al Moubayed, N.; Breckon, T. On the Classification of SSVEP-Based Dry-EEG Signals via Convolutional Neural Networks. In Proceedings of the 2018 IEEE International Conference on Systems, Man, and Cybernetics (SMC), Miyazaki, Japan, 7–10 October 2018; pp. 3726–3731. [Google Scholar]
- Al-Nafjan, A.; Hosny, M.; Al-Ohali, Y.; Al-Wabil, A. Review and Classification of Emotion Recognition Based on EEG Brain-Computer Interface System Research: A Systematic Review. Appl. Sci. 2017, 7, 1239. [Google Scholar] [CrossRef]
- Pollatos, O.; Kirsch, W.; Schandry, R. On the relationship between interoceptive awareness, emotional experience, and brain processes. Cogn. Brain Res. 2005, 25, 948–962. [Google Scholar] [CrossRef]
- Garg, D.; Verma, G.K. Emotion Recognition in Valence-Arousal Space from Multi-channel EEG data and Wavelet based Deep Learning Framework. Procedia Comput. Sci. 2020, 171, 857–867. [Google Scholar] [CrossRef]
- Chang, C.-C.; Lin, C.-J. LIBSVM: A library for support vector machines. ACM Trans. Intell. Syst. Technol. 2011, 2, 1–27. [Google Scholar] [CrossRef]
- Duan, R.-N.; Zhu, J.-Y.; Lu, B.-L. Differential entropy feature for EEG-based emotion classification. In Proceedings of the 2013 6th International IEEE/EMBS Conference on Neural Engineering (NER), San Diego, CA, USA, 6–8 November 2013; pp. 81–84. [Google Scholar]
- Wen, Z.; Xu, R.; Du, J. A novel convolutional neural networks for emotion recognition based on EEG signal. In Proceedings of the 2017 International Conference on Security, Pattern Analysis, and Cybernetics (SPAC), Shenzhen, China, 15–17 December 2017; pp. 672–677. [Google Scholar]
- Currie, J. Music After All. J. Am. Music. Soc. 2009, 62, 145–203. [Google Scholar] [CrossRef]
- Mehrabian, A. Pleasure-arousal-dominance: A general framework for describing and measuring individual differences in Temperament. Curr. Psychol. 1996, 14, 261–292. [Google Scholar] [CrossRef]
- Brosschot, J.F.; Thayer, J.F. Heart rate response is longer after negative emotions than after positive emotions. Int. J. Psychophysiol. 2003, 50, 181–187. [Google Scholar] [CrossRef] [PubMed]
- Gill, R.; Singh, J. Consumer Emotional State Evaluation Using EEG Based Emotion Recognition Using Deep Learning Approach. In Advanced Computing; Springer: Singapore, 2021; pp. 113–127. [Google Scholar]
- Jenke, R.; Peer, A.; Buss, M. Feature extraction and selection for emotion recognition from EEG. IEEE Trans. Affect. Comput. 2014, 5, 327–339. [Google Scholar] [CrossRef]
- Gao, Y.; Gao, B.; Chen, Q.; Liu, J.; Zhang, Y. Deep Convolutional Neural Network-Based Epileptic Electroencephalogram (EEG) Signal Classification. Front. Neurol. 2020, 11, 375. [Google Scholar] [CrossRef] [PubMed]
- Tong, L.; Zhao, J.; Fu, W. Emotion Recognition and Channel Selection Based on EEG Signal. In Proceedings of the 2018 11th International Conference on Intelligent Computation Technology and Automation (ICICTA), Changsha, China, 22–23 September 2018; pp. 101–105. [Google Scholar]
- Haqque, R.H.D.; Djamal, E.C.; Wulandari, A. Emotion Recognition of EEG Signals Using Wavelet Filter and Convolutional Neural Networks. In Proceedings of the 2021 8th International Conference on Advanced Informatics: Concepts, Theory and Applications (ICAICTA), Bandung, Indonesia, 29–30 September 2021; pp. 1–6. [Google Scholar]
- Yamashita, R.; Nishio, M.; Do, R.K.G.; Togashi, K. Convolutional neural networks: An overview and application in radiology. Insights Imaging 2018, 9, 611–629. [Google Scholar] [CrossRef] [PubMed]
- Bhatti, A.M.; Majid, M.; Anwar, S.M.; Khan, B. Human emotion recognition and analysis in response to audio music using brain signals. Comput. Hum. Behav. 2016, 65, 267–275. [Google Scholar] [CrossRef]
- Salama, E.S.; El-Khoribi, R.A.; Shoman, M.E.; Wahby, M.A. EEG-Based Emotion Recognition using 3D Convolutional Neural Networks. Int. J. Adv. Comput. Sci. Appl. 2018, 9, 329–337. [Google Scholar] [CrossRef]
- Song, T.; Zheng, W.; Song, P.; Cui, Z. EEG Emotion Recognition Using Dynamical Graph Convolutional Neural Networks. IEEE Trans. Affect. Comput. 2020, 11, 532–541. [Google Scholar] [CrossRef]
- Zheng, W.-L.; Lu, B.-L. Investigating Critical Frequency Bands and Channels for EEG-Based Emotion Recognition with Deep Neural Networks. IEEE Trans. Auton. Ment. Dev. 2015, 7, 162–175. [Google Scholar] [CrossRef]
- Zhou, J.; Wei, X.; Cheng, C.; Yang, Q.; Li, Q. Multimodal Emotion Recognition Method Based on Convolutional Auto-Encoder. Int. J. Comput. Intell. Syst. 2019, 12, 351–358. [Google Scholar] [CrossRef]
- Zhao, Y.; Yang, J.; Lin, J.; Yu, D.; Cao, X. A 3D Convolutional Neural Network for Emotion Recognition based on EEG Signals. In Proceedings of the 2020 International Joint Conference on Neural Networks (IJCNN), Glasgow, UK, 19–24 July 2020; pp. 1–6. [Google Scholar]
- Ozdemir, M.A.; Degirmenci, M.; Izci, E.; Akan, A. EEG-based emotion recognition with deep convolutional neural networks. Biomed. Eng./Biomed. Tech. 2020, 66, 43–57. [Google Scholar] [CrossRef]
- Ramzan, M.; Dawn, S. Fused CNN-LSTM deep learning emotion recognition model using electroencephalography signals. Int. J. Neurosci. 2023, 133, 587–597. [Google Scholar] [CrossRef]
- Wang, R.; Wang, J.; Yu, H.; Wei, X.; Yang, C.; Deng, B. Power spectral density and coherence analysis of Alzheimer’s EEG. Cogn. Neurodynamics 2015, 9, 291–304. [Google Scholar] [CrossRef]
- Yoon, H.J.; Chung, S.Y. EEG-based emotion estimation using Bayesian weighted-log-posterior function and perceptron convergence algorithm. Comput. Biol. Med. 2013, 43, 2230–2237. [Google Scholar] [CrossRef] [PubMed]
- Nawaz, R.; Nisar, H.; Voon, Y.V. The Effect of Music on Human Brain; Frequency Domain and Time Series Analysis Using Electroencephalogram. IEEE Access 2018, 6, 45191–45205. [Google Scholar] [CrossRef]
- Khare, S.K.; Bajaj, V. Time-Frequency Representation and Convolutional Neural Network-Based Emotion Recognition. IEEE Trans. Neural Netw. Learn. Syst. 2021, 32, 2901–2909. [Google Scholar] [CrossRef] [PubMed]
- Nawaz, R.; Cheah, K.H.; Nisar, H.; Yap, V.V. Comparison of different feature extraction methods for EEG-based emotion recognition. Biocybern. Biomed. Eng. 2020, 40, 910–926. [Google Scholar] [CrossRef]
- Picard, R.W.; Vyzas, E.; Healey, J. Toward Machine Emotional Intelligence: Analysis of Affective Physiological State. IEEE Trans. Pattern Anal. Mach. Intell. 2001, 23, 1175–1191. [Google Scholar] [CrossRef]
- Rahman, A.; Anjum, A.; Milu, M.H.; Khanam, F.; Uddin, M.S.; Mollah, N. Emotion recognition from EEG-based relative power spectral topography using convolutional neural network. Array 2021, 11, 100072. [Google Scholar] [CrossRef]
- Khosla, A.; Khandnor, P.; Chand, T. A comparative analysis of signal processing and classification methods for different applications based on EEG signals. Biocybern. Biomed. Eng. 2020, 40, 649–690. [Google Scholar] [CrossRef]
- Novitasari, D.; Suwanto, S.; Bisri, M.; Asyhar, A. Classification of EEG Signals using Fast Fourier Transform (FFT) and Adaptive Neuro Fuzzy Inference System (ANFIS). Mantik J. Mat. 2019, 5, 35–44. [Google Scholar]
- Wang, Z.; Tong, Y.; Heng, X. Phase-Locking Value Based Graph Convolutional Neural Networks for Emotion Recognition. IEEE Access 2019, 7, 93711–93722. [Google Scholar] [CrossRef]
- Koelstra, S.; Muhl, C.; Soleymani, M.; Lee, J.-S.; Yazdani, A.; Ebrahimi, T.; Pun, T.; Nijholt, A.; Patras, I. DEAP: A Database for Emotion Analysis; Using Physiological Signals. IEEE Trans. Affect. Comput. 2012, 3, 18–31. [Google Scholar] [CrossRef]
- Ho, N.-H.; Yang, H.-J.; Kim, S.-H.; Lee, G. Multimodal Approach of Speech Emotion Recognition Using Multi-Level Multi-Head Fusion Attention-Based Recurrent Neural Network. IEEE Access 2020, 8, 61672–61686. [Google Scholar] [CrossRef]
- Gao, Q.; Yang, Y.; Kang, Q.; Tian, Z.; Song, Y. EEG-based Emotion Recognition with Feature Fusion Networks. Int. J. Mach. Learn. Cybern. 2022, 13, 421–429. [Google Scholar] [CrossRef]


| Parameters of CNN Model | Value |
|---|---|
| Mini Batch Size | 32 |
| Max Epochs | 50 Epochs |
| Learning Rate | 1 × 10⁻⁴ |
| Loss Function | Cross Entropy |
| Activation Function | ReLU |
| Pooling | Max Pooling |
| Optimizer | Adam |
| Dimensions | Accuracy | F1 Score % | Recall | Precision |
|---|---|---|---|---|
| Positive | 98.23% | 93.68% | 90.78% | 94.012% |
| Neutral | 97.95% | 93.32% | 91.02% | 92.89% |
| Negative | 94.54% | 92.65% | 90.32% | 92.087% |
| Dimensions | Accuracy | F1 Score % | Recall | Precision |
|---|---|---|---|---|
| Valence | 94.23% | 89.32% | 86.64% | 88.32% |
| Arousal | 93.78% | 90.31% | 87.26% | 91.45% |
| Dominance | 89.54% | 81.23% | 75.85% | 81.10% |
| Reference | Features | Classifier | Average Accuracy (%) |
|---|---|---|---|
| [28] | FFT | CNN | 88 for 3D VAD |
| [26] | CAE | FCNN | 92 |
| [20] | Wavelet Feature | 2D CNN | 83.44 |
| [16] | PSD | DNN | 93 for arousal |
| Ours | PSD | 2D CNN | 92.54 |
| Reference | Features | Classifier | Average Accuracy (%) |
|---|---|---|---|
| [36] | RPSD-Based Topographic Image for Emotional EEG Data | CNN | 89.06 |
| Ours | PSD | 2D CNN | 96.32 |
Disclaimer/Publisher’s Note: The statements, opinions and data contained in all publications are solely those of the individual author(s) and contributor(s) and not of MDPI and/or the editor(s). MDPI and/or the editor(s) disclaim responsibility for any injury to people or property resulting from any ideas, methods, instructions or products referred to in the content. |
© 2023 by the authors. Licensee MDPI, Basel, Switzerland. This article is an open access article distributed under the terms and conditions of the Creative Commons Attribution (CC BY) license (https://creativecommons.org/licenses/by/4.0/).
Share and Cite
Mahmoud, A.; Amin, K.; Al Rahhal, M.M.; Elkilani, W.S.; Mekhalfi, M.L.; Ibrahim, M. A CNN Approach for Emotion Recognition via EEG. Symmetry 2023, 15, 1822. https://doi.org/10.3390/sym15101822
Mahmoud A, Amin K, Al Rahhal MM, Elkilani WS, Mekhalfi ML, Ibrahim M. A CNN Approach for Emotion Recognition via EEG. Symmetry. 2023; 15(10):1822. https://doi.org/10.3390/sym15101822
Chicago/Turabian StyleMahmoud, Aseel, Khalid Amin, Mohamad Mahmoud Al Rahhal, Wail S. Elkilani, Mohamed Lamine Mekhalfi, and Mina Ibrahim. 2023. "A CNN Approach for Emotion Recognition via EEG" Symmetry 15, no. 10: 1822. https://doi.org/10.3390/sym15101822