1. Introduction
With the development of urbanization and rapid increases in the population densities of cities, the traffic demand has increased, and the construction of roads and bridges can no longer meet requirements due to limited ground space. The construction of tunnels, which make use of the underground space of urban cities, has become a promising way to solve this problem and promote the sustainable development of cities. For the construction of tunnels, shield tunneling has been widely adopted for its versatility in complex geological conditions and good performance in controlling the ground surface deformation and safety of the surrounding environment during excavation [
1]. However, in the case of super-large-diameter shield tunnels, it is more difficult to control the soil deformation on the ground and at the tunnel face, as the ratio of the shield’s buried depth to its diameter is relatively small generally.
In the past, many scholars studied shield tunneling in ground consisting of various soils and investigated the ground deformation due to tunnel excavation. Using field measurements, Peck [
2] found that the transverse settlement trough of the ground caused by tunnel excavation can generally be described by a Gaussian distribution curve. With the continuous development and progress of tunnel engineering, in order to better apply the Peck formula to predict ground deformation caused by tunneling, scholars have modified the Peck formula according to soil layer properties, construction parameters, and deformation requirements. Fattah et al. [
3] adopted analytical, empirical, and numerical solutions to investigate the shape of the settlement trough induced by tunneling in cohesive ground. Generally, the Peck formula was unsuitable for a shallow-buried tunnel, so Song et al. [
4] proposed a simple and accurate prediction approach for surface settlement, which involved improving the Peck method based on the basic idea of stochastic medium theory. Zhou et al. [
5] built up a database consisting of 16 tunnel excavation projects in clayey soils. Based on the database, a serviceability performance function was proposed based on the Peck formula, and the influence of the ground loss ratio and fitting parameters on the failure probability was evaluated. As seepage is ubiquitous during tunneling in grounds with high groundwater tables, Wei et al. [
6] established a groundwater seepage and drainage model of a tunnel. The influence of seepage on the effective stress of the soil layer around the tunnel was analyzed, and a calculation formula for the ground settlement considering seepage flow was derived based on the Peck formula. Tang et al. [
7] proposed a modified Peck formula considering geological conditions to improve the accuracy of the surface settlement prediction of twin tunnels. In practice, due to the different excavation sequences, an asymmetric disturbance is generated by the construction of twin parallel tunnels. A modified Peck formula suitable for considering the influence of the preceding tunnel on the subsequent tunnel was proposed by Li et al. [
8].
In addition to empirical formulas, the finite element method has been adopted by many scholars to establish numerical models by which to simulate tunnel excavation, and the results are generally compared with predictions using empirical formulas [
9,
10,
11,
12]. Zhang et al. [
13] described the performance of the Peck formula in predicting the transverse surface settlement trough in a sandy cobble layer, and the influence of shield tunneling on the transverse and longitudinal ground deformation was estimated using numerical simulation and analytical analyses. Zhang et al. [
14] established a three-dimensional numerical model of tunneling to analyze the ground settlement and used Peck’s formula to determine the width coefficient of the settlement trough and the loss rate of the sand-mixed stratum.
Physical model testing has been adopted by many scholars to simulate the tunnel excavation process in various soil layers. Fang et al. [
1] carried out model testing and observed that two major factors influence the longitudinal settlement of the ground surface, i.e., the buried depth of the tunnel and the loss of surface soil. The results of the scaled-model testing by Hu et al. [
15] showed that the water content of sand has a significant influence on the settlement of the surface and deep soil layer. Moussaei et al. [
16] carried out model tests to simulate the excavation process for a single circular tunnel and explored the surface deformation caused by shield tunneling in sandy soils with three cover/diameter ratios of the tunnel and four different densities. Based on digital image correlation (DIC) technology, transparent sand was adopted by Sun et al. [
17] to investigate the shape of the settlement trough under different buried depths of the tunnel. The results show that the width of the settlement trough decreases with the increase in buried depth, and the disturbance zone of the soil layer changes from “trapezoid + rectangle” to “trapezoid + bell”. Lu et al. [
18] studied three-dimensional surface settlement caused by tunnel excavation under different cover/diameter ratios using centrifuge testing and found that the influence range of surface settlement along the tunneling direction is within 1.25 times the diameter from the tunnel excavation face.
Most of the above studies focused on medium-diameter to large-diameter shield tunnels, but few studies have investigated the ground deformation of the sand soil layer caused by the excavation of super-large-diameter tunnels. In addition, the constitutive models used in previous numerical studies seldom consider the differences in mechanical properties of sand under different confining pressures and relative densities. Therefore, the advanced soil constitutive models were adopted necessarily to systematically study the ground deformation induced by the construction of super-large-diameter shield tunnels.
In this study, the characteristics of ground deformation induced by the construction of a super-large-diameter tunnel are investigated, based on the Jihuaxi Road tunnel project in Foshan of Guangdong province, China. The tunnel is mainly buried in ground consisting of silty sand, with a buried depth ranging from 0.8 to 3 times the tunnel diameter. The research presented in this manuscript can be divided into three stages. Firstly, the parameters of the SANISAND constitutive model are first calibrated based on the triaxial test data for Foshan silty fine sand. Then, based on two-dimensional numerical analyses, the influence of the ratio of the buried depth of the tunnel to the diameter and the relative density of the sand on ground deformation as induced by shield tunneling are studied. Finally, the impact of the ratio of the buried depth to the diameter and the relative density of the sand on the parameters of Peck’s formula is analyzed, and a formula for estimating the main parameters of the settlement curve is obtained.
2. Calibration of SANISAND Constitutive Model by Triaxial Test
SANISAND is an elastoplastic model of sand controlled by stress ratio and considering critical state and shear dilatancy. By changing several values of a set of constitutive model parameters, the behavior of sand under different compactness and stress conditions can be achieved. The stress-strain relationship of the constitutive model can be described as follows [
19]:
G and
K are elastic shear and bulk incremental moduli, respectively.
H is the plastic hardening modulus associated with the increment in stress ratio
dη. Whereas
p is the mean normal stress,
q is the deviatoric stress;
εq and
εv are the deviatoric and volumetric strain, respectively. In addition, the superscripts
e and
p represent the elastic and plastic parts of the strain, respectively.
Since deviatoric plasticity occurs only when
dη
= 0, Equation (2), a stress-ratio-defined yield surface should be proposed as follows:
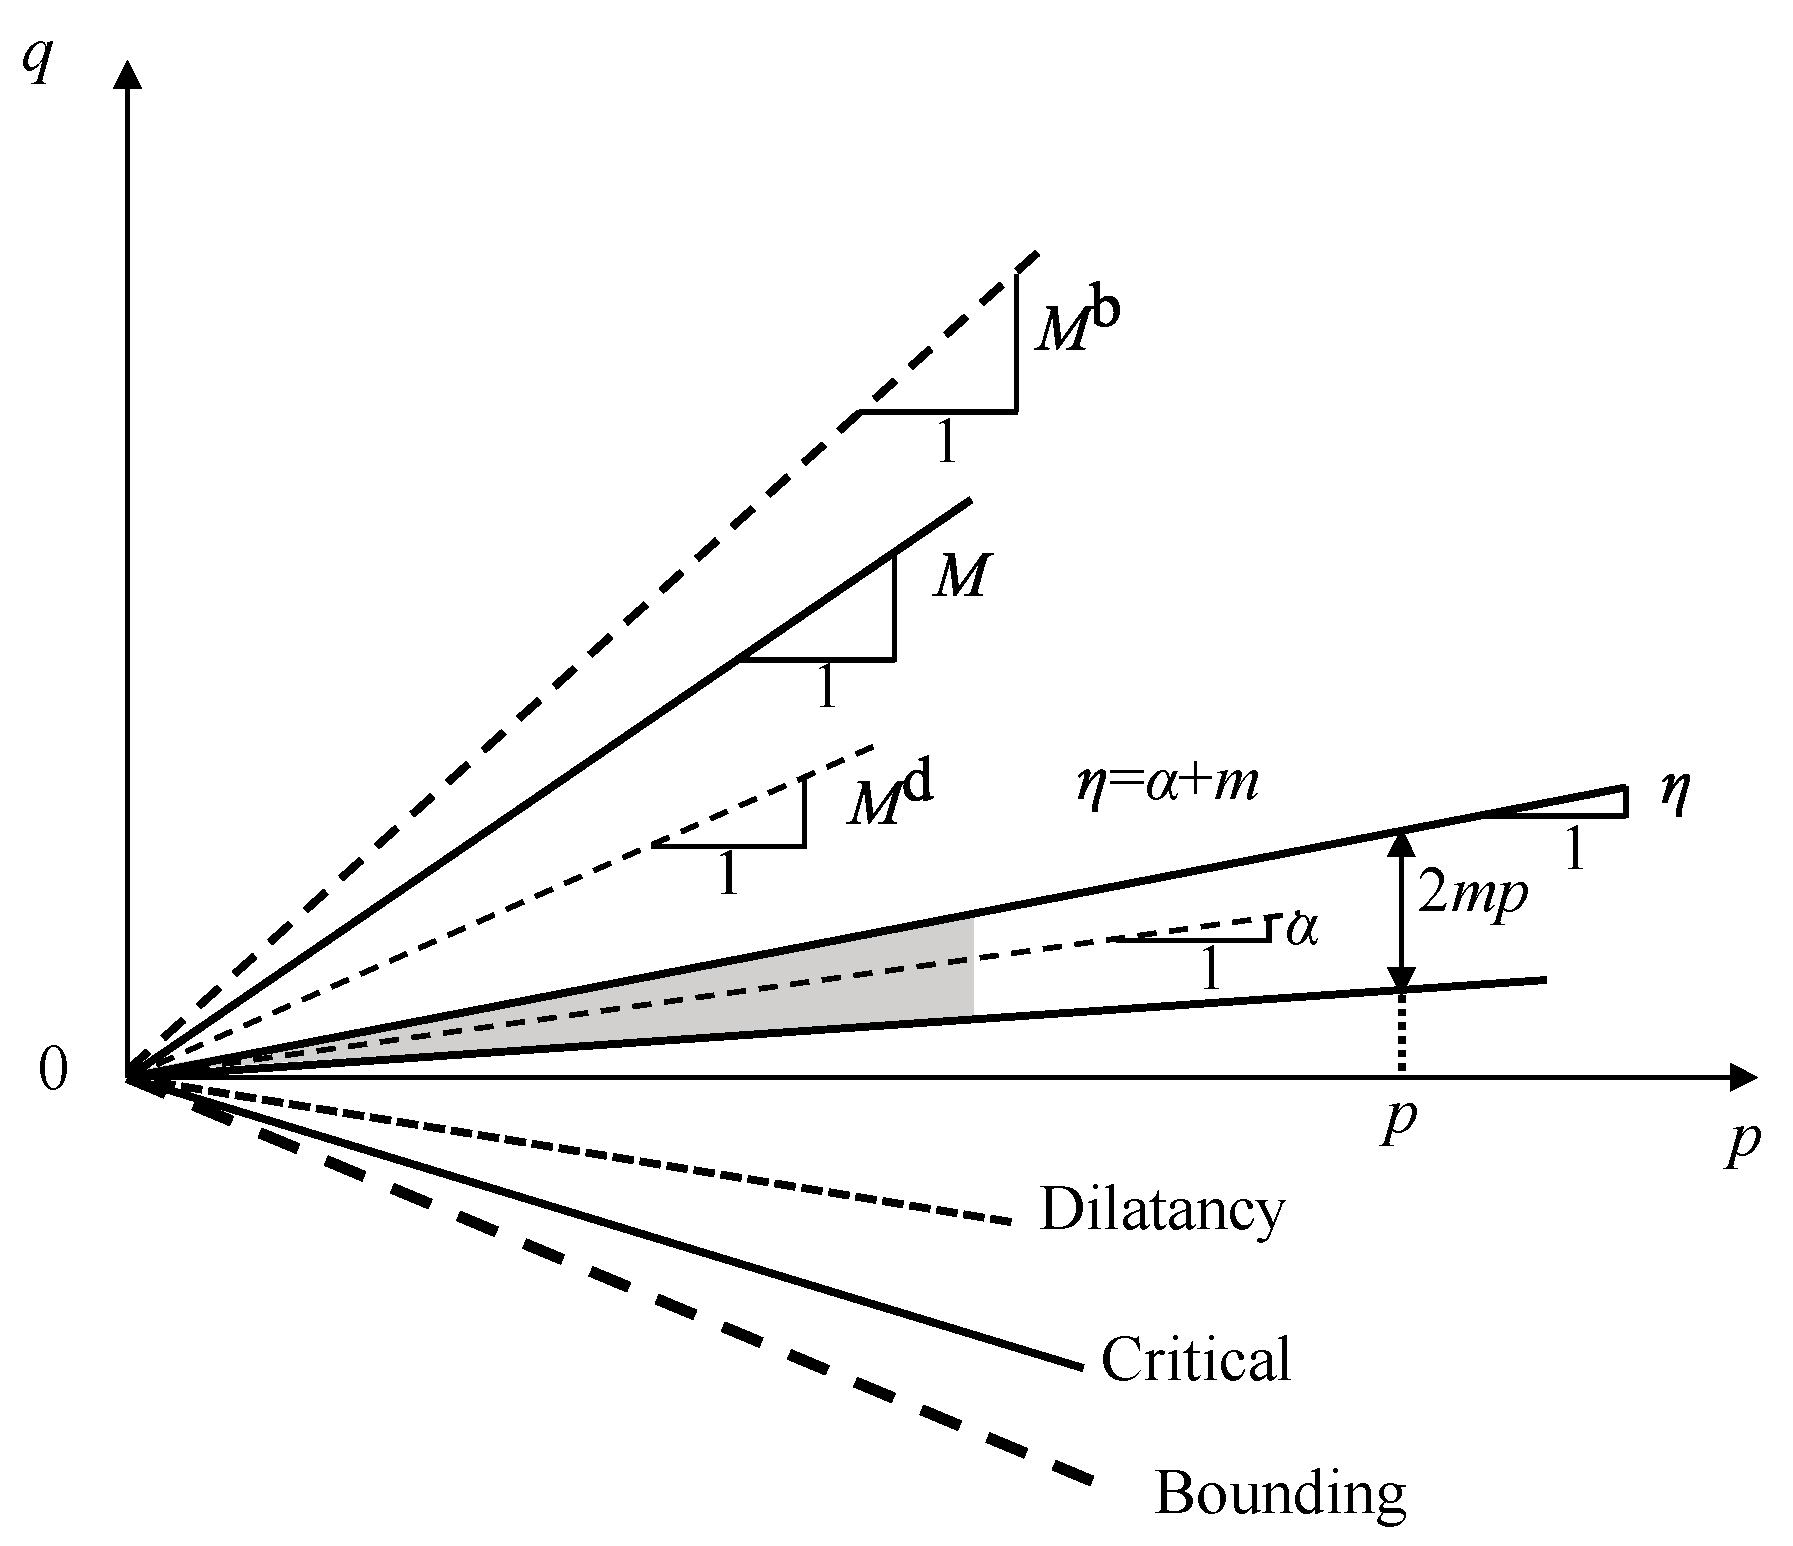
Equation (3) represents geometrically a ‘‘wedge’’ in
p-
q space, shown by the shaded area in
Figure 1, whose bisecting line has a slope α, and the wedge opening a value of 2
mp. The α and
m are stress ratio quantities. When η satisfies Equation (4) and dη points “outward” from the wedge, i.e., dη > 0 at the upper and dη < 0 at the lower wedge lines, plasticity occurs according to Equation (2).
In this study, the constitutive model, SANISAND, is adopted. Due to the high permeability coefficient of sand, the in situ sand layer has been consolidated under gravity. As the loading rate induced by shield tunneling is relatively low which allows the complete dissipation of excess pore water pressure, consolidated drained (CD) tests are adopted to calibrate the model parameters. The samples are prepared by compaction of sand layer by layer in the laboratory so that its void ratio is close to that of in situ soil. The physical characteristics of silty fine sand are shown in
Table 1.
The main parameters for the SANISAND model include the elastic parameters and the critical state parameters.
- (1)
Elastic parameters
Among the parameters of the SANISAND constitutive model, the elastic parameters include the shear modulus constant
G0 and Poisson’s ratio
ν. Poisson’s ratio can be taken as
ν = 0.2 for silty sand and the shear modulus constant
G0 is determined by the following equation:
where
is the void ratio,
is the effective mean normal stress,
Pat is the atmospheric pressure, and
is the elastic component of the deviator strain.
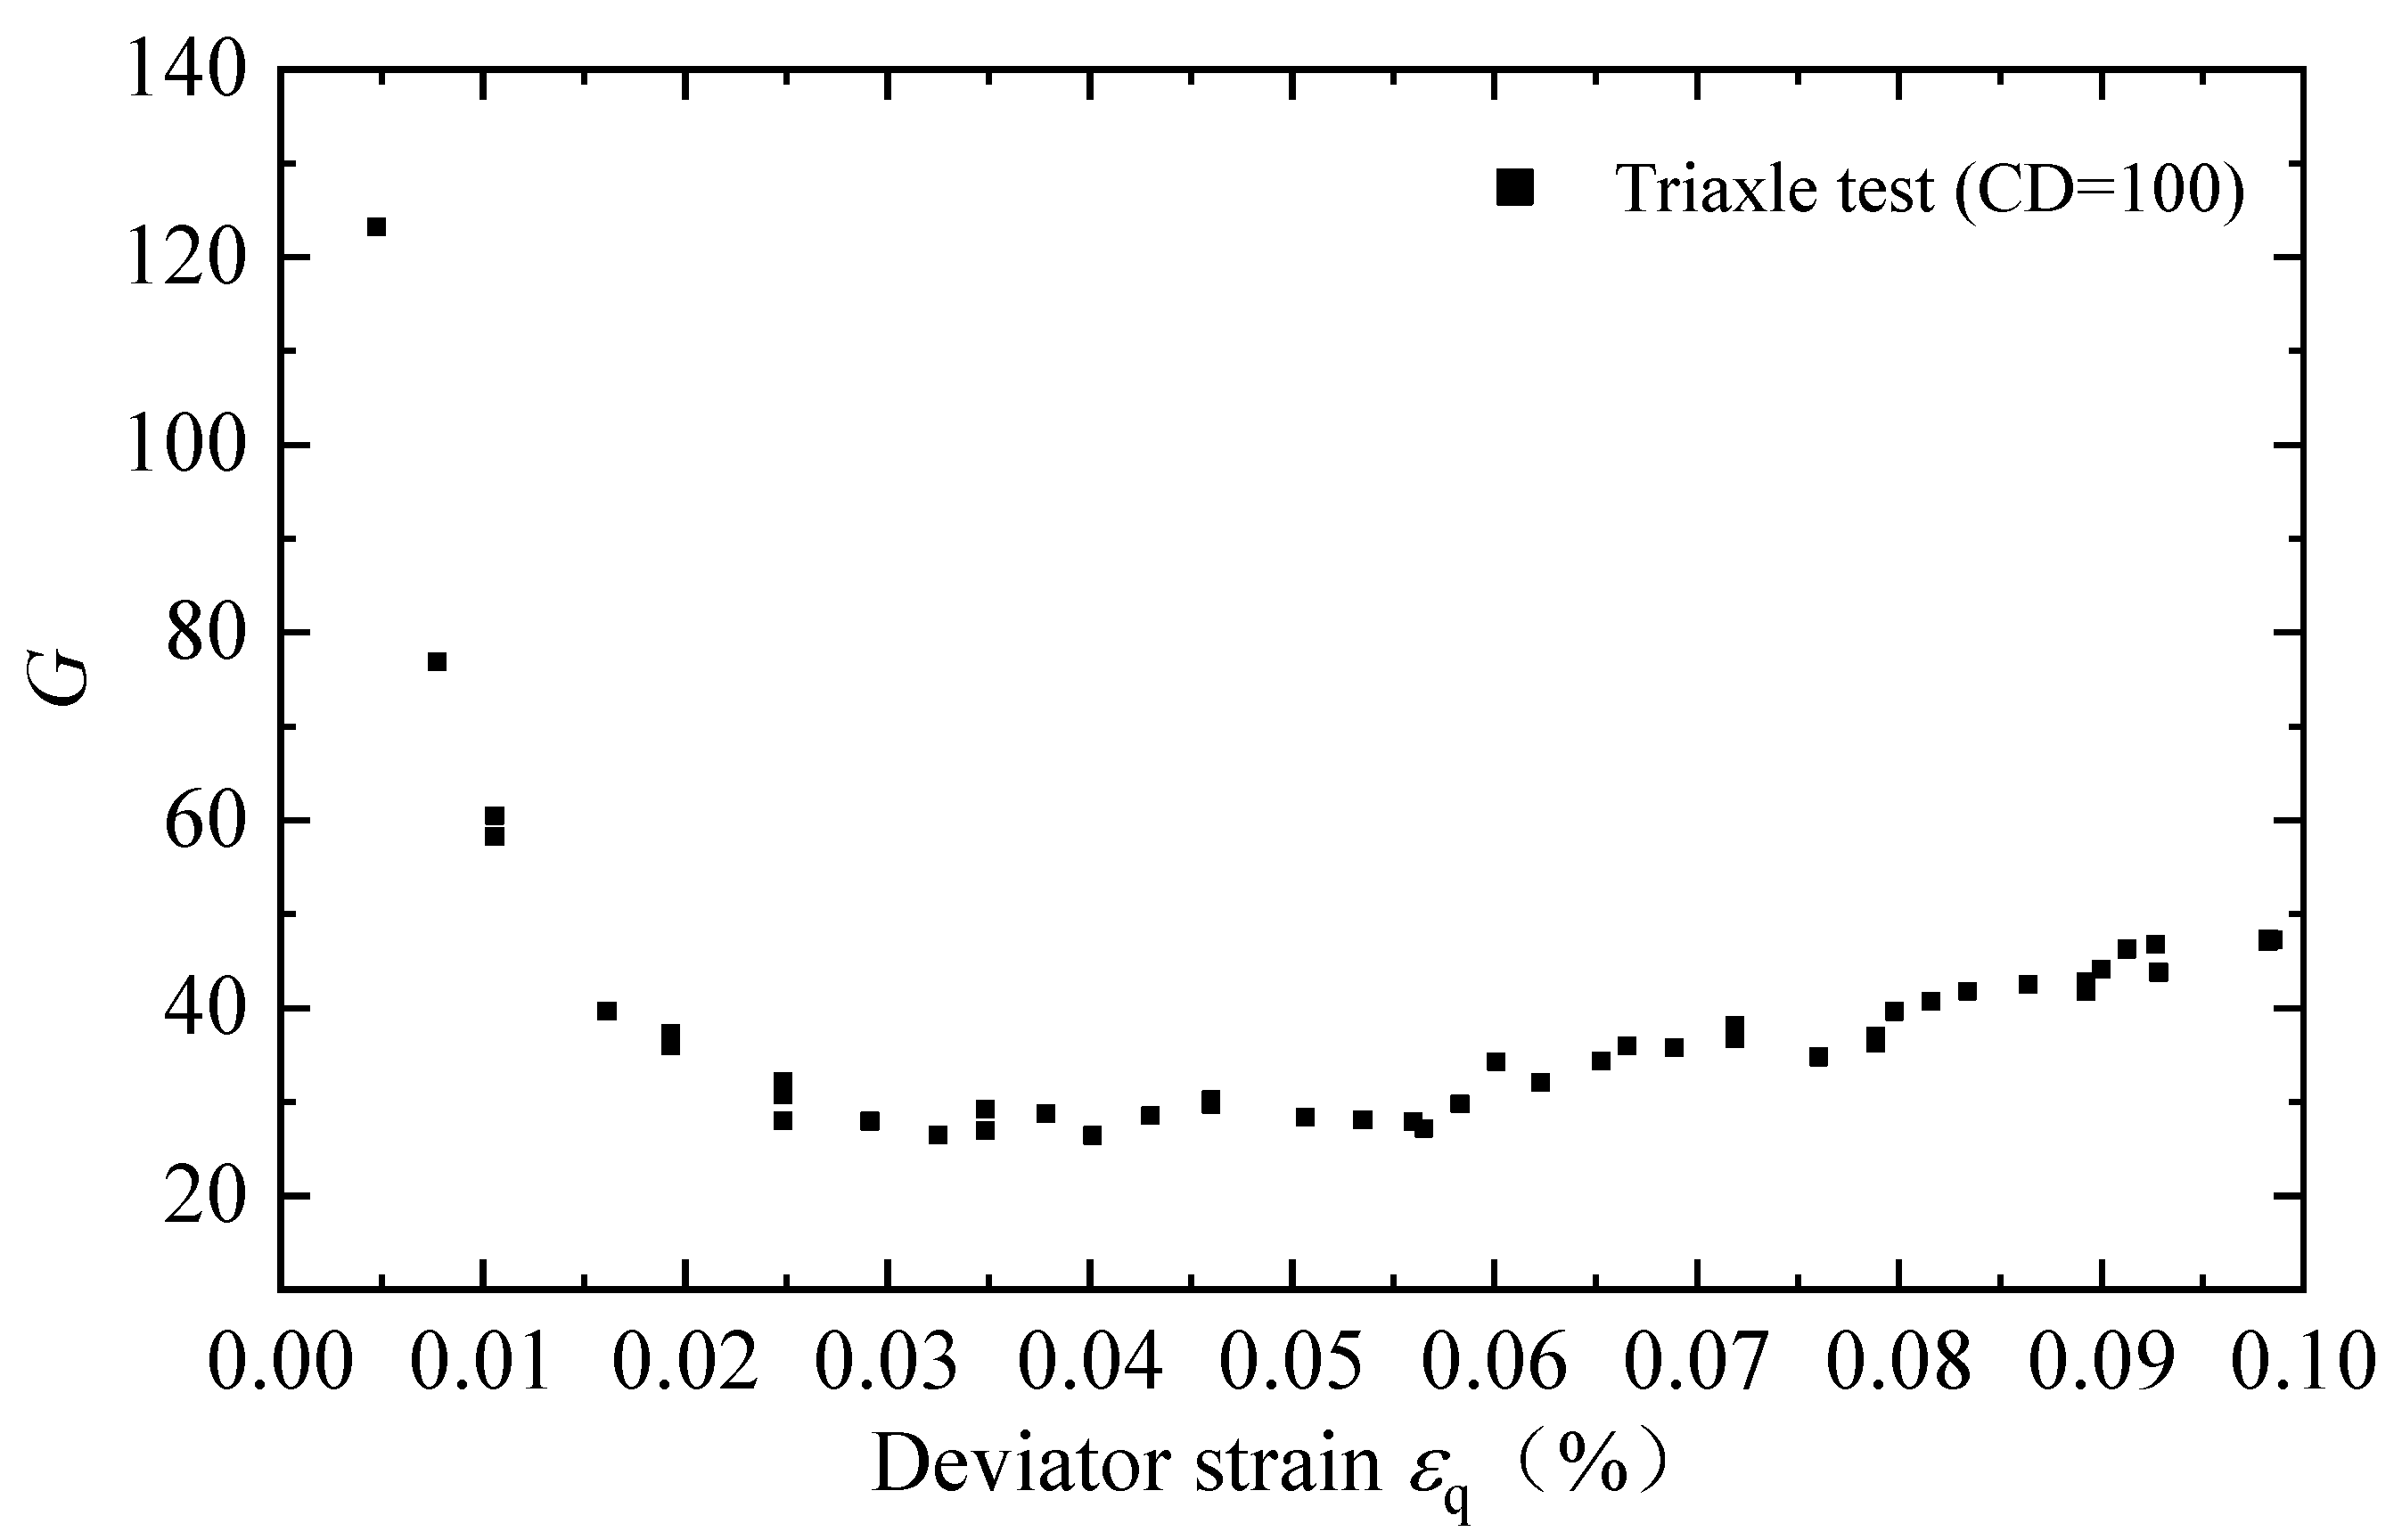
According to Taiebat and Dafalias [
20], the calibration of
G0 should be based on the measured relationship between the deviatoric stress
q and the deviatoric strain
εq when
εq is less than 0.1%.
Figure 2 presents the results obtained from the triaxial drain test with a confining pressure of 100 kPa. Compared with the relevant research [
19,
20,
21], the value of
G0 can be taken as 120.
- (2)
Critical state parameters
In the SANISAND model, the critical state parameters include the critical state stress ratio and the critical state line. The critical state stress ratio is Mc under triaxial compression.
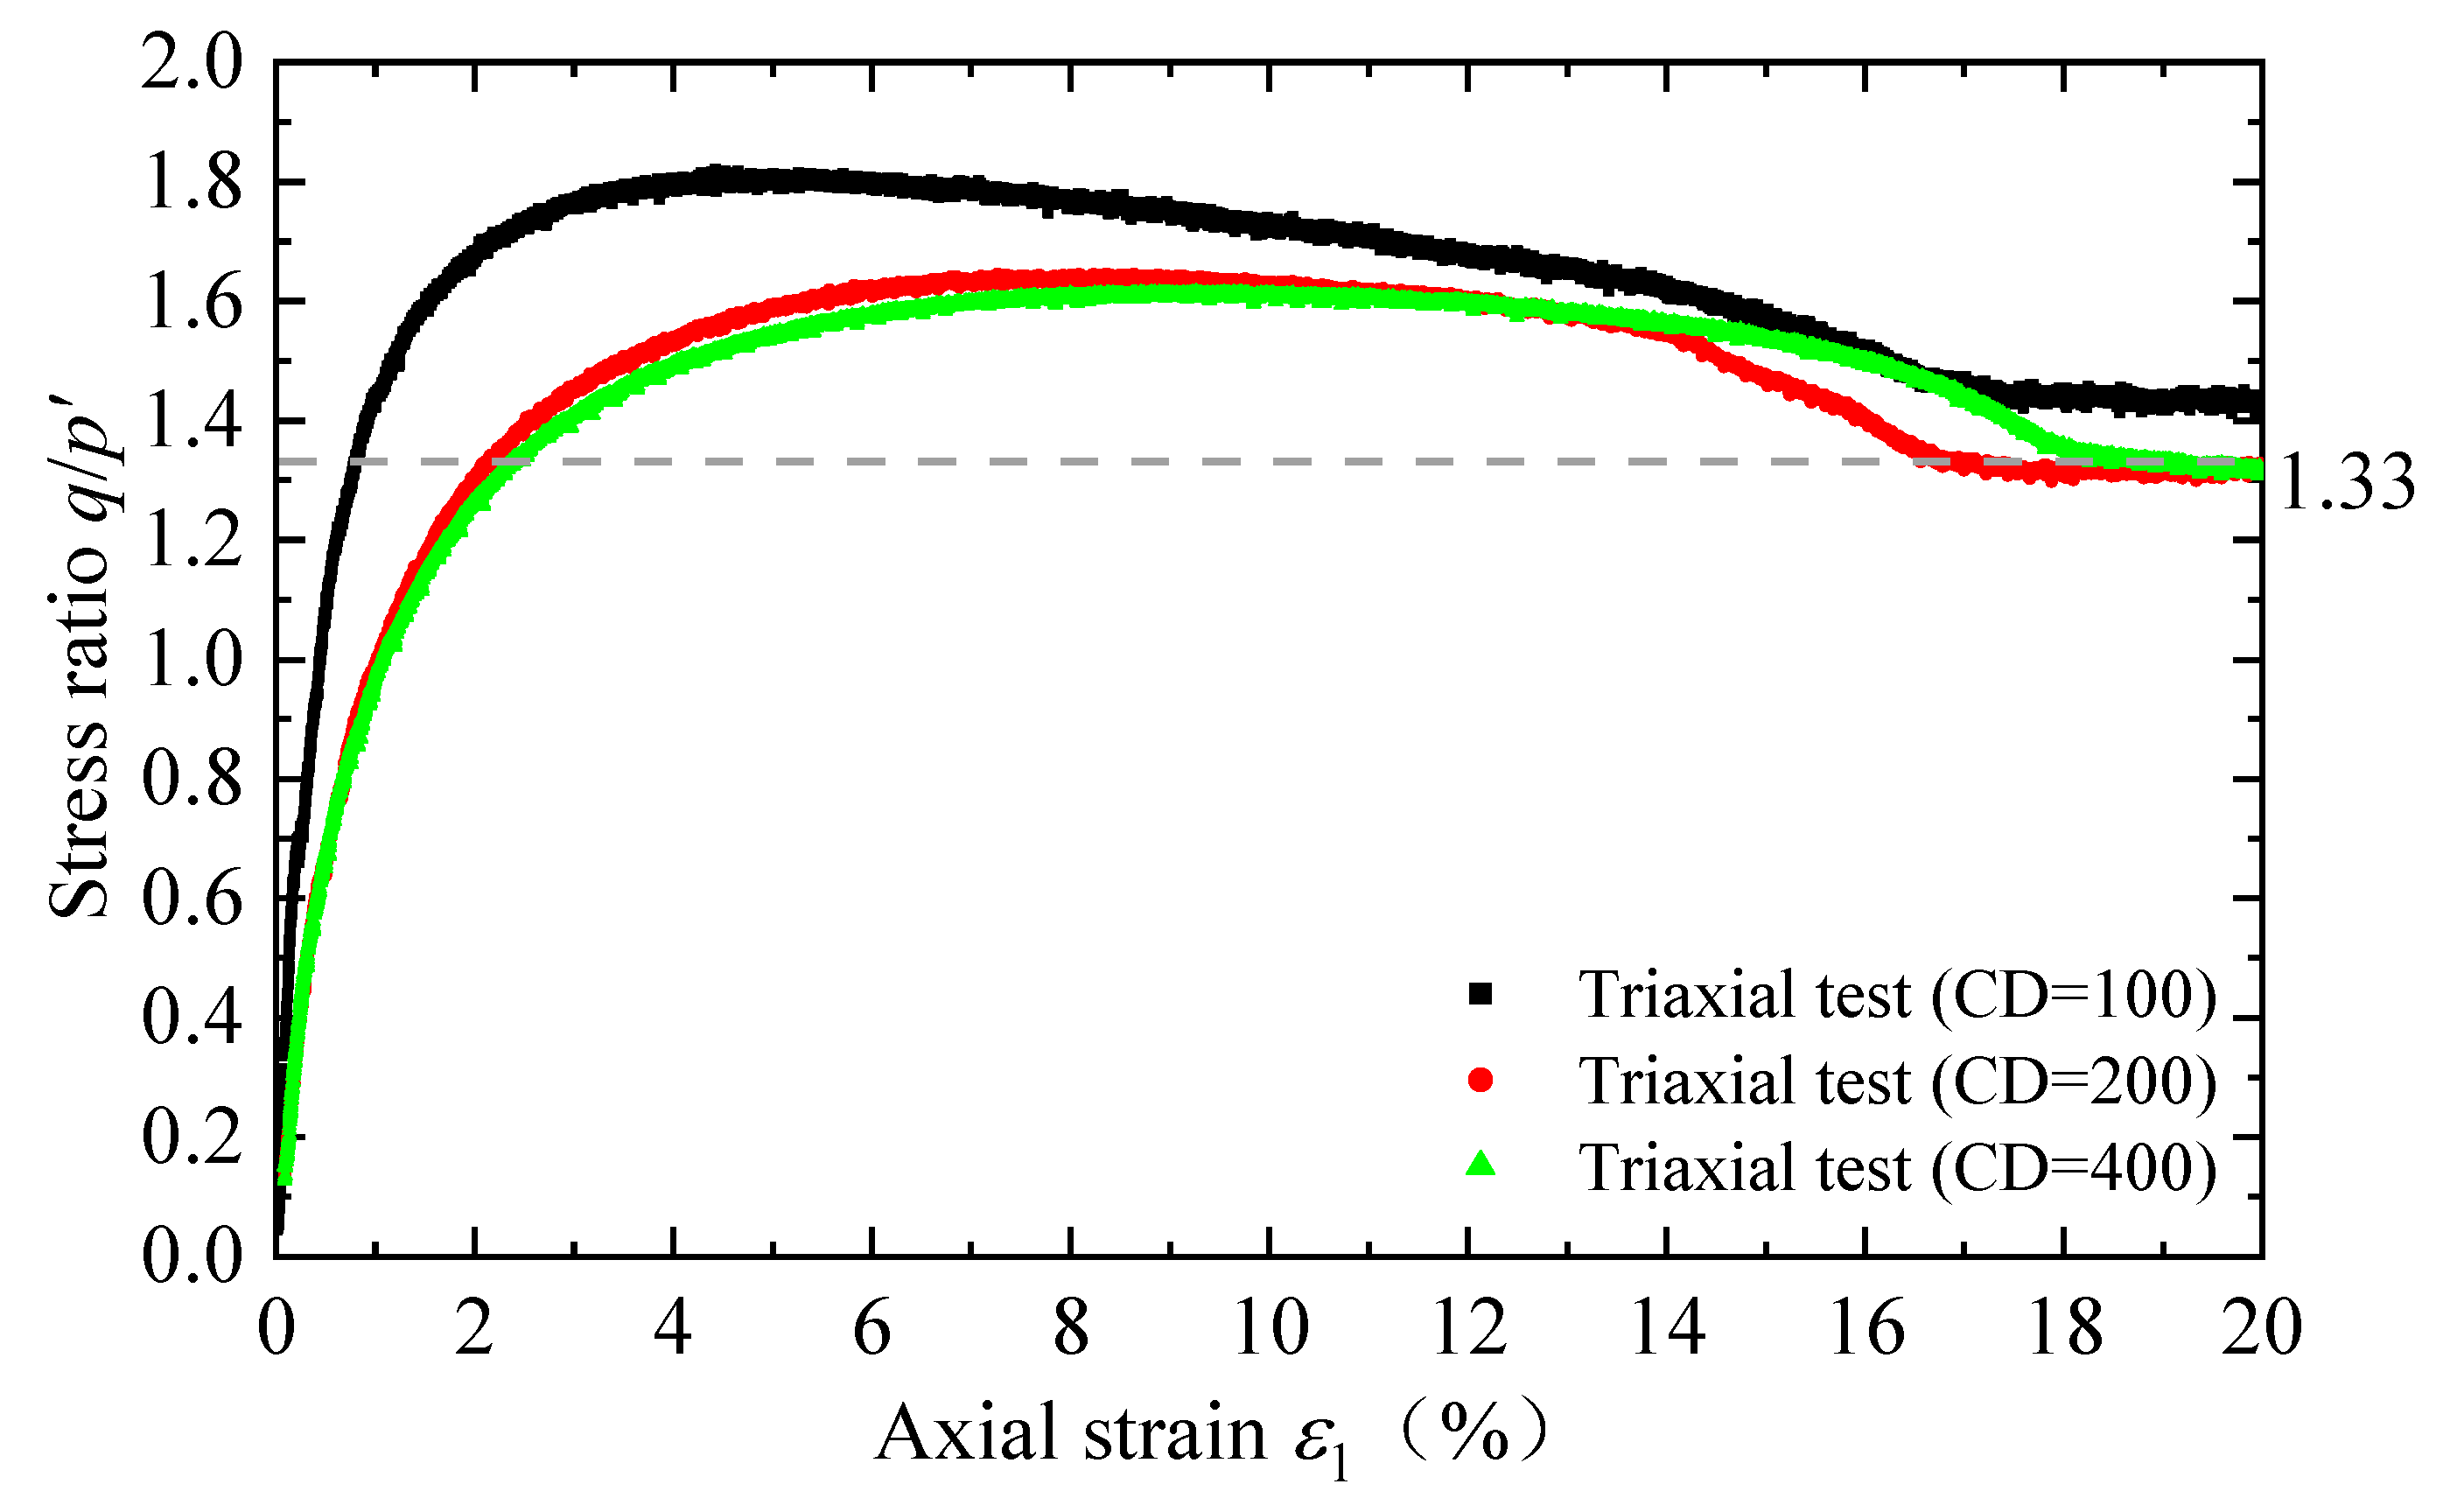
To determine the critical state stress ratio
Mc, triaxial consolidation drain tests were conducted under different confining pressures and the results are presented in
Figure 3. It can be seen from the figure that when the soil reaches the critical state, its stress ratios are 1.39, 1.32, and 1.30 for confining pressures of 100, 200, and 400 kPa, respectively. The average value, i.e., 1.33, is adopted for the parameter
Mc in the numerical analyses.
As shown in Equation (5), the critical state line of soil in the
e-
p’ plane is determined by the parameters
e0,
λ,
c, and
ξ.
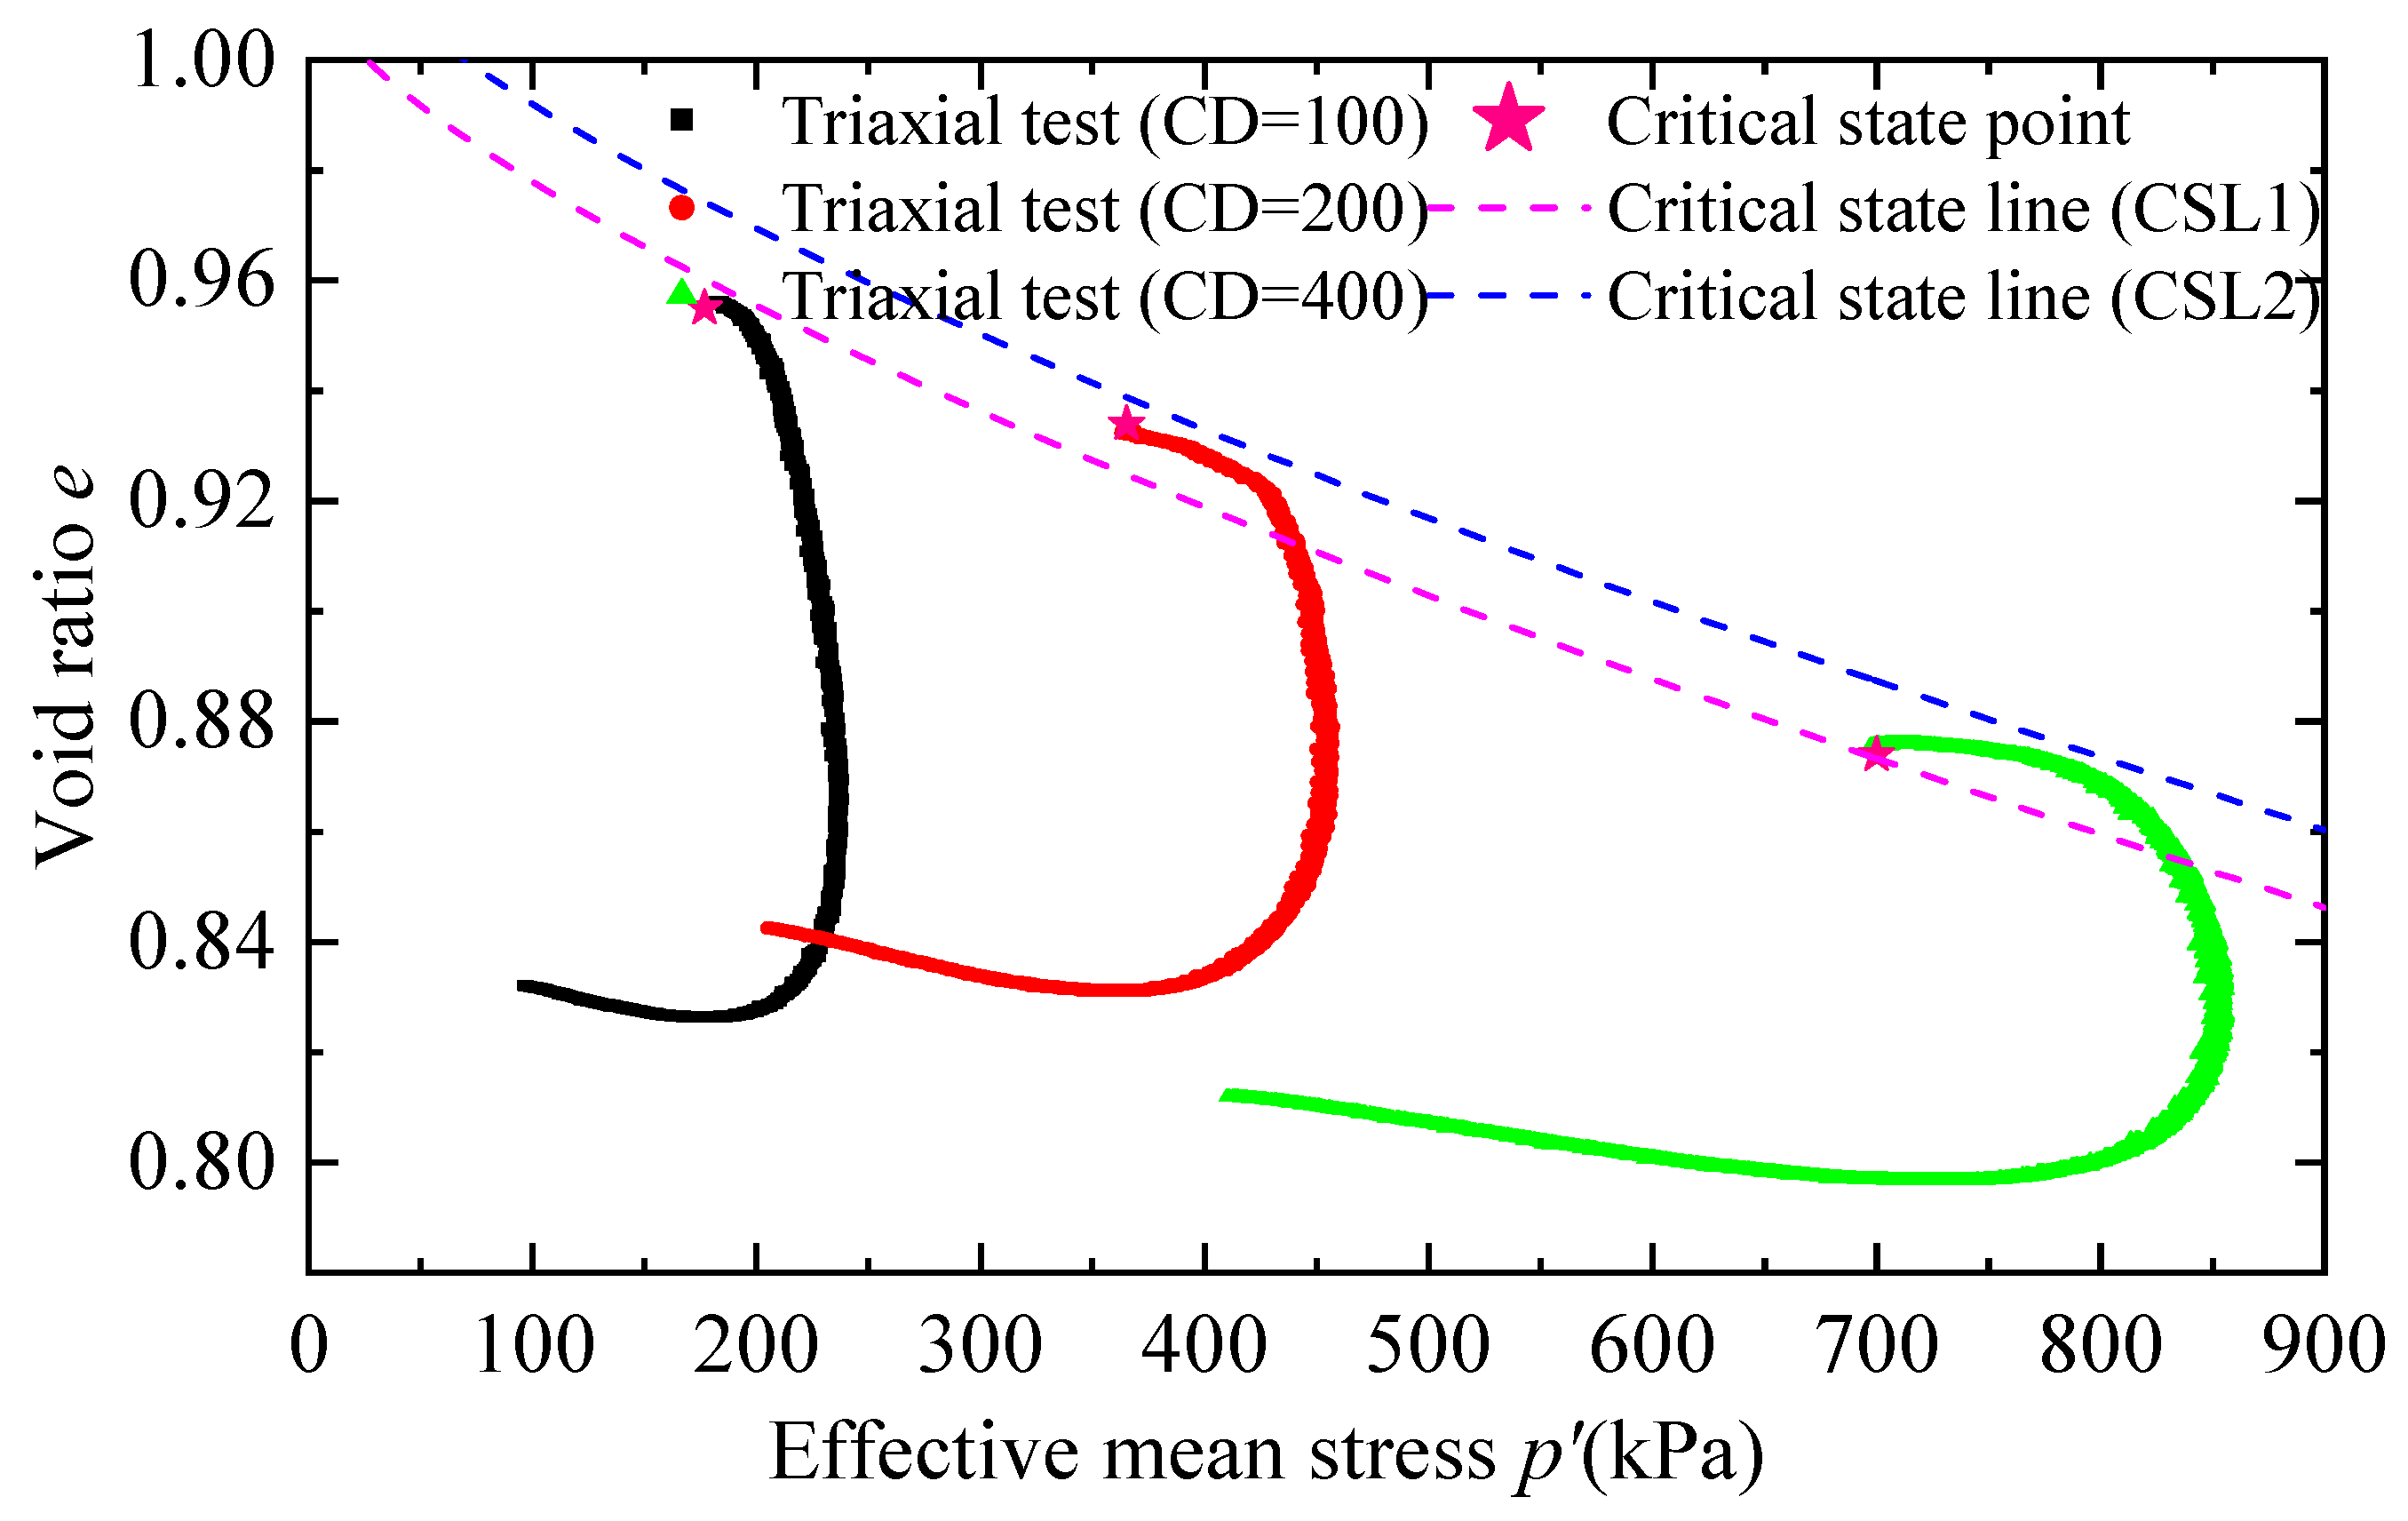
According to Dafalias and Manzari [
19] and, Taiebat and Dafalias [
20], it can be assumed that
ξ = 0.7. Then, based on the relationship between the void ratio and the effective stress when the soil reaches the critical state during the triaxial tests, the critical state line CSL1 can be determined, as shown in
Figure 4. The calibrated values are
e0 = 1.014 and
λc = 0.036.
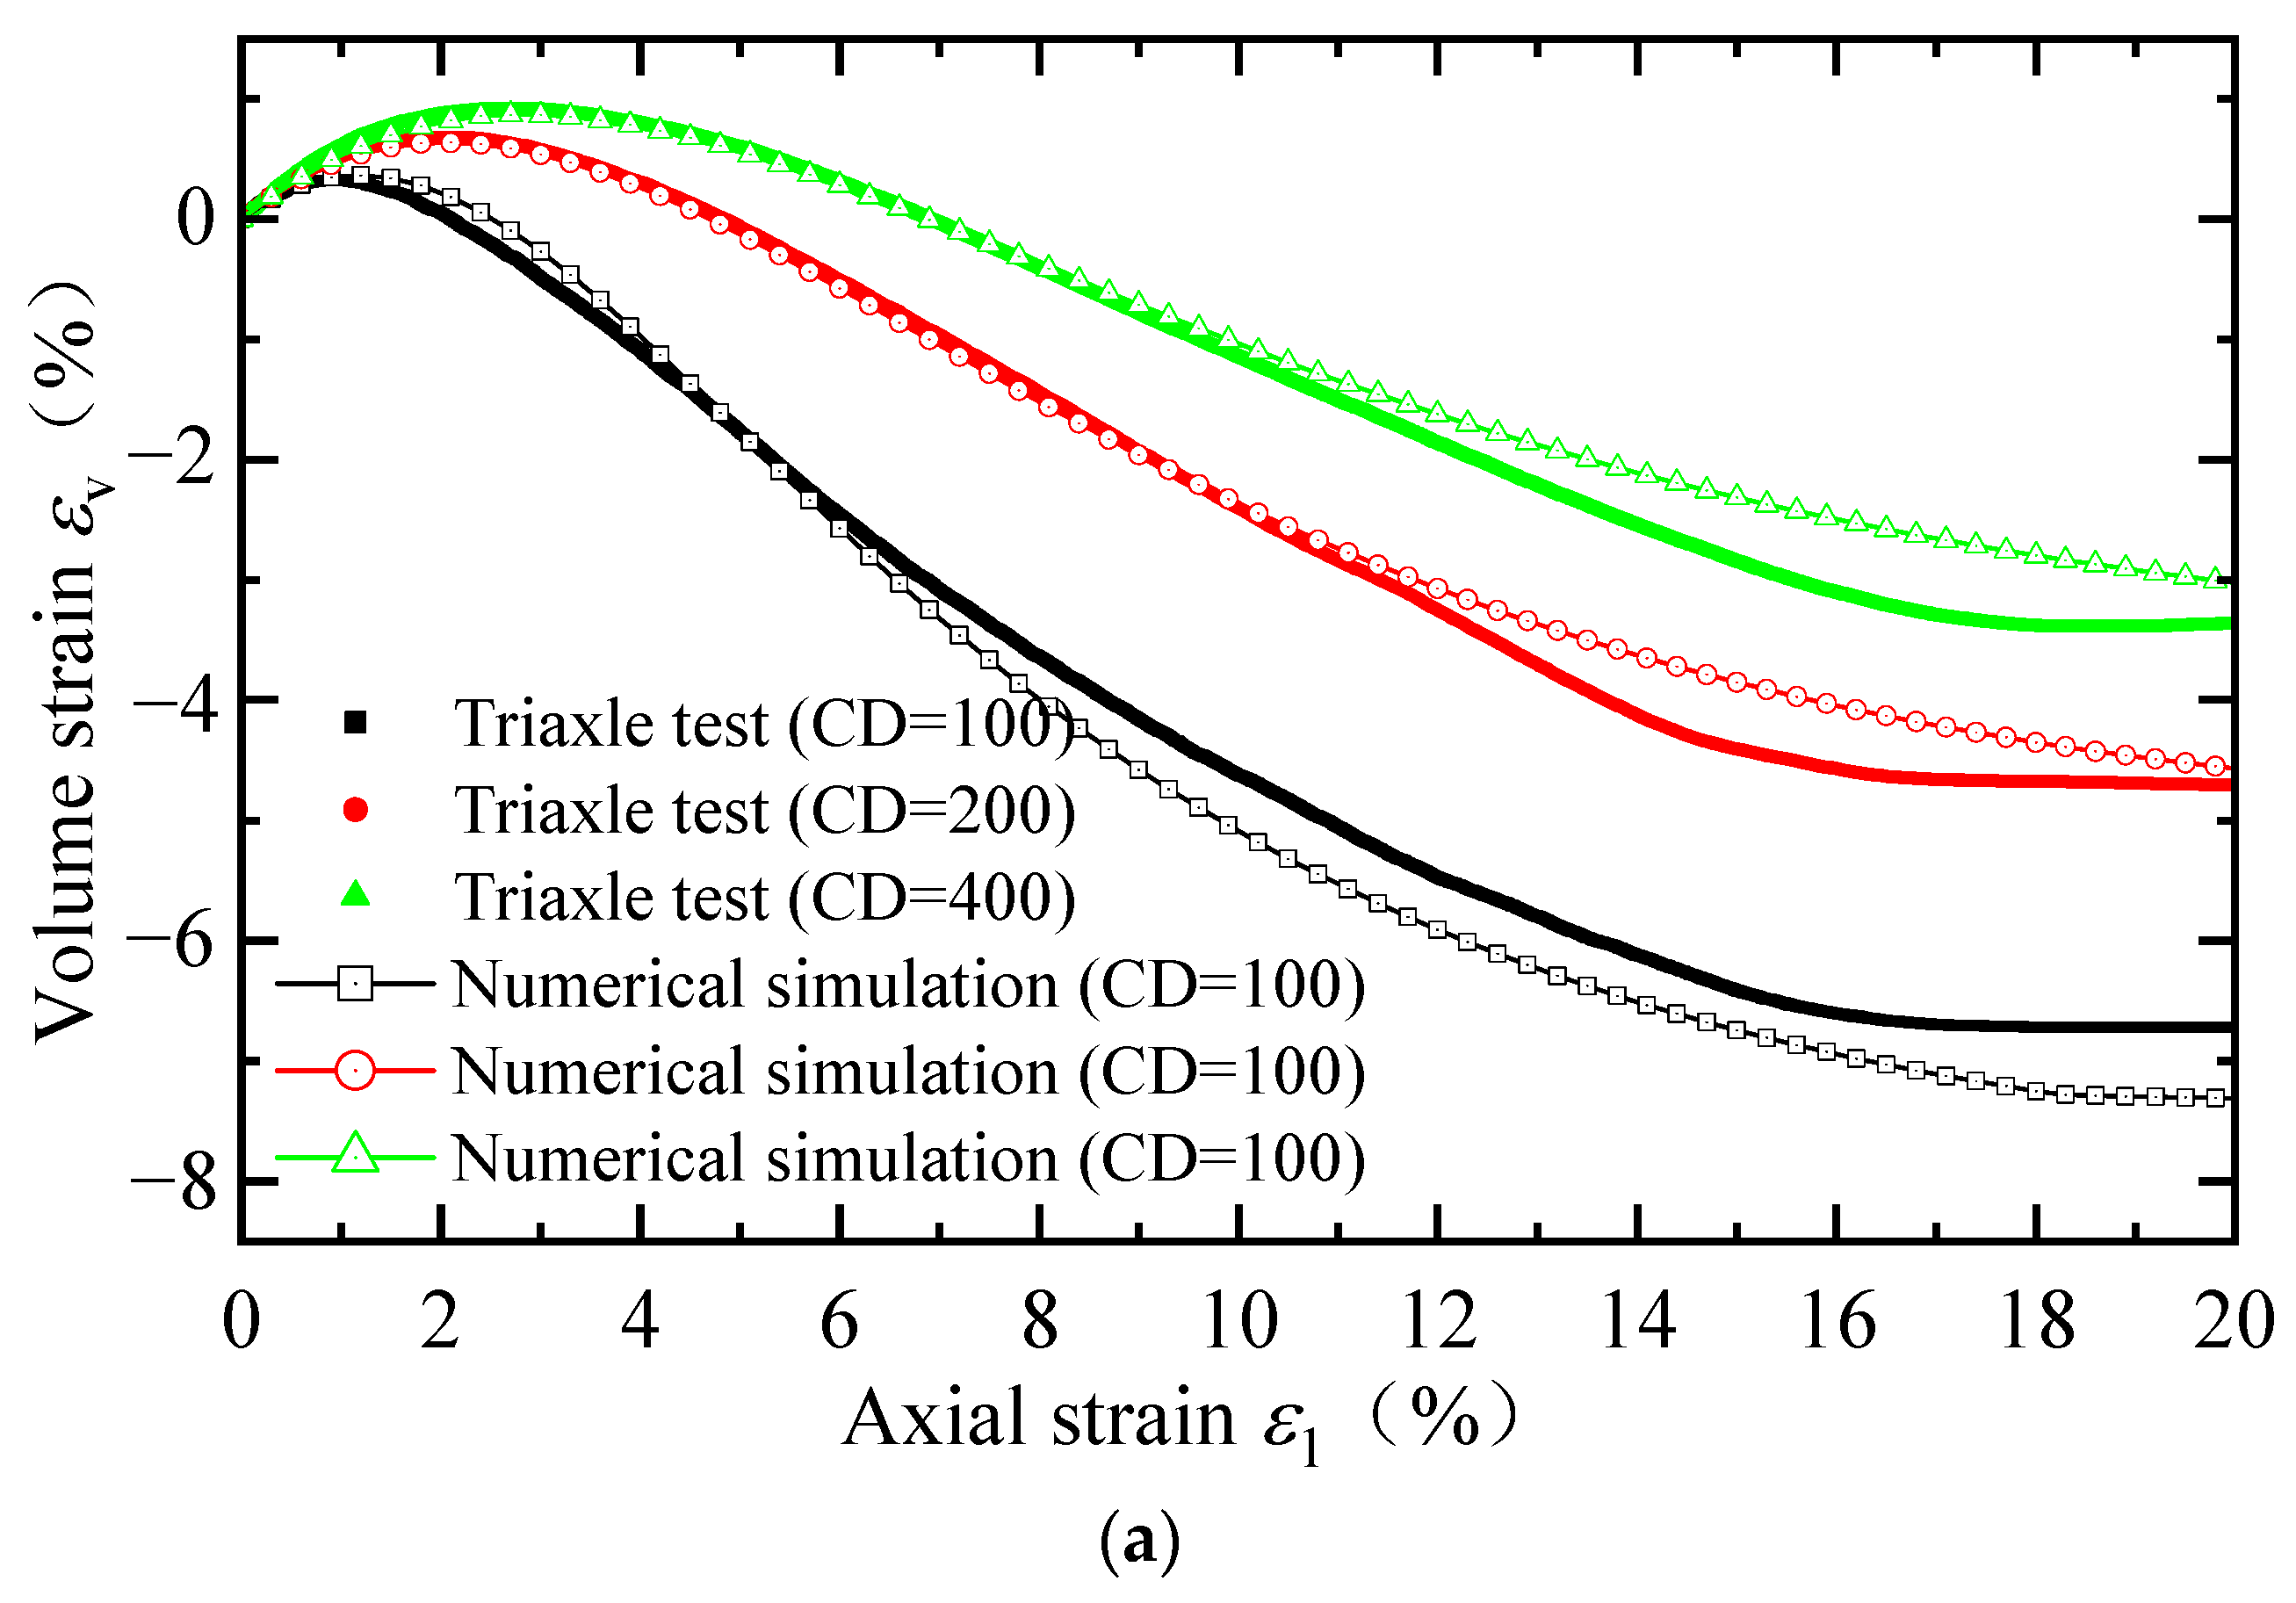
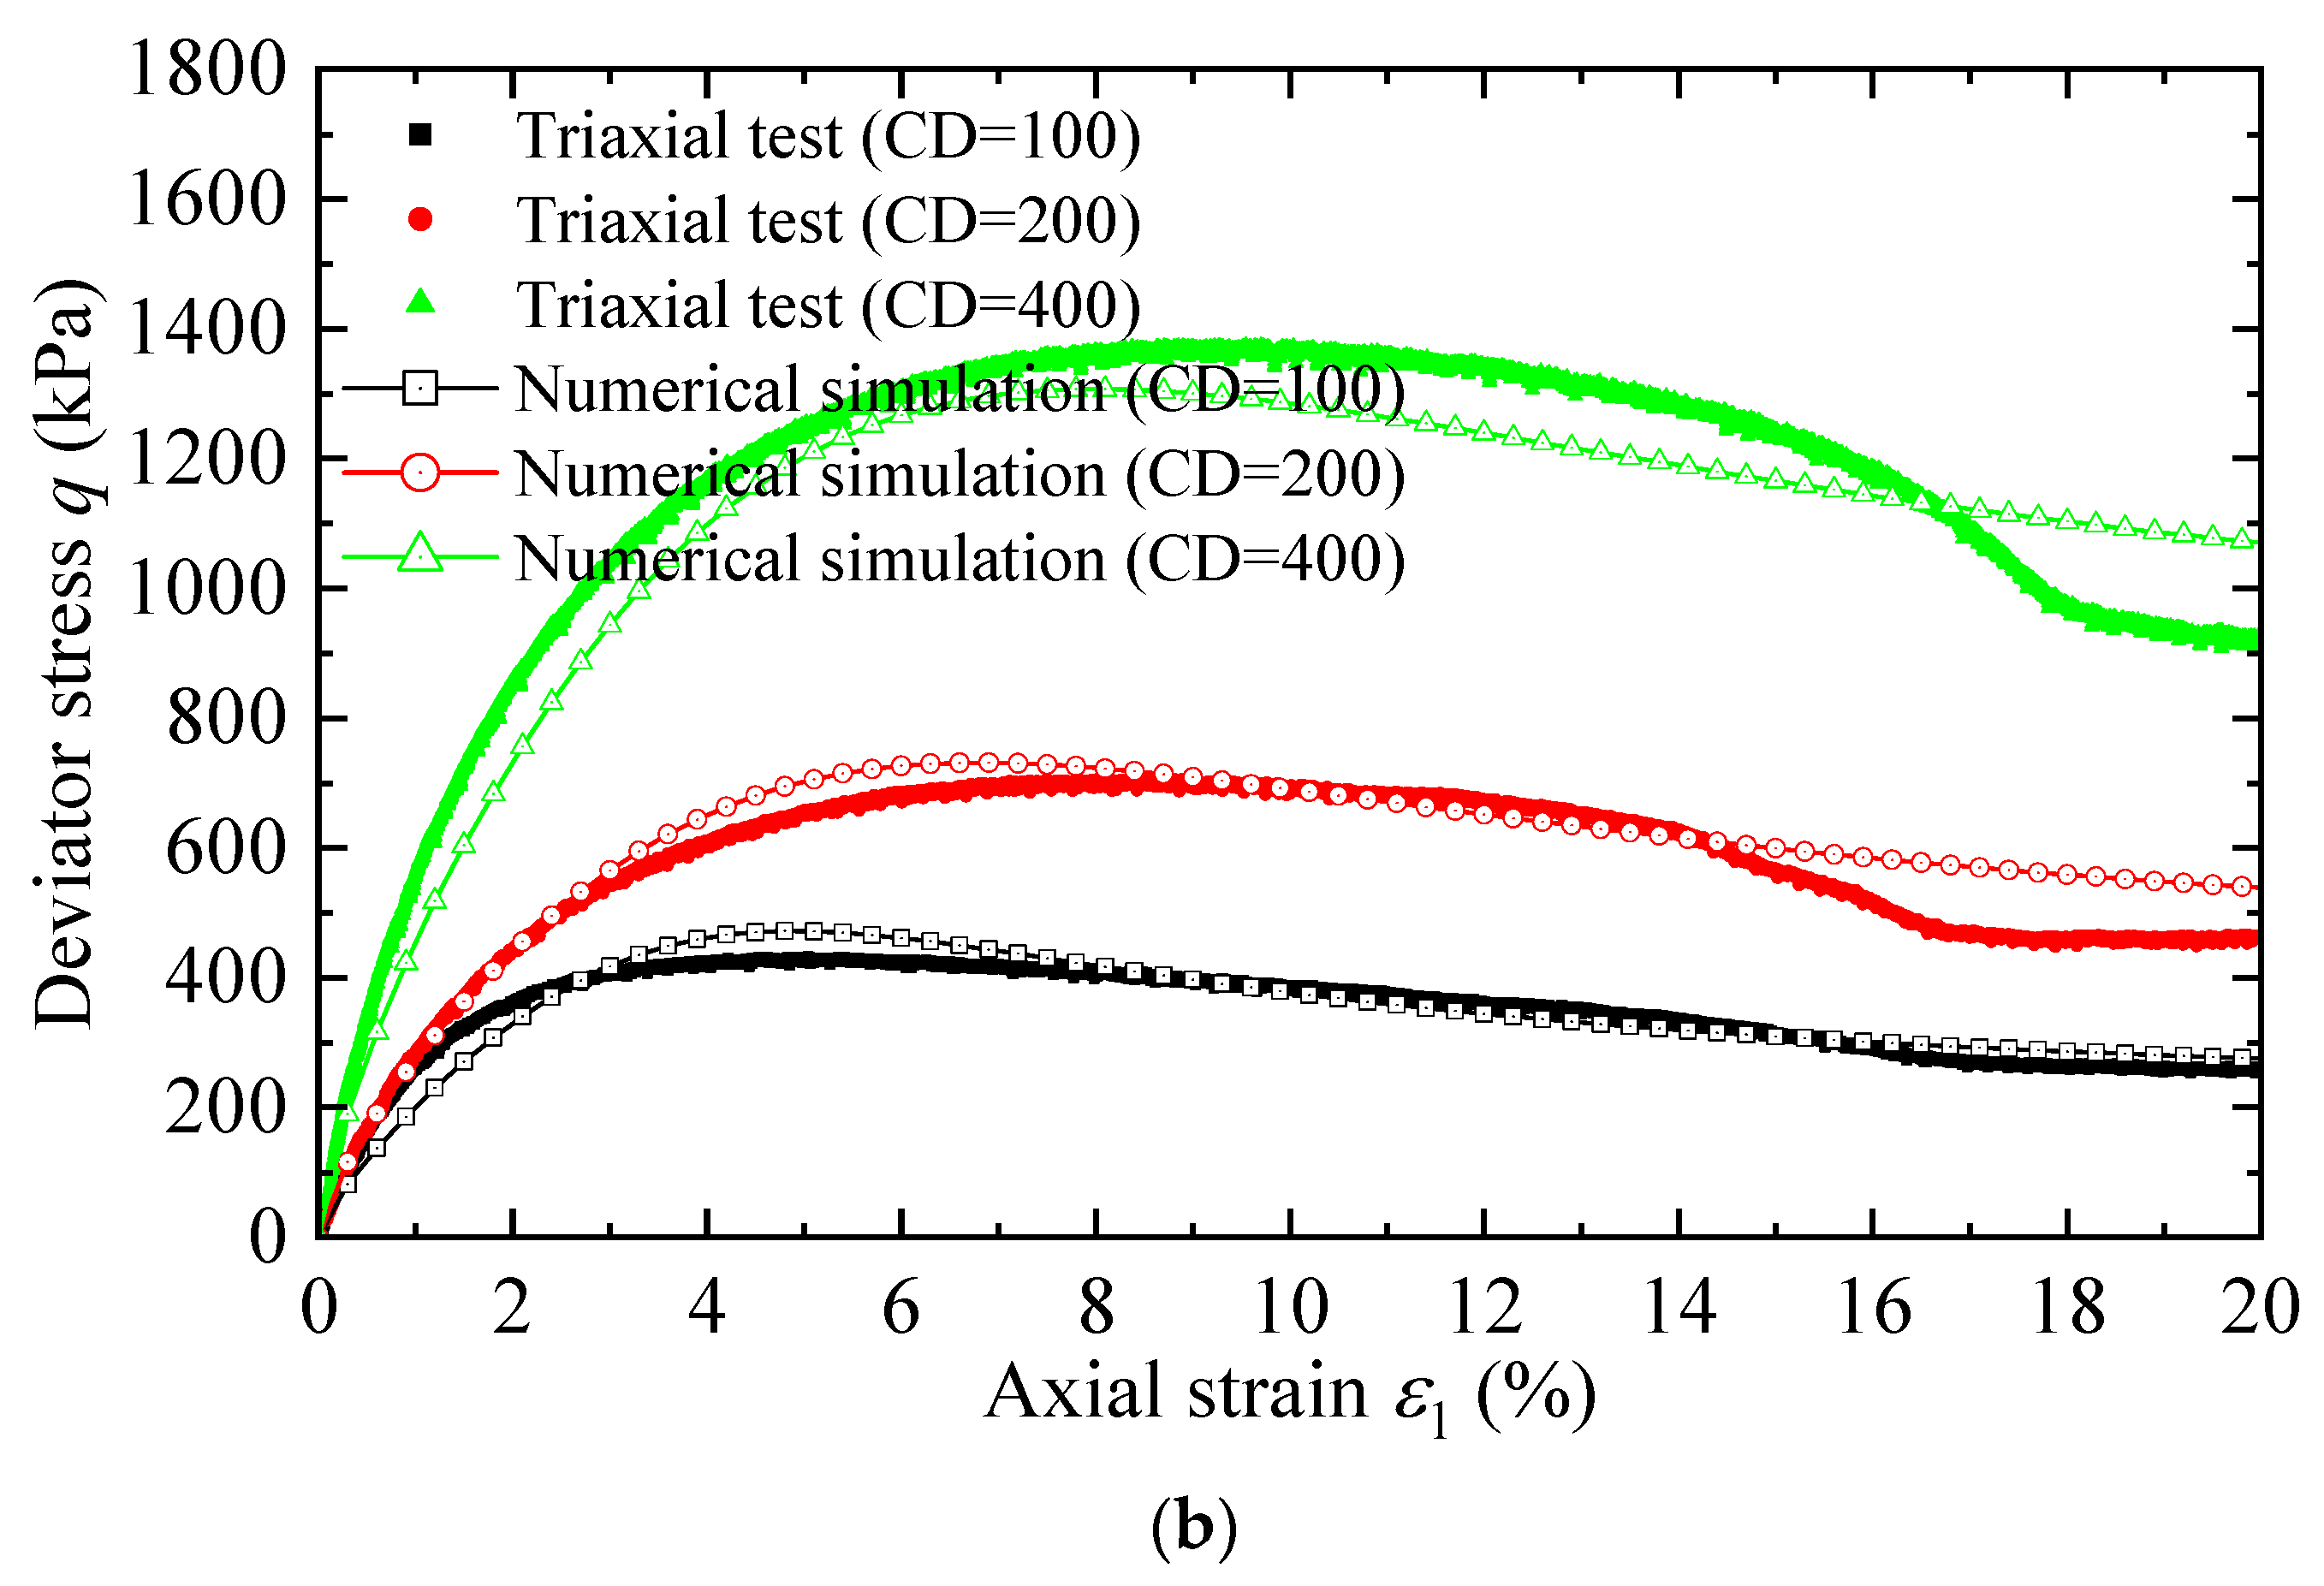
However, a shear band was formed in the specimen during some tests, which led to a certain error in the measured void ratio in the critical state. For this reason, the parameter
e0 was slightly adjusted until the overall responses of sand during the triaxial tests were successfully reproduced. It was found that the calculated and measured results match well when
e0 = 1.024, as shown in
Figure 5; therefore, the adopted critical state parameters are
ξ= 0.7,
e0 = 1.024, and
λc = 0.036.
It should be noted that, following Lashkari [
21], other parameters for the model were also determined by matching the numerical simulation to the test results. All the calibrated parameters are summarized in
Table 2.
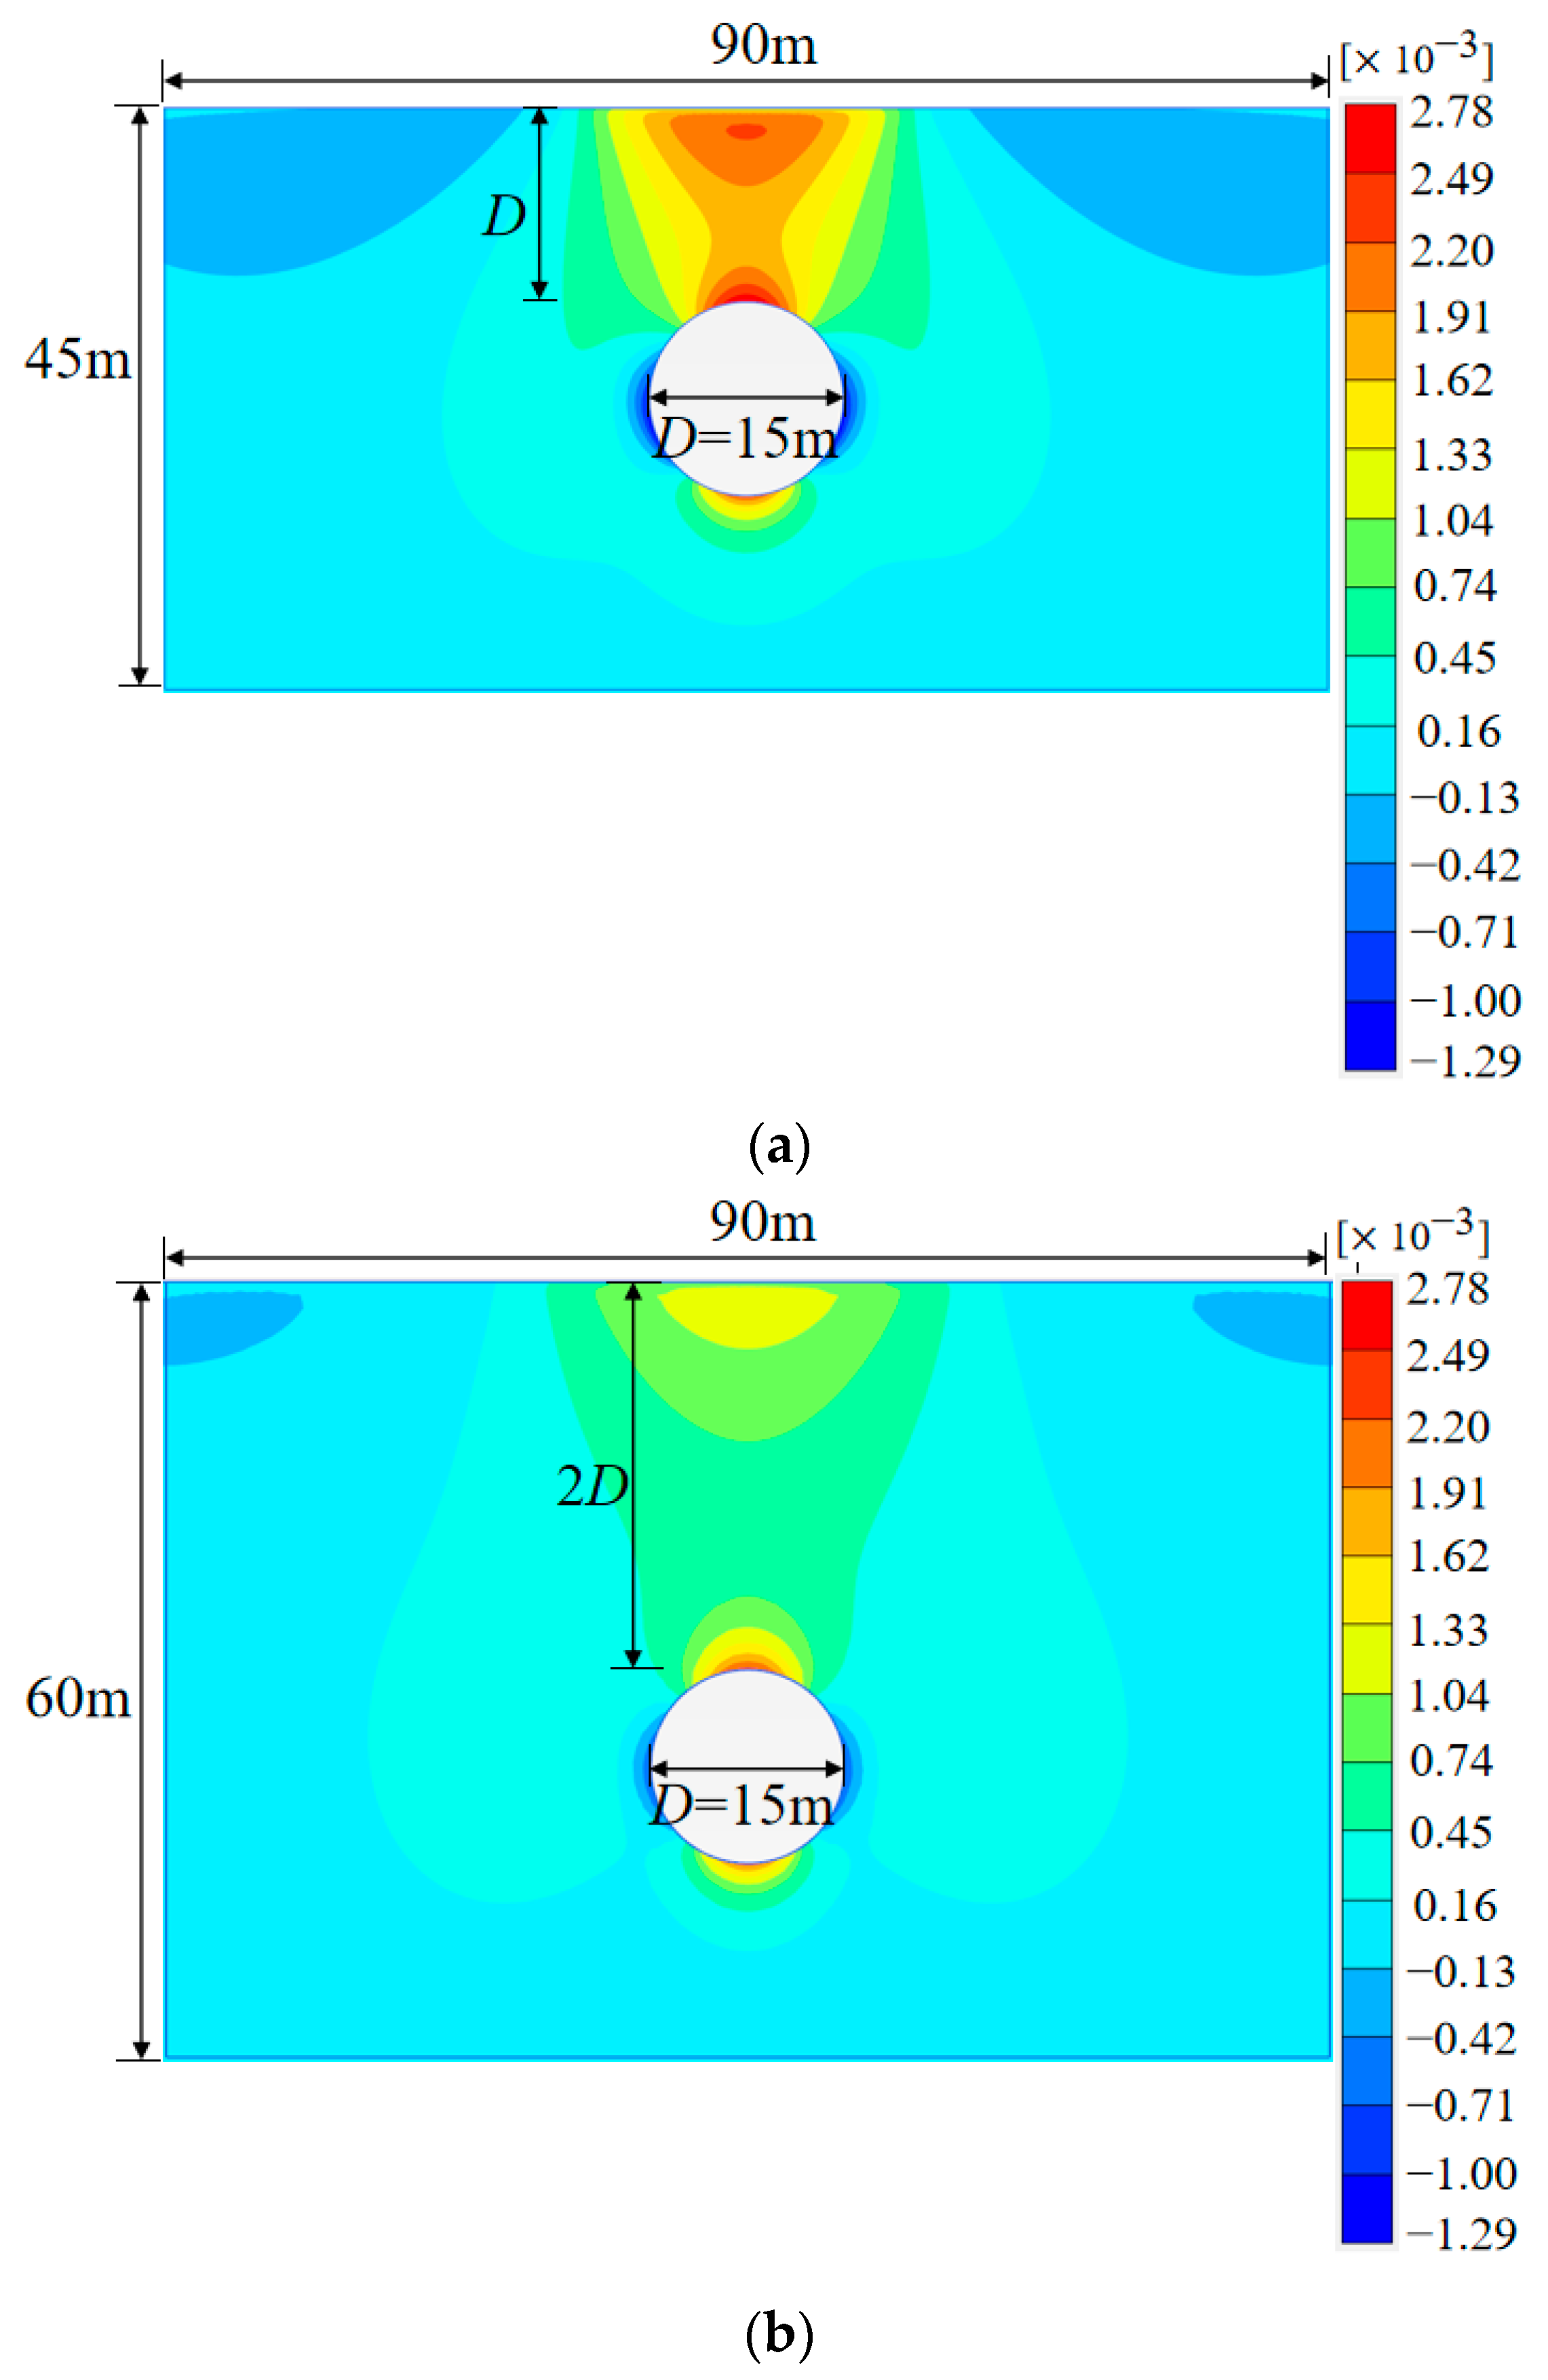
3. Establishment of Numerical Models
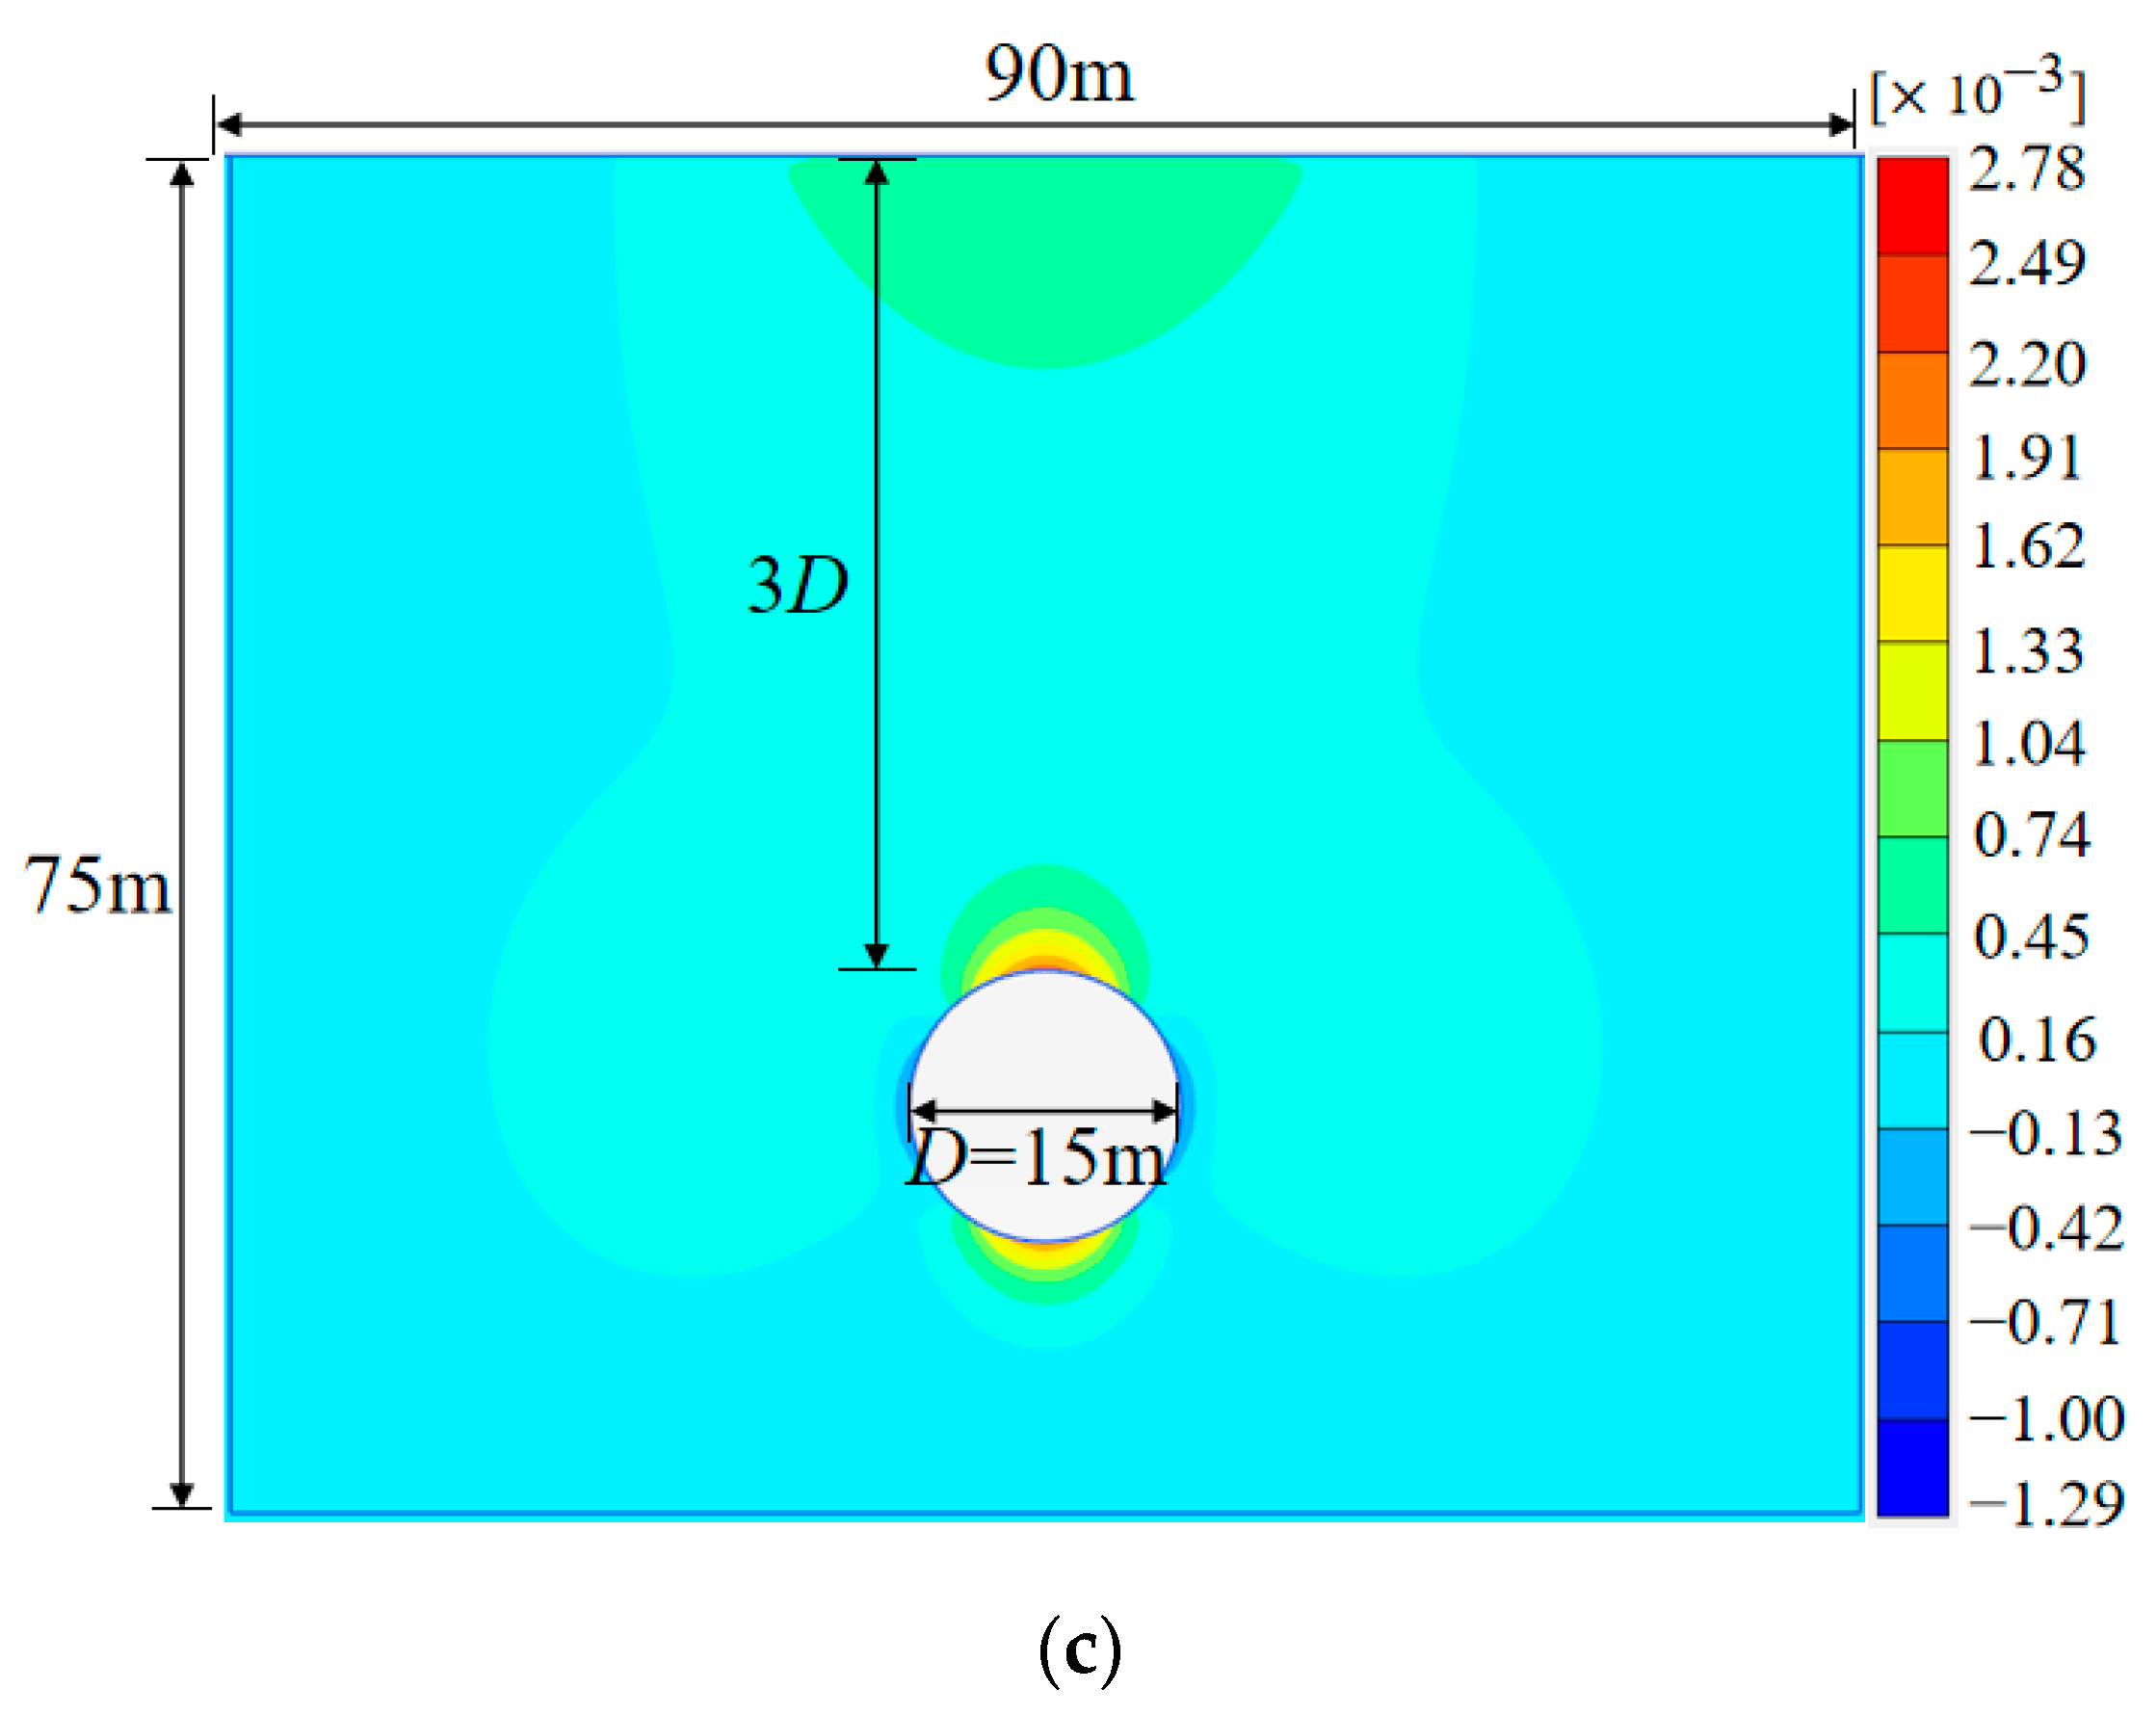
In this study, the ground deformation induced by the construction of super-large shield tunnels with a diameter (
D) of 15 m is mainly studied. As the buried depth of most tunnels is within 50 m, three different ratios of the buried depth to the diameter (
H/
D), i.e., 1, 2, and 3, are investigated. However, to reveal the impact of soil compactness, seven types of sandy ground with different relative densities are considered. Therefore, 13 numerical cases are considered in total, as shown in
Table 3.
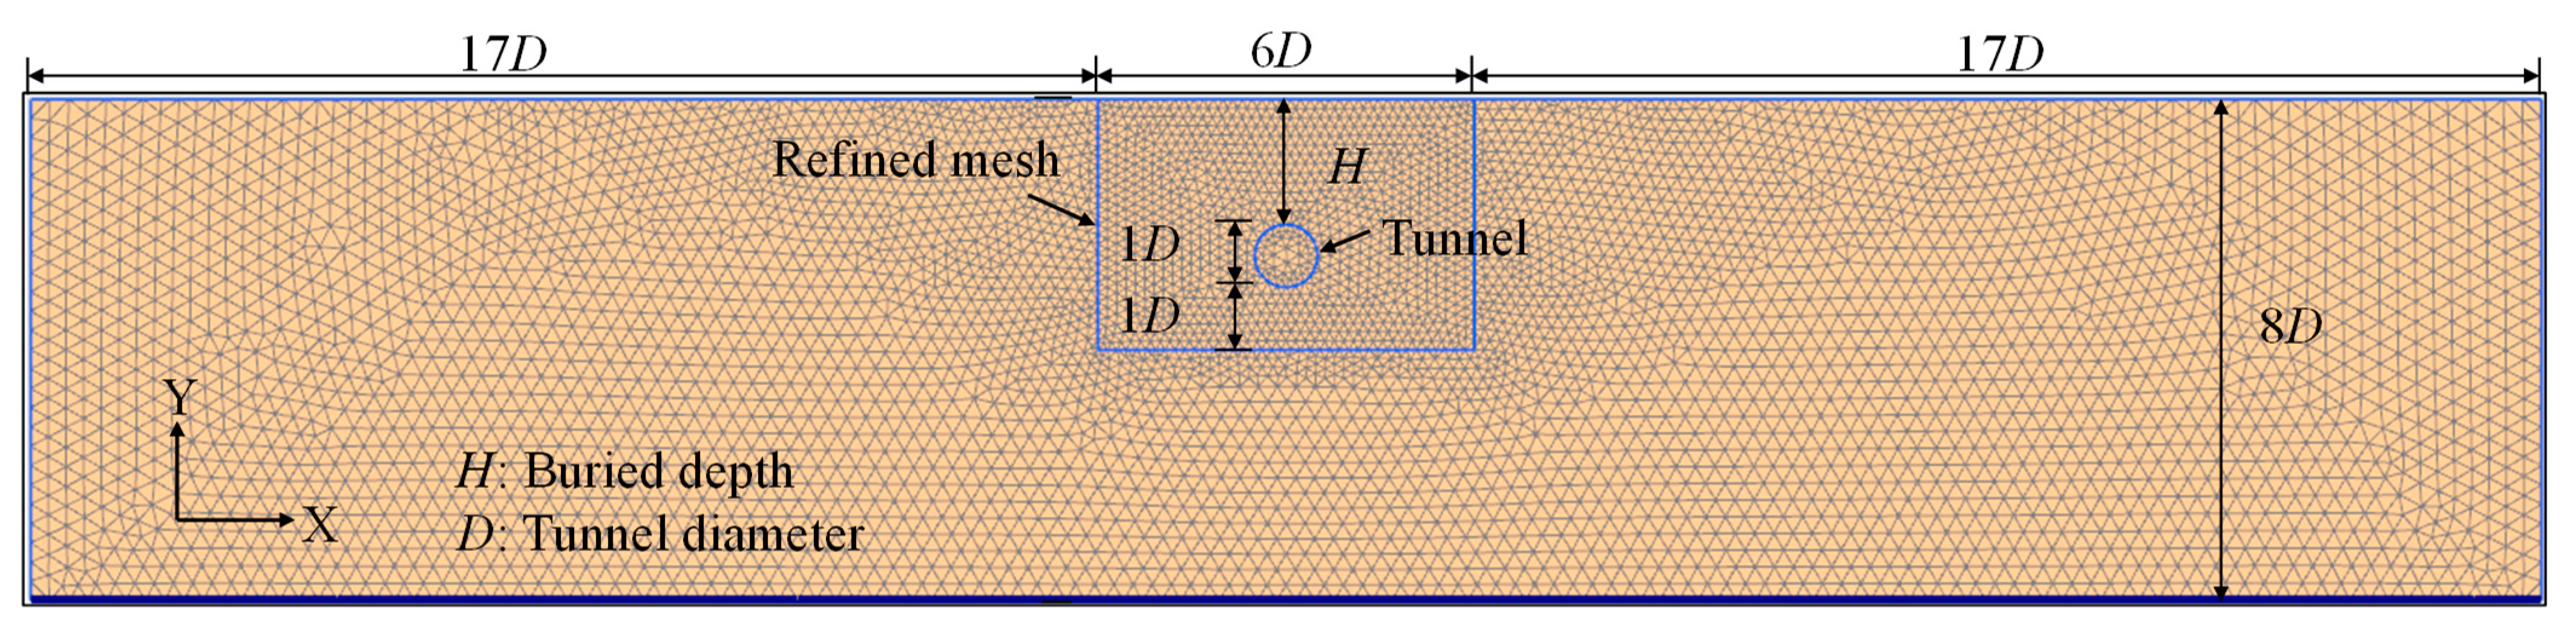
The software PLAXIS was utilized for numerical modeling. The size of the numerical model was set as
Xmax = 20
D,
Xmin = −20
D,
Ymax = 0,
Ymin = −8
D. The left and right boundaries of the model were fixed horizontally, the bottom was completely fixed, and the top boundary was free. The model is presented in
Figure 6, in which fine meshes are used for soils adjacent to the tunnel. The SANISAND model with the parameters presented in
Table 2 is used to describe the soil behavior. As the basic physical parameters of sand with different relative densities are different, the values of the void ratio and unit weight shown in
Table 4 are specified for different cases. The tunnel shrinkage rate of 1.0% was used in simulations for all cases to reflect the overall soil loss due to excavation.


