Article

Combining Two Exponentiated Families to Generate a New Family of Distributions

Statistics Department, Faculty of Science, King Abdulaziz University, Jeddah 21589, Saudi Arabia
*
Author to whom correspondence should be addressed.
Symmetry 2022, 14(8), 1739; https://doi.org/10.3390/sym14081739
Submission received: 29 June 2022 / Revised: 7 August 2022 / Accepted: 15 August 2022 / Published: 20 August 2022
(This article belongs to the Section Mathematics)

Abstract

:
This article presents a new technique to generate distributions that have the ability to fit any complex data called the exponentiated exponentiated Weibull-X (EEW-X) family, and the exponentiated exponentiated Weibull exponential (EEWE) distribution is presented as a member of this family. The new distribution’s unknown parameters were calculated by applying the maximum likelihood method. Some statistical properties, such as quantile, Rényi entropy, order statistics, and median are obtained for the proposed distribution. A simulation study was performed for different cases to investigate the estimation method’s performance. Three real datasets have been applied in which the new distribution has shown more flexibility compared to some other distributions.

1. Introduction

Statistical distributions are of great importance in analyzing and modeling data in many real applications. That is, in many experiments, the probability distributions are required to fit the data and study some of its characteristics, such as hazard rate and survival. However, statistical distributions may not be able to deal with all types of data. That is, in many real applications, the data show complex behavior, in which using the traditional distributions for analyzing these data leads to misleading results. Therefore, developing and modifying new flexible distributions are highly vital.
Recently, researchers have generated new statistical distributions by different methods, such as adding a number of parameters to the existing distributions and combining two or more distributions to generate more flexible ones that can fit the data accurately.
By adding a shape parameter to a baseline distribution function, ref. [1] proposed a method to generate new distributions called the exponentiated-G distribution. For any random variable X with probability density function (PDF), g(x), and cumulative distribution function (CDF), G(x), the PDF and CDF of the exponentiated family are respectively given by
g ( x ) = β [ F ( x ) ] β 1 f ( x ) ,
G ( x ) = [ F ( x ) ] β .   x R ,   β > 0 ,
where F ( x ) and f ( x ) are, respectively, the CDF and the PDF for any baseline distribution function and β is the shape parameter. This method has been applied by many authors. For example, ref. [2] studied some exponentiated distributions including the exponentiated inverse Weibull, the exponentiated logistic, the exponentiated Pareto, and the exponentiated generalized uniform distributions. Ref. [3] proposed the exponentiated gamma distribution, ref. [4] introduced the exponentiated Pareto distribution, ref. [5] considered the exponentiated Gompertz distribution, ref. [6] provided the exponentiated Lomax distribution, and ref. [7] proposed the exponentiated Mukherjee–Islam distribution.
The transformed-transformer (T-X) family is a technique introduced in [8] to generate families of continuous distributions. This general method can be obtained by using any continuous random variable as a generator. To illustrate, let X and T be two random variables, where X is the transformer and T is the transformed. The idea for this method is to use X to transform T using a weighted function W of the CDF of X.
That is, the T-X family can be defined as follows.
Let r ( t ) be the PDF of a random variable T [ z 1 , z 2 ] , for z 1 < z 2 . Assume W ( F ( x ) ) is a function of the CDF F ( x ) for any random variable X, where the function W ( F ( x ) ) should satisfy the subsequent constraints:
(1)
W ( F ( x ) ) [ z 1 , z 2 ]
(2)
W ( F ( x ) ) z 1 as x and W ( F ( x ) ) z 2 as x
(3)
W ( F ( x ) ) is differentiable and monotonically non-decreasing.
The CDF and the PDF of the T-X family can be respectively defined as
G ( x ) = z 1 W ( F ( x ) ) r ( t ) d t ,
g ( x ) = { d d x W ( F ( x ) ) } r ( W ( F ( x ) ) ) .
The family of T-X distributions can be introduced by using various forms of W ( F ( x ) ) , in which the definition of W ( F ( x ) ) based on the subsidizing of the random variable T, for more details see [8].
Ref. [8] discussed some families such as, gamma-X and Weibull-X by choosing the upper limit for generating the T-X distribution W ( F ( x ) ) = log ( 1 F ( x ) ) . Subsequently, many members of these families have been proposed such as the Weibull–Pareto distribution in [9] and the Weibull-gamma distribution in [10]. Ref. [11] introduced a new family of distributions called exponentiated T-X that based on the T-X transformation by defining a different upper limit W ( F ( x ) ) = log ( 1 F α ( x ) ) . Thus, the CDF and the PDF of the exponentiated T-X family can be respectively given by
G ( x ) = z 1 A r ( t ) d t = R ( A ) ,
g ( x ) = α f ( x ) ( F ( x ) ) α 1 1 ( F ( x ) ) α r ( A ) , α > 0
where A = log ( 1 ( F ( x ) ) α ) , R ( A ) is the CDF of T and α is the shape parameter. Many families of distributions can be generated using this technique, for example, ref. [11] proposed the exponentiated Weibull-X and the exponentiated gamma-X families. Then, the exponentiated Weibull-exponential distribution was developed as a member of the exponentiated Weibull-X family where X follows the standard exponential distribution with a scale parameter equal to one. Additionally, the exponentiated gamma exponential distribution introduced in [12] is a member of the exponentiated gamma-X family.
In this paper, the basic aim of the study is to submit a new method that generates a new distribution with more flexibility to fit different behavior of data.

2. Exponentaited Exponentiated T-X Family

In this section, we combine the exponentiated family of distributions and the exponentiated T-X family of distributions by replacing the CDF in Equation (2) with Equation (5). The new technique for generating families of distributions is called the exponentiated exponentiated T-X (EET-X) family and affords vast flexibility in modeling different real data in practice, hence the CDF and PDF of the new family are defined respectively as
G ( x ) = [ z 1 A r ( t ) d t ] β = [ R ( A ) ] β ,
g ( x ) = β α f ( x ) ( F ( x ) ) α 1 1 ( F ( x ) ) α r ( A ) β 1 , α > 0 ,
where β and α are shape parameters. Furthermore, the survival function and the hazard function for the EET-X family can be introduced respectively as
S ( x ) = 1 [ R ( A ) ] β ,
h ( x ) = β α f ( x ) ( F ( x ) ) α 1 [ 1 ( F ( x ) ) α ] [ 1 [ R ( A ) ] β ] .
In Section 3, we will introduce a new distribution called the exponentiated exponentiated Weibull exponential distribution as a member of the EET-X family.

3. Exponentiated Exponentiated Weibull Exponential Distribution

In this section, a new distribution that is considered a member of an EEW-X family will be proposed and studied. First, we will display a new family called the exponentiated exponentiated Weibull-X (EEW-X) family. Moreover, a new distribution called the exponentiated exponentiated Weibull exponential (EEWE) will be studied.

3.1. Exponentiated Exponentiated Weibull-X Family

Let r ( t ) in Equation (7) be the PDF of a non-negative random variable T which follows the Weibull distribution. Then, the CDF and the PDF of the EEW-X family can be respectively defined as
G ( x ; κ , β , α , λ ) = { 1 e [ A λ ] κ } β ,
g ( x ; κ , β , α , λ ) = κ β α f ( x ) ( F ( x ) ) α 1 λ κ ( 1 ( F ( x ) ) α ) e [ A λ ] κ A κ 1 { 1 e [ A λ ] κ } β 1 ,
where κ , β , α > 0 are the shape parameters and λ > 0 is the scale parameter of the EEW-X family.The survival function and the hazard function for the EEW-X family can be given as
S ( x ; κ , β , α , λ ) = 1 { 1 e [ A λ ] κ } β ,
h ( x ; κ , β , α , λ ) = κ β α f ( x ) ( F ( x ) ) α 1 A κ 1 λ κ ( 1 ( F ( x ) ) α ) [ 1 [ 1 e [ A λ ] κ ] β ] [ 1 e [ A λ ] κ ] β 1 .
Using the EEW-X family we will generalize the exponentiated exponentiated Weibull exponential distribution with a scale parameter equal to one that was presented in [11].

3.2. CDF and PDF of EEWE Distribution

Let X follow the exponential distribution with shape parameter θ , then the CDF of the EEWE distribution can be defined as
G ( x ; κ , β , α , θ , λ ) = { 1 e [ B λ ] κ } β ,
and the corresponding PDF of the EEWE distribution can be defined as
g ( x ; κ , β , α , θ , λ ) = κ β α θ e θ x C α 1 λ κ ( 1 C α ) e [ B λ ] κ B κ 1 { 1 e [ B λ ] κ } β 1 ,
where B = log ( 1 ( 1 e θ x ) α ) , C = 1 e θ x , also, κ , β , α > 0 are the shape parameters and θ , λ > 0 are scale parameters of the EEWE distribution. The survival function of the EEWE distribution can be provided, according to
S ( x ; κ , β , α , θ , λ ) = 1 { 1 e [ B λ ] κ } β .
The hazard function can be presented as
h ( x ; κ , β , α , θ , λ ) = g ( x ; κ , β , α , θ , λ ) 1 G ( x ; κ , β , α , θ , λ ) ,
where g(x) and G(x) are introduced before in Equations (15) and (16), respectively,
h ( x ; κ , β , α , θ , λ ) = κ β α θ e θ x C α 1 e [ B λ ] κ B κ 1 [ 1 e [ B λ ] κ ] β 1 λ κ ( 1 C α ) [ 1 [ 1 e [ B λ ] κ ] β ] .
Several shapes of the PDF and the hazard functions for the EEWE distribution are introduced in Figure 1 and Figure 2, respectively, for several various parameters values. The different shapes show that the density function for EEWE distribution can be (nearly) symmetric, monotonically decreasing, skewed, and unimodal, as well as, the hazard function plot shows several shapes, involving monotonically increasing, decreasing, skewed, and unimodal.

3.3. Some Special Cases of EEWE Distribution

  • When β = 1 , the EEWE distribution converts to the generalized Weibull exponential (GWE) distribution with parameters α , θ , λ , and κ .
  • When β , α = 1 , the EEWE distribution converts to the Weibull exponential (WE) distribution with parameters θ , λ , and κ .
  • When α = 1 , the EEWE distribution converts to the exponentiated Weibull exponential (EWE) distribution with parameters θ , κ , λ , and β .
  • When α , β , κ , λ = 1 , the EEWE distribution converts to the exponential (E) with one parameter θ .
  • When θ , β = 1 , the EEWE distribution converts to the exponentiated Weibull exponential (EWE) distribution with parameters κ , α , and λ , as presented in [11].

3.4. Some of EEWE Distribution Properties

In this section, we will study the statistical properties of EEWE distribution, such as the moments, the quantile function, and order statistics.

3.4.1. The Quantile Function and the Median

The quantile function for EEWE distribution can be obtained by:
G ( x ) = { 1 e [ B λ ] κ } β = u ,
x = 1 θ log 1 1 e λ [ log ( 1 u β 1 ) ] κ 1 α 1 .
The median (MD) for the EEWE distribution can be given by substituting the value of u = 0.5 in, Equation (19), then the median of the EEWE distribution is shown as:
M D = 1 θ log 1 1 e λ [ log ( 1 0 . 5 β 1 ) ] κ 1 α 1 .
Solving the PDF given in Equation (16) by using integrals might be difficult, complex, and not accurate. Therefore, deriving the statistical properties can be done after applying some mathematical expansions for representing the PDF.

Useful Expansions

This section presents some expansions applied to simplify the PDF of EEWE distribution. After that, several statistical properties are studied using these mathematical expansions for which any mathematical program can be used to solve expansions analytically. Using binomial expansion equation
( 1 x ) s 1 = d = 0 ( 1 ) d s 1 d x d ,
where | x | < 1 and s is a positive real non-integer. The PDF of the EEWE distribution presented in Equation (16) can be rewritten as
g ( x ; κ , β , α , θ , λ ) = κ β α θ e θ x C α 1 λ κ ( 1 C α ) B κ 1 s 1 = 0 ( 1 ) s 1 β 1 s 1 e [ B λ ] κ ( s 1 + 1 ) .
Using the expansion equation
e x = b = 0 ( 1 ) b b ! x b , x > 0 ,
we have
g ( x ; κ , β , α , θ , λ ) = κ β α θ e θ x C α 1 1 C α s 1 , s 2 = 0 ( 1 ) s 1 + s 2 s 2 ! ( s 1 + 1 ) s 2 λ κ ( s 2 + 1 ) β 1 s 1 B κ ( s 2 + 1 ) 1 .
The generalized binomial theorem was applied by [13,14] to show that
( log ( 1 x ) ) b = b d = 0 m = 0 d ( 1 ) m + d d b d d m P m , d ( b m ) x b + d ,
where b > 0 is any real value and | x | < 1 . The constants P m , d can be solved by using
P m , d = d 1 i = 1 d ( d i ( m + 1 ) ) c i P m , d i ,
for d = 1 , 2 , , and P m , 0 = 1 , and c d = ( 1 ) d + 1 ( d + 1 ) 1 , then, the PDF formula will be,
g ( x ; κ , β , α , θ , λ ) = κ β α θ e θ x ( 1 C α ) s 1 , s 2 , s 3 = 0 s 4 = 0 s 3 ( 1 ) s 1 + s 2 + s 3 + s 4 ( s 1 + 1 ) s 2 [ κ ( s 2 + 1 ) 1 ] s 2 ! λ κ ( s 2 + 1 ) [ κ ( s 2 + 1 ) s 4 1 ] β 1 s 1 s 3 κ ( s 2 + 1 ) + 1 s 3 s 3 s 4 P s 4 , s 3 C α [ κ ( s 2 + 1 ) + s 3 ] 1 .
The binomial expansion equation
( 1 x ) 1 = h = 0 x h
was used, then, the PDF formula can be given as
g ( x ; κ , β , α , θ , λ ) = κ β α θ e θ x s 1 , s 2 , s 3 , s 5 = 0 s 4 = 0 s 3 ( 1 ) s 1 + s 2 + s 3 + s 4 ( s 1 + 1 ) s 2 s 2 ! λ κ ( s 2 + 1 ) [ κ ( s 2 + 1 ) s 4 1 ] β 1 s 1 s 3 κ ( s 2 + 1 ) + 1 s 3 s 3 s 4 P s 4 , s 3 [ κ ( s 2 + 1 ) 1 ] C α [ κ ( s 2 + 1 ) + s 3 + s 5 ] 1 .
Recall the binomial expansion Equation (21), finally, the PDF formula of EEWE distribution can be given as
g ( x ) = κ α β θ s 1 , s 2 , s 3 , s 5 , s 6 = 0 s 4 = 0 s 3 ( 1 ) s 1 + s 2 + s 3 + s 4 + s 6 ( s 1 + 1 ) s 2 [ k ( s 2 + 1 ) 1 ] s 2 ! λ κ ( s 2 + 1 ) [ k ( s 2 + 1 ) s 4 1 ] P s 4 , s 3 β 1 s 1 s 3 k ( s 2 + 1 ) + 1 s 3 s 3 s 4 α [ k ( s 2 + 1 ) + s 3 + s 5 ] 1 s 6 e θ x ( s 6 + 1 ) .
Then, various mathematical properties of the EEWE distribution can easily be studied in terms of the expansion in Equation (25).

3.4.2. Moments

From Equation (25), the r th moment of a random variable X, which follow the EEWE distribution can be given as:
μ r = 0 x r g ( x ) d x ,
where g ( x ) is the PDF of the EEWE distribution which simplified in Equation (25), then, integrating the PDF to obtain the r th moment can be calculated as, let u = ( s 6 + 1 ) θ x , then x = u θ ( s 6 + 1 ) and d x = d u θ ( s 6 + 1 ) , then, we substitute the previous formulas in the integration to have
μ r = κ α β s 1 , s 2 , s 3 , s 5 , s 6 , r = 0 s 4 = 0 s 3 ( 1 ) s 1 + s 2 + s 3 + s 4 + s 6 ( s 1 + 1 ) s 2 [ k ( s 2 + 1 ) 1 ] s 2 ! λ κ ( s 2 + 1 ) [ k ( s 2 + 1 ) s 4 1 ] P s 4 , s 3 β 1 s 1 s 3 k ( s 2 + 1 ) + 1 s 3 s 3 s 4 α [ k ( s 2 + 1 ) + s 3 + s 5 ] 1 s 6 Γ ( r + 1 ) θ r ( s 6 + 1 ) r + 1 ,
where Γ denotes the gamma function and for every r the r th moment exists.

3.4.3. Moment Generating Function and Characteristic Function

The moment generating function of EEWE distribution can be given by using the following formula:
M x ( t ) = E ( e t x ) = 0 e t x g ( x ) d x .
Using the expansion Equation (22), the moment generating function can be obtained as:
M x ( t ) = r = 0 t r r ! 0 x r g ( x ) d x ,
where t R . By substituting the value of g(x) which given in Equation (25), we get the moment generating function of EEWE distribution
M x ( t ) = κ α β s 1 , s 2 , s 3 , s 5 , s 6 , r = 0 s 4 = 0 s 3 ( 1 ) s 1 + s 2 + s 3 + s 4 + s 6 ( s 1 + 1 ) s 2 [ k ( s 2 + 1 ) 1 ] s 2 ! λ κ ( s 2 + 1 ) [ k ( s 2 + 1 ) s 4 1 ] P s 4 , s 3 β 1 s 1 s 3 k ( s 2 + 1 ) + 1 s 3 s 3 s 4 α [ k ( s 2 + 1 ) + s 3 + s 5 ] 1 s 6 t r Γ ( r + 1 ) r ! θ r ( s 6 + 1 ) r + 1 .
The characteristic function of a distribution can be obtained as
ϕ x ( t ) = E ( e i t x ) = 0 e i t x g ( x ) d x ,
which can be rewritten using the expansion Equation (22), as
ϕ x ( t ) = r = 0 ( i t ) r r ! 0 x r g ( x ) d x .
The value of g(x) which given in Equation (25) was substituted and the characteristic function given as
ϕ x ( t ) = κ α β s 1 , s 2 , s 3 , s 5 , s 6 , r = 0 s 4 = 0 s 3 ( 1 ) s 1 + s 2 + s 3 + s 4 + s 6 ( s 1 + 1 ) s 2 [ k ( s 2 + 1 ) 1 ] s 2 ! λ κ ( s 2 + 1 ) [ k ( s 2 + 1 ) s 4 1 ] P s 4 , s 3 β 1 s 1 s 3 k ( s 2 + 1 ) + 1 s 3 s 3 s 4 α [ k ( s 2 + 1 ) + s 3 + s 5 ] 1 s 6 ( i t ) r Γ ( r + 1 ) r ! θ r ( s 6 + 1 ) r + 1 .

3.4.4. Rényi Entropy

The uncertainty of a random variable X can be measured by using the entropy. The data have more uncertainty if the value of the entropy is large. From [15], the entropy is obtained by
γ R ( ρ ) = 1 1 ρ log 0 g ρ ( x ) d x ,
where ρ > 0 and ρ 0 .
By substituting the PDF in Equation (16) into the Rényi entropy equation, we get
g ( x ) ρ = κ β α θ λ κ ρ e θ x ρ C ρ ( α 1 ) ( 1 C α ) ρ e ρ [ B λ ] κ B ρ ( κ 1 ) { 1 e [ B λ ] κ } ρ ( β 1 ) .
Using the binomial expansion Equations (21) and (22), we have
g ( x ) ρ = κ β α θ ρ e θ x ρ C ρ ( α 1 ) ( 1 C α ) ρ s 1 , s 2 = 0 ( 1 ) s 1 + s 2 ( ρ + s 1 ) s 2 s 2 ! λ κ ( s 2 + ρ ) ρ ( β 1 ) s 1 B κ ( s 2 + ρ ) ρ .
The expansion Equation (23) will be applied, then, the g ( x ) ρ can be written as
g ( x ) ρ = κ β α θ ρ e θ x ρ ( 1 C α ) ρ s 1 , s 2 , s 3 = 0 s 4 = 0 s 3 ( 1 ) s 1 + s 2 + s 3 + s 4 ( ρ + s 1 ) s 2 s 2 ! λ κ ( s 2 + ρ ) κ ( s 2 + ρ ) ρ κ ( s 2 + ρ ) ρ s 4 ρ ( β 1 ) s 1 s 3 κ ( s 2 + ρ ) + ρ s 3 s 3 s 4 P s 4 , s 3 C α [ κ ( s 2 + ρ ) + s 3 ] ρ .
By using the binomial expansions Equation (21) and the following expansion
( 1 x ) j = y = 0 j + y 1 y x y ,
we get
g ( x ) ρ = κ β α θ ρ s 1 , s 2 , s 3 , s 5 , s 6 = 0 s 4 = 0 s 3 ( 1 ) s 1 + s 2 + s 3 + s 4 + s 6 ( ρ + s 1 ) s 2 s 2 ! λ κ ( s 2 + ρ ) κ ( s 2 + ρ ) ρ κ ( s 2 + ρ ) ρ s 4 ρ ( β 1 ) s 1 s 3 κ ( s 2 + ρ ) + ρ s 3 s 3 s 4 ρ + s 5 1 s 5 α [ κ ( s 2 + ρ ) + s 3 + s 5 ] ρ s 6 P s 4 , s 3 e ( ρ + s 6 ) θ x .
By substituting in Equation (28) and after solving the integration, the Rényi entropy can be found as follows
γ R ( ρ ) = 1 1 ρ log { κ β α ρ θ ρ 1 s 1 , s 2 , s 3 , s 5 , s 6 = 0 s 4 = 0 s 3 ( 1 ) s 1 + s 2 + s 3 + s 4 + s 6 ( ρ + s 1 ) s 2 s 2 ! λ κ ( s 2 + ρ ) κ ( s 2 + ρ ) ρ κ ( s 2 + ρ ) ρ s 4 ρ ( β 1 ) s 1 s 3 κ ( s 2 + ρ ) + ρ s 3 s 3 s 4 ρ + s 5 1 s 5 α [ κ ( s 2 + ρ ) + s 3 + s 5 ] ρ s 6 P s 4 , s 3 ( ρ + s 6 ) } .
The Rényi entropy for the EEWE distribution can be given by
γ R ( ρ ) = 1 1 ρ { ρ log ( κ β α ) + ( ρ 1 ) log θ + log [ s 1 , s 2 , s 3 , s 5 , s 6 = 0 s 4 = 0 s 3 ( 1 ) s 1 + s 2 + s 4 + s 3 + s 6 ( ρ + s 1 ) s 2 s 2 ! λ κ ( ρ + s 2 ) [ κ ( s 2 + ρ ) ρ s 4 ] [ κ ( s 2 + ρ ) ρ ] P s 4 , s 3 ( ρ + s 6 ) ρ ( β 1 ) s 1 s 3 κ ( s 2 + ρ ) + ρ s 3 s 3 s 4 ρ + s 5 1 s 5 α [ κ ( s 2 + ρ ) + s 3 + s 5 ] ρ s 6 ] } .

3.4.5. Order Statistics

Assume that X 1 , X 2 , , X n is a random sample of EEWE distribution and let X a : n denote the a th order statistic. The PDF of X a : n can be presented as
g a : n ( x ) = n ! ( a 1 ) ! ( n a ) ! c = 0 n a ( 1 ) c n a c f ( x ) F c + a 1 ( x ) .
Substituting the EEWE distribution’s PDF and CDF which shown in Equations (15) and (16) into g a : n ( x ) , we get
g a : n ( x ) = n ! κ α β ( a 1 ) ! ( n a ) ! c = 0 n a ( 1 ) c n a c { θ e θ x C α 1 λ κ ( 1 C α ) e [ B λ ] κ B κ 1 { 1 e [ B λ ] κ } β 1 } { 1 e [ B λ ] κ } β c + a 1
and hence,
g a : n ( x ) = n ! κ α β ( a 1 ) ! ( n a ) ! c = 0 n a ( 1 ) c n a c { θ e θ x C α 1 λ κ ( 1 C α ) e [ B λ ] κ B κ 1 1 e [ B λ ] κ β ( c + a ) 1 } .
Similar to the PDF expansions in Section 3.4.1 by applying expansion Equation (21) two times and expansions Equations (22)–(24) one time, the order statistics formula of the EEWE distribution is defined as
g a : n ( x ) = n ! κ α β θ ( a 1 ) ! ( n a ) ! s 1 , s 2 , s 3 , s 5 , s 6 = 0 s 4 = 0 s 3 c = 0 n a ( 1 ) s 1 + s 2 + s 3 + s 4 + s 6 + c ( s 1 + 1 ) s 2 s 2 ! λ κ ( s 2 + 1 ) κ ( s 2 + 1 ) 1 κ ( s 2 + 1 ) s 4 1 P s 4 , s 3 n a c β ( c + a ) 1 s 1 s 3 κ ( s 2 + 1 ) + 1 s 3
s 3 s 4 α [ κ ( s 2 + 1 ) + s 3 + s 5 ] 1 s 6 e θ x ( s 6 + 1 ) .

3.5. Parameter Estimation for EEWE Distribution

The parameters estimation for the EEWE distribution using maximum likelihood estimation (MLEs) of the vector of parameters ω = ( κ , β , α , θ , λ ) can be defined in three steps. First, define the log-likelihood function. Second, calculate the partial derivative with respect to every single parameter. Finally equate these derivatives to zero. The likelihood function L ( x ; κ , β , α , θ , λ ) for the EEWE distribution can be found as
L ( x ; κ , β , α , θ , λ ) = ( κ β α θ λ k ) n e θ i = 1 n x i i = 1 n C i α 1 i = 1 n [ 1 C i α ] e i = 1 n [ B i λ ] κ i = 1 n B i κ 1 i = 1 n { 1 e [ B i λ ] κ } β 1 ,
where B i = log ( 1 ( 1 e θ x i ) α ) , C i = 1 e θ x i . The log-likelihood function for the EEWE distribution can be shown as
= n log ( κ β α θ ) n κ log λ θ i = 1 n x i i = 1 n log ( 1 C i α ) i = 1 n [ B i λ ] κ + ( α - 1 ) i = 1 n log ( C i ) + ( k 1 ) i = 1 n log ( B i ) + ( β - 1 ) i = 1 n log [ 1 e [ B i λ ] κ ]
The derivatives results of Equation (33), with respect to the EEWE distribution parameters, are shown as
κ = n ( κ 1 log λ ) + i = 1 n log ( B i ) ( B i λ ) κ log [ B i λ ] 1 ( β 1 ) e [ B i λ ] κ [ 1 e [ B i λ ] κ ] .
β = n β + i = 1 n log [ 1 e [ B i λ ] κ ] .
α = n α + i = 1 n log ( C i ) 1 + C i α 1 C i α 1 + ( κ 1 ) B i κ λ κ B i κ 1 1 ( β 1 ) e [ B i λ ] κ { 1 e [ B i λ ] κ } .
θ = n θ i = 1 n x i + i = 1 n x i e θ x i { ( α 1 ) C i + α C i α 1 1 C i α [ 1 + ( κ 1 ) B i κ λ κ B i κ 1 1 ( β 1 ) e [ B i λ ] κ [ 1 e [ B i λ ] κ ] ] } .
λ = κ λ n λ κ B i κ 1 i = 1 n log ( 1 C i α ) 1 ( β 1 ) e [ B i λ ] κ [ 1 e [ B i λ ] κ ] .
Hence, the MLE_s of the parameters κ , β , α , θ , and λ can be existed by setting Equations (34)–(38) to zero and solve them analytically or by using numerical methods, such as, the Newton–Raphson iteration method. Moreover, the estimators can be obtained automatically by maximizing Equation (33) using any R function, such as optim and nlm.

4. Simulation Study

This section presents three cases of simulation studies to test the performance of the MLEs of the EEWE distribution parameters. Different values for the true parameters ω t r have been considered as follows:
Case I: κ = 1.7 , β = 0.5 , α = 1.1 , θ = 0.63 and λ = 0.07 .
Case II: κ = 10 , β = 0.7 , α = 0.4 , θ = 0.01 and λ = 0.03 .
Case III: κ = 1.7 , β = 5 , α = 0.5 , θ = 0.01 and λ = 0.07 .
For each case, the simulation has been conducted with the number of iterations equal to n s i m = 1000 . To evaluate the MLE, ω ^ , for each parameter, the mean square error (MSE) was used, which can be defined as
M S E ( ω ^ ) = i = 1 n s i m ( ω i ^ ω t r ) 2 n s i m
The Monte Carlo simulation method was applied using the programming language R. The MLE of parameters with their MSE are presented in Table 1.
It is clear that the MSE becomes smaller as the sample size rises and the estimates become nearer to the true value of parameters.

5. Application

In this section, three real datasets have been fitted by six different distributions including the proposed EEWE. Four of these distributions are special cases for the EEWE distribution and the fifth one is the generalized transmuted generalized exponential distribution. The PDF for the five distributions can be presented as
(1)
Exponential distribution
g ( x ) = θ e θ x .
(2)
Weibull exponential distribution
g ( x ) = κ θ e ( θ x λ ) κ ( θ x ) κ 1 λ κ .
(3)
Generalized Weibull exponential distribution presented by [16]
g ( x ) = κ α θ λ κ e θ x C α 1 ( 1 C α ) B κ 1 e [ B λ ] κ
(4)
Exponentiated Weibull exponential distribution
g ( x ) = κ β θ e ( θ x λ ) κ ( θ x ) κ 1 λ κ { 1 e ( θ x λ ) κ } β 1
(5)
Generalized transmuted generalized exponential distribution
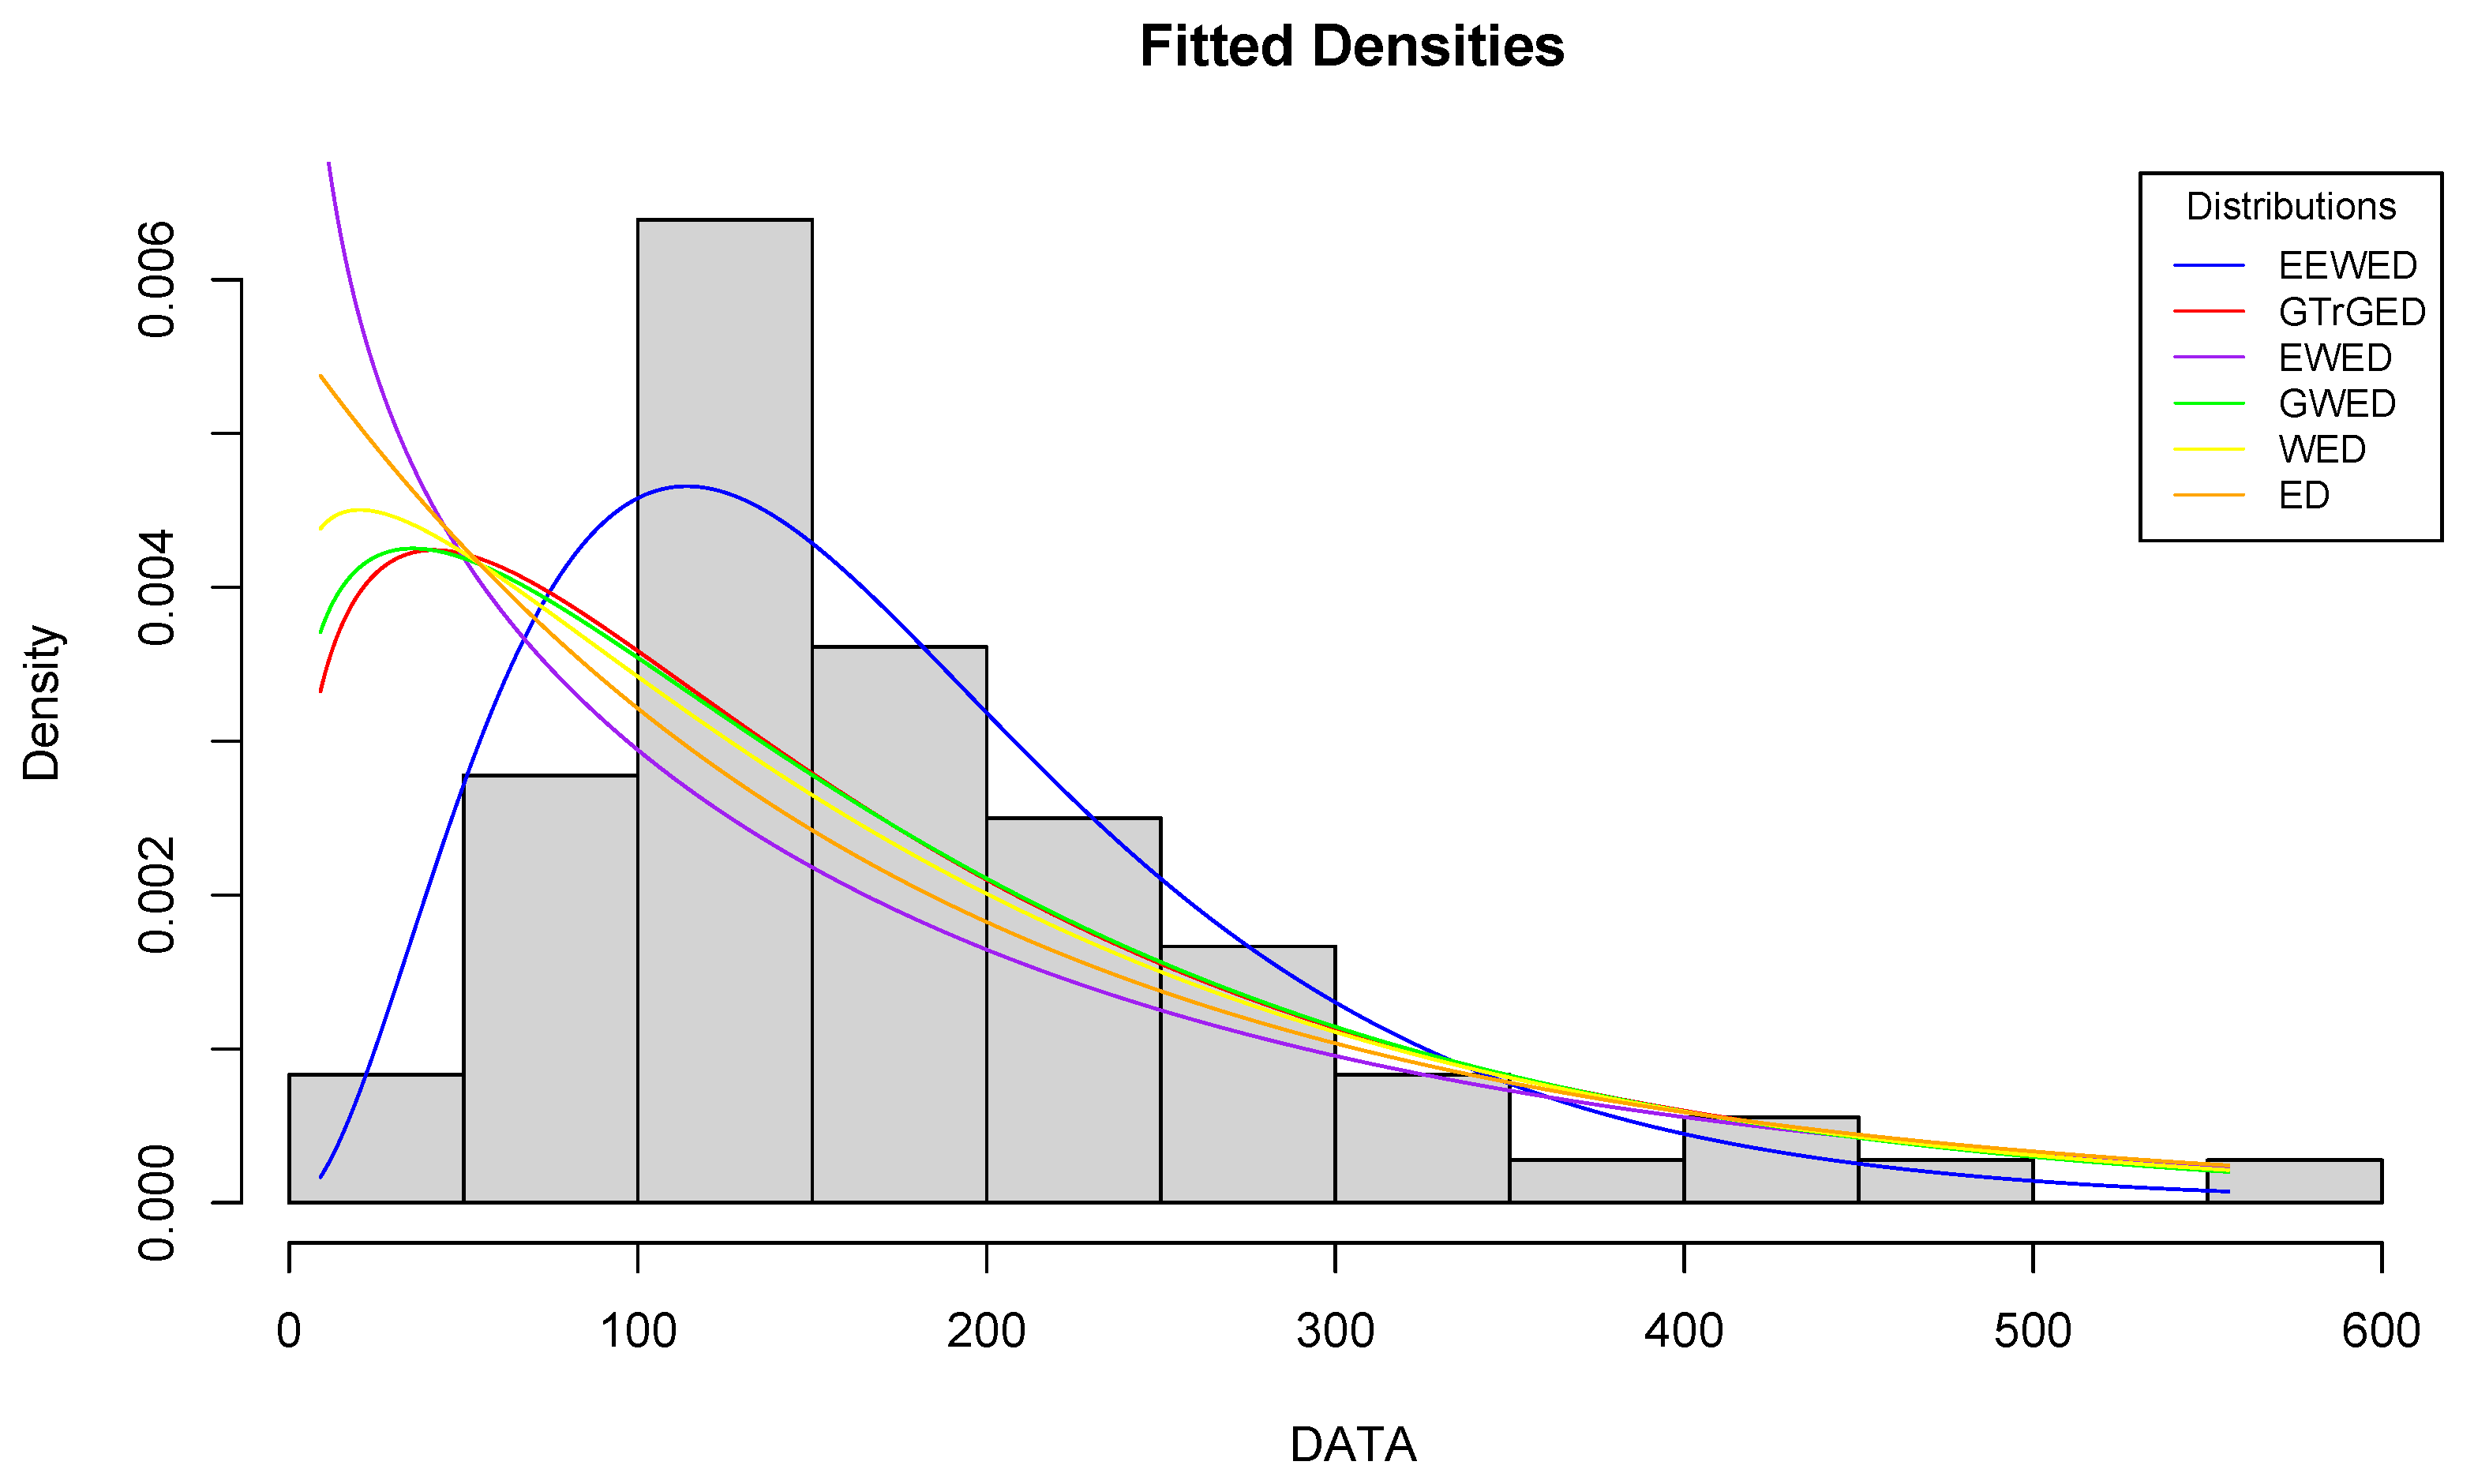
g ( x ) = α θ e θ x C a α 1 [ a ( 1 + λ ) λ ( a + b ) C b α ]
The parameters of the fitted distribution are estimated via the ML method by maximizing the log-likelihood. The Akaike information criterion (AIC) and the corrected Akaike information criterion (AICc) are computed, hence, the best model is the one that gives minimum AIC and AICc. The plots are used to compare the EEWE distribution with other distributions and the Kolmogorov–Smirnov (K–S), which is used to introduce the p-value for each distribution.

5.1. First Dataset

The first dataset is reported in [17] and displays the time (in days) for the survival of 72 guinea pigs infected by virulent tubercle bacilli. Figure 3 shows the plot of the fitted distributions for the first dataset and Table 2 summarizes the results of MLEs of the parameters, the log-likelihood, AIC, and AICc for each distribution.

5.2. Second Dataset

The second dataset is presented in [18] and contains 40 observations for the time (in 103 h) to failure of the turbocharger of one type of engine. Figure 4 shows the plot of the fitted distributions for the second dataset and Table 3 summarizes the results of MLEs of the parameters, the log-likelihood, AIC, and AICc for each distribution.

5.3. Third Dataset

The third dataset was submitted by the authors of [19] and includes 101 observations. It displays the fatigue life (at 18 cycles per second) of 6061-T6 aluminum coupons cut parallel to the direction of rolling and oscillated. Figure 5 shows the plot of the fitted distributions for the third dataset and Table 4 summarizes the results of MLEs of the parameters, the log-likelihood, AIC, and AICc for each distribution.
It is evident from the Table 2, Table 3 and Table 4 that the EEWE distribution is the best one of the other comparative distributions by looking at the values of AIC and AICc. Additionally, Figure 3, Figure 4 and Figure 5 support this conclusion.

6. Conclusions

In this paper, a new approach to generating a new family of distributions has been applied. This new family is called the exponentiated exponentiated Weibull-X family and the EEWE distribution was introduced as a member of this family. Some statistical characteristics of this distribution were studied and its five parameters were estimated using the ML method. Three cases of different values of the EEWE parameters and four different sample sizes are used to assess the performance of the MLEs in the EEWE distribution parameters. Three datasets of real data were utilized to prove the efficiency of the EEWE distribution in comparison to some other distributions. The usefulness and effectiveness of the proposed distribution were demonstrated. The EEWE is a highly flexible distribution in real data modeling.

7. Future Works

For future works, we propose to generate new distributions using the proposed new family and estimate the unknown parameters of the proposed distribution using different estimation methods.

Author Contributions

Conceptualization, D.A. and E.A.; methodology, E.A. and D.A.; software, E.A.; validation, E.A. and D.A.; formal analysis, E.A.; investigation, D.A.; resources, E.A.; data curation, E.A.; writing—original draft preparation, E.A.; writing—review and editing, D.A.; visualization, E.A.; supervision, D.A.; project administration, D.A. All authors have read and agreed to the published version of the manuscript.

Funding

This research received no external funding.

Institutional Review Board Statement

Not applicable.

Informed Consent Statement

Not applicable.

Data Availability Statement

Not applicable.

Conflicts of Interest

The authors declare no conflict of interest.

References

  1. Gupta, R.C.; Gupta, P.L.; Gupta, R.D. Modeling Failure Time Data by Lehman Alternatives. Commun. Stat.-Theory Methods 1998, 27, 887–904. [Google Scholar] [CrossRef]
  2. Ali, M.M.; Pal, M.; Woo, J.S. Some Exponentiated Distributions. Commun. Stat. Appl. Methods 2007, 14, 93–109. [Google Scholar] [CrossRef]
  3. Nadarajah, S.; Gupta, A.K. The Exponentiated Gamma Distribution with Application to Drought Data. Calcutta Stat. Assoc. Bull. 2007, 59, 29–54. [Google Scholar] [CrossRef]
  4. Shawky, A.; Abu-Zinadah, H.H. Exponentiated Pareto Distribution: Different Method of Estimations. Int. J. Contemp. Math. Sci. 2009, 4, 677–693. [Google Scholar]
  5. Abu-Zinadah, H.H.; Aloufi, A.S. Some characterizations of the exponentiated Gompertz distribution. Int. Math. Forum 2014, 9, 1427–1439. [Google Scholar] [CrossRef]
  6. Salem, H.M. The Exponentiated Lomax Distribution: Different Estimation Methods. Am. J. Appl. Math. Stat. 2014, 2, 364–368. [Google Scholar] [CrossRef]
  7. Rather, A.A.; Subramanian, C. Exponentiated Mukherjee-Islam Distribution. J. Stat. Appl. Probab. 2018, 7, 357–361. [Google Scholar] [CrossRef]
  8. Alzaatreh, A.; Famoye, F.; Lee, C. A New Method for Generating Families of Continuous Distributions. METRON 2013, 71, 63–79. [Google Scholar] [CrossRef]
  9. Alzaatreh, A.; Famoye, F.; Lee, C. Weibull-Pareto Distribution and its Applications. Commun. Stat.-Theory Methods 2013, 42, 1673–1691. [Google Scholar] [CrossRef]
  10. Klakattawi, H.S. The Weibull-Gamma Distribution: Properties and Applications. Entropy 2019, 21, 438. [Google Scholar] [CrossRef]
  11. Alzaghal, A.; Famoye, F.; Lee, C. Exponentiated T-X Family of Distributions with Some Applications. Int. J. Stat. Probab. 2013, 2, 31–49. [Google Scholar] [CrossRef]
  12. Jabeen, S.; Para, B. Exponentiated Gamma Exponential Distribution. Sohag J. Math. 2018, 5, 79–84. [Google Scholar]
  13. Nadarajah, S.; Cordeiro, G.M.; Ortega, E.M. The Zografos–Balakrishnan-G family of distributions: Mathematical properties and applications. Commun. Stat.-Theory Methods 2015, 44, 186–215. [Google Scholar] [CrossRef]
  14. Cordeiro, G.M.; M Ortega, E.M.; Ramires, T.G. A new generalized Weibull family of distributions: Mathematical properties and applications. J. Stat. Distrib. Appl. 2015, 2, 1–25. [Google Scholar] [CrossRef]
  15. Rényi, A. On measures of entropy and information. In Proceedings of the Fourth Berkeley Symposium on Mathematical Statistics and Probability, Volume 1: Contributions to the Theory of Statistics, Berkeley, CA, USA, 20 June–30 July 1960; The Regents of the University of California: Oakland, CA, USA, 1961. [Google Scholar]
  16. Salem, H.M.; Selim, M. The Generalized Weibull-Exponential Distribution: Properties and Applications. Int. J. Stat. Appl. 2014, 4, 102–112. [Google Scholar]
  17. Bjerkedal, T. Acquisition of Resistance in Guinea Pies infected with Different Doses of Virulent Tubercle Bacilli. Am. J. Hyg. 1960, 72, 130–148. [Google Scholar] [PubMed]
  18. Xu, K.; Xie, M.; Tang, L.C.; Ho, S. Application of neural networks in forecasting engine systems reliability. Appl. Soft Comput. 2003, 2, 255–268. [Google Scholar] [CrossRef]
  19. Birnbaum, Z.W.; Saunders, S.C. Estimation for a family of life distributions with applications to fatigue. J. Appl. Probab. 1969, 6, 328–347. [Google Scholar] [CrossRef]
Figure 1. PDFs for the exponentiated exponentiated Weibull exponential for several values of κ , β , α , θ , and λ .
Symmetry 14 01739 g001
Figure 2. Hazard function for the exponentiated exponentiated Weibull exponential for several values of κ , β , α , θ , and λ .
Symmetry 14 01739 g002
Figure 3. Comparison of the EEWE distribution with other distributions for the first dataset.
Symmetry 14 01739 g003
Figure 4. Comparison of the EEWE distribution with other distributions for the second dataset.
Symmetry 14 01739 g004
Figure 5. Comparison of the EEWE distribution with other distributions for the third dataset.
Symmetry 14 01739 g005
Table 1. Simulation study results for the EEWE parameter estimates and the MSE, for three different cases with different sample sizes.
Sample SizeParameterCase ICase IICase III
MLEMSEMLEMSEMLEMSE
n = 30 κ 1.762136180.1296519829.999998596.954299 × 10 10 1.745993290.039682607
β 0.701811420.3764922370.699987674.283840 × 10 8 4.960899970.038061954
α 1.192647640.1247228400.399939117.877924 × 10 7 0.494910320.009612482
θ 0.631843210.0047218380.010038962.259842 × 10 7 0.068486980.043138538
λ 0.062478690.0012963000.299971041.193325 × 10 7 0.181474130.186045347
n = 100 κ 1.748797290.04499157089.999999631.076094 × 10 10 1.709394310.006057104
β 0.545291060.08287863280.699996179.621094 × 10 9 4.991556360.005188604
α 1.146681570.05070405780.399975002.988855 × 10 7 0.497634420.001341771
θ 0.637520050.00023591740.010000437.295098 × 10 8 0.022438680.007344277
λ 0.067776580.00055513120.299984898.749173 × 10 8 0.095817240.035992660
n = 200 κ 1.720375010.01994636519.999999773.979467 × 10 11 1.700180954.287554 × 10 6
β 0.529093880.03046187730.699997513.975560 × 10 9 4.999940036.777741 × 10 6
α 1.111488200.02323697860.399982751.094464 × 10 7 0.500493582.552080 × 10 5
θ 0.638488300.00013316680.010000663.239753 × 10 8 0.010438174.765273 × 10 5
λ 0.070833940.00027642110.299989023.205238 × 10 8 0.070724491.246056 × 10 4
n = 500 κ 1.715161690.00826271919.9999999754.400126 × 10 13 1.700000952.189370 × 10 10
β 0.505195900.00996283420.6999995076.021973 × 10 11 5.000000307.631066 × 10 12
α 1.106627180.00963927480.3999920364.053356 × 10 9 0.500014278.525506 × 10 9
θ 0.637435950.00007821450.0099951081.321479 × 10 8 0.010016965.476000 × 10 8
λ 0.070940530.00012384950.2999936432.002551 × 10 9 0.070031312.155901 × 10 8
Table 2. Estimation for the first dataset.
DistributionsEEWEGTrGEEWEGWEWEE
Parameters estimation θ ^ = 0.0103 θ ^ = 0.006 θ ^ = 0.0023 θ ^ = 0.0065 θ ^ = 0.0061 θ ^ = 0.0057
κ ^ = 1.1 α ^ = 1.1062 κ ^ = 1.1 κ ^ = 1.1 κ ^ = 1.1
λ ^ = 1.1 λ ^ = 0.0471 λ ^ = 0.5 λ ^ = 1.1 λ ^ = 1.1
α ^ = 1.1 a ^ = 1.2058 β ^ = 0.7 α ^ = 1.1
β ^ = 2.5 b ^ = 0.4997
Log-likelihood−425.7619−437.7061−450.4563−437.9455−440.1889−444.6093
AICc862.4329886.3213909.5096884.4880886.7306891.2757
AIC861.5238885.4122908.9126883.8910886.3777891.2186
p-value4.3706 × 10 1 3.2755 × 10 4 1.0452 × 10 7 1.9622 × 10 4 5.5284 × 10 5 7.5031 × 10 6
Table 3. Estimation for the second dataset.
DistributionsEEWEGTrGEEWEGWEWEE
Parameters estimation θ ^ = 0.0349 θ ^ = 0.4499 θ ^ = 0.0368 θ ^ = 0.0243 θ ^ = 0.0501 θ ^ = 0.1599
κ ^ = 4.1813 α ^ = 3.1014 κ ^ = 4.8742 κ ^ = 2.8551 κ ^ = 3.8584
λ ^ = 0.0442 λ ^ = −0.0061 λ ^ = 0.275 λ ^ = 0.0753 λ ^ = 0.3468
α ^ = 2.2543 a ^ = 3.0681 β ^ =0.6589 α ^ = 1.4053
β ^ = 0.329 b ^ = −0.0014
Log-likelihood−79.6825−90.1427−81.2893−82.6434−82.4759−113.3193
AICc171.1297192.0500171.7215174.4297171.6184228.7438
AIC169.3650190.2853170.5787173.2868170.9518228.6385
p-value8.5019 × 10 1 2.9757 × 10 1 7.6829 × 10 1 7.3139 × 10 1 7.4037 × 10 1 5.2504 × 10 5
Table 4. Estimation for the third dataset.
DistributionsEEWEGTrGEEWEGWEWEE
Parameters estimation θ ^ = 0.0173 θ ^ = 0.0393 θ ^ = 0.017 θ ^ = 0.0117 θ ^ = 0.0043 θ ^ = 0.0146
κ ^ = 1.8712 α ^ = 2.9796 κ ^ = 1.318 κ ^ = 1.8748 κ ^ = 1.0524
λ ^ = 0.8063 λ ^ = −0.0244 λ ^ = 0.6616 λ ^ = 0.5594 λ ^ = 0.2944
α ^ = 1.3978 a ^ = 2.8173 β ^ = 4.5336 α ^ = 1.5371
β ^ = 1.889 b ^ = 0.0358
Log-likelihood−454.6378−464.1941−459.8019−459.9742−517.9904−522.4495
AICc919.9140939.0264928.0248928.36941042.22961046.9399
AIC919.2757938.3881927.6038927.94831041.97961046.8991
p-value4.2979 × 10 1 1.2058 × 10 1 1.4214 × 10 1 2.6729 × 10 2 1.9496 × 10 11 4.2664 × 10 12
Publisher’s Note: MDPI stays neutral with regard to jurisdictional claims in published maps and institutional affiliations.

