Article

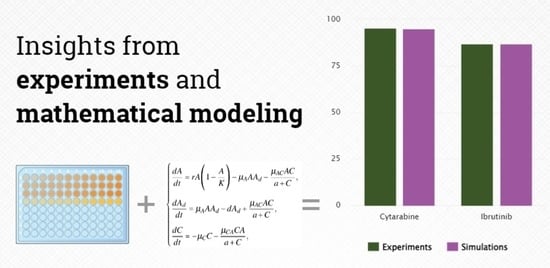
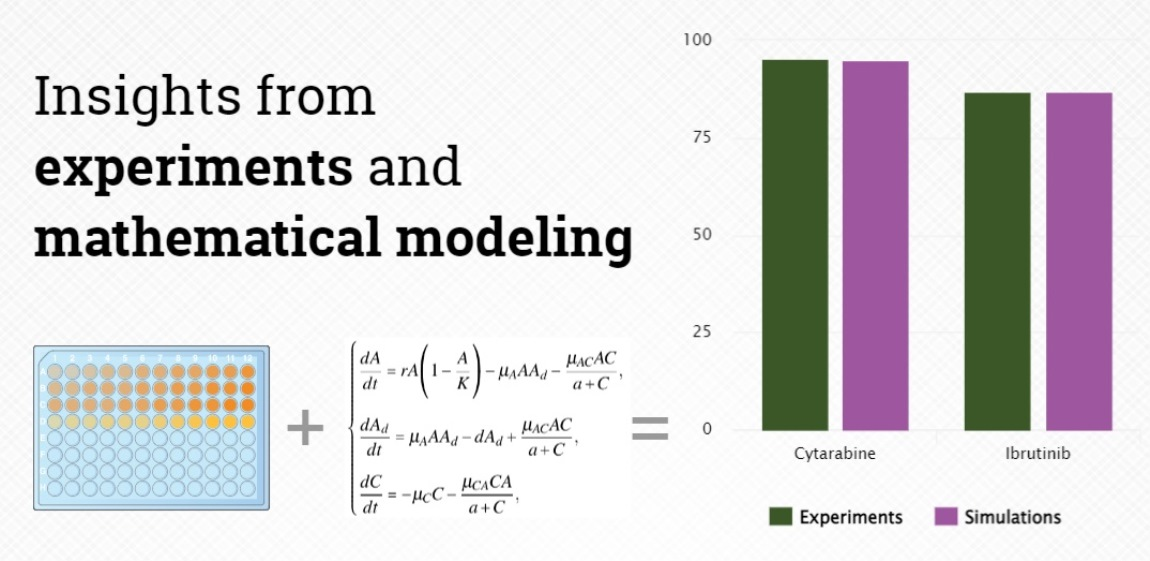
Differential Response to Cytotoxic Drugs Explains the Dynamics of Leukemic Cell Death: Insights from Experiments and Mathematical Modeling

by
Ekaterina Guzev
1,
Svetlana Bunimovich-Mendrazitsky
1,* and
Michael A. Firer
2,3,4
1
Department of Mathematics, Ariel University, Ariel 4070000, Israel
2
Department of Chemical Engineering, Ariel University, Ariel 4070000, Israel
3
Adelson School of Medicine, Ariel University, Ariel 4070000, Israel
4
Ariel Center for Applied Cancer Research, Ariel University, Ariel 4070000, Israel
*
Author to whom correspondence should be addressed.
Symmetry 2022, 14(6), 1269; https://doi.org/10.3390/sym14061269
Submission received: 17 May 2022 / Revised: 6 June 2022 / Accepted: 16 June 2022 / Published: 20 June 2022
(This article belongs to the Special Issue Mathematical Models: Methods and Applications)

Abstract

:
This study presents a framework whereby cancer chemotherapy could be improved through collaboration between mathematicians and experimentalists. Following on from our recently published model, we use A20 murine leukemic cells transfected with monomeric red fluorescent proteins cells (mCherry) to compare the simulated and experimental cytotoxicity of two Federal Drug Administration (FDA)-approved anticancer drugs, Cytarabine (Cyt) and Ibrutinib (Ibr) in an in vitro model system of Chronic Lymphocytic Leukemia (CLL). Maximum growth inhibition with Cyt (95%) was reached at an 8-fold lower drug concentration (6.25 μM) than for Ibr (97%, 50 μM). For the proposed ordinary differential equations (ODE) model, a multistep strategy was used to estimate the parameters relevant to the analysis of in vitro experiments testing the effects of different drug concentrations. The simulation results demonstrate that our model correctly predicts the effects of drugs on leukemic cells. To assess the closeness of the fit between the simulations and experimental data, RMSEs for both drugs were calculated (both RMSEs < 0.1). The numerical solutions of the model show a symmetrical dynamical evolution for two drugs with different modes of action. Simulations of the combinatorial effect of Cyt and Ibr showed that their synergism enhanced the cytotoxic effect by 40%. We suggest that this model could predict a more personalized drug dose based on the growth rate of an individual’s cancer cells.

Graphical Abstract

1. Introduction

Chronic Lymphocytic Leukemia (CLL) is characterized by the accumulation of clonal B cells in peripheral blood [1]. Currently, patients with CLL are mostly treated with drugs that target the activity of mutated proteins critical to the survival of CLL cells, such as Bruton’s Tyrosine Kinase (BTK), B-cell lymphoma 2 (Bcl-2) and phosphoinositide 3-kinase (PI3K). Inhibitors of BTK, such as Ibrutinib (Ibr) or more recently acalabrutinib, are highly effective, even in poor-risk or chemo-refractory patients [2,3]. In addition, combinations of drugs, especially those with different mechanisms of action, may be effective in CLL cases [4,5]. However, while these drugs have led to significant improvements in the overall survival of most subgroups of patients with CLL, the disease remains incurable and novel approaches are required that will lead to more effective therapies [6]. Unfortunately, there has been little published collaboration between mathematicians and experimentalists to devise methods that might lead to improved treatment protocols for patients with CLL.
We suggest that numerical simulations of cancer chemotherapies can provide a means for researchers and clinicians to explore the possibility of predicting efficient, personalized treatment protocols based on mathematical parameters of cancer development in an individual. Ordinary differential equation (ODE)-based models have been used to define the modifications of continuous variables in mathematical models and have already been applied to several types of leukemia and lymphoma, including chronic myeloid leukemia [7], acute myeloid leukemia [8], T-cell lymphoma and periodic hematological diseases [9,10]. However, there are still no validated models for CLL. Experimental and clinical data are essential to the development and validation of these models [11].
In a previous study, we developed an ODE model based on a [12,13], to describe the drug cytotoxicity of three chemotherapeutic drugs, Chlorambucil, Melphalan, and Cytarabine (Cyt) for murine leukemic cells [14]. Cyt, which was the most toxic of the three drugs, is an analogue of cytidine, whose incorporation into DNA leads to interruption of DNA replication and induction of DNA damage repair pathways and is used in the treatment of several types of cancer [15]. Here, we extend the validation of the model by comparing the in vitro results of Cyt, with that of Ibr. Ibr covalently binds to cysteine-481 in the BTK enzyme, thus inhibiting several essential intracellular biochemical pathways that influence tumor cell proliferation and migration [16]. As these two drugs have different mechanisms of action, the availability of computational ODE models based on experimental data will assist in developing rational approaches to combination therapies that may overcome the outgrowth of drug resistant cancer cell clones, commonly the outcome of mono-drug therapies [17,18]. As an in vitro experimental model system, we used A20 murine leukemic cells transfected with monomeric red fluorescent proteins cells (mCherry) in order to compare the cytotoxic efficacy between Ibr and Cyt. The results validate that our model can be used as a generic tool to explore the cytotoxic activity of various drugs with different doses by proper adjustment of the values for certain parameters.

2. Materials and Methods

In order to predict the efficacy of an anticancer drug, we first developed a mathematical model. To validate the applicability of this model, experiments were then carried out in vitro using two chemotherapeutic anticancer drugs. The first drug, Cyt, was chosen because our previous study demonstrated its superior cytotoxicity over Chlorambucil and Melphalan for A20 leukemic cells. As Cyt is not used clinically to treat CLL, we compared Cyt to the cytotoxicity of Ibr, an FDA-approved drug for front-line therapy of CLL. Finally, we compared the simulation model with the experimental data. The simplified scheme below (Figure 1) illustrates the whole process.

2.1. Formulation of the Model

Based on our previous study [14], we consider a model that uses three critical variables to describe the in vitro experimental system, live leukemic cancer cells—dead cancer cells, and drug molecules, denoted by A, A d and C, respectively.
{ (1) d A d t = r A ( 1 A K ) μ A A A d μ A C A C a + C , (2) d A d d t = μ A A A d d A d + μ A C A C a + C , (3) d C d t = μ C C μ C A C A a + C ,
d A d t is the dynamic of living cancer cells. It is made up of three components: one of these is positive and relates to the logistic cancer growth which is characterized by the coefficient r and is limited by the maximal tumor cell number, K; a negative term, corresponding to living cells to become dead with the rate μ A . The last negative term represents the log-kill hypothesis [12], with a Michaelis–Menten drug saturation response [19], a + C ; μ A C is the death rate resulting from the action of the drug on cancer cells. The parameter μ A C changes depending on the particular drug and the dose.
d A d d t is the dynamic of dead A20 cells. The first and the last terms are positive, represent the death of cancer cells with a rate coefficient of μ A due to apoptosis or necrosis and depend on living cancer cells competing for survival (oxygen consumption and nutrition) in an enclosed space, and those that changed from living to dead under the influence of medicine; the negative term corresponds to the dissolution of dead cells with the rate d.
d C d t is the first-order pharmacokinetics of a drug [20]. C ( 0 ) is a constant value and depends on the drug’s dose, since it was given only once at the beginning of the experiment. μ C is the deactivation rate calculated by formula μ C = l n ( 2 ) t 1 / 2 , where t 1 / 2 is the in vitro elimination half-life, 1–3 h (biphasic) for Cyt and 4–6 h for Ibr (www.drugbank.ca, accessed on 17 June 2022). Assuming that there are 10–100 drug molecules attacking each cancer cell, we decided the parameter μ C A should be ten times more than μ A C . The parameter a represents the drug concentration which produces 50% of the maximum activity of the drug in each cell population [12].

2.2. Estimation of the Parameters

The model (Equations (1)–(3)) contains nine parameters that should be determined. Some of the parameter’s values we took from the publicly available resources, but their values may vary in different types of cancers. Other values we obtained from the experiments and due data fitting to estimate the unknown parameters.
Importantly, all the model’s parameters’ values must be positive in order to describe a realistic biological dynamic. We specify the initial conditions at t = 0, as:
  • A ( 0 ) = 5 × 10 4 (cells/mL)-the initial number of A20 mCherry cells;
  • A d ( 0 ) = 2500 (cells/mL)-the initial number of dead A20 mCherry cells (cell cultures commonly consists of at least 5% of dead cells);
  • C ( 0 ) = dose ( μ M) × 6 × 10 11 (number of drug molecules/mL)-the dose concentration of Ibr or Cyt (this number may vary depending on the drug, but not significantly since both drugs are related to the same type of small molecules).
Number of drug molecules was calculated using the expression: m × N a M , where
  • m = the mass of drug in kg,
  • N a = avogadro number = 6.022 × 10 23 (constant),
  • M = the molar mass of drug (Ibr 440.5 g/mol; Cyt 243.217 g/mol).
Thus, for 50 µM of Ibr, the Mass = Concentration 4.6 mM × Volume 10.85 µL/mL × Molecular Weight 440.5 g/mol = 22 µg = 2.2 × 10 8 kg, the number of Ibr molecules will be:
2.2 × 10 8 × 6.022 × 10 23 440.5 = 3 × 10 13 = 50 × 6 × 10 11 ;
for 6.25 µM of Cyt, the Mass = Concentration 4 mM × Volume 1.56 µL/mL × Molecular Weight 243.22 g/mol = 1.52 µg = 1.52 × 10 9 kg, the number of Cyt molecules will be:
1.52 × 10 9 × 6.022 × 10 23 243.22 = 3.75 × 10 12 = 6.25 × 6 × 10 11 .
The parameters used in this study are summarized in Table 1.

2.3. Cells and Reagents

Murine A20 leukemic cells transfected with monomeric red fluorescent proteins cells (a kind gift from Prof. Michael Sherman, Ariel University) were cultured in RPMI 1640 (Thermo Fischer Scientific, Waltham, MA, USA) to which was added 10% Fetal Bovine Serum (FBS) (Thermo Fischer), 1% L-Glutamine and 0.33% Pen-Strep solution and maintained at 37° and 5% CO2. Cell viability and growth were measured with the XTT-based Cell Proliferation Kit (Biological Industries, Bet Haemek, Israel) according to the manufacturer’s instructions. At the end of the culture period, the medium was replaced with fresh culture medium containing XTT reagent to measure cellular metabolism as a correlate of cell viability. After 2 h of cell incubation, absorbance in the wells was measured at 450 nm and subtracted from the reference absorbance at 630 nm. As a background control, the culture medium was used.

2.4. Drug Cytotoxicity Assay

Drug cytotoxicity was determined by culturing A20 mCherry cells at 37°, 5% CO2 in 96-well microplates (Nunclon) at an initial concentration of 5 × 10 4 /well for 72 h in culture medium (as described above) containing either Cyt or Ibr at concentrations ranging from 0 to 50 μ M. At the end of the culture period, cell viability was measured with the XTT reagent as described above.

3. Results

The outcome of our present study is the development of a tool, which is able:
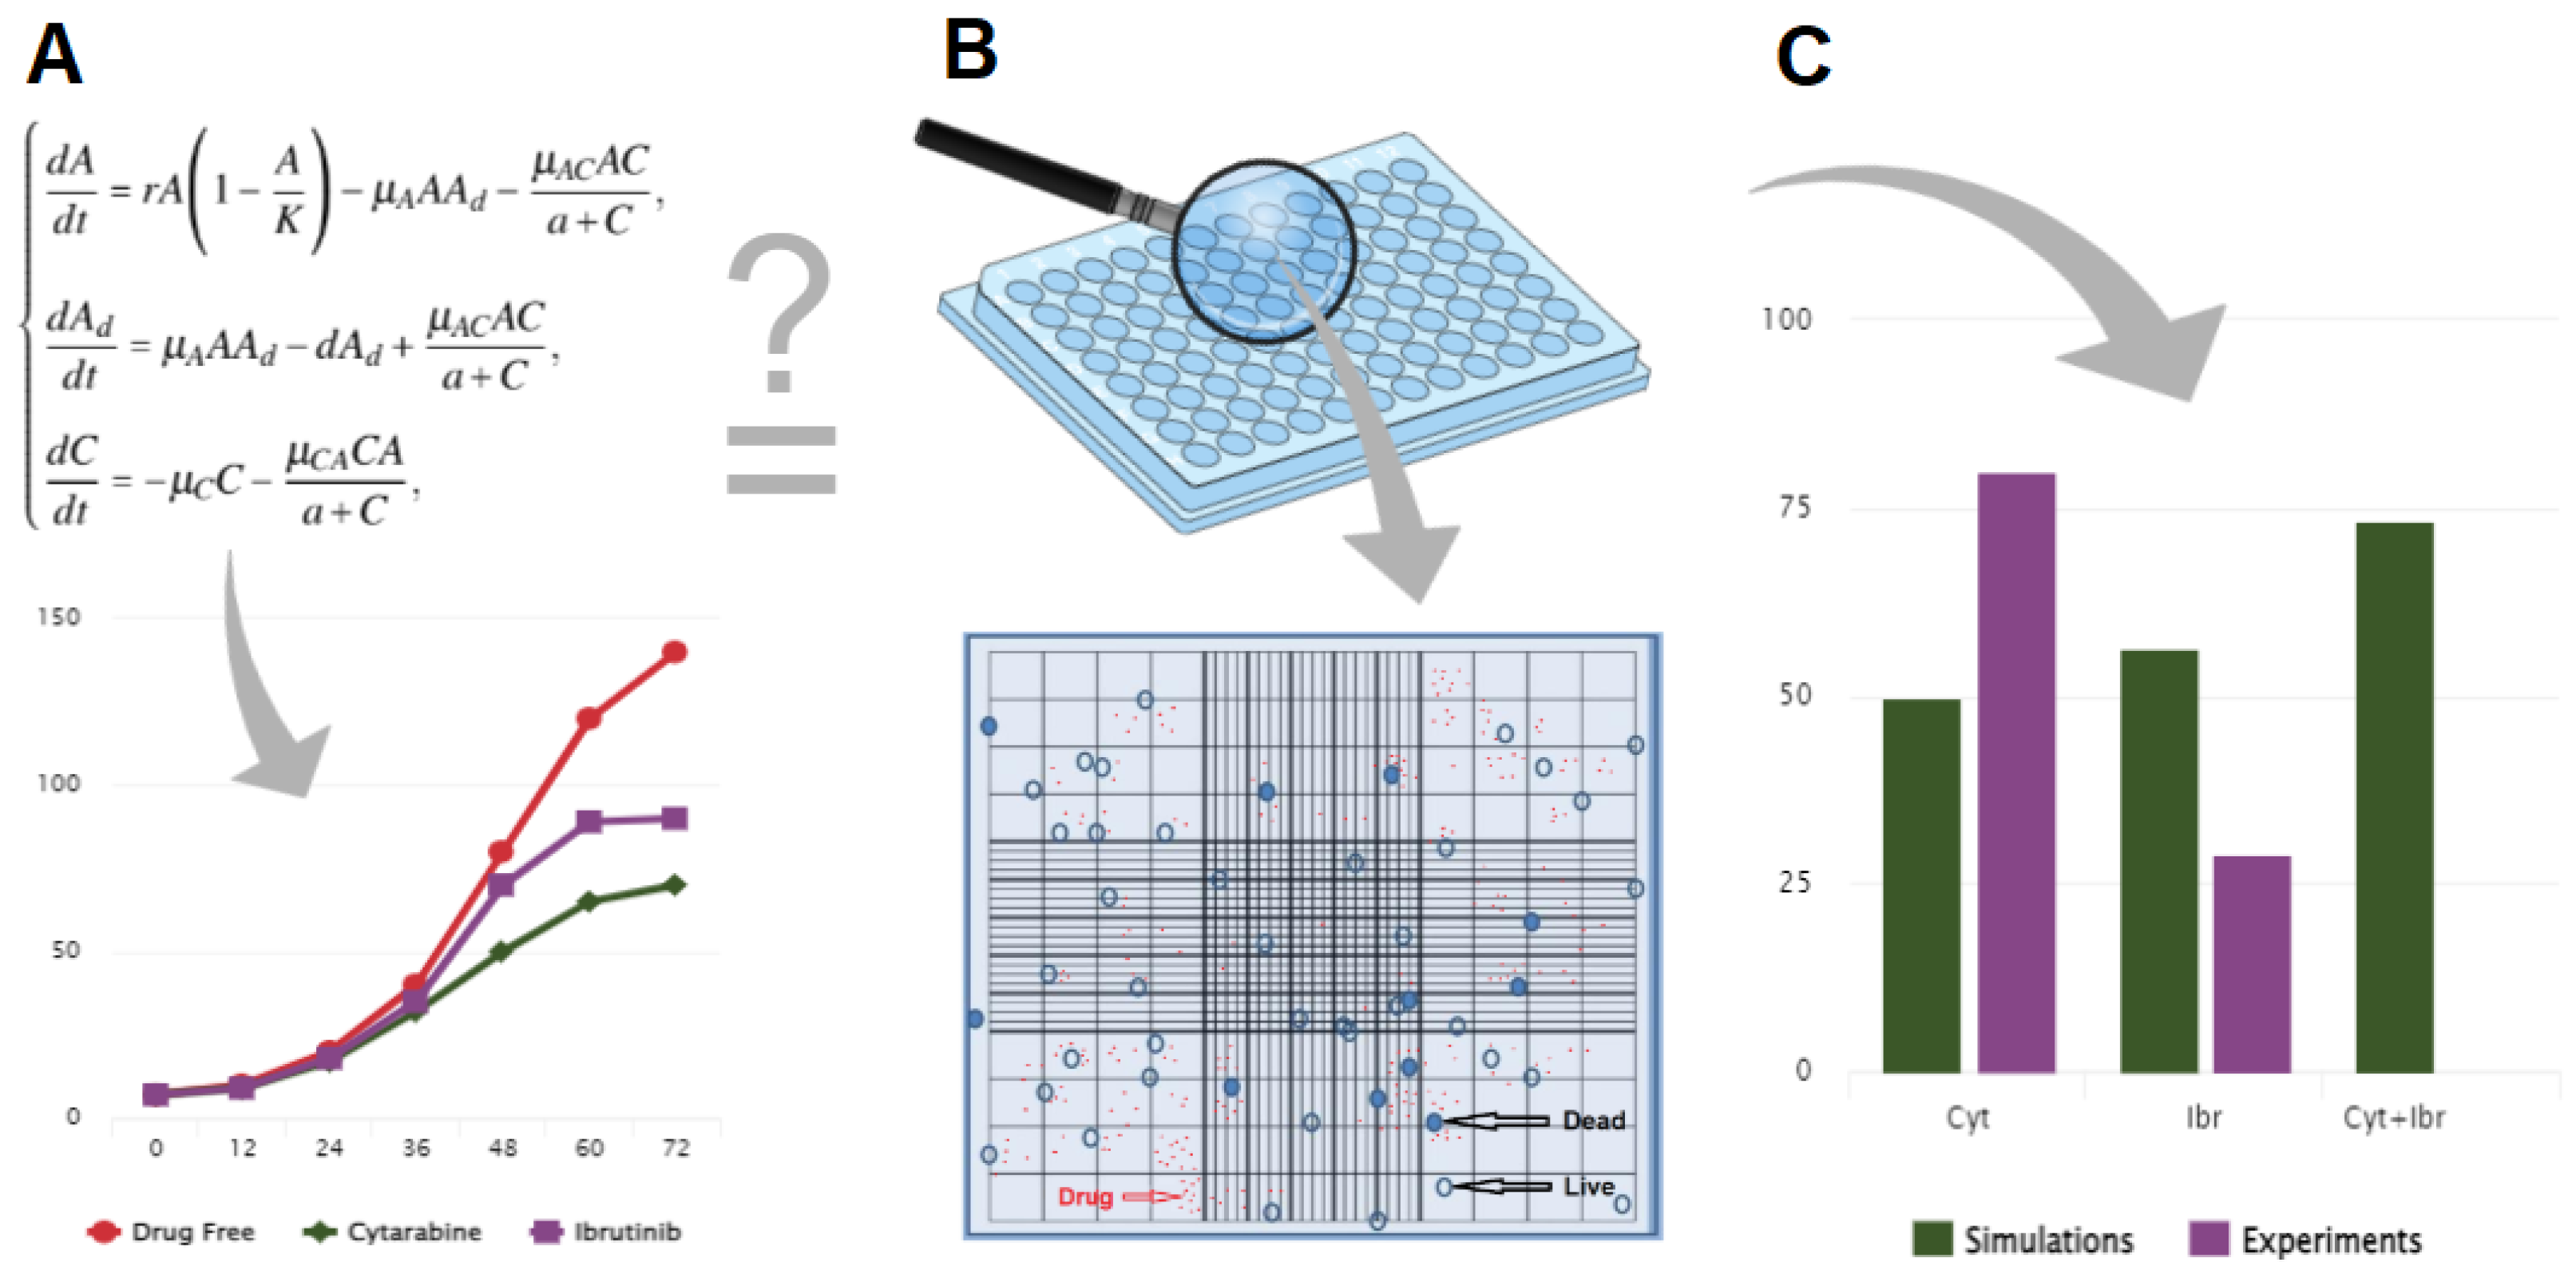
  • To simulate the impact of Cyt and Ibr drugs on killing A20 leukemic cells in silico;
  • To predict with a high level of accuracy of the cytotoxic efficacy of Cyt and Ibr drugs for high doses in comparison with the results in vitro experiments.
Below we disclose documentation about the experiments, introduce simulation capabilities of Cyt and Ibr drugs, and predict the improvement of cytotoxic efficacy using combined therapy in silico.

3.1. Validation of the In Vitro A20 mCherry Cell Drug Cytotoxicity Dynamic Model

We first checked that A20 mCherry cells have the same growth rate as a surrogate for CLL cells, r = 0.07 (Table 1 in Guzev et al. [14] and Table 1 in the current work). We then tested in vitro the cytotoxicity of Cyt and Ibr against A20 mCherry cells and compared the degree of A20 mCherry growth inhibition received from numerical simulation (Figure 2) with output obtained by in vitro experiments. The results are shown in Figure 3.
Using Equations (1)–(3), we could numerically simulate the effect of Cyt or Ibr on A20 mCherry cells by substituting necessary parameters with the values from the Table 1. Fourth-order adaptive step Runge–Kutta integration applied with the ODE45 subroutine of MATLAB [21] was used to carry out computer simulations. The finite-distance analysis error of the proposed model is presented in Appendix B.
After 72 h the concentration of A20 mCherry growth without drug increased to A ( 72 ) = 2,636,950 cells/mL. The additional 50 µM of Ibr (A) reduced the growth to A ( 72 ) = 50,953 cells/mL, which equals 98.1% growth inhibition and 6.25 µM of Cyt induced 94.8 % growth inhibition (B). For the calculated data points for all drug concentrations, see Appendix A (Table A1 and Table A2).
As one can see from Figure 3, Ibr was more effective with a higher dose, 50 µM-97.5% of growth inhibition. On the other hand, Cyt maintained a high level, 95.2% of growth inhibition under a much lower dose concentration, 6.25 µM of the drug.
Numerical simulations corresponded with the trial information for the high portions of both medications: under 50 and 25 µM of Ibr, as seen in Table 2, the results from experiments and simulations were the same, around 98% and 91%, respectively, and under 6.25 µM of Cyt, around 95%. For the moderate dosages, there had all the earmarks of being a slight deviation between the two arrangements of information. This deviation was imitated since we attempted to keep up with consistency in the lessening of the parameter μ A C as per the abatement in the medication portion. This brought in a discrepancy of 30% for each medication. Nonetheless, it is vital to take note that keeping up with this consistency isn’t required, and it is feasible to compare the experimental and simulation results with outright precision by picking the fitting parameter μ A C .

3.2. Goodness of Fitting Evolution

To assess the goodness of fit between the simulation and experimental data, the root mean square of errors (RMSE) and the mean absolute percentage error (MAPE) were calculated for Cyt and Ibr (Table 2). First of all, we have to normalize our data in order to measure how much error there is between the experimental data and numerical simulations:
σ ( z ) i = z i i n z i ,
then, we calculate RMSE using the formula:
R M S E = i n ( σ ( S i m ) i σ ( E x p ) i ) 2 n ,
where S i m is a predicted value; E x p is an observed value and n is the number of observations.
For calculation, MAPE used the formula:
M A P E = 1 n i n ( E x p i S i m i ) E x p i ,
The result of this can be seen in Table 2.
The correlation held for both drugs (all RMSEs are < 0.1) but was more apparent for Cyt (for Ibr, 0.032; for Cyt, 0.018). The prediction accuracy for Cyt is about 80% (MAPE = 0.198) and for Ibr is about 60% (MAPE = 0.412).

3.3. Prediction of the Synergistic Effect of Drugs

In order to test the synergistic effects of Ibr combined with Cyt, we first ran a simulation using L D 50 concentrations of each drug (Table 3), 3.125 µM of Ibr and 0.195 µM of Cyt and adjusted the calculated parameters into the model (Equations (1)–(3)): C ( 0 ) = ( 3.125 + 0.195 ) × 6 × 10 11 = 3.32 × 6 × 10 11 drug molecules. Under these conditions, Ibr makes up about 94% of the molecules, and Cyt about 6%. Hence, μ C will be: ( 0.116 × 0.94 ) + ( 0.231 × 0.06 ) = 0.124 ; according to the Table A1 and Table A2, μ A C will be 0.015 + 0.008 = 0.023 . This simulation predicted 73.4% of cell growth inhibition, which represents a 40% increase in killing efficiency. Doubling the dose of each drug ( 6.25 µM of Ibr (71.8% killing) and 0.39 µM of Cyt (61.3% killing)) resulted in a simulated increase of cell killing to 85.7% with relevant calculated parameters, μ C = 0.124 and μ A C = 0.034 .

4. Discussion

In this study, we demonstrated experimentally in vitro the cytotoxic efficacy of Ibr compared to that of Cyt in killing A20 leukemic cells. This allowed us to build on our previous model [14] which describes the cytotoxic efficacy of different CLL drugs in killing A20 leukemic cells. In order to validate Equations (1)–(3) of the model, we carried out numerical simulations in accordance with the initial conditions (Table 1) taken from experiments (Figure 2). We found that Cyt (Figure 2B) is a more effective drug than Ibr (Figure 2A), since it requires a lower dose concentration (6.25 µM of Cyt against 50 µM of Ibr) to achieve almost the same maximum growth inhibition (about 95%) of A20 mCherry cells. As can be seen in Table 2, the median lethal dose, L D 50 for Ibr is between 12.5 and 6.25 µM, while the growth cell inhibition with 6.25 µM of Cyt is 93.5%, and the required L D 50 of Cyt is less than 0.098 µM, which Ibr does not react with.
Our simulation and experimental data for the high doses of both drugs were similar (50 and 25 µM of Ibr, around 98% and 91%, respectively, and for 6.25 µM of Cyt, around 95% (Figure 3)). For the moderate dosages, a small deviation between the two sets of data was found which was due to the maintenance of consistency in the decrease in parameter μ A C , correlating to the decrease in drug dose. However, it is possible to obtain the experimental and simulation results with absolute accuracy by selecting the appropriate parameter μ A C for the drug used.
Using two different statistical analyses, the calculations of the differences among values displayed a strong symmetry between the numerical simulations and experimental results: for Cyt, RMSE = 0.018; MAPE = 0.198 and for Ibr, RMSE = 0.032; MAPE = 0.412 (Table 2). The prediction accuracy for Cyt is about 80% and for Ibr is about 60%. It should be noted that these values represent the accuracy across the entire calibration curve. However, regarding the effective drug doses in vitro the prediction was 100% (for 50 and 25 µM of Ibr and for 6.25 µM of Cyt).
The advantage of mathematical modeling is the prediction of the synergistic effect of drugs before conducting experiments. As these two drugs have different modes of action, their combination may lead to improved therapy for CLL patients. To test the synergistic effects of Ibr in combination with Cyt, we performed simulations with a combination of these drugs (Figure 4). The synergism of drugs, manifested in appropriate doses of L D 50 , increases the effective cytotoxicity by another 40% as see in Table 3.
This in vitro model provides important information for drug development. First, it allows the assessment of a critical factor in drug therapy – the ability of the compound to directly influence cell viability. As we demonstrate, important variables of this interaction can be assessed. Another practical value of the model is to highlight additional applications of drugs. Our results predict that Cyt is even more cytotoxic than Ibr for leukemic cells. Even though Cyt is currently not used in the treatment of this cancer, our results suggest that this possibility should be investigated further. The combination of two and more drugs may lead to improved therapy for CLL patients and this can be verified by mathematical modeling.
CLL remains an incurable disease, and new approaches to improving therapy are needed. Mathematical models such as the one described in this study which allow quantitative simulations of cancer chemotherapies based on experimentally validated modeling should provide an opportunity to predict personalized drug therapy for individual patients and establish more efficient treatment protocols.

5. Conclusions

We constructed a mathematical model (Equations (1)–(3)) describing the cytotoxic efficiency of several drugs for leukemic cells. Surprisingly, we found that Cyt was a more effective drug than those currently used in the treatment of CLL.
The model is flexible and can be applied to various cancer cells, drugs and doses by using appropriate values for r, μ A C and d.
The model is an auxiliary tool for predicting the most effective drug in the treatment of CLL.

Author Contributions

E.G. planned and performed all the in vitro experiments, developed mathematical models, performed the simulations and wrote the manuscript. S.B.-M. planned the experiments, oversaw development of the mathematical models, analyzed the results and corrected the manuscript. M.A.F. planned the in vitro experiments, analyzed the results and corrected the manuscript. All authors have read and agreed to the published version of the manuscript.

Funding

This work was supported in part by a grant from the Ariel University Research and Development (Grant number RA19000179). E.G. is the recipient of a graduate fellowship from the Ariel University School of Graduate Studies.

Institutional Review Board Statement

Not applicable.

Informed Consent Statement

Not applicable.

Data Availability Statement

Data are available upon written request from the authors.

Acknowledgments

We thank Teddy Lazebnik for helpful comments and suggestions.

Conflicts of Interest

The authors declare no conflict of interest.

Appendix A

Simulated Effect of Drugs on A20 Cells

Table A1 and Table A2 present data on variations in different parameters μ A C ; type and dose of drug; number of cells at the 72nd hour of numerical simulations.
Table A1. Simulated effect of Ibrutinib on A20 growth parameters.
Concentration of Ibr (µM)Parameter μ AC Number of Cells at 72nd Hour (Cells/mL)Cell Growth Inhibition (%)
0-2,636,9500
500.06650,95398.1
250.046229,41591.3
12.5 0.032424,54883.9
6.25 0.022743,62071.8
3.125 0.0151,152,34756.3
1.5625 0.011,579,53340.1
0.78 0.0071,914,42527.4
0.39 0.0052,244,04414.9
0.195 0.0032,539,3823.7
Table A2. Simulated effect of Cytarabine on A20 growth parameters.
Concentration of Cyt (µM)Parameter μ AC Number of Cells at 72nd Hour (Cells/mL)Cell Growth Inhibition (%)
0-2,636,9500
6.25 0.051137,12194.8
3.125 0.036268,96989.8
1.5625 0.025466,74082.3
0.78 0.017725,16172.5
0.39 0.0121,020,50061.3
0.195 0.0081,326,38649.7
0.098 0.0061,608,54039
0.049 0.0041,853,77629.7
0.024 0.0032,051,54722.2
0.012 0.0022,209,76416.2
0.006 0.00142,328,42711.7

Appendix B

The Finite-Distance Analysis Error of the Model

One can approximate the ODEs presented in Equations (1)–(3) as follows:
( A ( t + 1 ) A ( t ) ) / ( Δ t ) = r A ( t ) ( 1 A ( t ) ) / K ) μ A A ( t ) A d ( t ) ( μ A C A ( t ) C ( t ) ) / ( a + C ( t ) ) ,
( A d ( t + 1 ) A d ( t ) ) / ( Δ t ) = μ A A ( t ) A d ( A ) d A d ( t ) + ( μ A C A ( t ) C ( t ) ) / ( a + C ( t ) ) ,
( C ( t + 1 ) C ( t ) ) / ( Δ t ) = μ C C ( T ) ( μ C A A ( t ) C ( t ) ) / ( a + C ( t ) ) .
Now, assume Δ t : = h > 0 . As such,
A ( t + 1 ) = h r / K · A 2 ( t ) + ( h r + 1 h μ A A d ( t ) ( h μ A C C ( t ) ) / ( a + C ( t ) ) ) A ( t )
A d ( t + 1 ) = ( h μ A A ( t ) + 1 d ) A d ( t ) + ( h μ A C A ( t ) C ( t ) ) / ( a + C ( t ) ) ,
C ( t + 1 ) = ( 1 μ C ( μ C A A ( t ) ) / ( a + C ( t ) ) ) C ( t ) .
From Equation (A5), one can see that A d ( t + 1 ) is linear to A d ( t ) . As such, according to the Forward Euler method, its error is O ( h 2 T ) [22], where T is the duration of the simulation and usually T 1 h so the average error of A d ( t ) is O ( h ) . Therefore, a value α > 0 exists such that for all t, the error in computing A d ( t ) is smaller than α h . Now, assuming the error of C ( t ) is bounded by a value b, so z : = ( h μ A C b ) / ( a + b ) is a constant and final error that is of order of magnitude O ( h μ A C ) if a < < b . Setting these two boundaries back in Equation (A4) results in
A ( t + 1 ) = h r / K · A 2 ( t ) + ( h r + 1 h μ A O ( h ) O ( h ) ) A ( t ) .
Therefore,
A ( t + 1 ) = h r / K · A 2 ( t ) + ( 1 O ( h 2 ) ) A ( t ) .
One can return this approximated form to an ODE form as follows:
d A ( t ) d t = r / K · A 2 ( t ) O ( h ) A ( t ) .
One can solve Equation (A9) analytically by computing its integral and obtain that the error is bounded by a second order of step size O ( h 2 ) . Finally, Equation (A6) would be produce O ( h 2 ) as well. Thus, for the Forward Hilbert method, the overall numerical computation that computes Equations (A1)–(A3) would result in O ( h 4 ) overall. For a desired tolerance v, one should pick a step size h 4 < T v so h < T v 0.25 .

References

  1. Kay, N.E.; Hampel, P.J.; Van Dyke, D.L.; Parikh, S.A. CLL update 2022: A continuing evolution in care. Blood Rev. 2022, 54, 100930. [Google Scholar] [CrossRef] [PubMed]
  2. Bewarder, M.; Stilgenbauer, S.; Thurner, L.; Kaddu-Mulindwa, D. Current Treatment Options in CLL. Cancers 2021, 13, 2468. [Google Scholar] [CrossRef] [PubMed]
  3. Timofeeva, N.; Gandhi, V. Ibrutinib combinations in CLL therapy: Scientific rationale and clinical results. Blood Cancer J. 2021, 11, 1–12. [Google Scholar] [CrossRef] [PubMed]
  4. Thimiri, G.R.; Deepak, B.b.; Cremaschi, A.; Skanland, S.S.; Gade, A.; Schjesvold, F.H.; Tjonnfjord, G.E.; A Munthe, L.; Tasken, K. In-vitro drug sensitivity screening in chronic lymphocytic leukemia (CLL) primary patient samples identifies drug candidates for precision cancer therapy. Blood 2018, 132, 4676. [Google Scholar] [CrossRef]
  5. Lukas, M.; Velten, B.; Sellner, L.; Tomska, K.; Hüellein, J.; Walther, T.; Wagner, L.; Muley, C.; Wu, B.; Oleś, M.; et al. Survey of ex vivo drug combination effects in chronic lymphocytic leukemia reveals synergistic drug effects and genetic dependencies. Leukemia 2020, 34, 2934–2950. [Google Scholar] [CrossRef] [PubMed]
  6. Sharma, S.; Rai, K.R. Chronic lymphocytic leukemia (CLL) treatment: So many choices, such great options. Cancer 2019, 125, 1432–1440. [Google Scholar] [CrossRef] [PubMed]
  7. Bunimovich-Mendrazitsky, S.; Kronik, N.; Vainstein, V. Optimization of Interferon–Alpha and Imatinib Combination Therapy for Chronic Myeloid Leukemia: A Modeling Approach. Adv. Theory Simul. 2019, 2, 1800081. [Google Scholar] [CrossRef]
  8. Jost, F.; Schalk, E.; Rinke, K.; Fischer, T.; Sager, S. Mathematical models for cytarabine-derived myelosuppression in acute myeloid leukaemia. PLoS ONE 2019, 14, e0204540. [Google Scholar] [CrossRef] [PubMed]
  9. Clapp, G.; Levy, D. A review of mathematical models for leukemia and lymphoma. Drug Discov. Today Dis. Model. 2015, 16, 1–6. [Google Scholar] [CrossRef] [PubMed] [Green Version]
  10. Chaudhury, A.; Zhu, X.; Chu, L.; Goliaei, A.; June, C.H.; Kearns, J.D.; Stein, A.M. Chimeric Antigen Receptor T Cell Therapies: A Review of Cellular Kinetic-Pharmacodynamic Modeling Approaches. J. Clin. Pharmacol. 2020, 60, S147–S159. [Google Scholar] [CrossRef] [PubMed]
  11. Rea, T.; Guillari, A.; Sergi, C.; Serra, N. Mathematical models in nursing research. J. Public Health Res. 2020, 9, jphr.2020.1952. [Google Scholar] [CrossRef] [PubMed]
  12. Rodrigues, D.S.; Mancera, P.F.; Carvalho, T.; Gonçalves, L.F. A mathematical model for chemoimmunotherapy of chronic lymphocytic leukemia. Appl. Math. Comput. 2019, 349, 118–133. [Google Scholar] [CrossRef] [Green Version]
  13. Benzekry, S.; Lamont, C.; Beheshti, A.; Tracz, A.; Ebos, J.M.; Hlatky, L.; Hahnfeldt, P. Classical mathematical models for description and prediction of experimental tumor growth. PLoS Comput. Biol. 2014, 10, e1003800. [Google Scholar] [CrossRef] [PubMed] [Green Version]
  14. Guzev, E.; Luboshits, G.; Bunimovich-Mendrazitsky, S.; Firer, M.A. Experimental Validation of a Mathematical Model to Describe the Drug Cytotoxicity of Leukemic Cells. Symmetry 2021, 13, 1760. [Google Scholar] [CrossRef]
  15. Faruqi, A.; Tadi, P. Cytarabine. Available online: http://europepmc.org/books/NBK557680 (accessed on 17 June 2022).
  16. Ganatra, S.; Sharma, A.; Shah, S.; Chaudhry, G.M.; Martin, D.T.; Neilan, T.G.; Mahmood, S.S.; Barac, A.; Groarke, J.D.; Hayek, S.S.; et al. Ibrutinib-associated atrial fibrillation. JACC Clin. Electrophysiol. 2018, 4, 1491–1500. [Google Scholar] [CrossRef] [PubMed]
  17. Komarova, N.L.; Burger, J.A.; Wodarz, D. Evolution of ibrutinib resistance in chronic lymphocytic leukemia (CLL). Proc. Natl. Acad. Sci. USA 2014, 111, 13906–13911. [Google Scholar] [CrossRef] [PubMed] [Green Version]
  18. Zhou, H.; Hu, P.; Yan, X.; Zhang, Y.; Shi, W. Ibrutinib in chronic lymphocytic leukemia: Clinical applications, drug resistance, and prospects. Oncotargets Ther. 2020, 13, 4877. [Google Scholar] [CrossRef] [PubMed]
  19. Aroesty, J.; Lincoln, T.; Shapiro, N.; Boccia, G. Tumor growth and chemotherapy: Mathematical methods, computer simulations, and experimental foundations. Math. Biosci. 1973, 17, 243–300. [Google Scholar] [CrossRef]
  20. Bellman, R. Mathematical Methods in Medicine; World Scientific: Singapore, 1983; Volume 1. [Google Scholar]
  21. Lazebnik, T.; Aaroni, N.; Bunimovich-Mendrazitsky, S. PDE based geometry model for BCG immunotherapy of bladder cancer. Biosystems 2021, 200, 104319. [Google Scholar] [CrossRef] [PubMed]
  22. Byrne, G.D.; Hindmarsh, A.C. Stiff ODE solvers: A review of current and coming attractions. J. Comput. Phys. 1987, 70, 1–62. [Google Scholar] [CrossRef]
Figure 1. Schematic representation of the workflow used in this study. (A) Development of the mathematical model to simulate in vitro effect of a drug on cancer cell viability; (B) performance of experiments; (C) validation of the model by correlation of simulation and experimental results.
Symmetry 14 01269 g001
Figure 2. Numerical simulations of the model Equations (1)–(3) represent the number of A20 cells effected by different concentrations of: (A) Ibr and (B) Cyt. Dashed curves are different concentrations of drug; solid red curves are control, without drug. Initial concentration of A20 mCherry cells, A ( 0 ) = 5 × 10 4 .
Symmetry 14 01269 g002
Figure 3. Comparison between the model simulations (textured bars) and experimental data (fill bars) and inhibition of A20 mCherry cell growth in vitro under the influence of different doses of Ibr (purple bars) and Cyt (green bars) after 72 h culture. Each graph point of experimental data represents the mean +/− standard deviation for three repeat experiments.
Symmetry 14 01269 g003
Figure 4. Numerical simulation of drug synergisism. The simulation of the model (Equations (1)–(3)) represents the number of A20 cells effected by the synergistic effect of Ibr with Cyt. Solid red curve is a control, without drug; dashed purple curve is 3.125 µM of Ibr and 0.195 µM of Cyt; dotted green, 6.25 µM of Ibr and 0.39 µM of Cyt. Initial concentration of A20 mCherry cells, A ( 0 ) = 5 × 10 4 .
Symmetry 14 01269 g004
Table 1. Table of parameters based on experimental results related to the model of Equations (1)–(3).
ParameterPhysical Interpretation (Units)Estimated ValueReference
A ( 0 ) The initial number of A20 [cells/mL] 5 × 10 4 Experimental data
A d ( 0 ) The initial number of dead A20 [cells/mL]2500Experimental data
C ( 0 ) Number of drug [molecules/mL]dose ( μ M) × 6 × 10 11 Experimental data
tTime of cell culture [h]0–72Experimental data
rA20 growth rate [h 1 ]0.07Experimental data
KMaximal tumor cell population [cells/mL] 4 × 10 6 Experimental data
μ A Living cells become dead [h 1 ] 3.7 × 10 8 Simulation
aDrug dose that produces 50% maximum effect [mL] 2 × 10 3 [12]
μ A C Cytotoxicity rate in the presence of drug [h 1 ]see Table A1 and Table A2Simulation
μ C A Deactivation rate of drug due to killing of A20 cells [h 1 ] μ A C × 10 Simulation
μ C Chemical deactivation rate of drug [h 1 ]0.231-Cyt; 0.116-Ibr[12]
dDissolution rate of dead A20 cells [h 1 ]0.017Simulation
Table 2. Comparison of cell growth inhibition (%) between experimental data and numerical simulations.
Concentration of Drug (µM)CytarabineIbrutinib
ExpSimExpSim
50 97.598.1
25 91.591.3
12.5 7483.9
6.2595.294.842.571.8
3.12593.589.829.156.3
1.562588.782.320.340.1
0.788772.518.827.4
0.3985.261.310.814.9
0.19580.549.74.33.7
0.09866.2539
0.04929.529.7
0.02418.922.2
0.01214.516.2
0.0067.711.7
RMSE0.0180.032
MAPE0.1980.412
Table 3. Simulated effect of the synergism.
Concentration of Drugs (µM)Parameter μ AC Number of Cells at 72nd Hour (Cells/mL)Cell Growth Inhibition (%)
0-2,636,9500
Ibr 3.1250.0151,152,34756.3
Cyt 0.1950.0081,326,38649.7
Ibr 3.125 + Cyt 0.1950.023702,33073.4
Ibr 6.250.022743,62071.8
Cyt 0.390.0121,020,50061.3
Ibr 6.25 + Cyt 0.390.034375,76685.7
Publisher’s Note: MDPI stays neutral with regard to jurisdictional claims in published maps and institutional affiliations.

