Article

Identification of Abnormal Vibration Signal of Subway Track Bed Based on Ultra-Weak FBG Sensing Array Combined with Unsupervised Learning Network

1
National Engineering Research Center of Fiber Optic Sensing Technology and Networks, Wuhan University of Technology, Wuhan 430070, China
2
School of Information Engineering, Wuhan University of Technology, Wuhan 430070, China
3
Department of Civil and Environmental Engineering, University of California, Irvine, CA 92697, USA
*
Author to whom correspondence should be addressed.
Symmetry 2022, 14(6), 1100; https://doi.org/10.3390/sym14061100
Submission received: 10 May 2022 / Revised: 21 May 2022 / Accepted: 25 May 2022 / Published: 27 May 2022
(This article belongs to the Topic Artificial Intelligence (AI) Applied in Civil Engineering)
(This article belongs to the Section Engineering and Materials)

Abstract

:
The performance of the passing train and the structural state of the track bed are the concerns regarding the safe operation of subways. Monitoring the vibration response of the track bed structure and identifying abnormal signals within it will help address both of these concerns. Given that it is difficult to collect abnormal samples that are symmetric to those of the normal state of the structure in actual engineering, this paper proposes an unsupervised learning-based methodology for identifying the abnormal signals of the track beds detected by the ultra-weak fiber optic Bragg grating sensing array. For an actual subway tunnel monitoring system, an unsupervised learning network was trained by using a sufficient amount of vibration signals of the track bed collected when trains passed under normal conditions, which was used to quantify the deviations caused by anomalies. An experiment to validate the proposed procedures was designed and implemented according to the obtained normal and abnormal samples. The abnormal vibration samples of the track beds in the experiment came from two parts and were defined as three levels. One part of it stemmed from the vibration responses under the worn wheels of a train detected during system operation. The remaining abnormal samples were simulated by superimposing perturbations in the normal samples. The experimental results demonstrated that the established unsupervised learning network and the selected metric for quantifying error sequences can serve the threshold selection well based on the receiver operating characteristic curve. Moreover, the discussion results of the comparative tests also illustrated that the average results of accuracy and F1-score of the proposed network were at least 11% and 13% higher than those of the comparison networks, respectively.

1. Introduction

Generally speaking, in-service engineering structures are always in two symmetrical operating states, normal and abnormal. Although the probability of occurrence of the structural abnormal state is relatively low, tracking and monitoring the service status of subway track beds before catastrophic accidents is of great significance to ensure the safe operation of trains. The traditional inspection regime is usually labor-intensive and can be significantly expensive for rail operation management [1]. Although various types of rail inspection vehicles integrated with ultrasonic methods [2], eddy current [3], infrared thermography [4], laser scanning [5], and other non-destructive testing equipment have improved the efficiency of inspection, they still have difficulty meeting the frequent inspection needs of the entire subway line. The non-contact monitoring method based on machine vision combined with diverse deep learning models has improved the intelligence of the detection of track bed issues to a certain extent [6,7]. However, this approach needs to rely on sufficient samples to perform supervised learning-based training. The performance usually only meets the local detection, which is susceptible to the interior environment of the subway tunnel.
By deploying the ultra-weak fiber optic Bragg grating (FBG) array cable along the track bed in a subway tunnel, the structural vibration response caused by passing trains through the monitoring area can be gleaned. Given the relationship between the vibration response and the structural state, Li et al. [8] reported that the similarity of the vibration responses detected by the ultra-weak FBG array cable can be utilized to evaluate the structural state of the subway track bed. Gan et al. [9] presented that ground intrusion events above subway lines can be located and identified based on distributed vibration responses of ultra-weak FBG sensing arrays. Moreover, the research on train tracking and personnel intrusion identification based on distributed vibration response also illustrated that the ultra-weak FBG sensing array can effectively collect the vibration of the subway track bed [10]. Thus, despite the asymmetry existing in the data amount collected for the abnormal and normal states, it is possible to discover the security risks of the track bed or the passing train by analyzing the abnormal vibration signal of the track bed structure monitored by the ultra-weak FBG sensing array.
In the research area of abnormal signal detection, Tao et al. [11] completed the fault detection of the wind turbine by using the gray correlation algorithm combined with the support vector regression model. Qiu et al. [12] proposed that abnormal patterns of vibration response of a real long-span cable-stayed bridge can be distinguished based on statistical feature dimensionality reduction, forward difference data augmentation, and random forest. Li et al. [13] designed a deep convolutional neural network to classify and identify simulated damage signals for a scaled-down bridge model. Tang et al. [14] proposed a data anomaly detection method based on a convolutional neural network combined with a computer vision technique. Li et al. [15] discussed the degradation failure detection for the mechanical equipment in a data-driven manner through deep neural networks. Abid et al. [16] proposed a deep-SincNet-based learning network that was able to automatically learn fault features from the motor current. However, the above-mentioned studies primarily focus on the field of supervised learning, whose performance depends heavily on the support of adequate and balanced samples with labels. Given the complexity of accumulating a certain scale of anomalous signals with labels in practical engineering, current supervised learning-based methods are often difficult to transplant and apply directly, especially when the types of training samples are extremely asymmetric.
In the study of anomaly detection based on unsupervised learning, Hautamaki et al. [17] employed the idea of the K-neighbor algorithm and used the average distance of each sample to its K nearest sample points as a reference to discriminate abnormal samples. He et al. [18] performed cluster-based anomaly detection with predefined outliers. Li et al. [19] conducted anomaly detection for multivariate time series based on clustering through complex hyperparameter setting. Saari et al. [20] adopted the one-class support vector machine (SVM) to model the density distribution of samples to determine whether the data was abnormal. Zong et al. [21] completed the anomaly data detection based on a deep autoencoding Gaussian mixture model (DAGMM), which was verified by four public benchmark datasets. Purohit et al. [22] further extended the DAGMM method to anomaly detection in acoustic signals. Pei et al. [23] proposed a method for network traffic anomaly detection through self-coding of long short-term memory (LSTM) networks. Malhotra et al. [24] revealed that the LSTM-based encode–decode can detect the abnormal data of the sensor. Although these unsupervised learning-based methods have demonstrated their respective effectiveness in specific scenarios, there are few research cases involving high-dimensional time series. Hence, the existing methods reviewed may not be suitable for capturing the time dependence of high-dimensional vibration signals of subway track beds.
To address the previous research deficiencies, the motivation of this paper is to propose a method for identifying abnormal vibration signals of track beds that does not rely on the idea of supervised learning. During the implementation of the method, an unsupervised learning network used to learn the features of normal vibration signals of subway track bed structures in terms of the time-series correlation of vibration sequences was established. Based on the designed network, it is possible to quantify the results of the predicted error sequences due to abnormal input signals. Then, the identification of abnormal vibration responses of track bed structures can be performed based on the appropriate threshold derived from the quantification results. The experimental results of identifying abnormal signals based on the proposed procedure in an actual subway were reported. The procedure for identifying anomalous vibration sequences detected by the ultra-weak FBG array makes up the second part of this paper, followed by the experimental details of the design and arrangement used to validate the proposed method. Finally, the effectiveness of identifying the target signals is assessed based on the accuracy and F1-score. Furthermore, the performance superiority of the selected indicator used for quantifying prediction error sequences and the proposed unsupervised learning network are discussed through comparative tests.

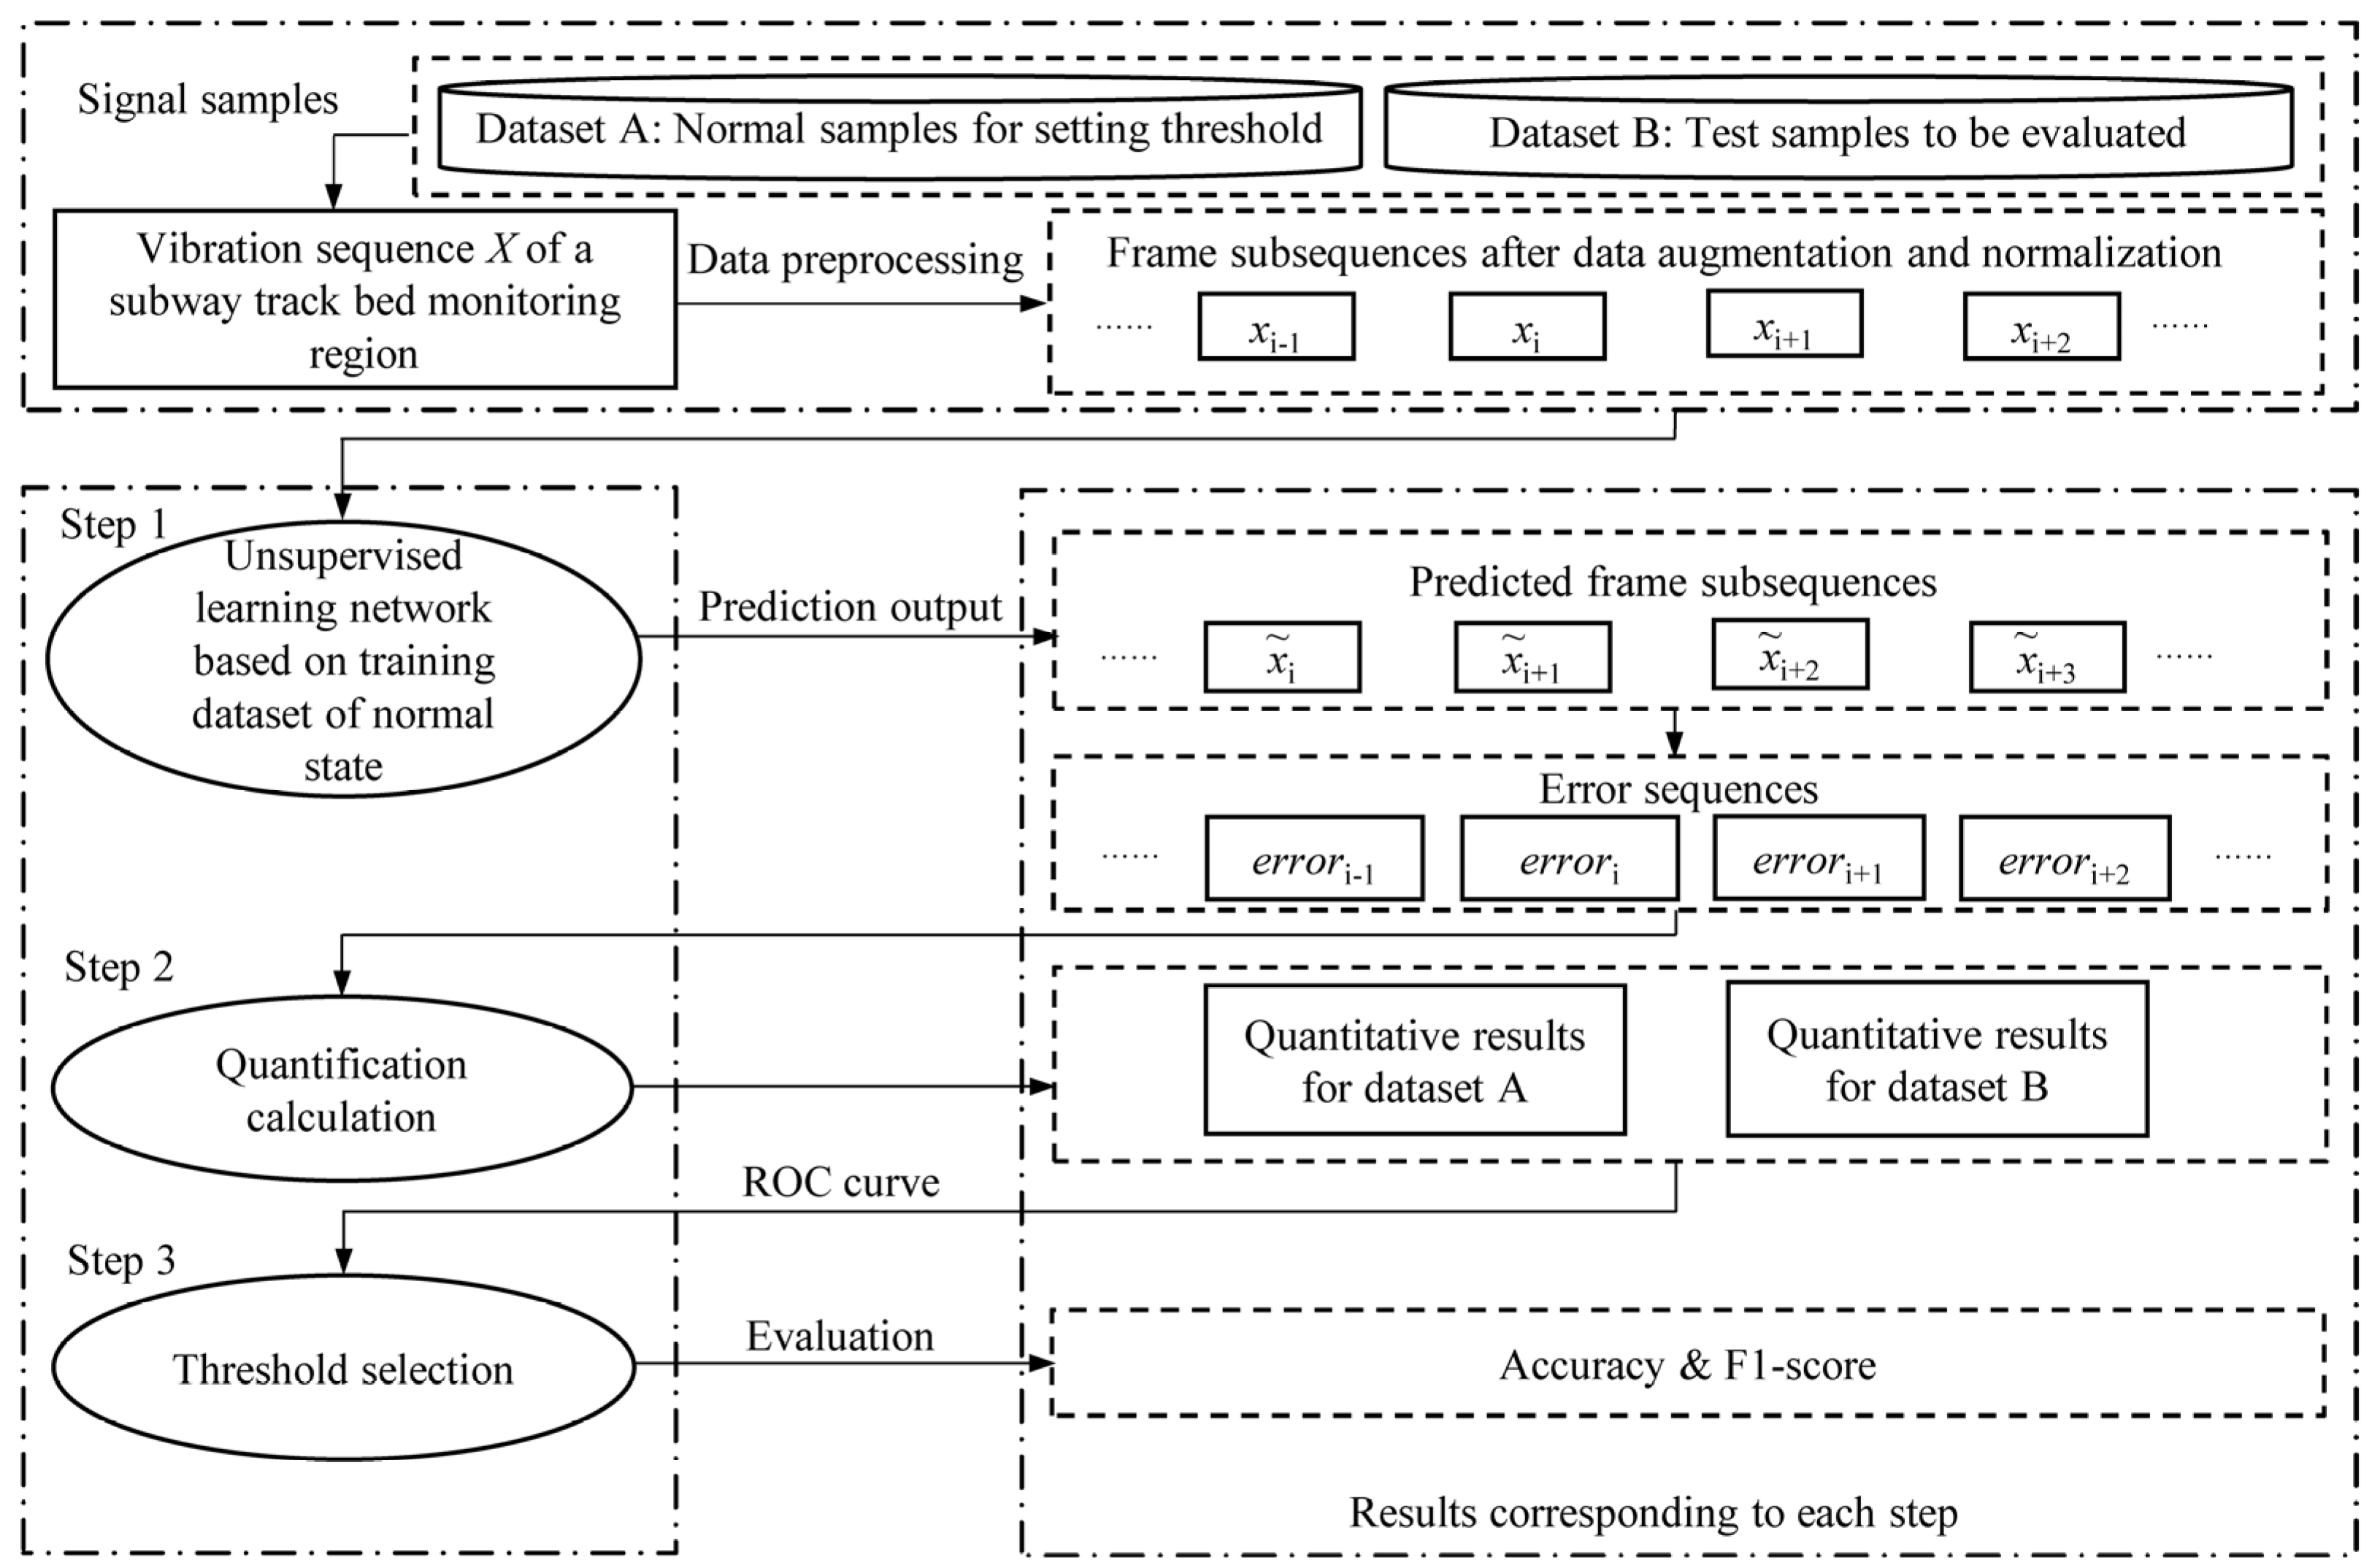
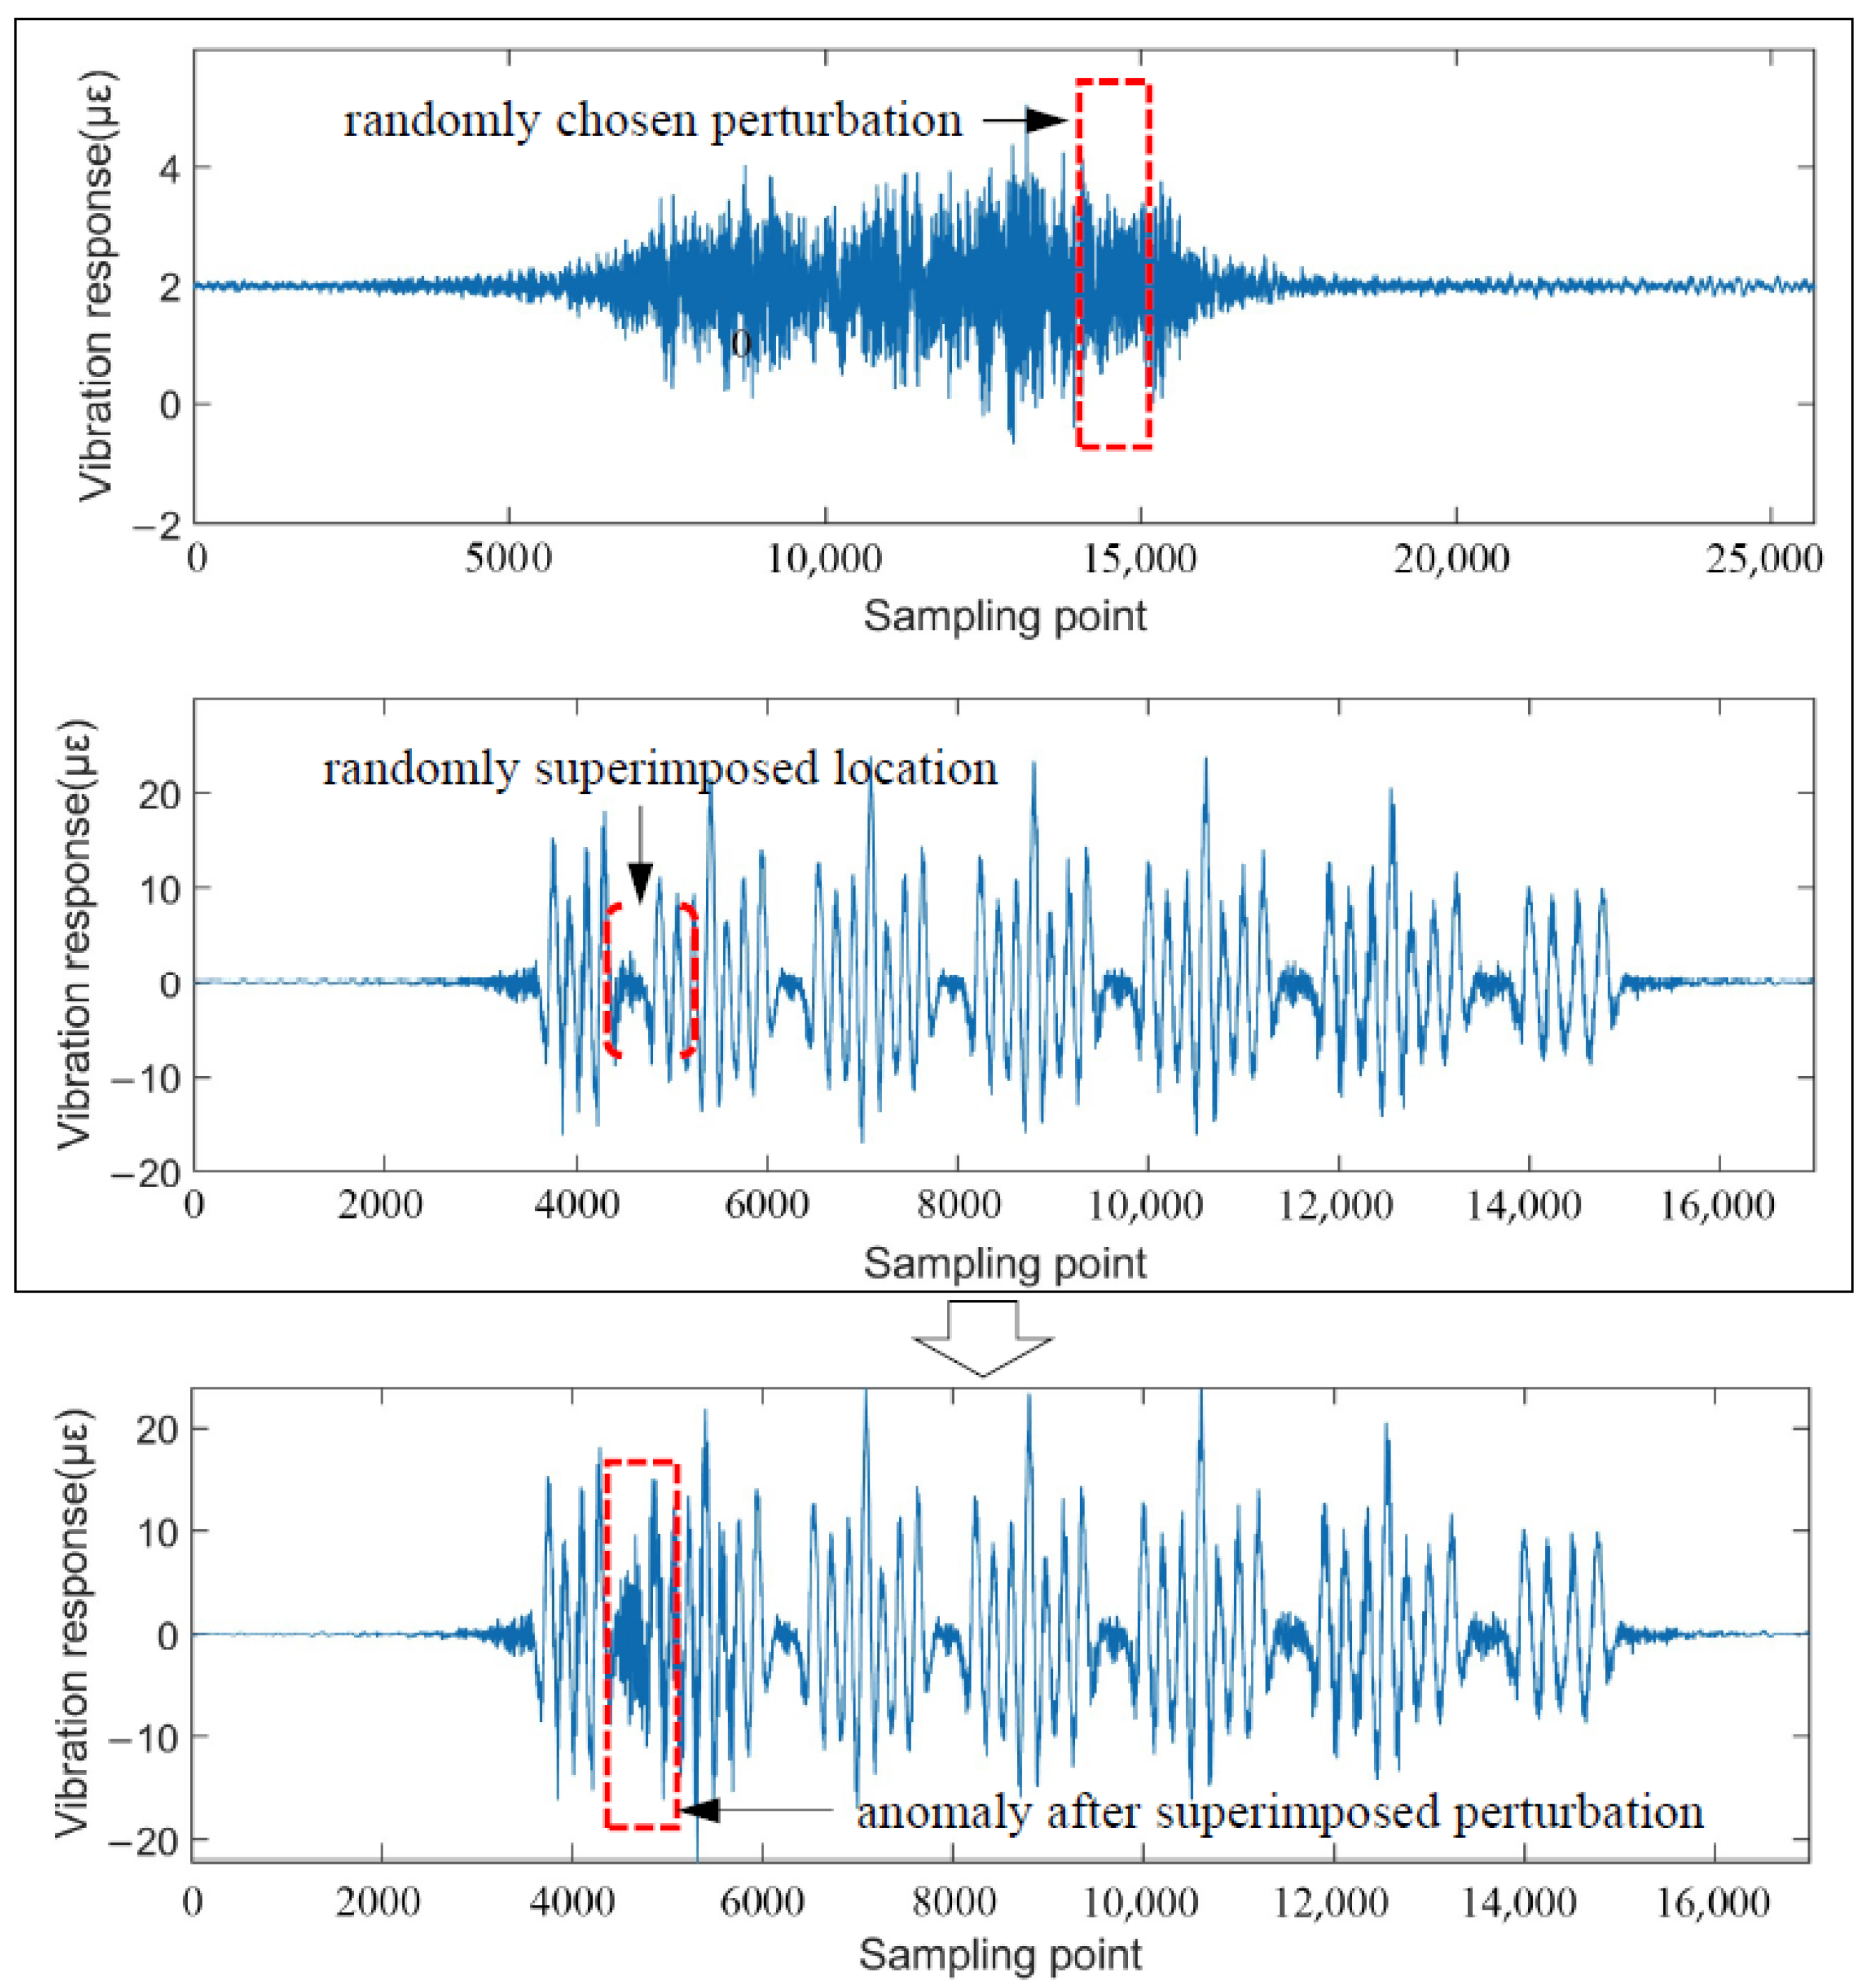
2. Procedure for Abnormal Signal Identification

As shown in Figure 1, the proposed procedure for abnormal signal identification primarily includes three steps: unsupervised learning network establishment based on a training dataset of the normal state of the track bed, calculation quantification for prediction errors, and the selection of a threshold for identifying anomalies. The premise of the proposed procedure is that a large number of track bed vibration signals can be collected when passing trains under normal conditions. Under this premise, an unsupervised learning network with satisfactory accuracy can be established for subsequent error calculation and quantification. As well as that, it is easy to retain enough normal samples to participate in setting the threshold for identifying anomalies.
Once the unsupervised learning network is established, the identification procedure first requires data preprocessing on the retained normal dataset A and dataset B to be evaluated. Each vibration sample X from dataset A or B will in turn undergo data augmentation and normalization before being put into the unsupervised learning network. Data augmentation is performed by directly dividing the original input signal into equal subsequences. To eliminate the amplitude differences in the subsequences, each input from data augmentation is normalized to a range of −1–1. In the first step, the predicted frame x ˜ i + 1 of the frame x i is obtained through the established unsupervised learning network, where x i is a certain frame subsequence preprocessed by data augmentation and normalization. Then, the prediction e r r o r i + 1 for each sampling frame subsequence can be generated by Equation (1) from the result of each sampling point of the subsequence.
e r r o r i + 1 = j = 1 n ( x i + 1 j x ˜ i + 1 j ) 2
where n represents the sampling length of the frame subsequence. Specifically, the processing details of the subway track bed vibration signal with time series characteristics are shown in Figure 2. For any input sequence, the main vibration characteristics caused by the action of the train axle in each sample are retained and the sampling length of the vibration response is set to match the multiple of the frame_length. Then the input sequence is divided into subsequences of length frame_length. The first frame_length is taken as the initial input sequence input_seq1. Next, a length of frame_length slides to construct a new input sequence input_seq2. Here, input_seq2 is also regarded as the prediction target out_seq1 of input_seq1. Based on Equation (1), the divergence between the prediction result out_seq1 of input_seq1 and input_seq2 is the prediction error of the current frame. By repeating the above process, the error of each frame in any input sequence can be obtained.
To quantify the predicted error sequence is the idea of the second step. Here, moving average processing is first used to reduce the unstable interferences in the predicted error sequence. Then the maximum is taken in the moving average result to represent the error sequence. In the last step, the quantitative results of datasets A and B derived from the second step participate in setting the threshold and then the threshold is utilized to judge whether the sample in dataset B is abnormal. To ensure the credibility of the threshold-based judgment, the receiver operating characteristic (ROC) curve is adopted to search the candidate threshold. That is, the candidate threshold should satisfy the conditions that make false positive rate (FPR) zero and true positive rate (TPR) maximum. The rationale for determining a reasonable threshold from the ROC curve can be found in [25].

3. Design and Arrangement of the Experiment

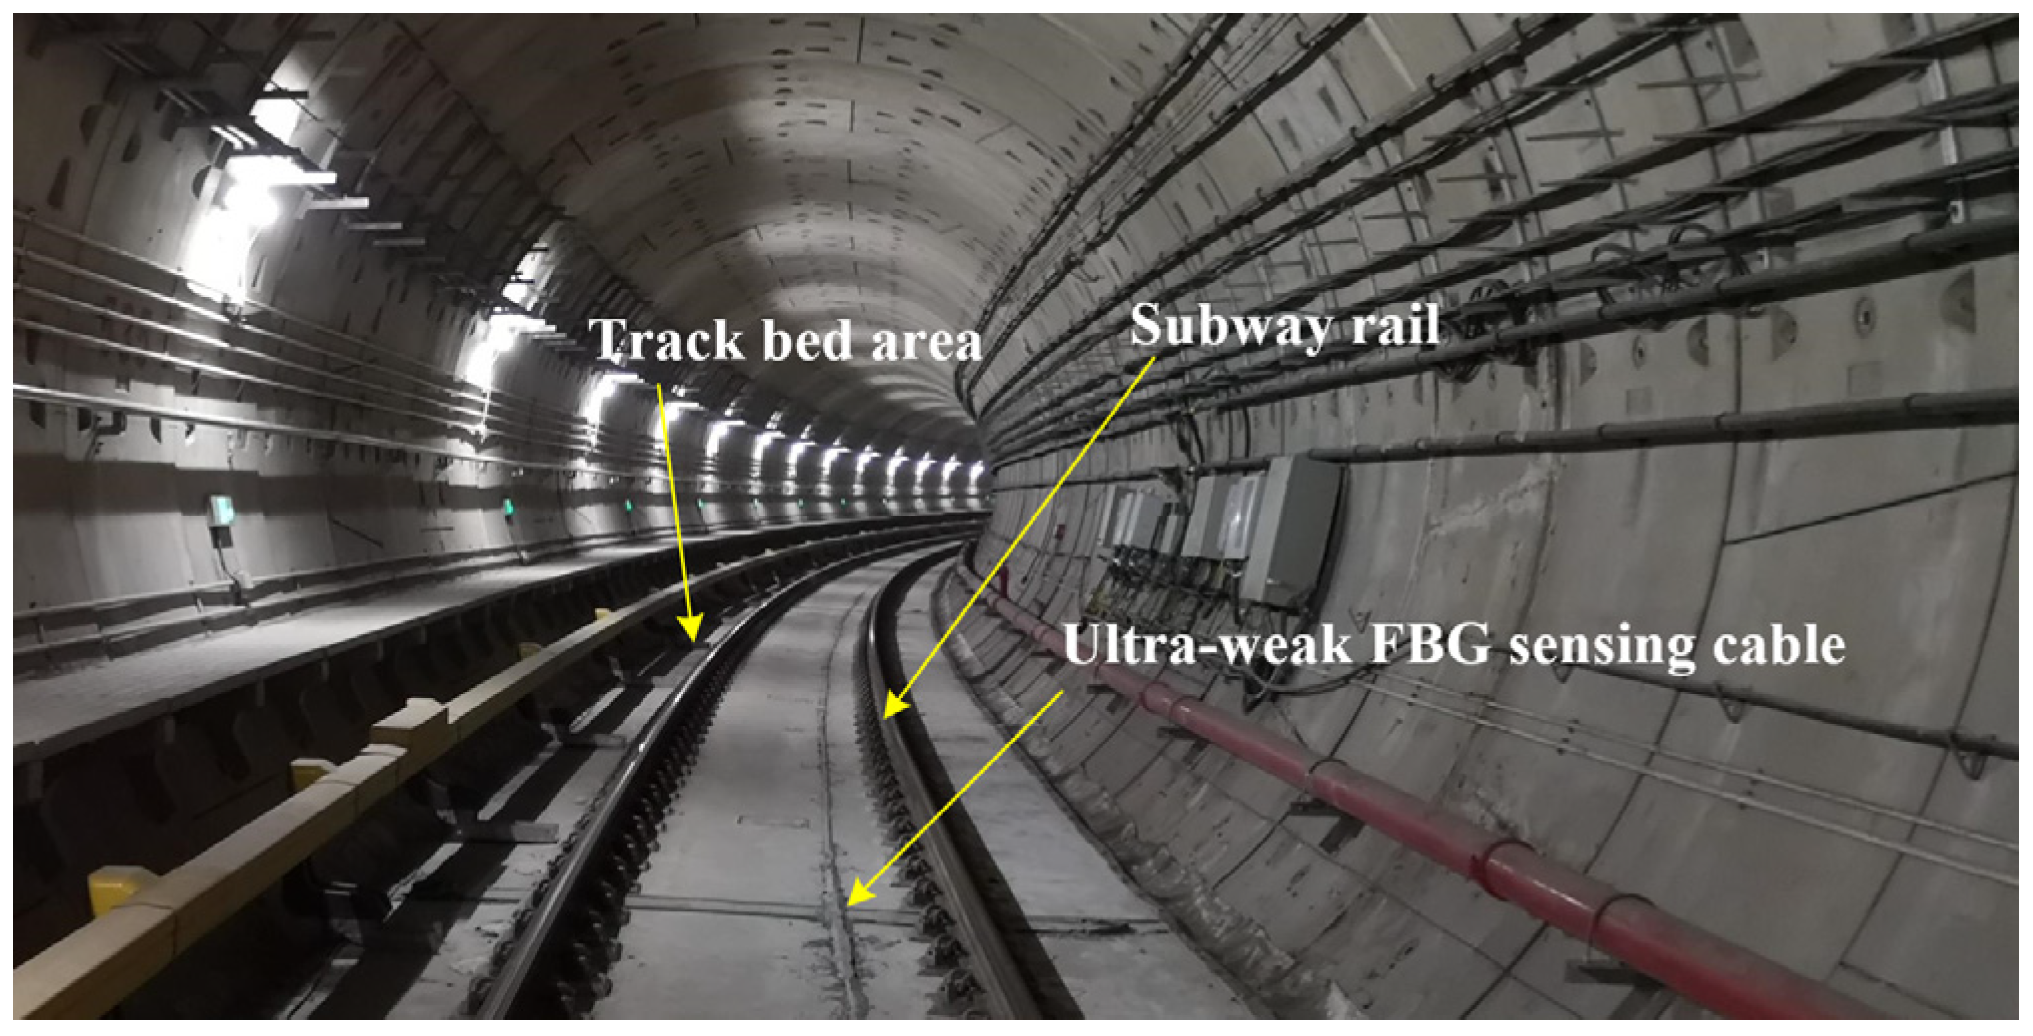
3.1. Vibration Signal Acquisition of Subway Track Bed

During the subway operation, there are many opportunities to obtain the track bed vibration signal of the normal state. Instead, it is hard to capture anomaly vibration samples caused by structural deterioration of the track bed or the failure of the train wheel, if there are no suitable tracking ways. As shown in Figure 3, an ultra-weak FBG sensing cable was fixed along the track bed in an actual subway tunnel to collect the structural vibration response caused by passing trains. Three underground stations were covered along the monitoring area of the subway line, with a total length of nearly three kilometers. According to the spatial resolution of the probes in the sensing optic fiber, more than 500 consecutive regions monitored along the track bed can feedback the structural vibration response based on the interrogated address of the light interference [26]. When a train passed, the structural vibration response triggered in each monitoring area was collected at a 1 kHz sampling rate. The collected data was transmitted to the remote monitoring center for processing by the demodulator and server.
Based on the continuous running of the monitoring system described above, a train with operation risk due to wheel wear was identified. Compared to the normal state, a set of worn wheels in the first compartment resulted in changes in vibration signals of track beds when the train passed. As shown in Figure 4, three monitoring regions are randomly selected to depict the normal and abnormal vibration signals of the track beds. The left part of Figure 4 shows the vibration responses of the track beds in the three selected monitoring regions as the train without safety hazards passed through the subway line. The abnormal vibration signals corresponding to the same three monitoring regions when subjected to the action of the train with worn wheels are revealed in the right part of Figure 4. As can be seen from Figure 4, there are similarities between the normal vibration signals in different monitoring regions, which have been pointed out in [8]. As well as that, the abnormal signals at different locations exhibit some common features. The occurrence position of the abnormal signal in the overall response to the vibration of the track bed excited by the train is closely related to the compartment where the worn wheels are located. In addition, the duration of the abnormal disturbances is almost the same, accounting for about 20% of the total length of the track bed vibration response sequence caused by the passing train with worn wheels.
In addition to the above-mentioned abnormal vibration signals of the track bed structure caused by worn wheels, to obtain more abnormal signal samples, this paper considers adding perturbation to the actual normal vibration signals to simulate abnormal signal samples. The track bed vibration signals at the time of the ground intrusion event detected by the ultra-weak FBG sensing array were chosen as the source signal for adding perturbation. Specifically, the vibration response of the track bed structure under excavator ground intrusion was adopted to complement the anomaly dataset for the following experiment. The details of the vibration response of the selected real cases can be found in [9]. In the specific implementation, as shown in Figure 5, the sub-sequences of the adding perturbation are randomly selected from the source signal caused by the ground intrusion. The extracted sub-sequences are then randomly superimposed somewhere in the normal vibration samples in a certain proportion. Here, in addition to taking the proportion of anomalous perturbations observed in Figure 4 as a reference, the simulated anomaly proportion also takes into account fluctuations of 10% above and below 20%.

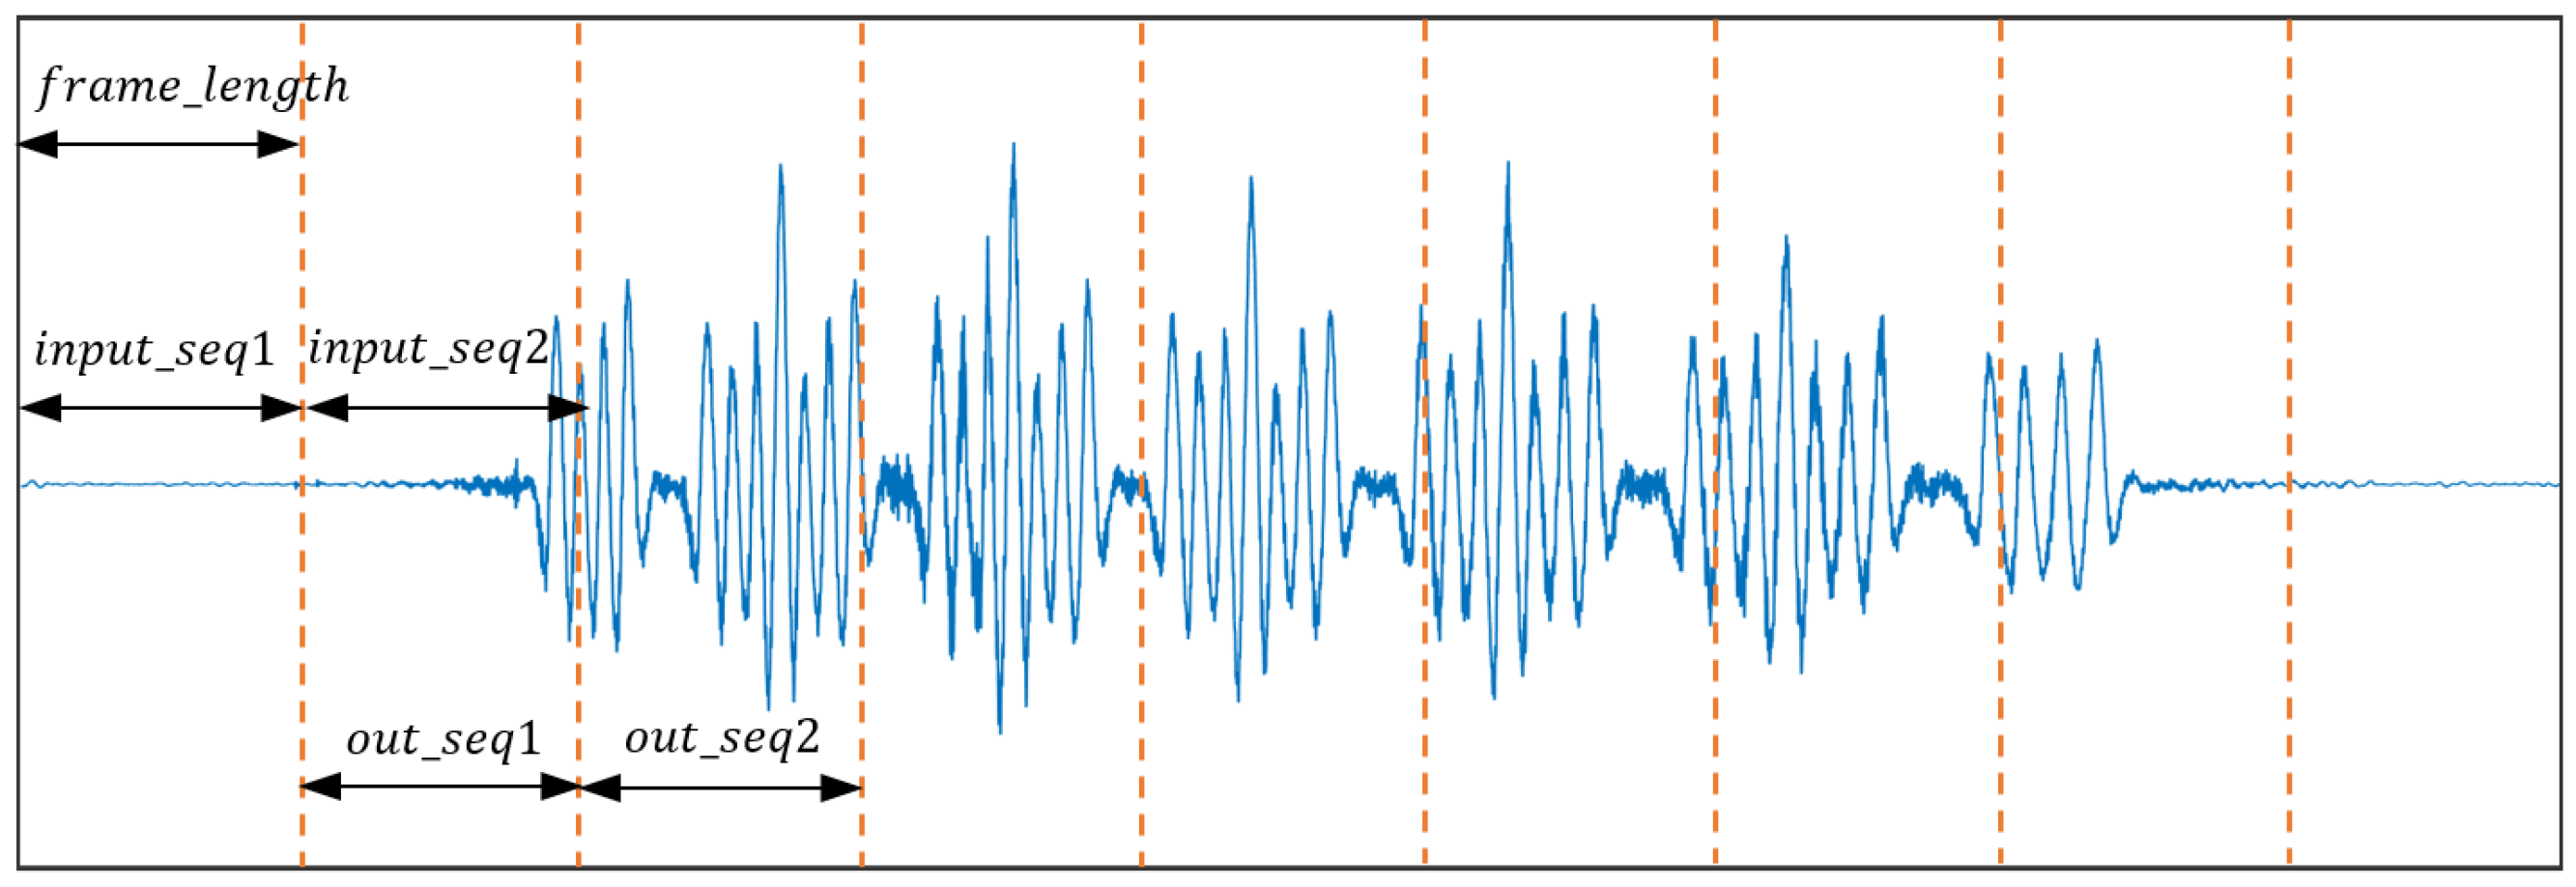
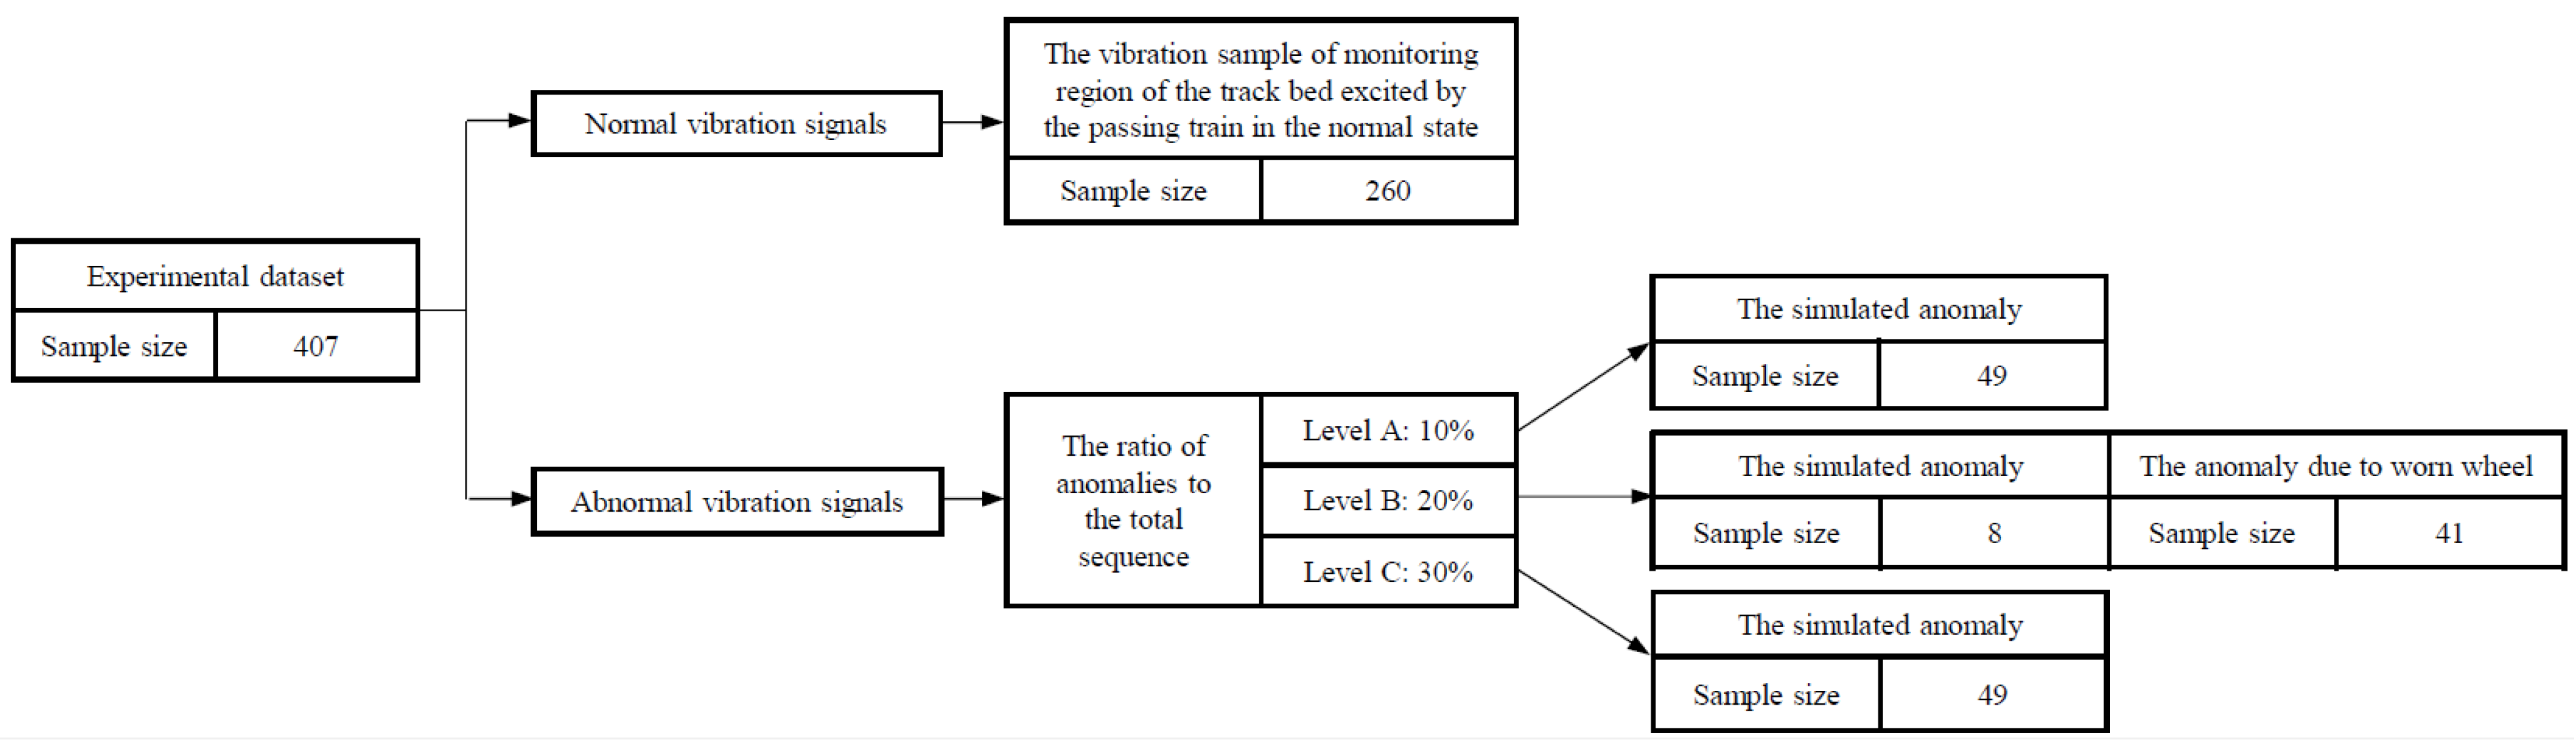
3.2. Composition and Division of the Experimental Dataset

Based on the above vibration signal acquisition strategy, the composition and division of the raw experimental dataset are shown in Figure 6. The dataset was derived from the operation monitoring system and the previous field test results, both measured by the ultra-weak FBG sensing array. The vibration signal samples of the track bed in normal and abnormal states are 260 and 147, respectively. For the abnormal signal samples, anomalies consist of three levels according to the proportion of superimposed disturbances. Here, taking 147 normal vibration signals as benchmarks that are different from the normal samples in Figure 6, simulated anomalies of different levels were constructed. Moreover, maintaining the data balance among the three-level abnormal samples to reduce the effect of the asymmetry of the sample size on the training effect was considered.
The raw normal vibration signals were divided into two parts to perform training and tests based on the commonly used ratio [27] of 8:2. Here, the training set was used to train the proposed unsupervised learning network, and the split test set of normal samples was used to participate in identifying whether the no-label signals are abnormal, that is, to assess the recognition effect of the proposed method on abnormal vibration signals. Considering the signal sampling rate and the current configuration of the experimental hardware environment that was composed of a graphics processing unit (GPU) core (GTX 1080 Ti) with 12 2.20 GHz processors (Intel Xeon E5-2650 v4), the frame_length was set to 500 to generate sub-sequences and to perform the model error prediction. Although the frame_length remains equal, there were duration differences in the raw vibration response of each track bed area due to the effects of train speed and weight. Therefore, the three-level anomaly dataset with the same original sample size in Figure 6 had different enhanced scales after being divided according to the consistent frame_length. After data augmentation [28] by dividing the original sample into equal sub-sequences, the detailed scales of the training set and test set are given in Table 1.

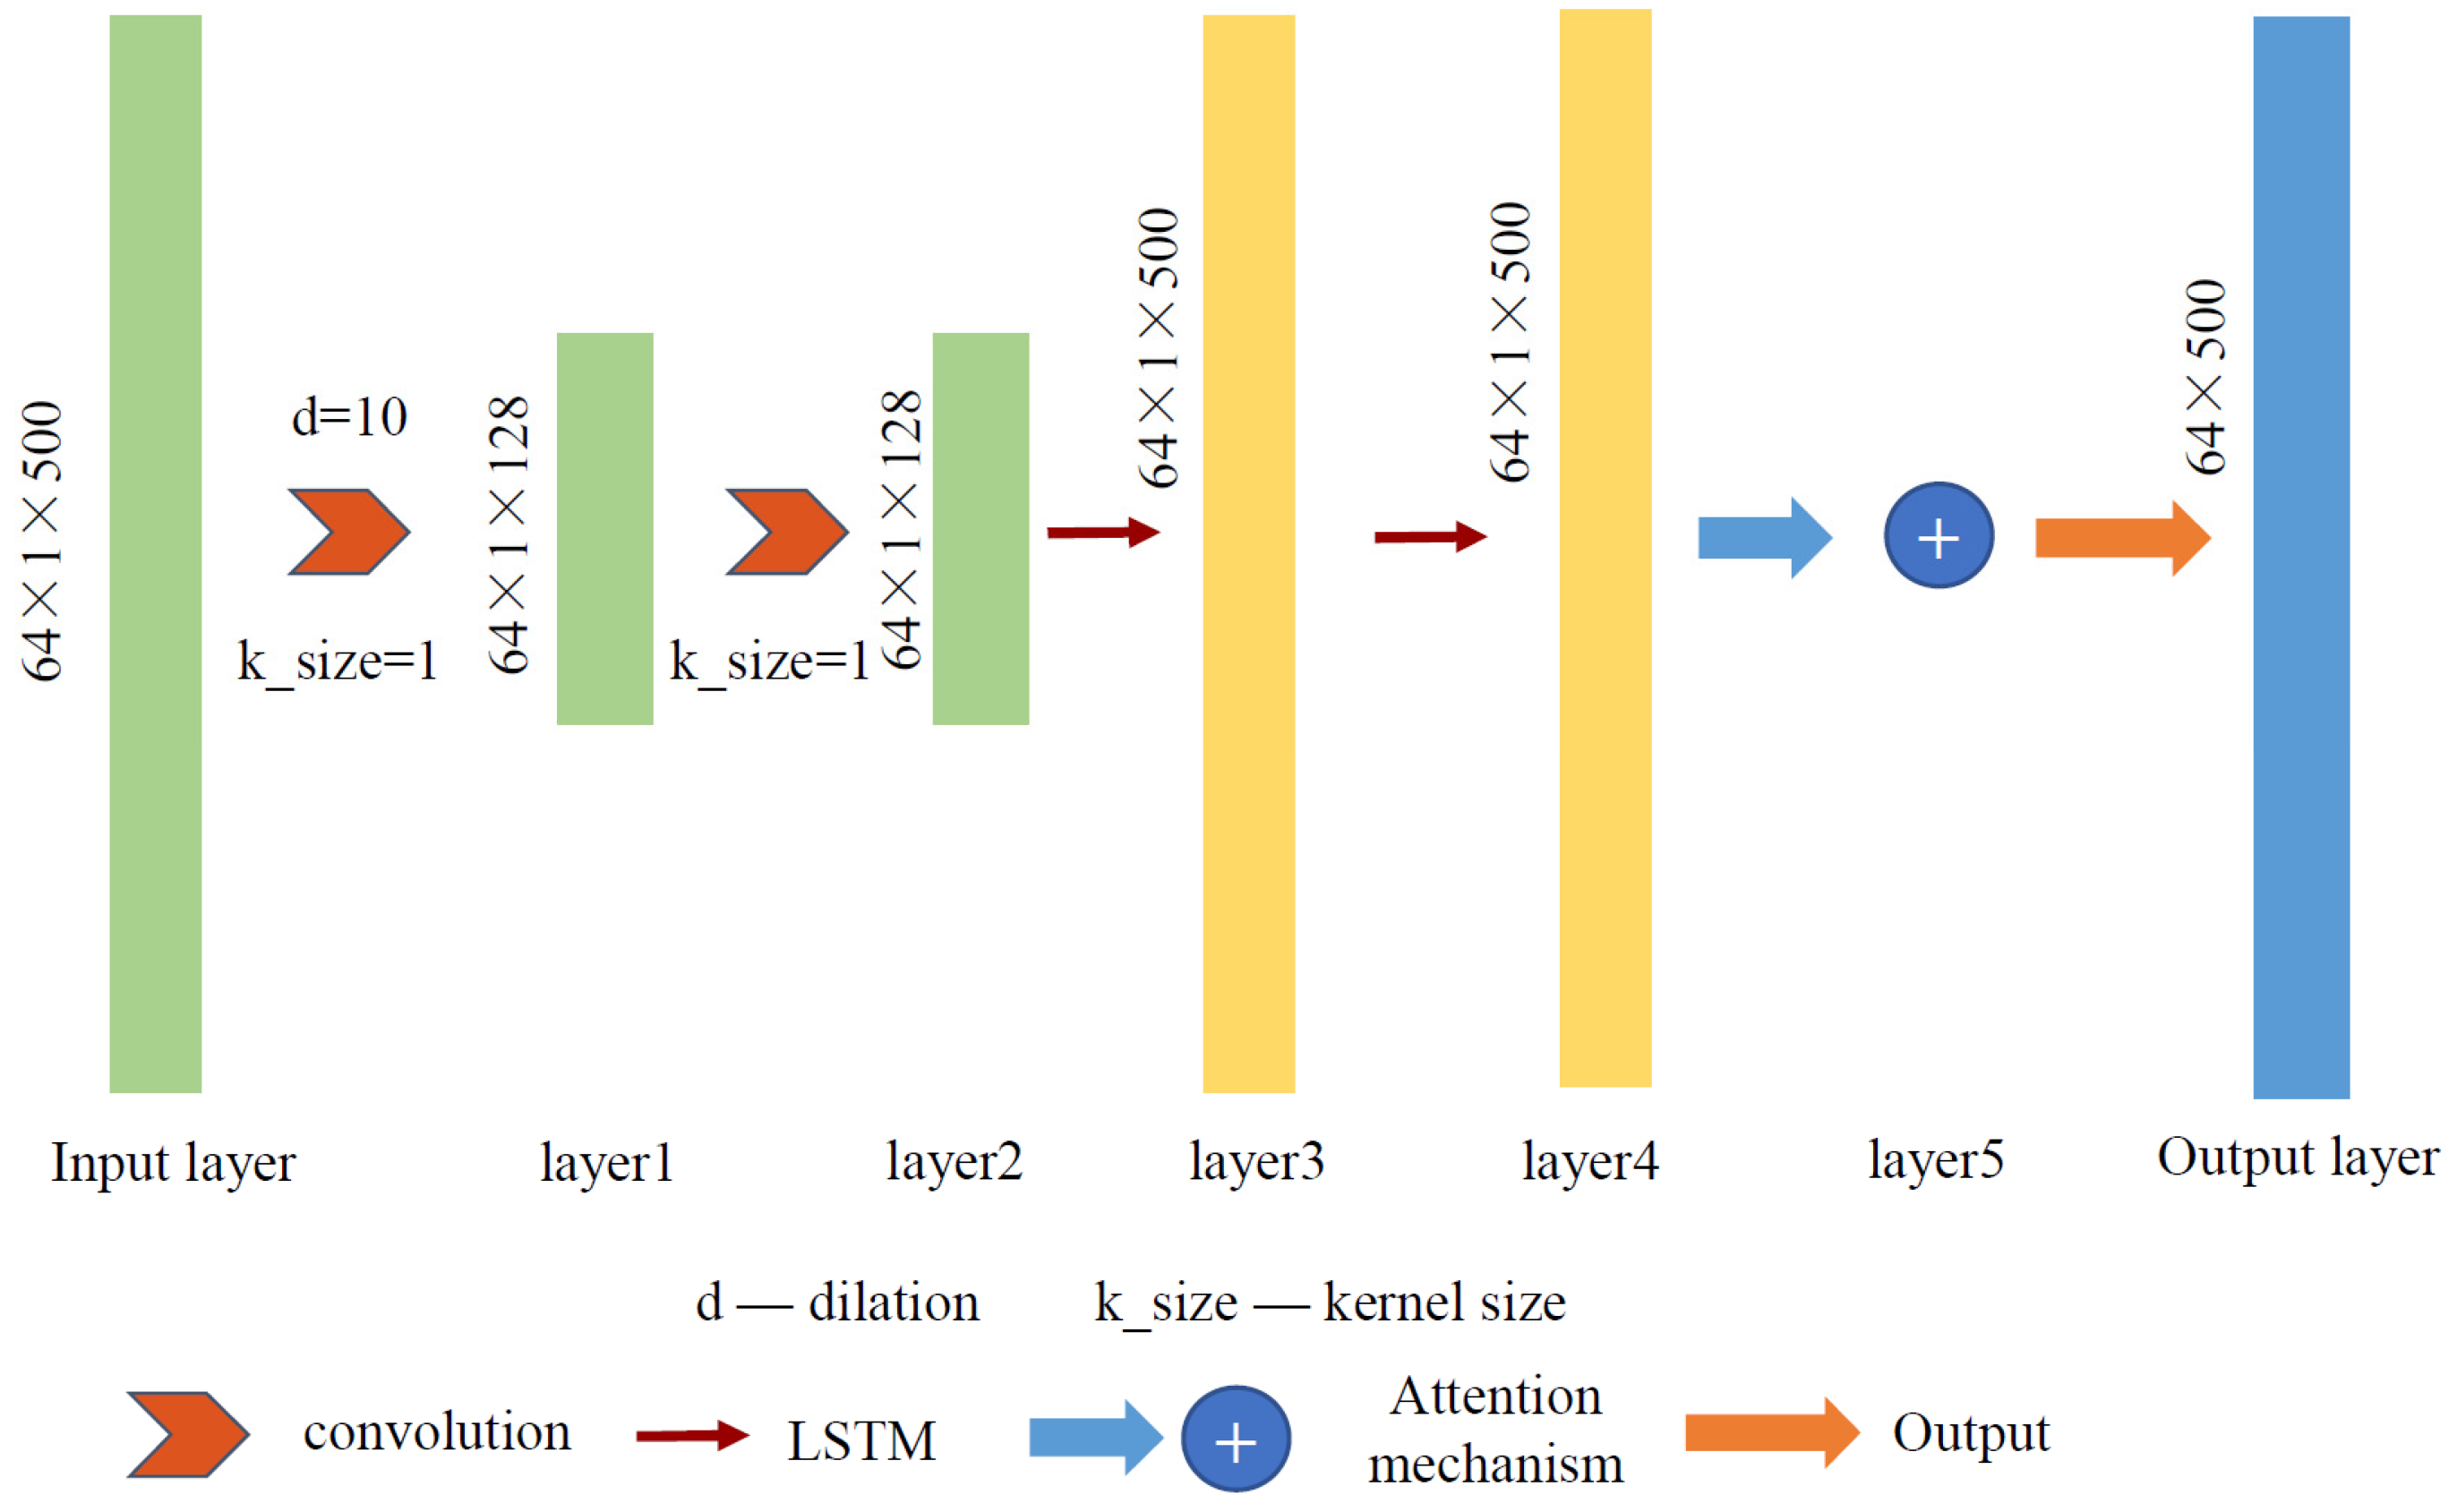
3.3. Establishment of the Unsupervised Learning Network

Based on the study in [29] and the current experimental hardware environment, as shown in Figure 7, an unsupervised network based on CNN and LSTM and considering the attention mechanism (CNN-LSTM-AM) was constructed to obtain the error sequence result under step two in Figure 1. Here, the training set of 6741 normal samples as defined in Table 1 was used to train the CNN-LSTM-AM network. The dimension of the network input is determined by the length of the subsequence of frame_length 500 after data augmentation and the batch size was set as 64. The goal of network training was to ensure that the prediction error exhibited a rather weak fluctuation, that is, to ensure that the difference between the predicted sequence and the input normal sample was small. After repeated testing and parameter tuning based on grid searching [30], the established network consisted of two one-dimensional convolutional layers, two LSTM layers, and one attention mechanism layer, in which each convolutional layer contained 128 convolution kernels, and each LSTM layer contained 500 unit cells. The CNN and LSTM layers were used to obtain the local spatial features and time-series correlations of the vibration signals of the track bed under normal conditions, respectively. The kernel size of each CNN layer was 1 and a dilated convolution operation with a dilation factor of 10 was used to make the first convolutional layer have a stronger receptive field of the input sequence. The attention mechanism layer automatically learned the importance of each hidden layer. To meet the training objective, RMSprop [31] was selected as the optimization algorithm of the network.

4. Results and Discussion

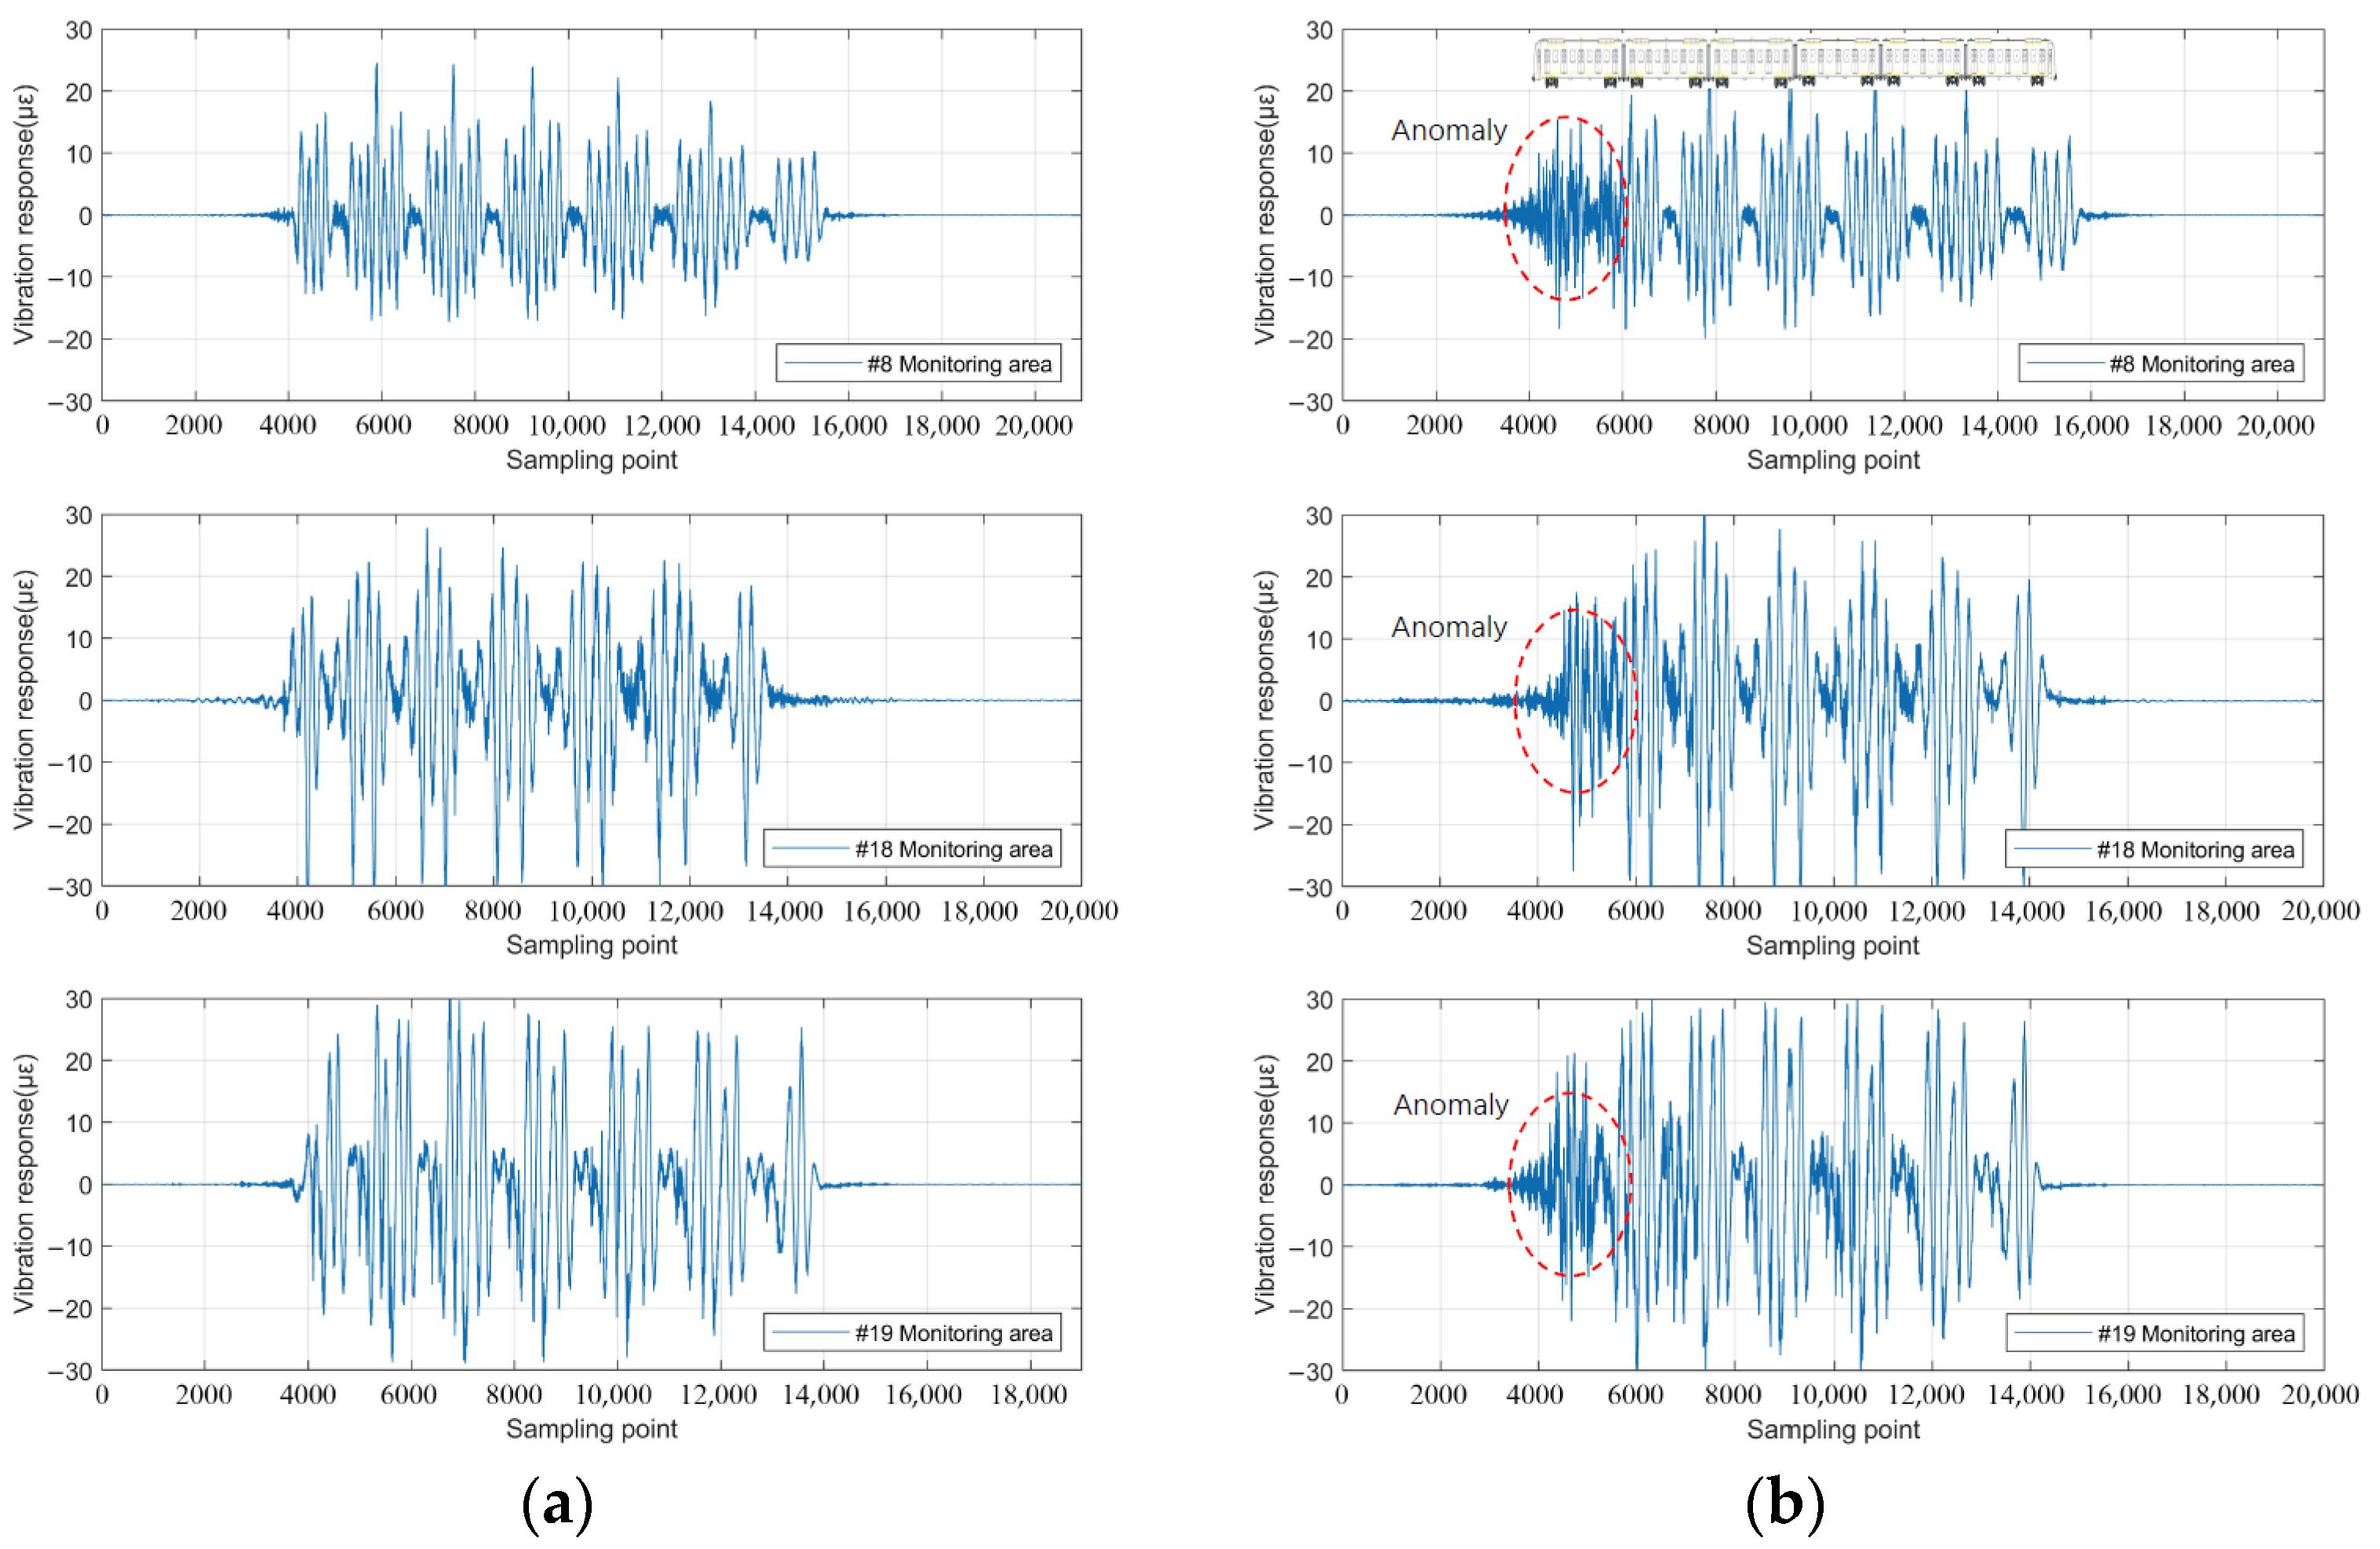
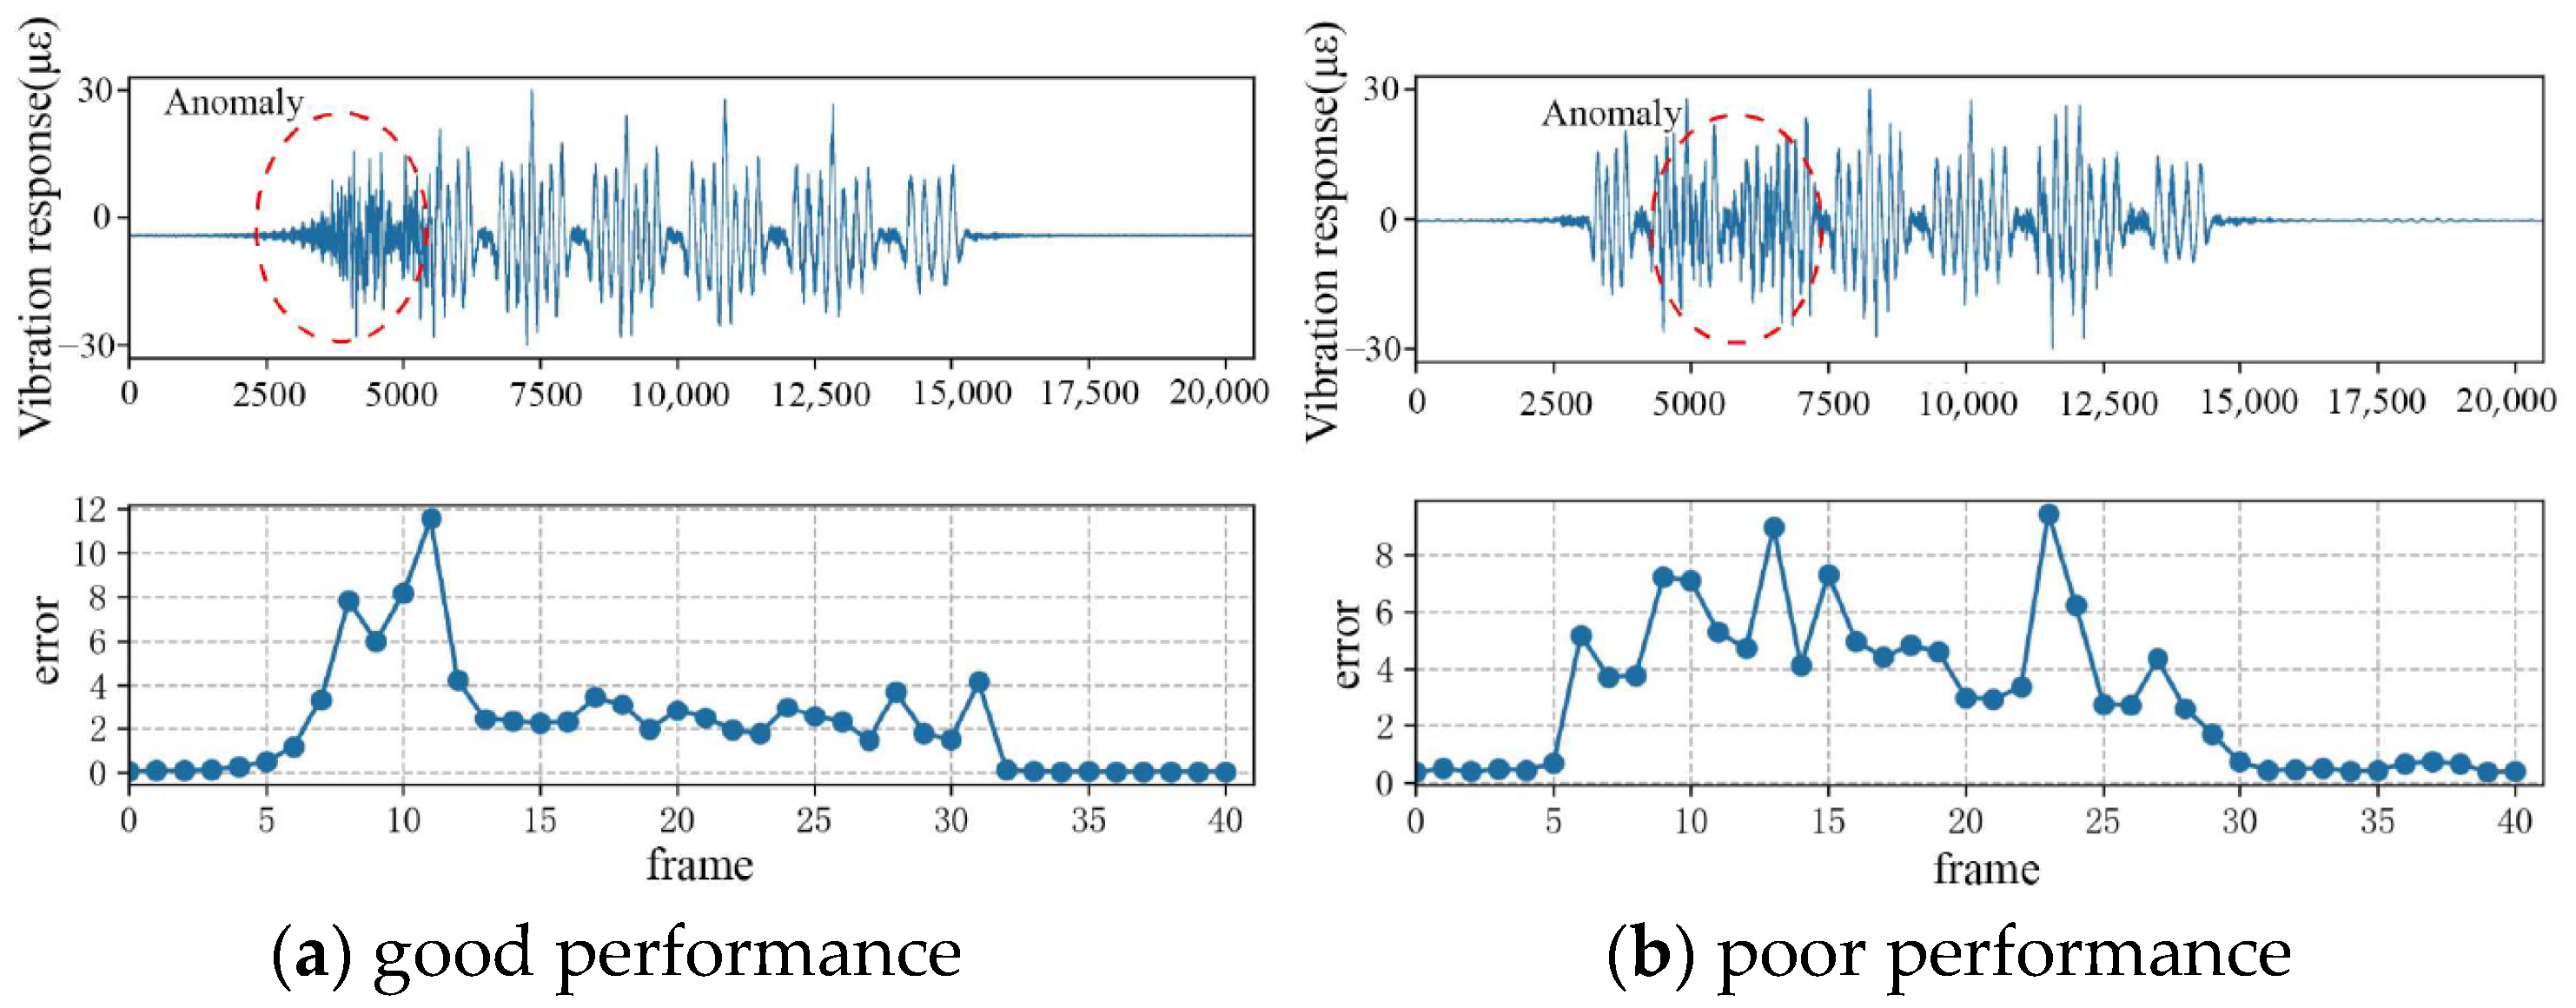
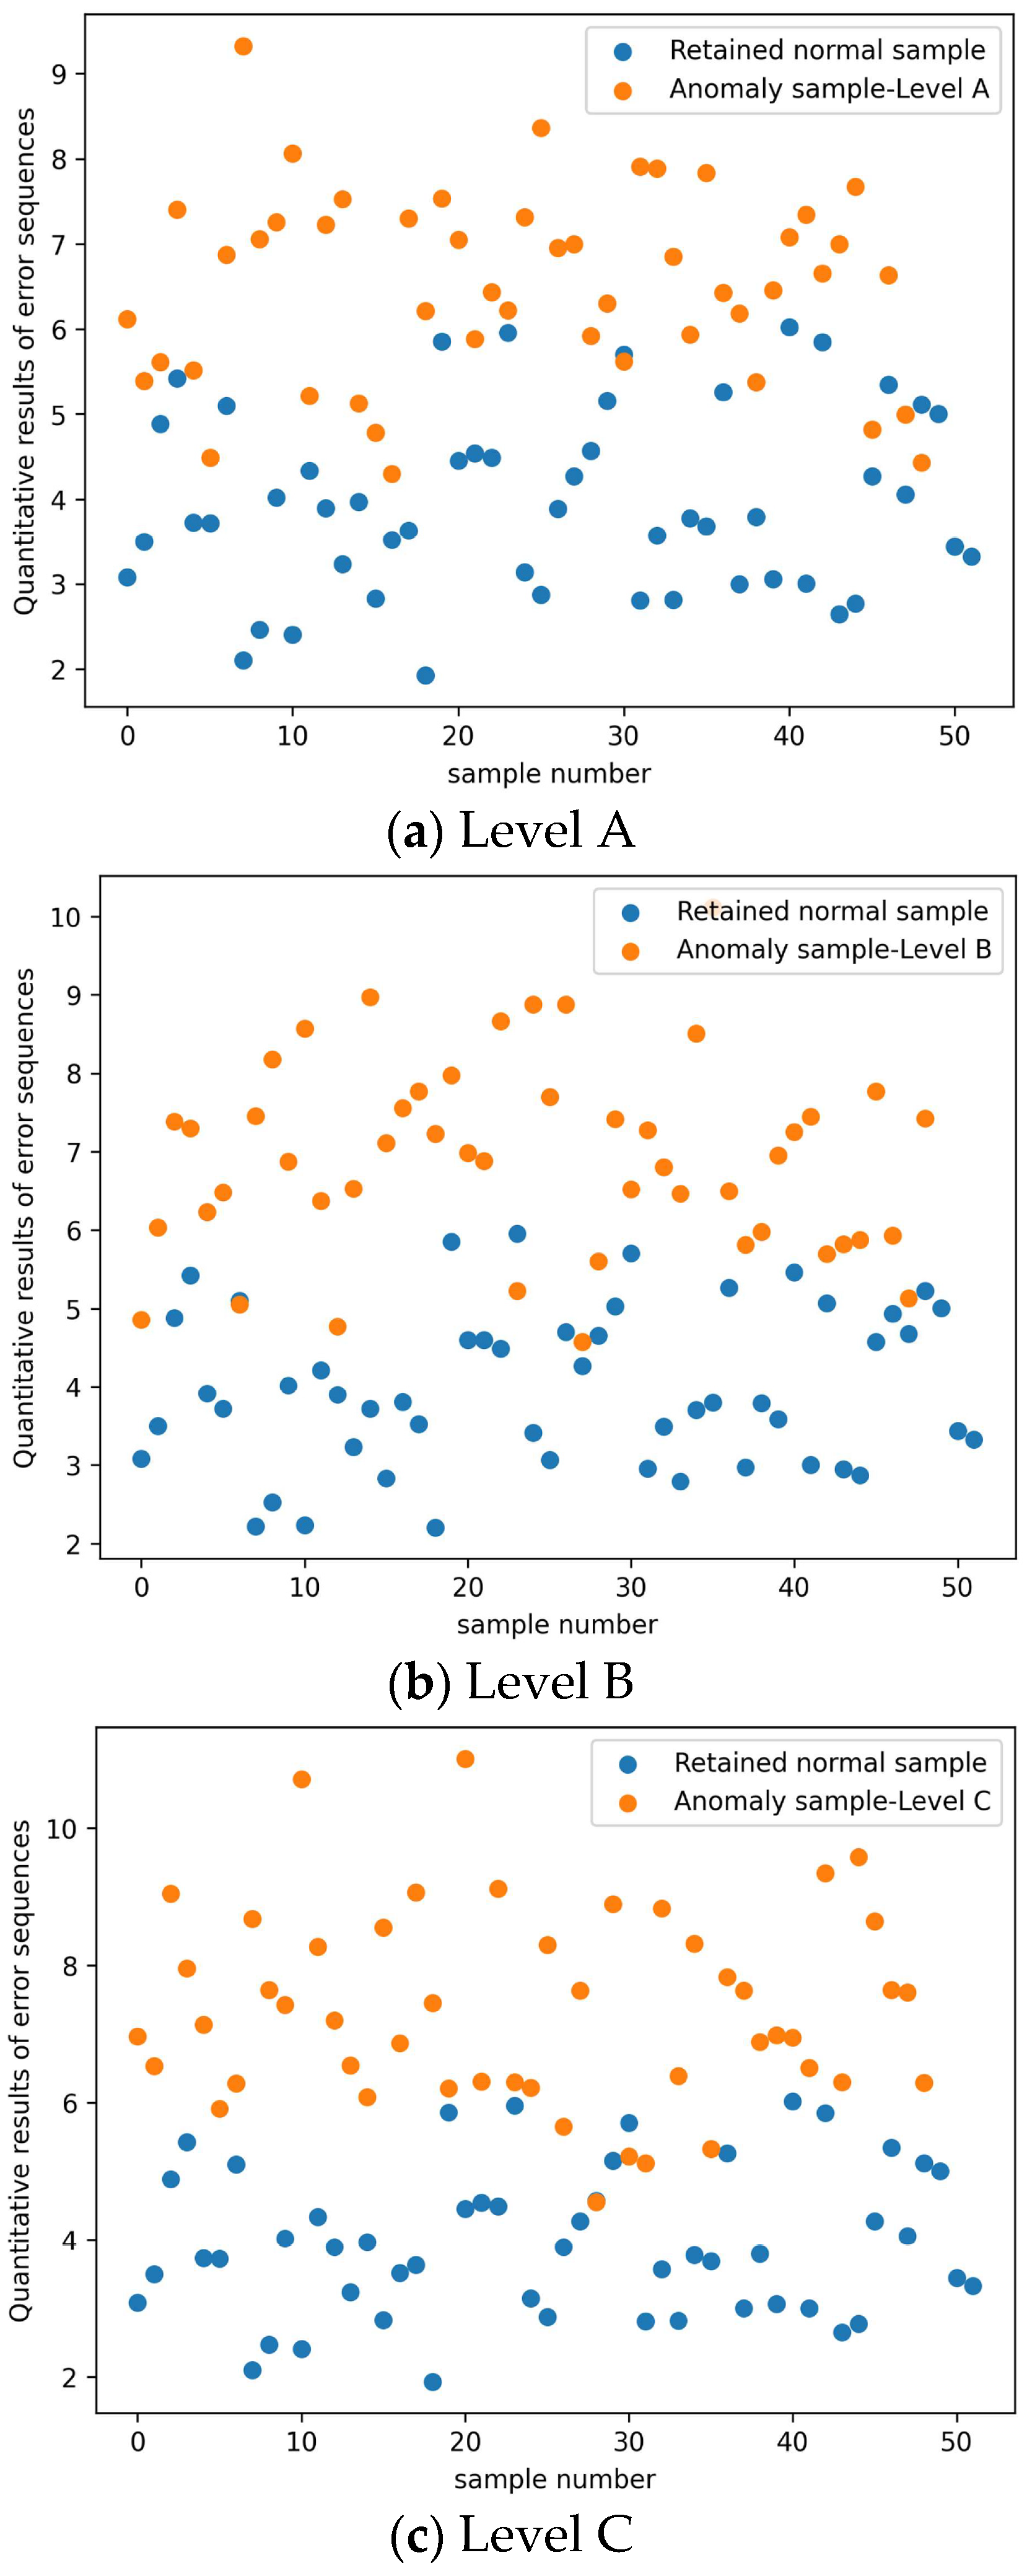
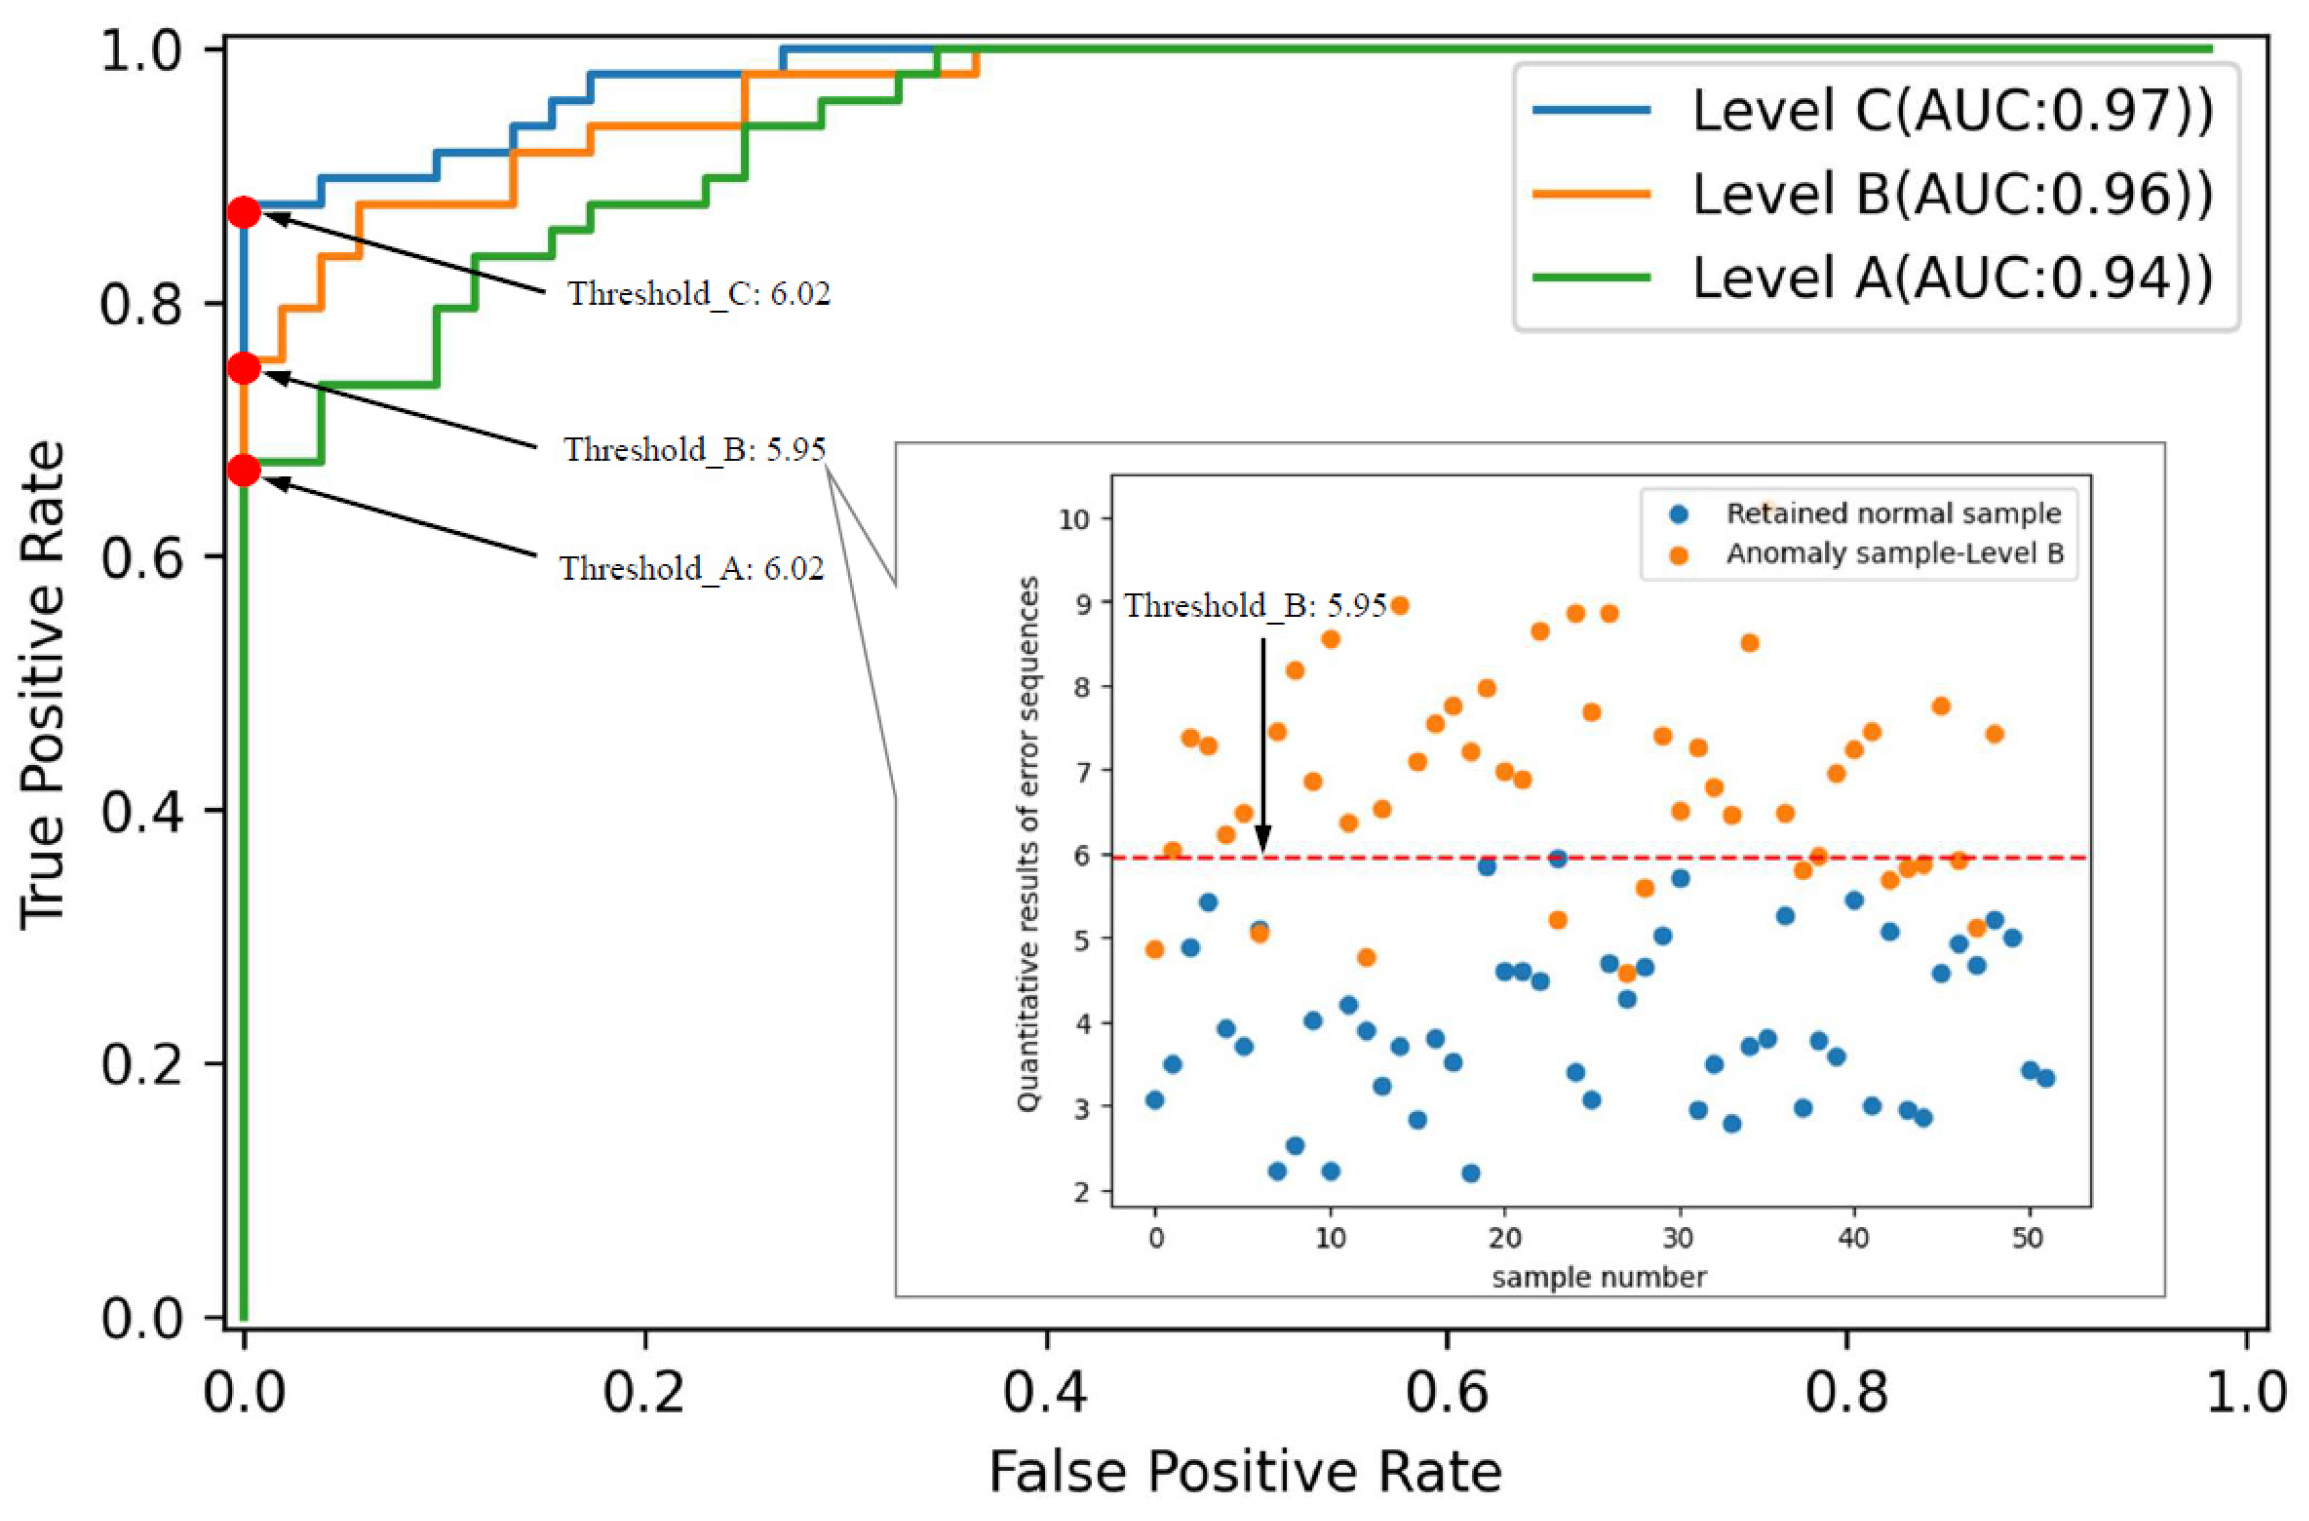
4.1. Result Analysis

The error sequence results of the three-level anomaly samples in Table 1, after being processed by the unsupervised network described in Figure 7, revealed that for about 80% of the test samples, the average of the main peak of the error sequence of the samples exceeded 6, while the rest was about 2. Figure 8 depicts two randomly selected samples with anomalies and their corresponding predicted error sequences, where the red dotted line represents the anomalous part. Although the main peak of the error sequence can indicate the anomaly to some extent, pseudo main peaks are also observed in the error sequence as shown in Figure 8b.
To reduce the interference of the pseudo peak, calculation quantification was performed for the predicted error sequence and the results are shown in Figure 9. The quantitative results in each subplot in Figure 9 are composed of 49 anomaly signal samples and 70 retained normal signal samples. Here, the aforementioned retained normal signal samples were used to participate in the subsequent threshold settings based on the ROC curve.
The quantitative results in Figure 9 were set to the tentative threshold in the order from small to large to calculate the corresponding FPR and TPR. The results of FPR and TPR were represented by the ROC curve shown in Figure 10. Then, the candidate threshold used to distinguish the anomaly in Figure 9 can be determined. Here, the purpose of using the quantified result in the maximum TPR state corresponding to the FPR of zero as the candidate threshold was primarily to reduce the likelihood of normal samples being identified as abnormal.
The accuracy and F1-score in Table 2 quantified the experimental results based on the proposed method. The thresholds of the three levels set in Figure 10 can ensure that the recognition accuracy of the three types of abnormal samples in the designed experiment was no less than 0.84. With the increase in the proportion of anomalies, the accuracy of identifying anomalies and the F1-score gradually increased, reaching the highest of 0.94 and 0.93, respectively. The result not only conforms to the understanding that the more significant the anomaly is, the easier it is to identify, but also displays the capability for identifying abnormal signals based on the proposed procedure. In terms of the efficiency, under the hardware configuration and sample size described in this paper, the proposed anomaly recognition algorithm took about 10 min and 0.24 s in stages of the training and recognition, respectively.

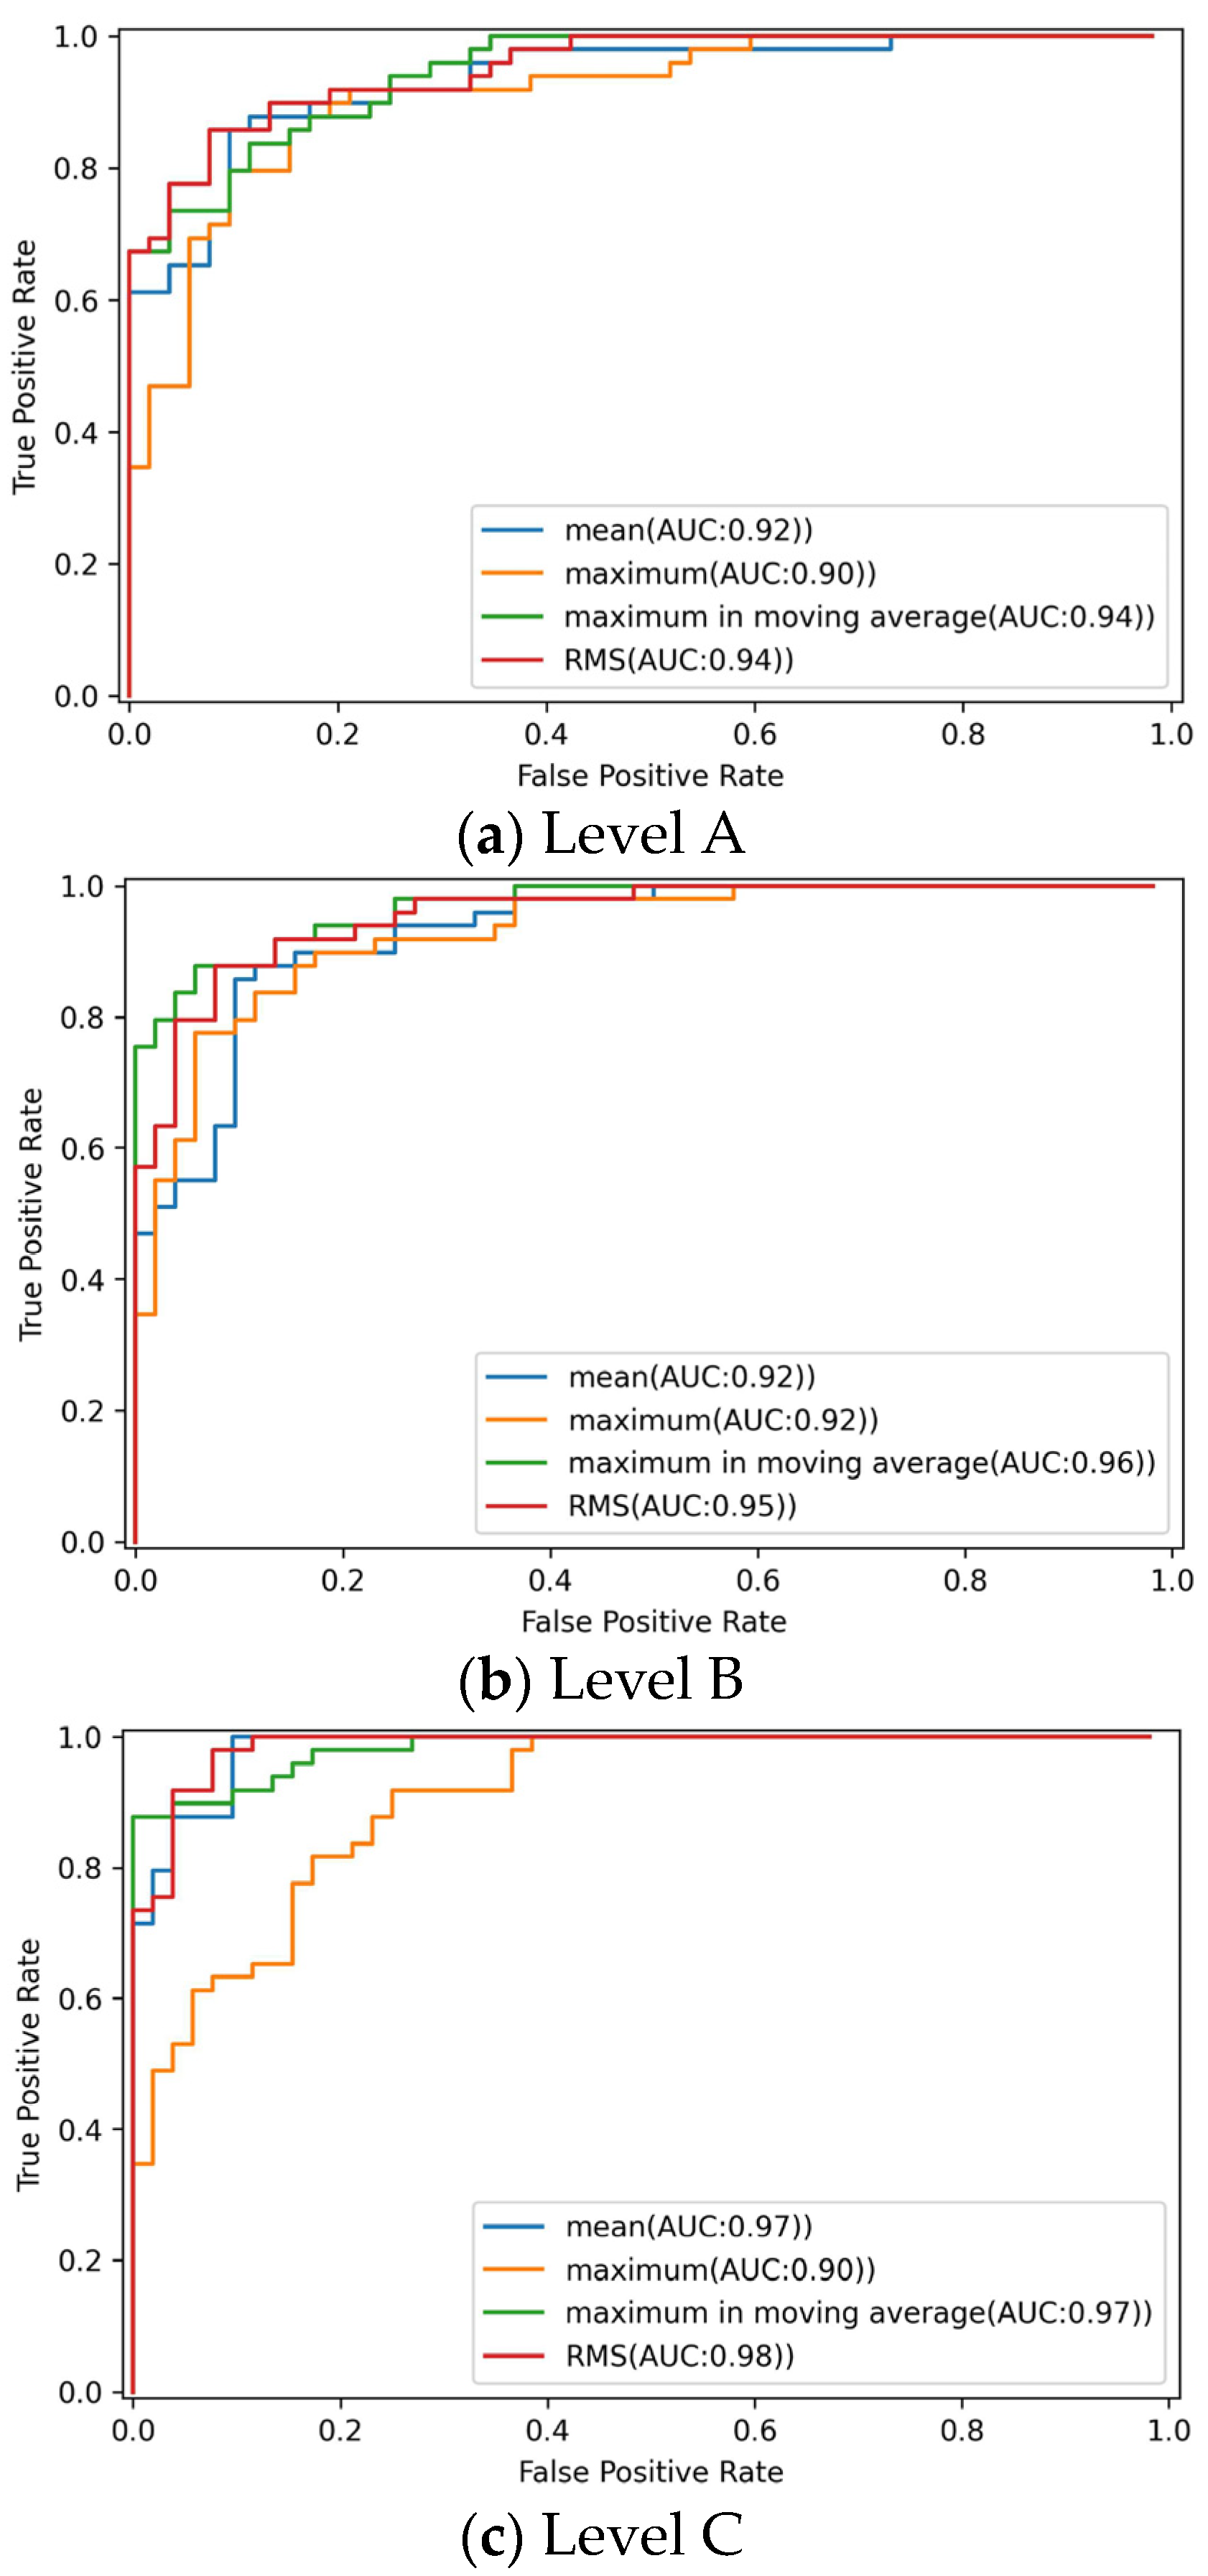
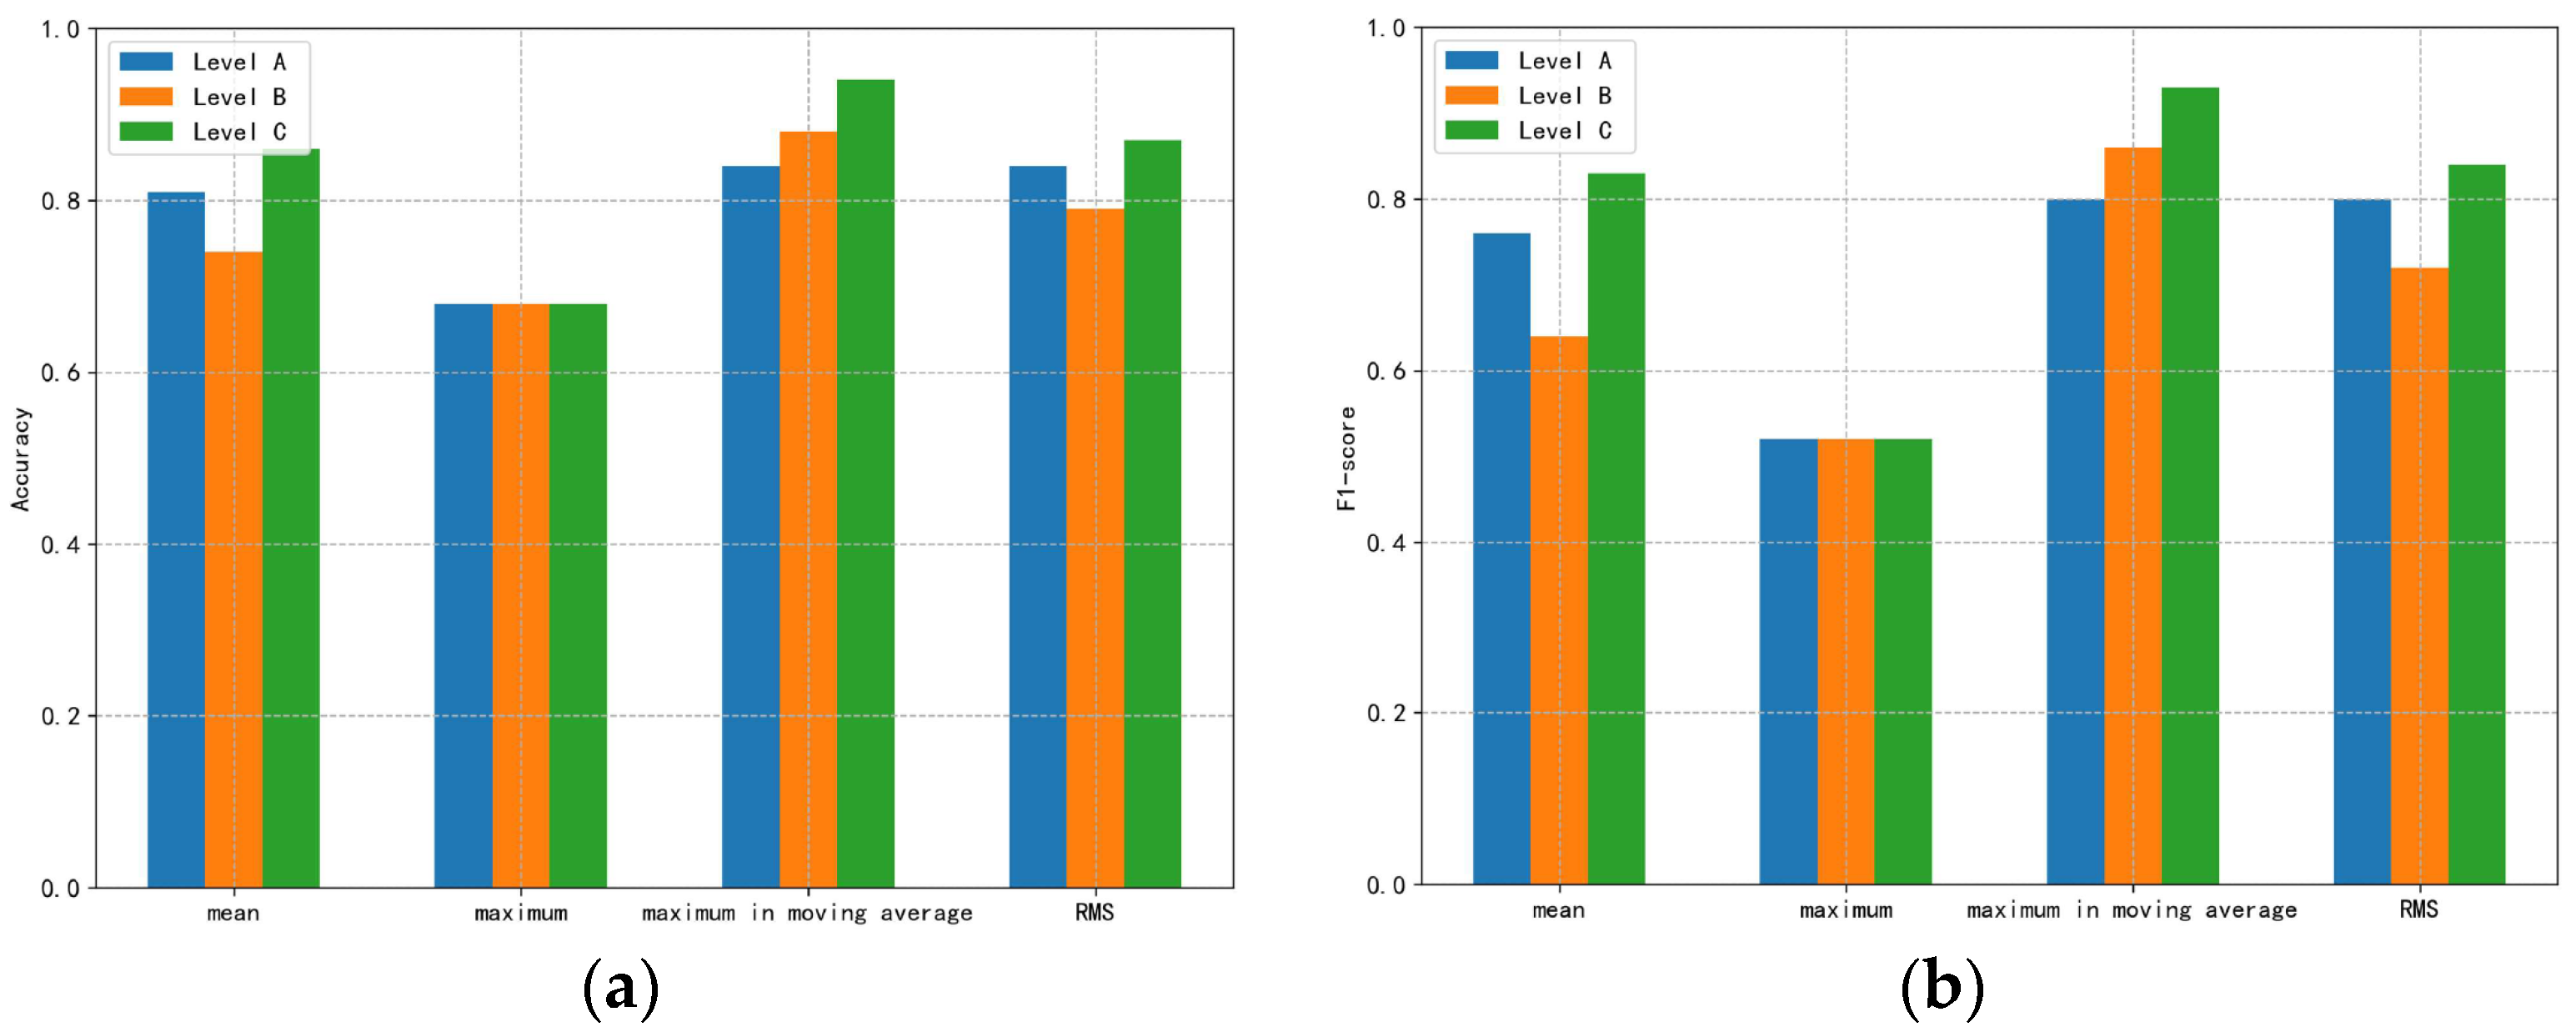
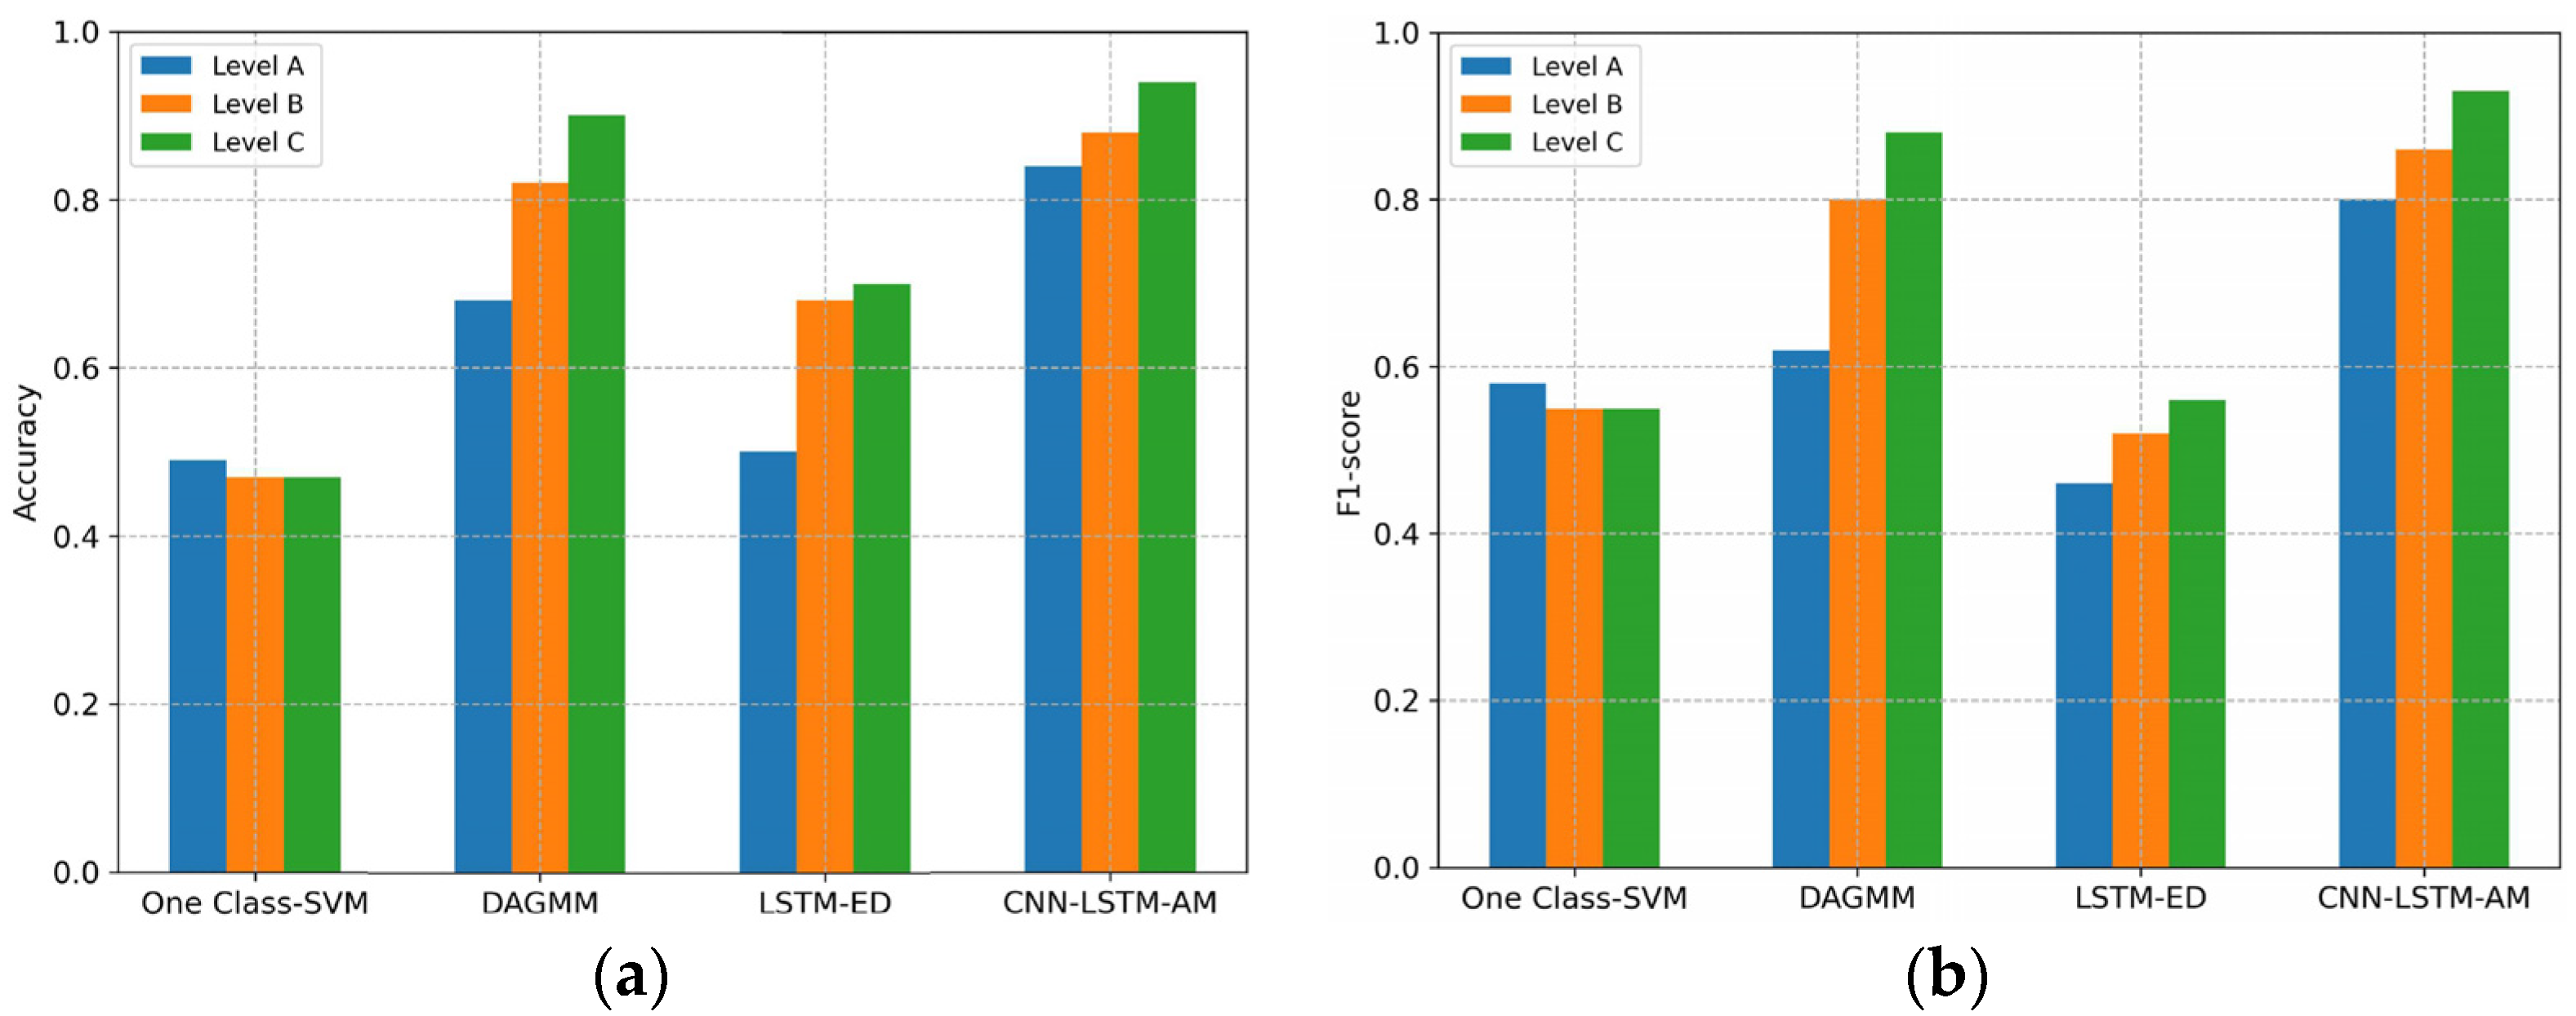
4.2. Discussion Based on Comparative Testing

To further evaluate the effectiveness of the proposed method, both the quantification metric of the error sequence and the established unsupervised learning network were in turn compared with other approaches. Here, the allocation of datasets for the comparison tests was consistent with that presented earlier in this paper. In addition to quantifying the error sequence by choosing the maximum processed after the moving average, the effects of identifying anomalous signals when representing the error sequence with the maximum, mean, and root mean square (RMS) were also discussed. Figure 11 shows the ROC curves derived from the four metrics of quantifying the error sequence. The results concerning the area under the ROC curve (AUC) based on the different metrics in Figure 11 all display good performance in terms of the aggregate measure represented by AUC. Although the method of threshold selection based on comparative metrics was reasonable and competitive, the proposed quantification indicator has the highest TPR when the FPR is zero. That is, the results in Figure 11 mean that the threshold based on the quantitative processing proposed in this paper can better identify abnormal samples, and the comparison results based on the accuracy and F1-score shown in Figure 12 further confirm this inference. For three levels of abnormal samples, the indicator adopted in this paper can guarantee higher accuracy and F1-score than that of the other three metrics.
Three typical unsupervised networks (one-class SVM, DAGMM, and LSTM encoder-decoder (LSTM-ED)) which have been reported [20,21,24] to be suitable for anomaly recognition were selected for performance comparison with the CNN-LSTM-AM network proposed in this paper. To fully compete with the proposed network, the most appropriate key candidate hyperparameters sets [22,32] for one-class SVM, DAGMM, and LSTM-ED were derived through trial and error based on random searching [33]. The comparison results shown in Figure 13 revealed that one-class SVM was the least effective. This phenomenon may be related to the relatively lower algorithm complexity of one-class SVM compared with other methods. Although the detection performance of the three comparison methods improved in terms of accuracy and F1-score as the degree of anomaly increased, the proposed network still outperformed the effect of the best DAGMM among the comparison methods. Specifically, for three-level anomaly samples, the average results of accuracy and F1-score of the CNN-LSTM-AM network were 11% and 13% higher than that of DAGMM, respectively. Especially for abnormal samples at level A with the shortest anomaly duration, the network established in this paper led by 24% and 29% in the accuracy and F1-score, respectively.

5. Conclusions

The present work indicates that when sufficient normal vibration samples are guaranteed for training the network and auxiliary detection, anomalous vibration signals in the track bed response of subway tunnels detected by ultra-weak FBG sensing array can be identified based on the idea of unsupervised learning. Due to the difficulty of obtaining adequate abnormal samples, the pattern diversity of different levels of abnormal samples based on found and simulated cases in this paper is not rich enough. Thus, the recognition effect of this method on unknown samples with significant type differences collected at the same period needs to be further tested and improved. However, given that the source and location of the superimposed sub-sequence in each simulated abnormal sample are based on random selection, there is reason to believe that the proposed method has strong robustness in the actual engineering. Moreover, some other limitations are worth noting. Although the recognition effects were verified experimentally, the established unsupervised learning network architecture in the proposed method still needs to be further improved by more unknown types and degrees of abnormal events in the future. Moreover, the results of comparison experiments demonstrate that both the current quantification indicator for the error sequences and the established networks have better performance, but whether there is a more appropriate solution to quantify error sequences and the influence of the normal sample size on the identification effect require further investigation. For the above concerns, it is necessary to further investigate the performance of the method proposed in this paper in future work when more typical anomaly samples can be obtained. Additionally, the feasibility and effectiveness of the procedures reported in this paper need to be validated in other areas with similar needs.

Author Contributions

Conceptualization, S.L.; data curation, Y.Q.; funding acquisition, S.L. and J.J.; investigation, H.W.; methodology, Y.Q. and Q.N.; project administration, H.W.; resources, S.L.; supervision, L.S.; validation, S.L.; writing—original draft, Y.Q.; writing—review and editing, S.L. and Q.N. All authors have read and agreed to the published version of the manuscript.

Funding

This research was funded by the National Natural Science Foundation of China, grant numbers 61875155 and 52108472, and the Natural Science Foundation of Hubei Province, grant number 2020CFB144.

Institutional Review Board Statement

Not applicable.

Informed Consent Statement

Not applicable.

Data Availability Statement

The data presented in this study are available on request from the corresponding author.

Acknowledgments

The research work reported in this paper was supported by the National Engineering Research Center of Fiber Optic Sensing Technology and Networks, Wuhan University of Technology, and the Smart Nanocomposites Laboratory, University of California, Irvine.

Conflicts of Interest

The authors declare no conflict of interest.

References

  1. Kaewunruen, S.; Osman, M.H.; Hao Cheng Eric, W. Risk-based maintenance planning for rail fastening systems. ASCE-ASME J. Risk Uncertain. Eng. Syst. Part A Civ. Eng. 2019, 5, 04019007. [Google Scholar] [CrossRef] [Green Version]
  2. Poudel, A.; Lindeman, B.; Wilson, R. Current practices of rail inspection using ultrasonic methods: A review. Mater. Eval. 2019, 77, 871–883. [Google Scholar]
  3. Alvarenga, T.A.; Carvalho, A.L.; Honorio, L.M.; Cerqueira, A.S.; Filho, L.M.A.; Nobrega, R.A. Detection and classification system for rail surface defects based on eddy current. Sensors 2021, 21, 7937. [Google Scholar] [CrossRef] [PubMed]
  4. Kim, J. Non-destructive characterization of railway materials and components with infrared thermography technique. Materials 2019, 12, 4077. [Google Scholar] [CrossRef] [Green Version]
  5. Lou, Y.; Zhang, T.; Tang, J.; Song, W.; Zhang, Y.; Chen, L. A fast algorithm for rail extraction using mobile laser scanning data. Remote Sens. 2018, 10, 1998. [Google Scholar] [CrossRef] [Green Version]
  6. Gibert, X.; Patel, V.M.; Chellappa, R. Deep multitask learning for railway track inspection. IEEE Trans. Intell. Transp. Syst. 2017, 18, 153–164. [Google Scholar] [CrossRef] [Green Version]
  7. James, A.; Jie, W.; Xulei, Y.; Chenghao, Y.; Ngan, N.B.; Yuxin, L.; Yi, S.; Chandrasekhar, V.; Zeng, Z. TrackNet—A deep learning based fault detection for railway track inspection. In Proceedings of the 2018 International Conference on Intelligent Rail Transportation, ICIRT 2018, Singapore, 12–14 December 2018. [Google Scholar]
  8. Li, S.; Zuo, X.; Li, Z.; Wang, H.; Sun, L. Combining SDAE network with improved DTW algorithm for similarity measure of ultra-weak FBG vibration responses in underground structures. Sensors 2020, 20, 2179. [Google Scholar] [CrossRef] [Green Version]
  9. Gan, W.; Li, S.; Li, Z.; Sun, L. Identification of ground intrusion in underground structures based on distributed structural vibration detected by ultra-weak FBG sensing technology. Sensors 2019, 19, 2160. [Google Scholar] [CrossRef] [Green Version]
  10. Nan, Q.; Li, S.; Yao, Y.; Li, Z.; Wang, H.; Wang, L.; Sun, L. A novel monitoring approach for train tracking and incursion detection in underground structures based on ultra-weak FBG sensing array. Sensors 2019, 19, 2666. [Google Scholar] [CrossRef] [Green Version]
  11. Tao, L.; Siqi, Q.; Zhang, Y.; Shi, H. Abnormal detection of wind turbine based on SCADA data mining. Math. Probl. Eng. 2019, 2019, 5976843. [Google Scholar] [CrossRef] [Green Version]
  12. Qiu, Y.; Jing, L.; Li, S. Bridge anomaly data identification method based on statistical feature mixture and data augmentation through forwarding difference. In Proceedings of the 2021 3rd International Conference on Advances in Civil Engineering, Energy Resources and Environment Engineering, Qingdao, China, 28–30 May 2021. [Google Scholar]
  13. Li, S.; Sun, L. Detectability of bridge-structural damage based on fiber-optic sensing through deep-convolutional neural networks. J. Bridge Eng. 2020, 25, 04020012. [Google Scholar] [CrossRef]
  14. Tang, Z.; Chen, Z.; Bao, Y.; Li, H. Convolutional neural network-based data anomaly detection method using multiple information for structural health monitoring. J. Struct. Control Health Monit. 2019, 26, e2296. [Google Scholar] [CrossRef] [Green Version]
  15. Li, Z.; Wang, Y.; Wang, K. A deep learning driven method for fault classification and degradation assessment in mechanical equipment. Comput. Ind. 2019, 104, 1–10. [Google Scholar] [CrossRef]
  16. Abid, F.B.; Sallem, M.; Braham, A. Robust interpretable deep learning for intelligent fault diagnosis of induction motors. IEEE Trans. Instrum. Meas. 2019, 69, 3506–3515. [Google Scholar] [CrossRef]
  17. Hautamäki, V.; Kärkkäinen, I.; Fränti, P. Outlier detection using k-nearest neighbour graph. In Proceedings of the 17th International Conference on Pattern Recognition, ICPR 2004, Cambridge, UK, 23–26 August 2004. [Google Scholar]
  18. He, Z.; Xu, X.; Deng, S. Discovering cluster-based local outliers. Pattern Recogn. Lett. 2003, 24, 1641–1650. [Google Scholar] [CrossRef]
  19. Li, J.; Izakian, H.; Pedrycz, W.; Jamal, I. Clustering-based anomaly detection in multivariate time series data. Appl. Soft. Comput. 2021, 100, 106919. [Google Scholar] [CrossRef]
  20. Saari, J.; Strömbergsson, D.; Lundberg, J.; Thomson, A. Detection and identification of windmill bearing faults using a one-class support vector machine (SVM). Meas. J. Int. Meas. Confed. 2019, 137, 287–301. [Google Scholar] [CrossRef]
  21. Zong, B.; Song, Q.; Min, M.R.; Cheng, W.; Lumezanu, C.; Cho, D.; Chen, H. Deep autoencoding Gaussian mixture model for unsupervised anomaly detection. In Proceedings of the 6th International Conference on Learning Representations, Vancouver, BC, Canada, 30 April–3 May 2018. [Google Scholar]
  22. Purohit, H.; Tanabe, R.; Endo, T.; Suefusa, K.; Nikaido, Y.; Kawaguchi, Y. Deep Autoencoding Gmm-Based Unsupervised Anomaly Detection In Acoustic Signals And Its Hyperparameter Optimization. arXiv 2009, arXiv:2009.12042. Available online: https://arxiv.org/abs/2009.12042 (accessed on 20 May 2022).
  23. Pei, J.; Zhong, K.; Jan, M.A.; Li, J. Personalized federated learning framework for network traffic anomaly detection. Comput. Netw. 2022, 209, 108906. [Google Scholar] [CrossRef]
  24. Malhotra, P.; Ramakrishnan, A.; Anand, G.; Vig, L.; Agarwal, P.; Shroff, G. LSTM-based encoder-decoder for multi-sensor anomaly detection. arXiv 2016, arXiv:1607.00148. Available online: https://arxiv.org/abs/1607.00148 (accessed on 8 May 2022).
  25. Taylor, A.; Leblanc, S.; Japkowicz, N. Anomaly detection in automobile control network data with long short-term memory networks. In Proceedings of the 3rd IEEE International Conference on Data Science and Advanced Analytics, DSAA 2016, Montreal, PQ, Canada, 17–19 October 2016. [Google Scholar]
  26. Luo, Z.; Wen, H.; Guo, H.; Yang, M. A time-and wavelength-division multiplexing sensor network with ultra-weak fiber Bragg gratings. Opt. Express 2013, 21, 22799–22807. [Google Scholar] [CrossRef] [Green Version]
  27. Fonseca, A.; Cabral, B. Designing a neural network from scratch for big data powered by multi-node GPUs. Smart Innov. Syst. Technol. 2019, 136, 1–19. [Google Scholar]
  28. Abdeljaber, O.; Avci, O.; Kiranyaz, M.S.; Boashash, B.; Sodano, H.; Inman, D.J. 1-D CNNs for structural damage detection: Verification on a structural health monitoring benchmark data. Neurocomputing 2018, 275, 1308–1317. [Google Scholar] [CrossRef]
  29. Liu, Y.; Liu, P.; Wang, X.; Zhang, X.; Qin, Z. A study on water quality prediction by a hybrid CNN-LSTM model with attention mechanism. In Proceedings of the International Conference on Smart Transportation and City Engineering 2021, Chongqing, China, 26–28 October 2021. [Google Scholar]
  30. Lameski, P.; Zdravevski, E.; Mingov, R.; Kulakov, A. SVM parameter tuning with grid search and its impact on reduction of model over-fitting. Lect. Notes Comput. Sci. 2015, 9437, 464–474. [Google Scholar]
  31. Huk, M. Stochastic optimization of contextual neural networks with RMSprop. In Proceedings of the Intelligent Information and Database Systems–12th Asian Conference, ACIIDS 2020, 3rd IEEE International Conference on Data Science and Advanced Analytics, Phuket, Thailand, 23–26 March 2020. [Google Scholar]
  32. Buslim, N.; Rahmatullah, I.L.; Setyawan, B.A.; Alamsyah, A. Comparing bitcoin’s prediction model using GRU, RNN, and LSTM by hyperparameter optimization grid search and random search. In Proceedings of the 2021 9th International Conference on Cyber and IT Service Management, CITSM 2021, Virtual, Bengkulu, Indonesia, 22–23 September 2021. [Google Scholar]
  33. Bergstra, J.; Bengio, Y. Random search for hyper-parameter optimization. J. Mach. Learn. Res. 2012, 13, 281–305. [Google Scholar]
Figure 1. The proposed abnormal signal identification process.
Symmetry 14 01100 g001
Figure 2. Processing details of vibration sequences used for generating prediction error.
Symmetry 14 01100 g002
Figure 3. Field layout of ultra-weak FBG sensing array for acquiring vibration responses of track beds.
Symmetry 14 01100 g003
Figure 4. Typical vibration responses of track beds caused by the (a) safety train and (b) train with worn wheels.
Symmetry 14 01100 g004
Figure 5. An example of the process of generating the simulated anomaly sample.
Symmetry 14 01100 g005
Figure 6. Raw dataset composition and division for the experiment.
Symmetry 14 01100 g006
Figure 7. The proposed CNN-LSTM-AM network architecture with 5 hidden layers.
Symmetry 14 01100 g007
Figure 8. Randomly selected (a,b) anomaly signals and their corresponding prediction error sequences.
Symmetry 14 01100 g008
Figure 9. Quantitative results of error sequences of (ac) three-level anomaly samples and retained normal samples.
Symmetry 14 01100 g009
Figure 10. ROC curve based on quantitative results of error sequences.
Symmetry 14 01100 g010
Figure 11. ROC curves derived from quantifying error sequences of (ac) three-level anomaly samples based on four different metrics.
Symmetry 14 01100 g011
Figure 12. Comparison results of (a) accuracy and (b) F1-score from four metrics for quantifying error sequences.
Symmetry 14 01100 g012
Figure 13. Comparison results of (a) accuracy and (b) F1-score from four unsupervised learning networks.
Symmetry 14 01100 g013
Table 1. The division results of the experimental dataset after data augmentation.
DatasetSize of Normal SampleSize of Abnormal Sample
Level ALevel BLevel C
Training set6741---
Test set2194197119621968
Table 2. Quantitative evaluation of experimental results.
Anomaly TypeAccuracyF1-Score
Level A0.840.80
Level B0.880.86
Level C0.940.93
Publisher’s Note: MDPI stays neutral with regard to jurisdictional claims in published maps and institutional affiliations.

