Article

Development and Application of Non-Destructive Testing Instrument for Wall Impermeability Based on a Water Drenching Method

School of Civil Engineering and Architecture, Zhejiang Sci-Tech University, Hangzhou 310018, China
*
Author to whom correspondence should be addressed.
Symmetry 2022, 14(5), 987; https://doi.org/10.3390/sym14050987
Submission received: 25 April 2022 / Revised: 5 May 2022 / Accepted: 9 May 2022 / Published: 11 May 2022
(This article belongs to the Special Issue Symmetry in Safety and Disaster Prevention Engineering)

Abstract

:
This article introduces a new type of on-site non-destructive testing instrument for the impermeability measurement of walls. The research and development of this instrument is based on the water drenching method. The influence of symmetry is mainly considered in the design process, and it has on-site testing functions such as water pressure adjustment and wind pressure simulation. The water seepage of the four types of masonry walls under the combined working conditions of three levels of spray strength and wind pressure strength was tested by using instruments. The results show that the weak location regarding the impermeability of the masonry wall is the junction of mortar joints. Parameters such as wall leakage time, seepage area and water seepage amount are significantly affected by wind pressure. Furthermore, during on-site inspection, the influence of wind pressure on water seepage conditions must be considered when simulating the real wind-driven rain conditions. The testing instrument will be promoted and used according to the compiled industry regulations.

1. Introduction

Leakage through the enclosure wall affects the insulation and durability of the building and at the same time, it reduces the comfort of living, which has become a significant issue in engineering and society [1,2]. In the field of reinforced concrete and masonry construction, the theoretical simulation and method analysis of non-destructive testing including non-destructive testing of permeability have been greatly developed, which has great reference significance for the research of this paper [3,4,5,6,7,8,9]. At present, the discovery and repair of wall leakages are often in the post-event stage, and there is a lack of pre-detection mechanisms. One of the main bottlenecks is the lack of reliable on-site detection methods, instruments and supporting regulations.
In the 1960s, Levitt [10] first proposed the ISAT (ISAT: Initial Surface Absorption Test) method. This method has a certain degree of permeability detection ability and can be used as one of the methods of permeability evaluation [11,12,13,14]. Under the guidance of the principle of ISAT, Basheer P. et al. [15] developed the AUTOCLAM permeability testing instrument. Studies have shown that this instrument can be used for on-site testing of the permeability of the structure surface [16,17,18,19,20,21,22], but it is difficult to ensure its firm attachment to the wall. Torrent et al. [23] proposed a two-chamber gas test method based on the principle of ISAT, which cannot guarantee the degree of sealing of the inner chamber. In this case, the reliability of the data is questionable. Basheer P. et al. [24] developed the PIMT (PIMT: PERMIT Ion Migration Test) instrument and used the method of polarity reversal to remove residual chloride ions from the surface of concrete. Figg et al. [25] put forward a method that can be used for the on-site testing of air and water penetration. This method is simple to operate and makes it easier to achieve the target pressure. Moczko Andrzej [26] used a GWT (GWT: Germann Water Permeation Test) detector to conduct the permeability test and proposed the concept of “average water flux”. On the basis of the above methods, many researchers have improved and proposed tests on impermeability instruments and methods [27,28,29,30,31,32]. It can be seen that most of the current research is based on concrete test blocks or walls, and there are still few reports on the impermeability of masonry walls in the world. Additionally, most of these instruments still need to perforate the wall, which may cause irreversible damage. Furthermore, natural precipitation is often accompanied by the “driving rain wind pressure”, which will cause additional loads on the facade of the building and eventually lead to material seepage [33,34,35,36]. Therefore, in addition to precipitation, the driving rain wind pressure should also be comprehensively considered when designing the waterproof standard for building exterior walls. In addition, leakage not occurs only on the surface of the block; therefore, the instrument should be capable of detection within the wall system.
Fu J. et al. [37,38] obtained the permeability parameters by reconstructing the meso-scale two-dimensional and three-dimensional numerical models of the wall material, which provided a theoretical basis for the simulation of the wall seepage process and leakage prevention under various working conditions. The authors also independently designed a laboratory device for testing the permeability of manufactured aerated concrete blocks. The NDT-WI (NDT-WI: Nondestructive Testing Instrument for Wall Impermeability), the first-generation of a wall impermeability tester, was developed based on the water drench method. On this basis, the CECS—wall impermeability field test and evaluation regulation—was developed. In this paper, the function is upgraded on the basis of the application feedback of the first-generation instrument NDT-WI, and the second-generation instrument NDT-WI-2 was developed. During the design process, the components such as spraying and fixing reflect the application of symmetry. Compared with traditional instruments, this instrument has the functions of portability, non-destructive testing, water source circulation and measurement of water loss. Finally, the instrument is used to carry out further field tests to explore the law of wall leakage, and the results will be used in the formulation of regulation.

2. Instrument Design and Manufacture

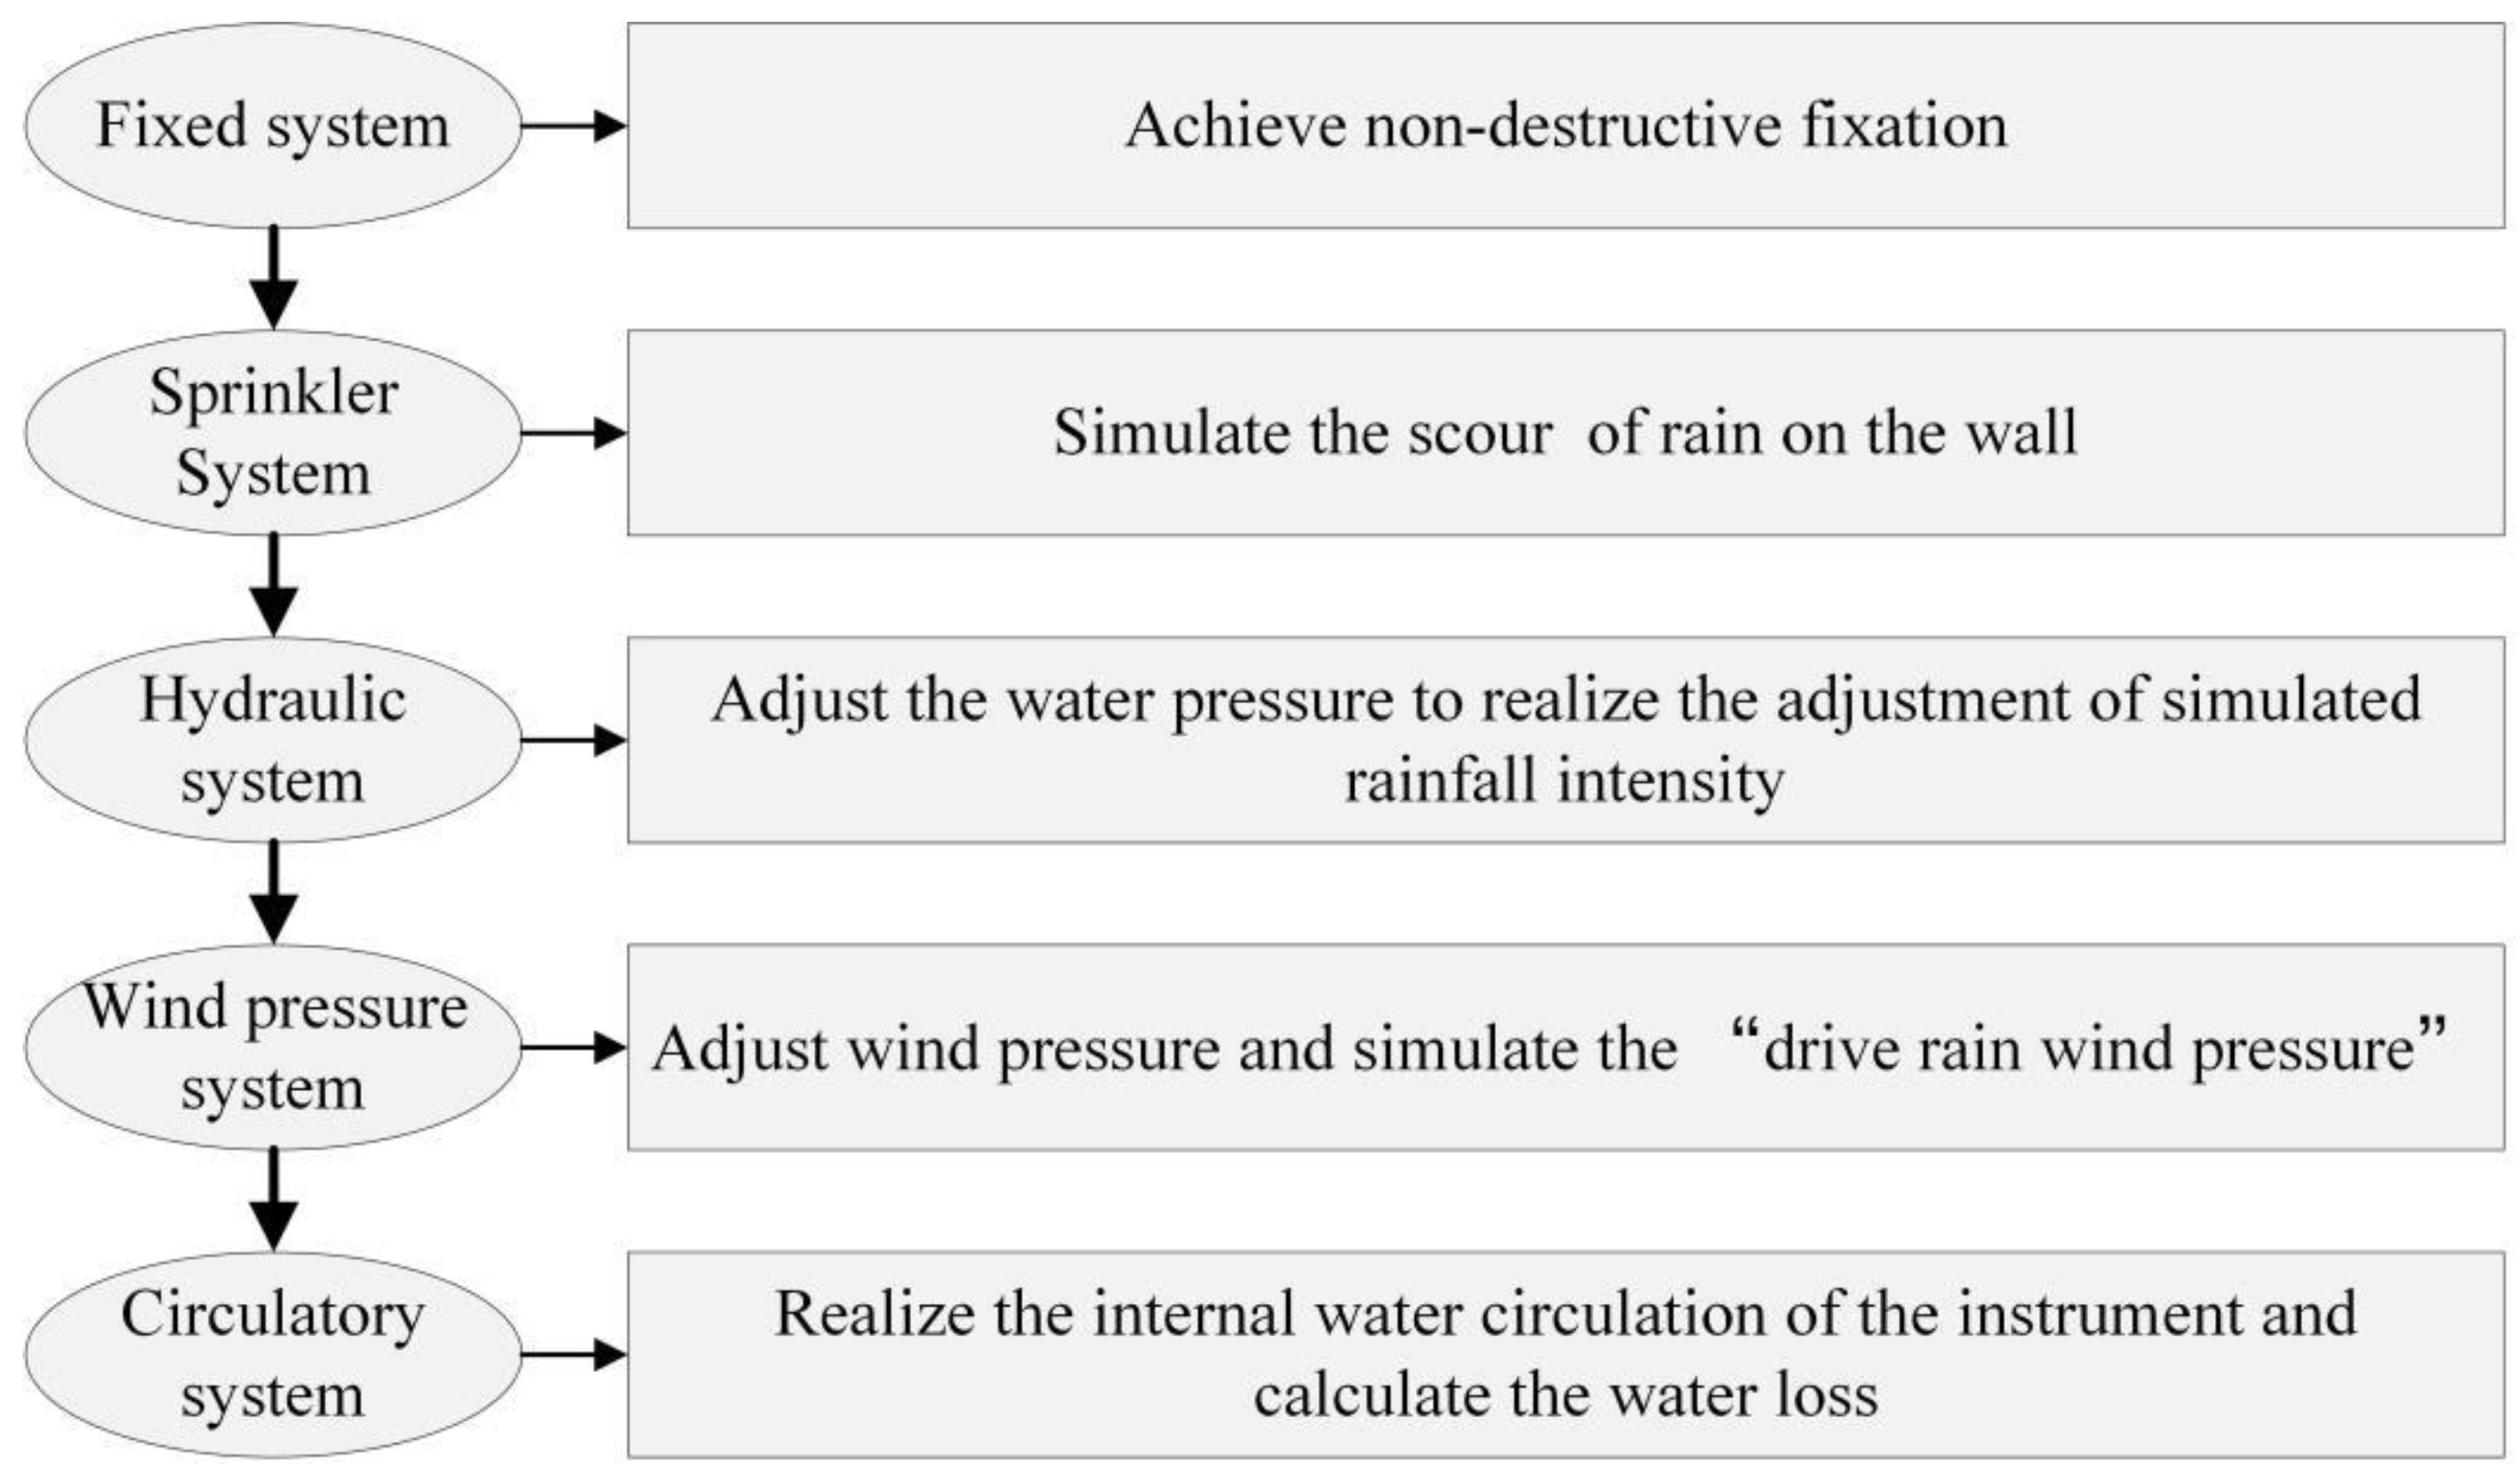
2.1. Configuration of the Instrument

NDT-WI-2 consists of five components: fixed system, sprinkler system, water pressure system, wind pressure system and circulation system. Each system function is shown in Figure 1.

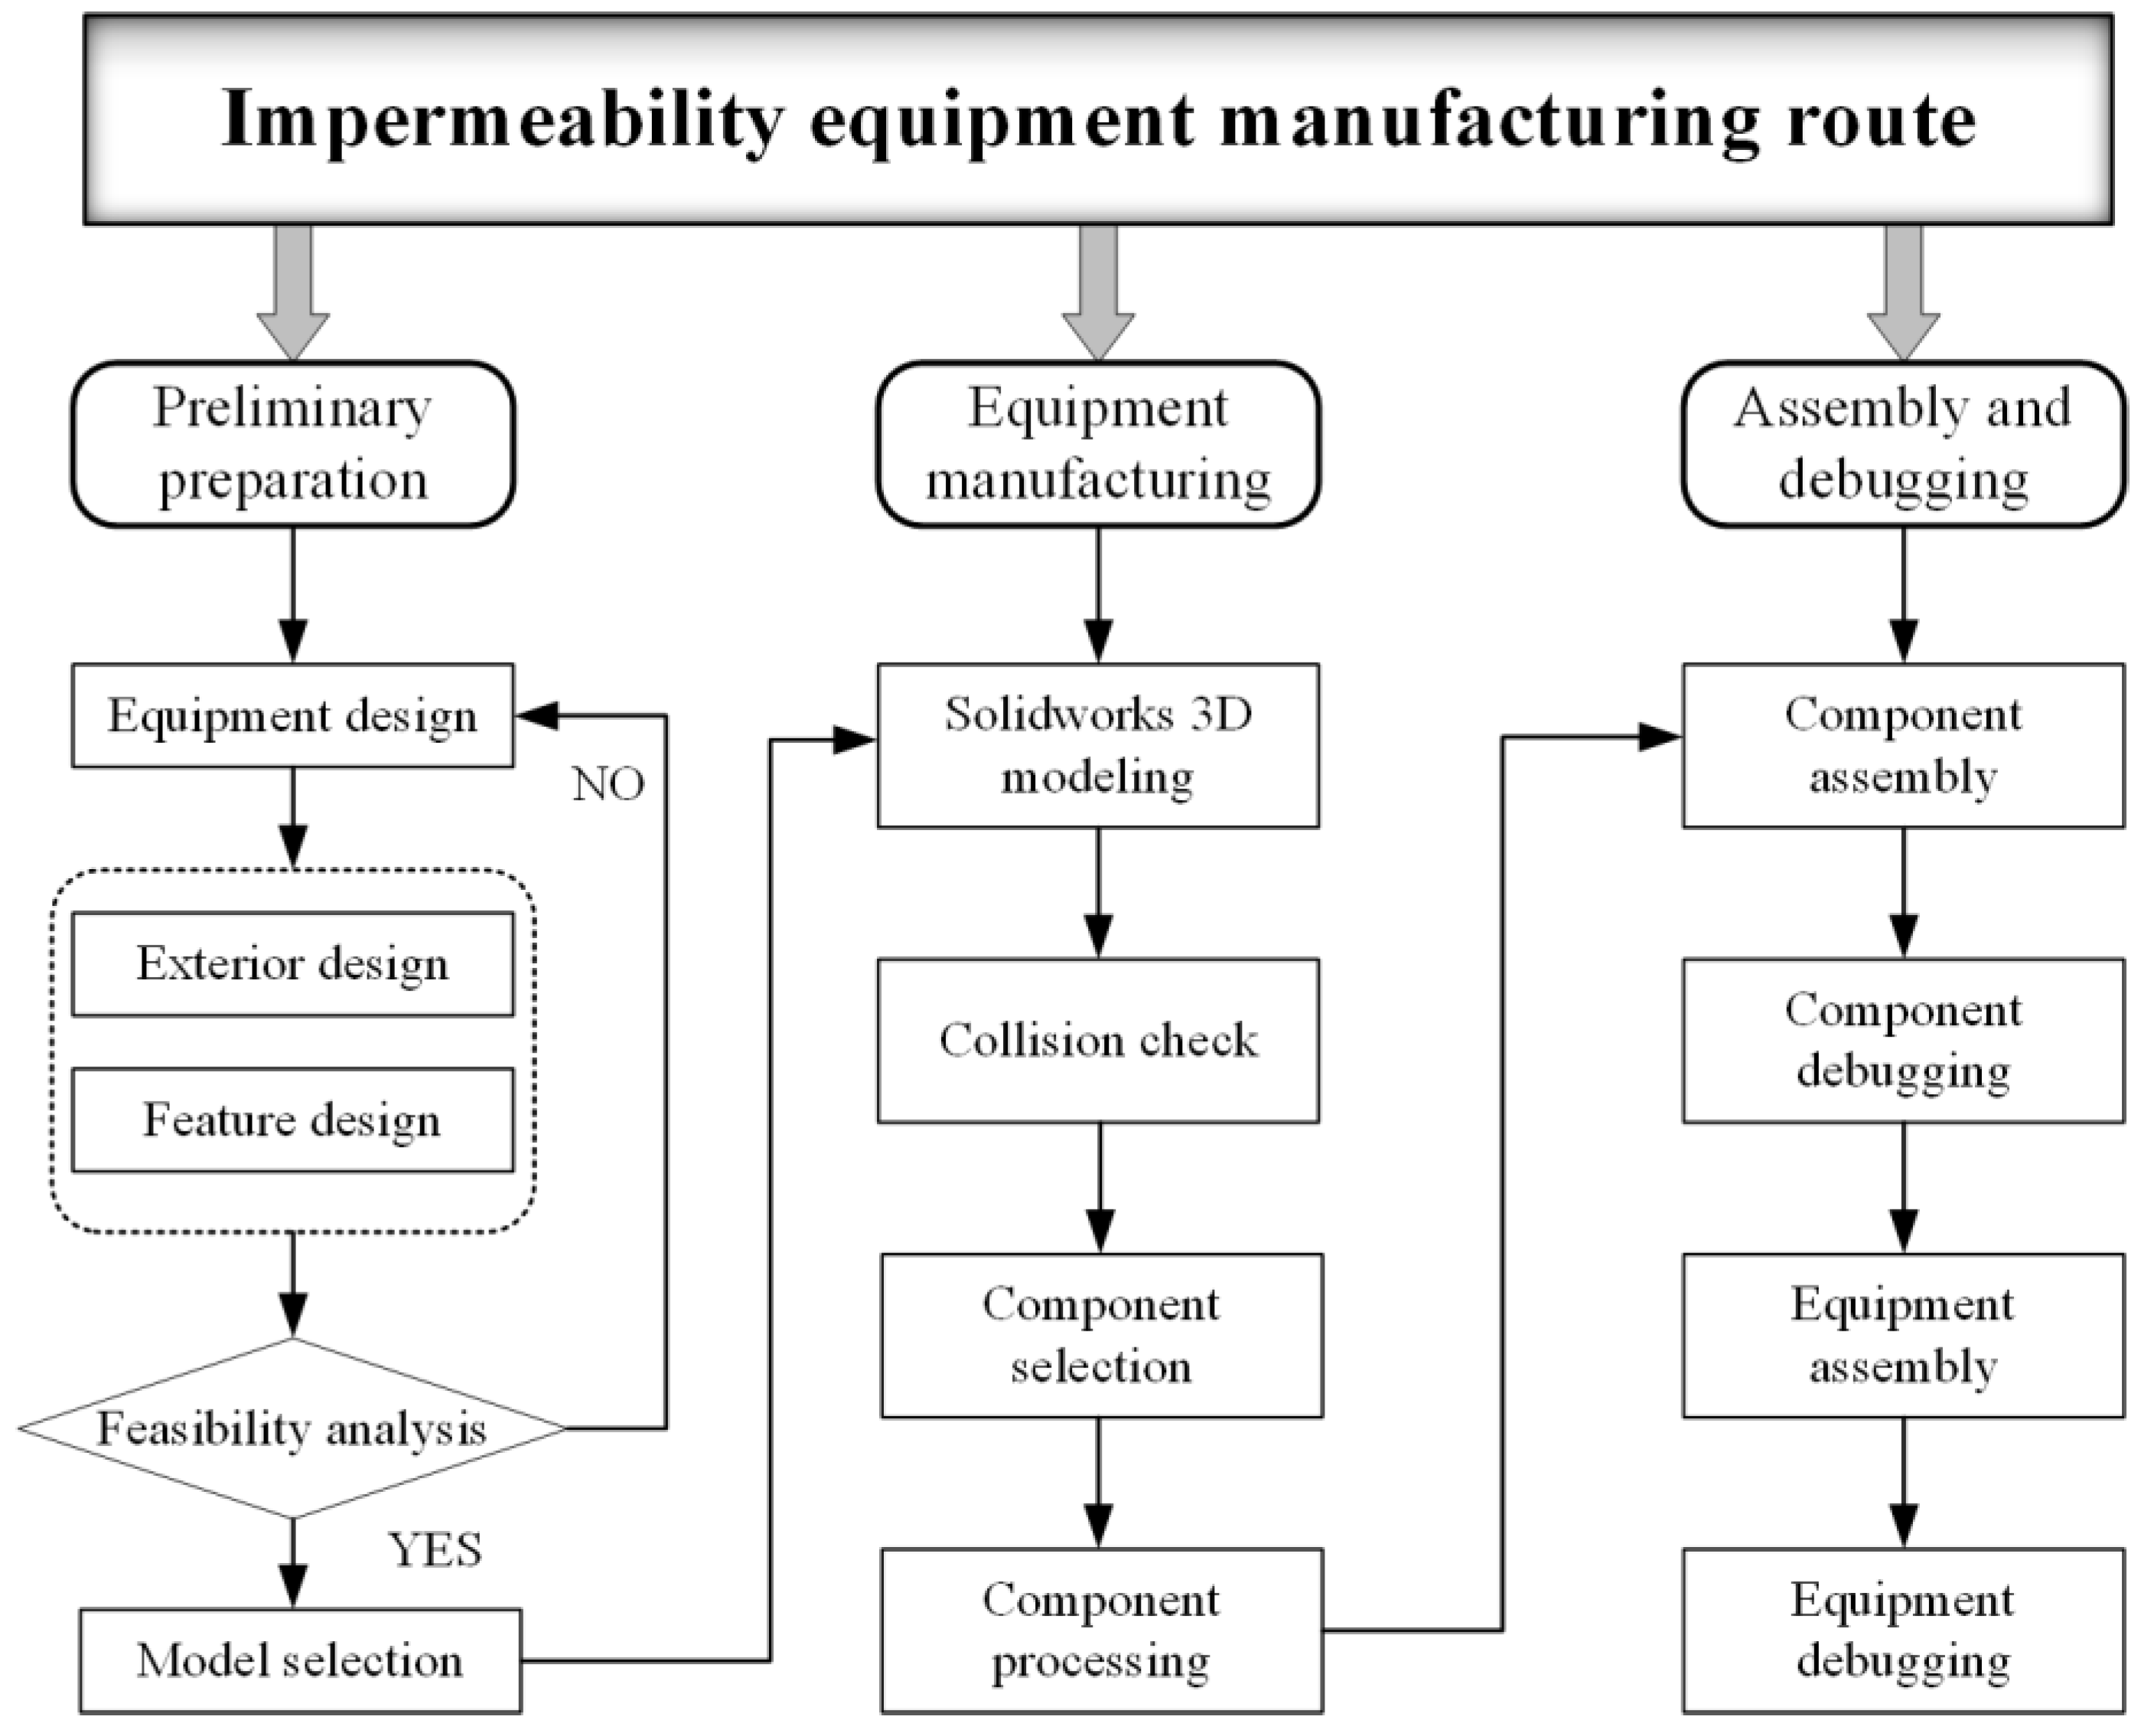
2.2. Technical Route

The manufacturing technology route of NDT-WI-2 was formulated as shown in Figure 2. It mainly includes designing the appearance and function of the instrument and confirming the instrument selection after theoretical analysis and modeling demonstration. On the basis of completing the preliminary preparations, the component processing and the debugging of the various functional modules of the instrument are carried out. Once the debugging is correct, the modules are assembled and the overall debugging of the instrument is finally completed.

2.3. Instrument Design

The whole design process of NDT-WI-2 is assisted by Solidworks software for 3D modeling. This software can perform real-time three-dimensional observation of each module of the instrument, so as to fully grasp the entire design process [39,40,41]. Figure 3 shows the overall effect of modeling using this software. According to the above design and the selection of components, the NDT-WI-2 is assembled as shown in Figure 4. The instrument adopts a modular integrated design idea and integrates various subsystems on a high-performance load mobile platform, which provides great convenience for the use of the instrument and the development of on-site testing.

2.3.1. Fixed System Design

The fixed system is mainly composed of a sponge vacuum suction cup and a vacuum pump. The focus of the system design is to ensure that the sprinkler system is fixed to the wall surface without damaging the wall structure.
Sponge vacuum suction cups are gradually becoming popular due to the non-destructive fixation between equipment and walls, and their good sealing performance and ability to absorb objects with uneven surfaces [42,43]. Their working pressure range is usually between 50 kPa and 80 kPa. When the diameter is 75 mm (effective diameter 60 mm) and the working pressure is 40 kPa (considering the different roughness of the wall), according to the equation for calculating the suction force of the vacuum suction cup, the force that a single suction cup can withstand is 113 N. According to the module decomposition calculation, the weight of the spray system is about 4 kg, so the total force F that the suction cup needs to withstand can be calculated by Equation (1).
F = m × g × s u
In the equation, F denotes the minimum suction required by the sucker (N); m denotes the mass of the sprinkler system (kg); g denotes the acceleration of gravity (9.8 m/s2); u denotes the friction coefficient (0.3–0.5, according to different wall conditions); and s denotes the safety factor (when the sucker is installed vertically, take 2).
F = 4 × 9.8 × 2 0.3 = 261.3 N
Considering the force calculation and the symmetrical layout analysis, four sponge suckers with a diameter of 75 mm were finally selected to be arranged at the four corners of the spray hood.

2.3.2. Spray System Design

The spray system is mainly composed of a spray hood and water distributor. The test result shows that the mortar joint is the weak part of the masonry structure where the leakage occurs. In order to cover the horizontal and vertical mortar joints as much as possible during the test, the size of the spray cover is determined to be 600 mm × 300 mm × 10 mm (length × width × height), and the material is stainless steel with a thickness of 1 mm. The water distributor adopts the combined arrangement of the PU pipe and water shower nozzle, and the nozzle can realize the adjustment of the spray angle from 0° to 60°. When the spray angle is 60°, the water film coverage radius of a single nozzle is 35 mm, then the nozzle spacing is set to 40 mm, and six nozzles are arranged on a single row of PU pipes. The symmetrical “multi-pipe combined arrangement” is used to arrange eight rows in parallel, which can ensure that a uniform and full-covering water film is formed on the surface of the inner wall of the spray hood. The arrangement of the sprinkler heads and the relevant detailed diagrams are shown in Figure 5.

2.3.3. Supply Pressure and Circulation System Design

The water pressure system consists of a booster pump, a flow meter and a water pipe. The system’s main function is to adjust the water pressure, simulate the scour and penetration of the wall under different rainfall conditions and monitor the flow rate. The wind pressure system is mainly composed of small air compressors, pressure regulators, etc. Its main function is to simulate the impact of natural direct blowing on the penetration. In order to realize the gradient pressure adjustment of the wind pressure, a miniature pressure regulator is assembled with a pressure adjustment accuracy of 10 kPa. In addition, the right and left sides of the spray hood are symmetrically equipped with straight-through pneumatic connectors, and the interface can be selected for wind pressure loading according to the site detection conditions.
The function of the circulatory system is to realize the internal water source circulation and water seepage calculation of the instrument. It is mainly composed of a water tank, filter and reading water column. The basic working principle of the system is to pump water from the water tank to the sprinkler system and use the 5° hydraulic slope at the bottom of the sprinkler hood to achieve rapid backflow and re-entry of water in the water tank to complete the circulation. According to the principle of the communicating device, a transparent cylindrical thin water pipe with a millimeter scale is installed on the outside of the water tank, which can realize the simultaneous measurement and reading of the fluid level in the water tank. By measuring and reading the initial fluid level of the water tank and the fluid level of each time node, the law of the wall water seepage change over time can be calculated. See Figure 6 for on-site inspection steps.
In summary, the design of NDT-WI-2 is based on the principle of the water drenching method. Its main function is to simulate rainfall scenarios under different combinations. During the test, record the seepage pressure, seepage amount, seepage time, seepage area and evaluate the wall’s impermeability through the anti-seepage performance coefficient grade evaluation method in the regulations. For the main operation steps and code, please refer to Appendix A.

3. On-Site Inspection Case

The NDT-WI-2 instrument is tested by conducting the on-site non-destructive measurement of wall impermeability to explore the influence of water pressure and wind pressure on wall permeability. The test sites are Building No. 3 and Building No. 26 of the Campus of Zhejiang Sci-Tech University, and the specific location is shown in Figure 7.
The test loading water pressure is set to three levels, namely, 100 kPa, 125 kPa and 150 kPa. The loading wind pressure levels are, respectively, 100 Pa, 200 Pa and 300 Pa. Four types of walls are involved, and the specific parameters of each wall are shown in Table 1 and the on-site detection case of each wall is shown in Figure 8. The surface roughness of the following types of walls is different, and the reliability of the non-destructive fixing function of the vacuum suction cup can be further tested during the inspection. When the water tank reading becomes stable (four consecutive readings are the same), the test is stopped and moved to the next test point, but the testing time should last for at least 90 min.

4. Results and Discussion

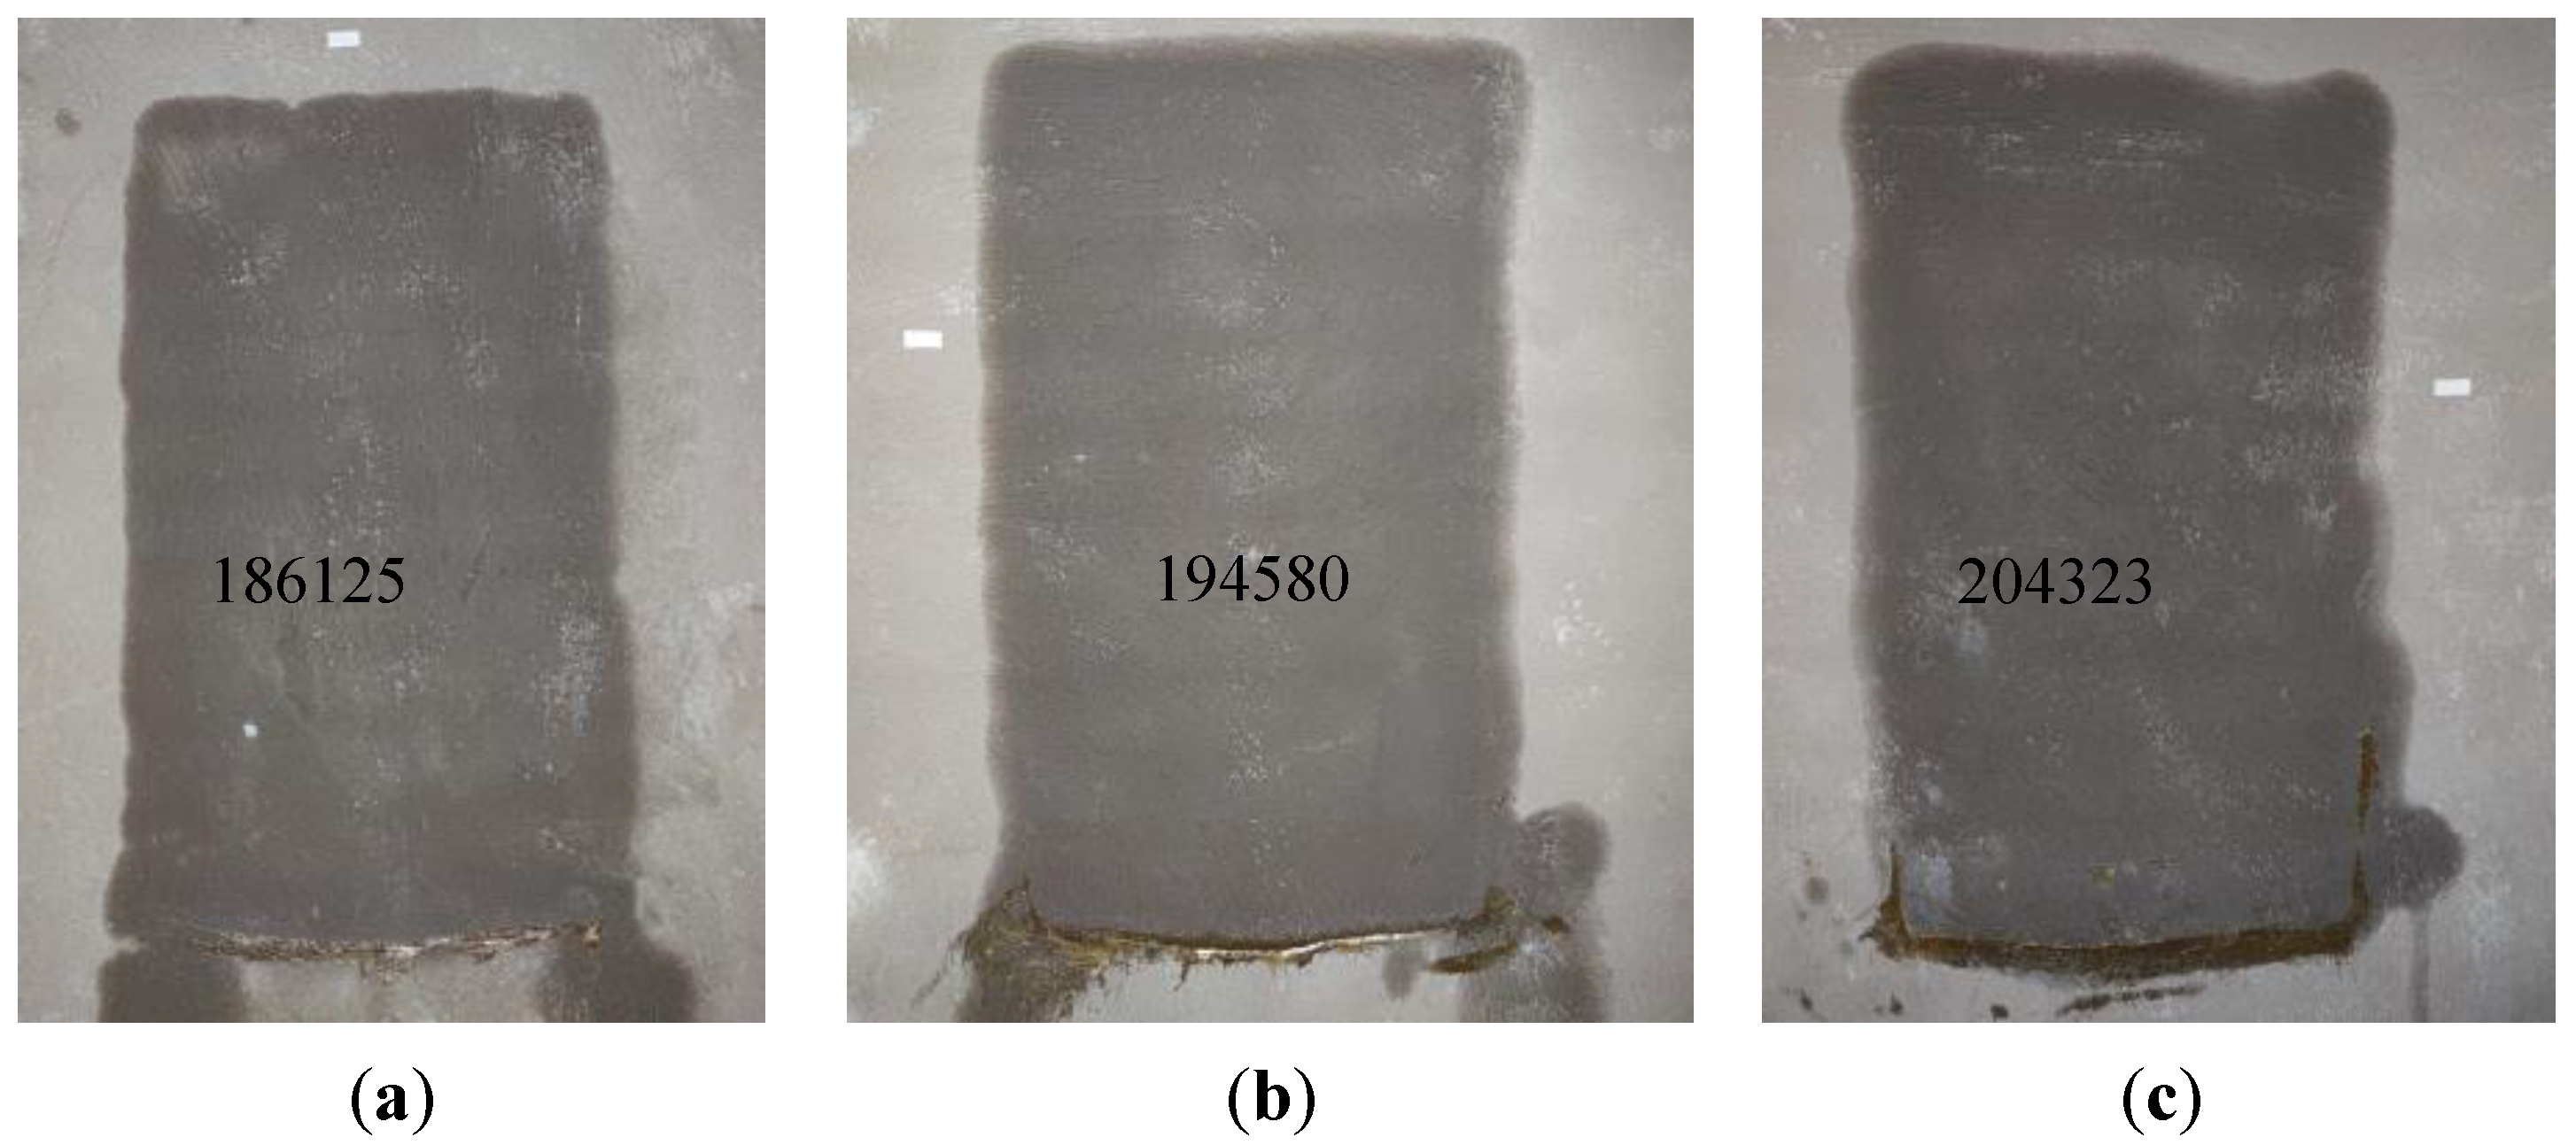
4.1. Influence of Water Pressure

The above-mentioned three levels of water pressure are used to test the permeability of the four types of walls, and the leakage indicators are shown in Table 2.
The test results indicated no leakage on the opposite side of the walls of Type I and III, while leakage occurred on the opposite side of the walls of Type II and IV. This shows that, after surface treatment, the impermeability of the masonry wall will be greatly improved. With the increase in sprayed water pressure, the initial seepage time of similar walls tends to be shortened. In addition, the initial seepage positions are all located at the mortar joints, which can reveal that the mortar joints are weak points of the wall’s impermeability, and the horizontal mortar joints on some walls are the first to leak. This may be because the medium is in the process of vertical mortar joints. Under the action of gravity, the transmission direction will migrate downwards, which will cause the transmission distance to become longer and affect the transmission time. However, there is masonry under the horizontal mortar joint, and the transmission direction is always vertical to the wall, hence leakage occurs more quickly. After comparison, it can be seen that the initial seepage time of the Type IV wall is less than that of the Type II wall. This phenomenon may be related to the size of the masonry. The masonry size of the Type IV wall is much smaller than that of the Type II wall, which means that it is in the same area, the number of mortar joints is larger and the increase in the number of mortar joints as the weak points of the wall’s impermeability will increase the probability of leakage.
The results of the water seepage test are shown in Figure 9, in which the water loss curves of Figure 7b under the action of 125 kPa and 150 kPa spray water pressures overlap. It can be seen from the figure that, at the beginning of the test, the reading of the water tank drops rapidly. As the test progresses, the rate of decline gradually slows down and finally stabilizes. Through observation, it can be seen that the declining level of the water tank in the early stage is greater than that in the later stage, which may have a greater relationship with its surface painting. In the initial stage of spraying, the surface layer is in a dry state and moisture is quickly absorbed, and then it gradually penetrates into the interior under the action of its own gravity, capillary force, power, pressure difference and surface tension. In the case of only increasing the spray strength, the final penetration in similar walls is not much different, but the greater pressure of water confers it a stronger penetration ability in the early stage.
The final water seepage rate of the Type II wall is much greater than that of the Type IV wall, which should be related to the physical properties of its masonry. The autoclaved aerated block has a high porosity and absorbs more moisture than dense shale bricks in a dry state. In addition, after being sprayed for a period of time, the water seepage volume of the Type I and Type III walls gradually stabilizes, while the water seepage volume of the Type II and Type IV walls still keeps increasing at a certain rate, which means that stable seepage channels have formed inside them. As a result, the amount of seeped water continues to rise.

4.2. Influence of Wind Pressure

In order to explore the influence of the “driving rain wind pressure” on leakage, a spray test with a spray intensity of 100 kPa and three levels of wind pressure was conducted. The leakage indicators of the wall are shown in Table 3.
Under varying wind pressure loading conditions, only the opposite side of the Type II and IV walls kept leaking, and the initial seepage position remained at the ash seam. With the increase in wind pressure, the initial seepage time of similar walls was significantly shortened, indicating that driving rain wind pressure has a considerable impact on the rainwater seepage time. Figure 10 shows the development of the leakage pattern on the opposite side of the wall with time under the combined working condition of 125 kPa water pressure and 100 Pa wind pressure for the Type II walls. Based on the preliminary observations, it can be seen that the leakage area on the opposite side of the wall has a trend of substantial increase with time.
As can be seen from Figure 11, as the wind pressure increases, the final water seepage volume of the wall rises significantly. The wind pressure has a much greater impact on the water seepage volume than the water pressure. By comparing the slopes of the graphs, it can be concluded that, under the action of wind pressure, when the walls of Type II and IV reach a stable seepage state, their water seepage rate is significantly greater than that of the no-wind state, which means that the wind pressure plays a great driving force affecting the flow of water in the stable seepage channel.

4.3. Lateral Migration of Water

During the test, it was observed that water not only penetrated in the direction perpendicular to the wall, but it also migrated laterally, especially when additional wind pressure was applied and the lateral migration would be more obvious. Taking the Type III wall as an example, as shown in Figure 12, it is the horizontal migration of water seepage on the wall under the action of 100 kPa sprayed water pressure and third-level wind pressure. The surrounding white part is the size calibration object, and the leakage area is calculated by Image-Pro Plus (IPP) software. The basic operation of image processing by this software mainly includes image acquisition, contrast enhancement, median filtering, gray image, binary image, image segmentation, image measurement and data analysis. It can be observed that, as the wind pressure increases, the water seepage area gradually spreads around and the area continues to expand.

4.4. Test Summary

Four types of walls were tested for their impermeability. Under each combined working condition, no leakage occurred on the back of the surface-treated wall, while the leakage of the untreated wall occurred at the mortar joint. Compared with sprayed water pressure, wind pressure had a more obvious influence on various permeability parameters. In order to improve the impermeability performance, the following suggestions are put forward for the design and construction: (1) Masonry mortar should adopt special mortar with good water retention and bonding properties; (2) Prior to masonry, it must be ensured that the blocks are not damaged. During masonry, the mortar joints should be covered with mortar, and they should be horizontal and vertical.

5. Combined Application of NDT-WI-2 and Regulation

The NDT-WI-2 instrument is to be used in conjunction with the compiled regulations in the later stage to test the impermeability of the wall at the project site. The on-site inspection process is as follows. Before the start of inspection, clarify the inspection regulations and work content, including the choice of sampling methods, inspection units, measurement areas and measurement points. Use NDT-WI-2 to test the impermeability of the wall, and make observations on the wall. On the back side of the leakage throughout the inspection, record the impermeability index data of the masonry wall, analyze and process the data after the test, and use a suitable evaluation system to complete the evaluation of wall impermeability. Finally, issue an evaluation report.

6. Conclusions

  • This instrument can be used as an effective tool for the on-site testing of wall impermeability. Its main advantages are as follows: the modular integrated design facilitates on-site testing; the non-destructive fixing system can meet the needs of a variety of roughness types of walls; it features a functional system that simulates the effect of “driving rain wind pressure”; and the instrument realizes integral water circulation, which saves water resources and can more accurately quantify water seepage data at the same time.
  • The ash joint is the weak point of wall leakage. After surface treatment, the impermeability of the masonry wall will be greatly improved. When leakage occurs, it indicates that there is at least one stable leakage channel inside the wall. The actual measurement results show that the influence of wind pressure intensity change on the leakage parameters is significantly greater than that of the spray intensity change. Moreover, wall penetration is often accompanied by lateral migration. The greater the wind pressure, the more obvious the migration effect.
  • In the future, walls in different deterioration states can be tested, and the influence of factors such as insulation layer and cracks on the penetration results can also be considered. Finally, combining various detection techniques and mathematical statistics methods, the permeability index can be quantified and the corresponding weights can be solved to establish a wall impermeability evaluation system.
  • According to the on-site inspection feedback, NDT-WI-2 still has room for optimization. In further research, lighter and smarter functional components can be adopted to enhance the overall portability and operability of the instrument.

Author Contributions

Conceptualization, J.F.; methodology, J.F.; software, Y.X.; validation, Y.X.; formal analysis, J.F. and Y.X.; investigation, Y.X.; resources, J.F.; writing—original draft preparation, Y.X.; writing—review and editing, J.F. and Y.S.; project administration, J.F.; funding acquisition, J.F. All authors have read and agreed to the published version of the manuscript.

Funding

This research was funded by the Zhejiang Basic Public Welfare Research Project (LGF8E080016, GN22E087096 and LGN22E080004) and China Association for Engineering Construction Standardization (2019-110). The authors are grateful for the financial support.

Institutional Review Board Statement

Not applicable.

Informed Consent Statement

Not applicable.

Data Availability Statement

Data supporting the reported results can be found in the body of the paper.

Conflicts of Interest

The authors declare that they have no conflict of interest.

Appendix A

1. The regulations stipulate four test levels of A, B, C and D. Determine the impermeability level according to the impermeability performance coefficient in Table A1.
Table A1. Determination table of impermeability grade.
Impermeability Coefficient0.8 ≤ y < 1.00.6 ≤ y < 0.80.4 ≤ y < 0.60.2 ≤ y < 0.4
Impermeability LevelLevel ALevel BLevel CLevel D
2. The method for determining the wall impermeability coefficient y is shown in Equations (A1) and (A2).
y = w 1 x ¯ 1 * + w 2 x ¯ 2 * + + w 3 x ¯ 3 * + + w m x ¯ m *
x ¯ i * = 1 n j = 1 n x i j *
In the equation, y denotes the impermeability coefficient; Wi denotes the weight of the i-th evaluation indicator; and x ¯ i * denotes the arithmetic mean of the i-th evaluation index after dimensionless processing.
3. The method for determining the indicator weight Wi is shown in Equations (A3)–(A6).
(1) Select m evaluation indicators for a single wall, and take n ≥ 10 measurement points for each evaluation indicator to obtain the measurement point matrix A:
A = [ X 11 X m 1 X 1 n X mn ]
(2) Calculate the evaluation matrix H:
H = A T A
(3) Solve the eigenvector W corresponding to the largest eigenvalue of the evaluation matrix H:
W = [ w 1 , w i , w m ]
(4) Calculate the eigenvector Wi according to Equation (A6) to obtain the weight of each indicator:
W i = W i i m W
The python code to implement the above calculation is as follows:
import numpy as np
import pandas as pd
import math
def Normalization(x):
  “““Nondimensionalization”””
  x = (x−np.mean(x))/np.std(x)
  return x
def MaxNormalization(x):
  “““[0, 1] normaliaztion”””
  x = (x−np.min(x))/(np.max(x)−np.min(x))
  return x
def MinNormalization(x):
  “““[0, 1] normaliaztion”””
  x = (np.max(x)−x)/(np.max(x)−np.min(x))
  return x
def Norm(x):
  x = x/np.sum(x)
  return x
def Round(w):
  for i in range(len(w)):
    w[i] = round(w[i], 3)
  return w
# read data
A1 = np.array(pd.read_csv(r’file location’, usecols = [0, 1, 2, 3, 4]))
B1 = np.zeros((A1.shape[0], A1.shape[1]))
# Normalized
B1[:, 0] = MaxNormalization(A1[:, 0])
B1[:, 1] = MaxNormalization(A1[:, 1])
B1[:, 2] = MinNormalization(A1[:, 2])
B1[:, 3] = MaxNormalization(A1[:, 3])
B1[:, 4] = MinNormalization(A1[:, 4])
# Evaluation matrix
H1 = np.dot(B1.T, B1)
print(‘Evaluation matrix: \n{}’.format(H1))
Coordinates = pd.DataFrame(np.mat(H1))
Coordinates.to_csv(“./result.csv”, header = 0, index = 0)
# Eigenvalues and Eigenvectors
a, b = np.linalg.eig(H1)
print(‘Eigenvalues a: \n{}’.format(a))
print(‘Eigenvectors b: \n{}’.format(b))
wpie = b[:, 0]
print(‘largest eigenvector: \n’, Round(wpie))
w = Norm(wpie)
print(‘Weights: \n’, Round(w))
Coordinates = pd.DataFrame(np.mat(Round(w)))
Coordinates.to_csv(“./result.csv”, header = 0, index = 0, mode = ‘a’)

References

  1. Tang, W.; Davidson, C.; Finger, S.; Vance, K. Erosion of limestone building surfaces caused by wind-driven rain: 1. Field measurements. Atmos. Environ. 2004, 38, 5589–5599. [Google Scholar] [CrossRef]
  2. PAHO/WHO. Environmental burden of disease associated with inadequate housing. Ultrasound Obstet. Gynecol. 2011, 24, 323. [Google Scholar]
  3. Breysse, D.; Balayssac, J.P.; Biondi, S.; Corbett, D.; Goncalves, A.; Grantham, M.; Luprano, V.A.M.; Masi, A.; Monteiro, A.V.; Sbartai, Z.M.; et al. Recommendation of RILEM TC249-ISC on non destructive in situ strength assessment of concrete. Mater. Struct. 2019, 52, 1–21. [Google Scholar] [CrossRef]
  4. Breysse, D.; Balayssac, J.P.; Biondi, S.; Borosnyói, A.; Candigliota, E.; Chiauzzi, L.; Garnier, V.; Grantham, M.; Gunes, O.; Luprano, V.; et al. Non destructive assessment of in situ concrete strength: Comparison of approaches through an international benchmark. Mater. Struct. 2017, 50, 133. [Google Scholar] [CrossRef]
  5. Ali-Benyahia, K.; Sbarta, Z.M.; Breysse, D.; Kenai, S.; Ghrici, M. Analysis of the single and combined non-destructive test approaches for on-site concrete strength assessment: General statements based on a real case-study. Case Stud. Constr. Mater. 2017, 6, 109–119. [Google Scholar] [CrossRef]
  6. Porco, F.; Ruggieri, S.; Uva, G. Seismic assessment of irregular existing building: Appraisal of the influence of compressive strength variation by means of nonlinear conventional and multimodal static analysis. Ing. Sismica 2018, 35, 64–86. [Google Scholar]
  7. Yang, Y.; Lu, H.; Tan, X.; Chai, H.K.; Wang, R.; Zhang, Y. Fundamental mode shape estimation and element stiffness evaluation of girder bridges by using passing tractor-trailers. Mech. Syst. Signal Processing 2022, 169. [Google Scholar] [CrossRef]
  8. Yang, Y.; Zhang, Y.; Tan, X. Review on Vibration-Based Structural Health Monitoring Techniques and Technical Codes. Symmetry. 2021, 13, 1998. [Google Scholar] [CrossRef]
  9. Yang, Y.; Ling, Y.; Tan, X.; Wang, S.; Wang, R. Damage identification of frame structure based on approximate Metropolis–Hastings algorithm and probability density evolution method. Int. J. Struct. Stab. Dyn. 2022, 2240014. [Google Scholar] [CrossRef]
  10. Levitt, M. Non-destructive Testing of concrete by the initial surface absorption method. Inst. Civ. Engneers 1970, 23–26. Available online: www.icevirtuallibrary.com/doi/abs/10.1680/ntocats.44685.0005 (accessed on 24 April 2022).
  11. Komárková, T.; Králíková, M.; Kocáb, D.; Misák, P.; Stavař, T. Comparison of standardized test methods for Determining the Permeability of the Surface Layer of Concrete. Adv. Mater. Res. 2015, 1122, 141–144. [Google Scholar] [CrossRef]
  12. Stehlik, M. Enhancing the durability of concrete made of concrete recyclate by additives and admixtures. J. Civ. Eng. Manag. 2014, 20, 270–279. [Google Scholar] [CrossRef]
  13. Al-Kheetan, M.J.; Rahman, M.M.; Chamberlain, D.A. Optimum Mix Design for Internally Integrated Concrete with Crystallizing Protective Material. J. Mater. Civ. Eng. 2019, 31, 1–8. [Google Scholar] [CrossRef] [Green Version]
  14. Khan, R.A.; Sharma, A. Durability properties of self compacting concrete containing fly ash, lime powder and metakaolin. J. Mater. Eng. Struct. 2015, 2, 206–212. [Google Scholar]
  15. Basheer, P.A.M.; Montgomery, F.R.; Long, A.E. The autoclam permeability system for measuring the in situ permeation properties of concrete. In Proceedings of the Conference Proceedings of the British Institute of Non-destructive Testing International Conference, Liverpool, UK, 14–16 April 1993; Volume 1. [Google Scholar]
  16. Liu, J.; Xing, F.; Dong, B.; Ma, H.; Pan, D. Study on water sorptivity of the surface layer of concrete. Mater. Struct. 2014, 47, 1941–1951. [Google Scholar] [CrossRef]
  17. Yang, K.; Basheer, P.A.M.; Bai, Y.; Magee, B.J.; Long, A.E. Development of a new in situ test method to measure the air permeability of high performance concretes. NDT E Int. 2014, 64, 30–40. [Google Scholar] [CrossRef]
  18. Kubissa, W.; Glinicki, M.A.; Dąbrowski, M. Permeability testing of radiation shielding concrete manufactured at industrial scale. Mater. Struct. 2018, 51, 1–15. [Google Scholar] [CrossRef] [Green Version]
  19. Zheng, Y.G.; Li, H.Q. Evaluation of protective quality of prestressed concrete containment buildings of nuclear power plants. J. Cent. South. Univ. Technol. 2011, 18, 238–243. [Google Scholar] [CrossRef]
  20. Hao, T.Y.; Wu, Z.G. Assessment of concrete permeability by a nondestructive method. Key Eng. Mater. 2009, 802, 309–314. [Google Scholar] [CrossRef]
  21. Li, J.L.; Yang, Q.D.; Tang, J. Research on key technologies of concrete structure 100-year durability of the national stadium for Beijing 2008 Olympic Games. In Proceedings of the Shanghai International Conference on Technology of Architecture and Structure (ICTAS2009) (Ⅱ), Shanghai, China, 15 October 2009. [Google Scholar]
  22. Jia, L.; Shi, C.; Pan, X.; Zhang, J.; Wu, L. Effects of inorganic surface treatment on water permeability of cement-based materials. Cem. Concr. Compos. 2016, 67, 85–92. [Google Scholar] [CrossRef]
  23. Torrent, R.J. A two-chamber vacuum cell for measuring the coefficient of permeability to air of the concrete cover on site. Mater. Struct. 1992, 25, 358–365. [Google Scholar] [CrossRef]
  24. Basheer, P.A.M.; Andrews, R.J.; Robinson, D.J.; Long, A.E. ‘PERMIT’ ion migration test for measuring the chloride ion transport of concrete on site. NDT E Int. 2005, 38, 219–229. [Google Scholar] [CrossRef]
  25. Figg, J.W. Methods of measuring the air and water permeability of concrete. Mag. Concr. Res. 1973, 25, 213–219. [Google Scholar] [CrossRef]
  26. Andrzej, M.; Marta, M. GWT—New testing system for “in situ” measurements of concrete water permeability. Procedia Eng. 2016, 153, 483–489. [Google Scholar] [CrossRef] [Green Version]
  27. Martin, G.R. A method for determining the relative permeability of concrete using gas. Mag. Concr. Res. 1986, 38, 90–94. [Google Scholar] [CrossRef]
  28. Dhir, R.K.; Hewlett, P.C.; Chan, Y.N. Near-surface characteristics of concrete: Assessment and development of in situ test methods. Mag. Concr. Res. 1987, 39, 183–195. [Google Scholar] [CrossRef]
  29. Dhir, R.K.; Byars, E.A. PFA concrete: Near surface absorption properties. Mag. Concr. Res. 1991, 43, 219–232. [Google Scholar] [CrossRef]
  30. Claisse, P.A.; Ganjian, E.; Adham, T.A. A vacuum-air permeability test for in situ assessment of cover concrete. Cem. Concr. Res. 2003, 33, 47–53. [Google Scholar] [CrossRef]
  31. Yang, H.; Liu, R.; Zhuo, Z.; Liu, H.; Gao, Y.; Liu, Y. Experimental study on permeability of concrete. IOP Conf. 2018, 108, 022067. [Google Scholar] [CrossRef]
  32. Naderi, M.; Kaboudan, A. Cylindrical Chamber: A new in situ method for measuring permeability of concrete with and without admixtures. J. Test. Eval. 2020, 48, 2225–2241. [Google Scholar] [CrossRef]
  33. Qian, T.; Zhang, H. Assessment of long-term and extreme exposure to wind-driven rain for buildings in various regions of China. Build. Environ. 2021, 189, 107524. [Google Scholar] [CrossRef]
  34. Vutukuru, K.S.; Moravej, M.; Elawady, A.; Chowdhury, A.G. Holistic testing to determine quantitative wind-driven rain intrusion for shuttered and impact resistant windows. J. Wind Eng. Ind. Aerodyn. 2020, 206, 104359. [Google Scholar] [CrossRef]
  35. Domínguez-Hernández, J.; Pérez-Bella, J.M.; Alonso-Martínez, M.; Cano-Suñén, E.; del Coz-Díaz, J.J. Assessment of water penetration risk in building facades throughout Brazil. Build. Res. Informat. 2016, 45, 492–507. [Google Scholar] [CrossRef]
  36. Pérez-Bella, J.M.; Dominguez-Hernandez, J.; Cano-Suñén, E.; del Coz-Diaz, J.J.; Martin-Rodriguez, A. Procedure for a detailed territorial assessment of wind-driven rain and driving-rain wind pressure and its implementation to three Spanish regions. J. Wind Eng. Ind. Aerodyn. 2014, 128, 76–89. [Google Scholar] [CrossRef]
  37. Fu, J.; Yu, Y. Experimental study on pore characteristics and fractal dimension calculation of pore structure of aerated concrete block. Adv. Civ. Eng. 2019, 2019. [Google Scholar] [CrossRef] [Green Version]
  38. Fu, J.; Yu, Y.; Yie, J.B. Water permeation simulation of autoclaved aerated concrete blocks using the Lattice Boltzmann method. Mag. Civil. Eng. 2019, 5, 106–114. [Google Scholar]
  39. Xing, H.Y.; Zhang, Y.B.; Huang, W.Y. Design and simulation of drum solid-state fermentation equipment based on solidworks. Adv. Mater. Res. 2012, 476, 438–442. [Google Scholar] [CrossRef]
  40. Altalmas, T.M.; Ahmad, S.; Aula, A.; Akmeliawati, R.; Sidek, S.N. Mechanical design and simulation of two-wheeled wheelchair using solidworks. IOP Conf Ser. Mater. Sci. Eng. 2013, 53, 012042. [Google Scholar] [CrossRef] [Green Version]
  41. Han, S.; Liu, X. Parametric System Design of Belt Conveyor Legs Based on SolidWorks. In Proceedings of the 2019 International Conference on Electronical. Mechanical and Materials Engineering (ICE2ME 2019), Wuhan, China, 20 January 2019. [Google Scholar]
  42. Matsumoto, Y.; Kurashige, I.; Kan, Y. Development of Concrete Inspection Robot with Dual Stage Suckers. J. Robot. Mechatron. 2019, 31, 816–826. [Google Scholar] [CrossRef]
  43. Yang, W.; Yang, C.; Zhang, R.; Zhang, W. A Novel Worm-inspired Wall Climbing Robot with Sucker-microspine Composite Structure. In Proceedings of the 2018 3rd International Conference on Advanced Robotics and Mechatronics (ICARM), Singapore, 18–20 July 2018; pp. 744–749. [Google Scholar]
Figure 1. Instrument structure and function diagram.
Symmetry 14 00987 g001
Figure 2. Roadmap of instrument manufacturing.
Symmetry 14 00987 g002
Figure 3. NDT-WI-2 3D model. (a) Three-dimensional model of the front of NDT-WI-2; (b) Three-dimensional model of the back of NDT-WI-2.
Symmetry 14 00987 g003
Figure 4. Second-generation wall impermeability testing instrument.
Symmetry 14 00987 g004
Figure 5. Nozzle layout and details (unit: mm).
Symmetry 14 00987 g005
Figure 6. Flowchart of test operation.
Symmetry 14 00987 g006
Figure 7. Location map of Building 3 and Building 26.
Symmetry 14 00987 g007
Figure 8. On-site detection case. (a) Autoclaved aerated concrete block (I); (b) Autoclaved aerated concrete block (II); (c) Shale brick (III); (d) Shale brick (IV).
Symmetry 14 00987 g008
Figure 9. The amount of water seepage varies with spray intensity. (a) Type I wall; (b) Type III wall; (c) Type II wall; (d) Type IV wall.
Symmetry 14 00987 g009
Figure 10. Development of leakage patterns. (a) Initial infiltration form; (b) Leakage form at 10 min; (c) Leakage form at 20 min; (d) Leakage form at 30 min.
Symmetry 14 00987 g010
Figure 11. The amount of seepage changes with wind pressure. (a) Type I wall; (b) Type III wall; (c) Type II wall; (d) Type IV wall.
Symmetry 14 00987 g011
Figure 12. The horizontal migration area of water seepage on the spray surface. (a) 100 Pa wind pressure; (b) 200 Pa wind pressure; (c) 300 Pa wind pressure (unit: mm2).
Symmetry 14 00987 g012
Table 1. Wall parameters.
Type of WallBlock SizeIntensity LevelDensity LevelMortar Strength LevelVolumetric Weight (kN/m3)Surface Condition
Autoclaved aerated concrete block (I)600 × 240 × 200A5.0B06M58Mortar leveling
Autoclaved aerated concrete block (II)600 × 240 × 200A5.0B06M58No treatment
Shale brick (III)240 × 115 × 53Mu10-M514Mortar leveling
Shale brick (IV)240 × 115 × 53Mu10-M514No treatment
Table 2. Leakage index record of each wall under three levels of sprayed water pressure.
Wall Type100 kPa125 kPa150 kPa
Initial Infiltration
Time (min)
Initial
Infiltration Position
Seepage Amount
(L)
Initial Infiltration Time (min)Initial Infiltration PositionSeepage Amount
(L)
Initial Infiltration Time (min)Initial Infiltration PositionSeepage Amount
(L)
INo leakageWithout0.38No leakageWithout0.44No leakageWithout0.44
II8Horizontal gray seam4.698Horizontal gray seam56Horizontal gray seam5.25
IIINo leakageWithout0.56No leakageWithout0.63No leakageWithout0.63
IV4Horizontal and vertical gray seam connection1.943Horizontal gray seam2.193Horizontal and vertical gray seam connection2.38
Table 3. Leakage index record of each wall under three levels of wind pressure.
Wall Type100 Pa200 Pa300 Pa
Initial Infiltration Time (min)Initial Infiltration PositionSeepage Amount
(L)
Initial Infiltration Time (min)Initial Infiltration PositionSeepage Amount
(L)
Initial InfiltrationTime (min)Initial Infiltration PositionSeepage Amount
(L)
INo leakageWithout0.56No leakageWithout0.69No leakageWithout0.88
II6Horizontal gray seam5.384Horizontal gray seam7.063Horizontal gray seam9
IIINo leakageWithout0.63No leakageWithout0.75No leakageWithout0.94
IV3Horizontal gray seam2.063Horizontal and vertical gray seam connection2.442Horizontal and vertical gray seam connection2.63
Publisher’s Note: MDPI stays neutral with regard to jurisdictional claims in published maps and institutional affiliations.

