Article

The Cooperative Control of Subgrade Stiffness on Symmetrical Bridge–Subgrade Transition Section

1
Jinhua Highway and Transportation Management Center, Jinhua 321000, China
2
Highway School, Chang’an University, Xi’an 710064, China
3
Jinhua Wucheng District Highway and Transportation Management Center, Jinhua 321000, China
*
Author to whom correspondence should be addressed.
Symmetry 2022, 14(5), 950; https://doi.org/10.3390/sym14050950
Submission received: 17 March 2022 / Revised: 21 April 2022 / Accepted: 26 April 2022 / Published: 6 May 2022
(This article belongs to the Topic Artificial Intelligence (AI) Applied in Civil Engineering)

Abstract

:
In the field of civil engineering and architecture, the concept of symmetry has been widely accepted. The bridge can be treated as a typical symmetrical structure of civil engineering buildings. Among them, the Subgrade can be identified as an important part to bear the vehicle loads. Severe pavement problems and bridge service capabilities will be caused by problems of the bridge–subgrade transition section. Therefore, setting the rigid–flexible transition is an important method to solve this problem. The bridge–subgrade transition section has been set at both ends of the bridge, which can be regarded as a typical symmetrical structure. Based on nonlinear finite element numerical simulation and synergistic theory, the cooperative control problems of the bridge–subgrade transition section were studied in this work. The change rule of the stiffness of the transition section was discussed and the influence of stiffness variation of the bridge–subgrade transition section on the stress state of the structure was also analyzed. Furthermore, the influence of subgrade stiffness change on the stress and strain field was analyzed. A permanent strain prediction model was established and stiffness or subsidence difference coordination control was also discussed.

1. Introduction

The bridge–subgrade transition section is the connection between bridge and pavement. The transition section is set at the bridge head and tail, so it can be regarded as a typical symmetrical structure. This section can balance the stiffness difference and settlement difference of the two structures and increase the pavement’s integral continuity. Due to the lack of processing bridge–subgrade transition sections during the engineering design process, construction control is not effective, and the problems of operation or maintenance technology are unreasonable. It will lead to the following two kinds of problems in transition section, widely. First, the pavement structure of the transition section produces a settlement or fracture in retailing backwall. Second, the vehicles have obvious bumps when they pass the transition section, which is the so-called “bump at bridge-head”. Because the bridge–subgrade transition section is set symmetrically, the “bump at bridge-head” occurs when the driver drives into and out of the bridge.
Wahls thought the step height of 1.2 cm would produce the bump effect [1]. Strak et al. found the step height of 2.5 cm would produce the bump effect [2,3]. This problem would bring many undesirable results such as affecting driving comfort, forcing vehicle deceleration, influencing pavement service performance and transportation efficiency, affecting service life of the vehicle, and leading to traffic accidents [4]. The problems of the bridge–subgrade transition section have become one of the important factors that affect pavement service ability seriously. Therefore, it is necessary to put forward a more reasonable design method to solve the problem of the bridge–subgrade transition section.
There are many factors that can cause the vehicle dumping effect. Researchers have paid a lot of effort to solve the “bump at bridge-head”, and foundation treatment, subgrade treatment, and surface treatment are common preventive measures [5]. However, many practical projects showed that a simple “rigid–flexible transition” design of bridge–subgrade transition section cannot fundamentally solve the transitional problem. In this work, the change of stress and strain caused by loads in subgrade and base was explored to solve the vehicle dumping problem. The difference between the stiffness and the settlement was analyzed [6,7], and the effect of the stiffness variation of the subgrade on the stress state of the transition section was discussed by using finite element analysis [8,9].

2. Numerical Model and Parameters

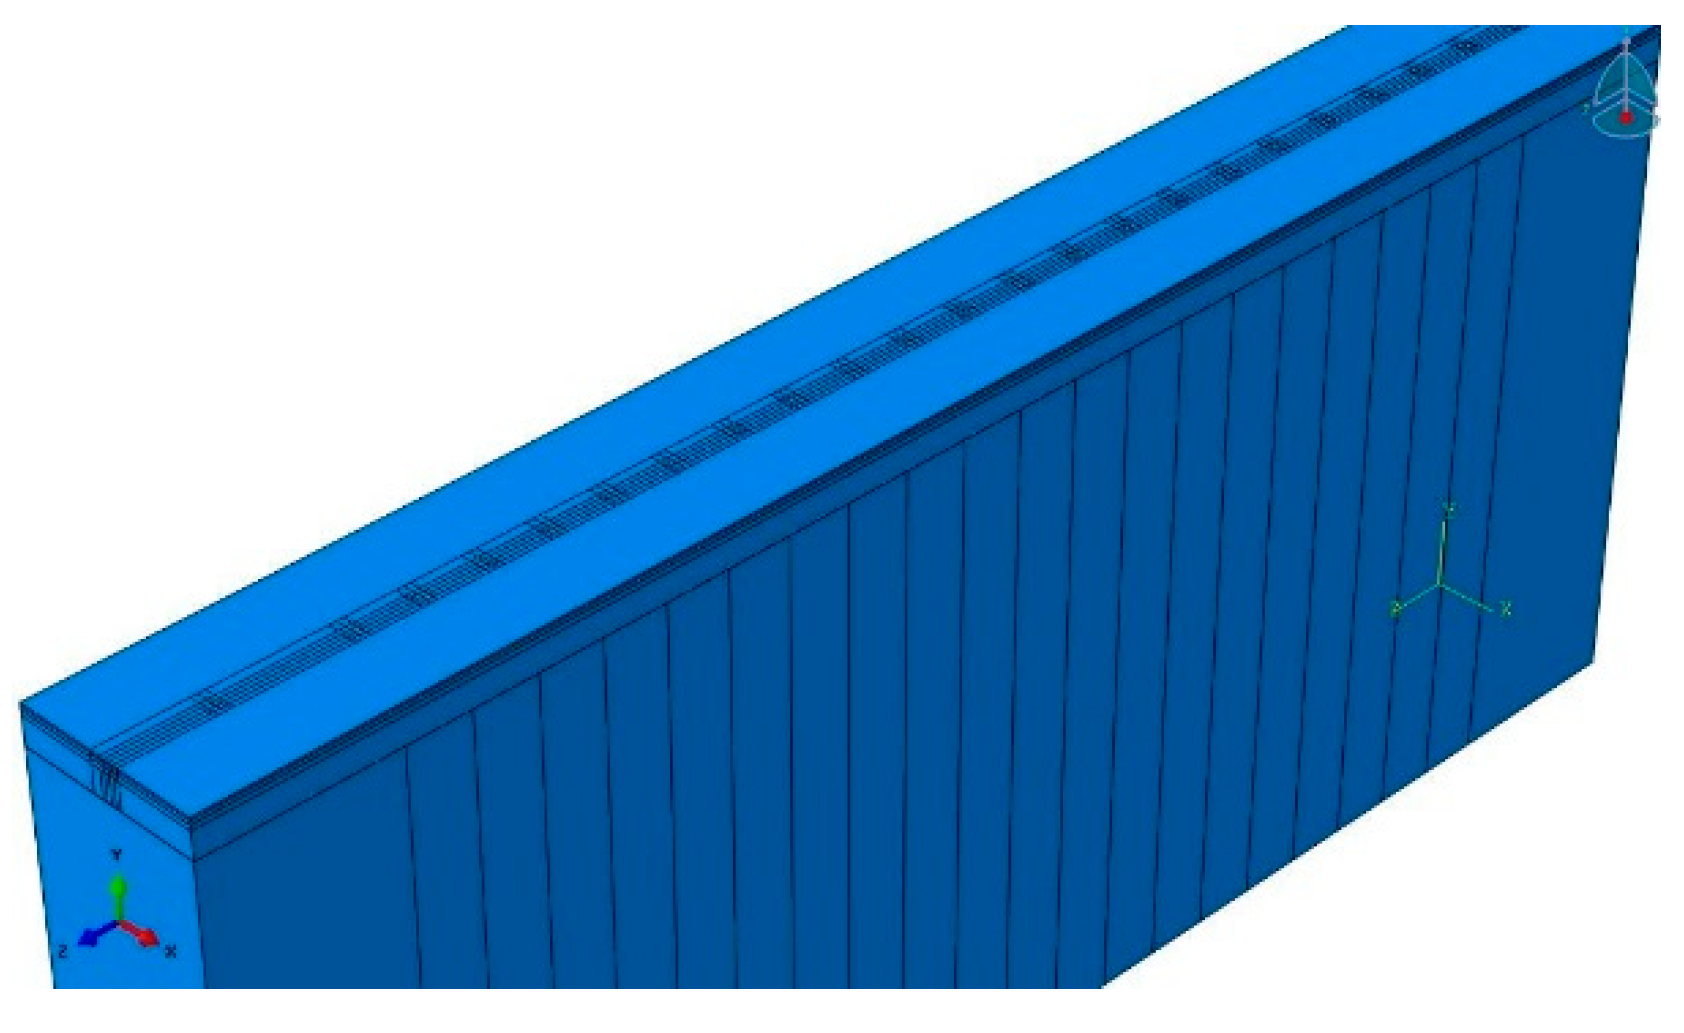
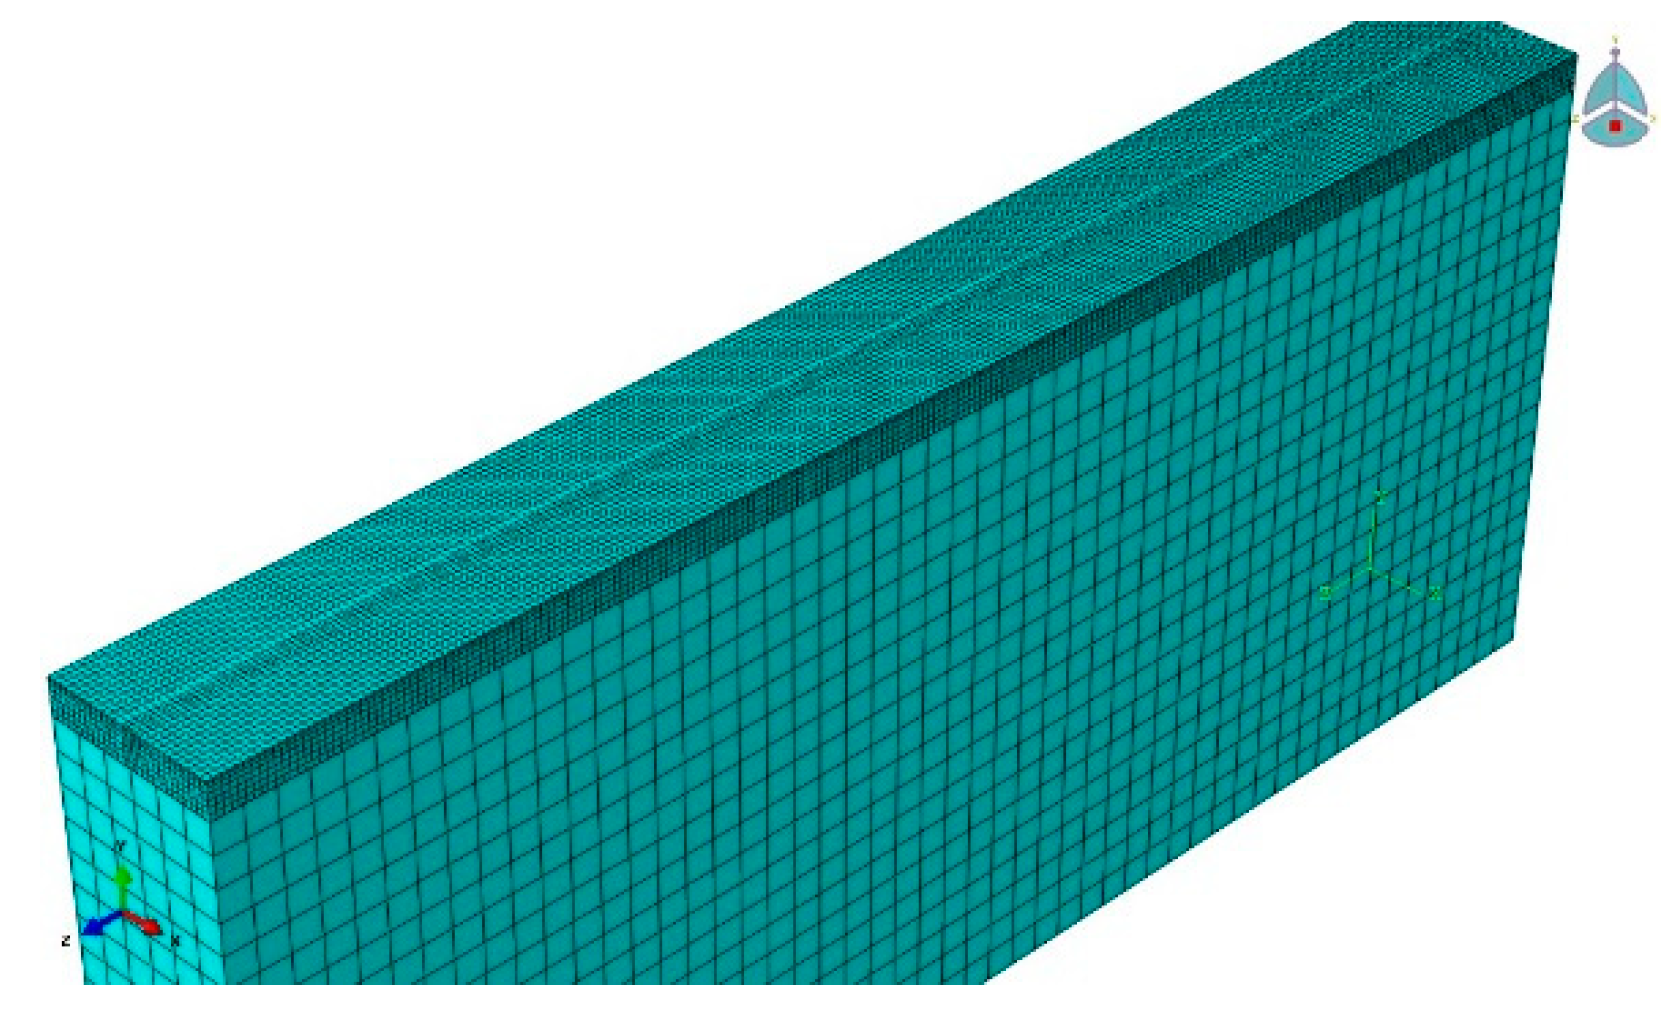
2.1. Geometric Parameter

The numerical model of bridge–subgrade transition section was established. The length of the model was 26 m and the width was 4 m. Also, the pavement type of this model was semi-rigid asphalt, of which the thick of upper layer, middle layer, lower layer, and base were 4 cm, 6 cm, 8 cm, and 40 cm, respectively, as shown in Figure 1. In order to achieve a continuous change of subgrade stiffness longitudinally along the pavements in the transition section, the subgrade structure was divided into 22 parts in this paper. The length of both ends was 3 m, and the rest of the parts were all 1 m, as shown in Figure 2. When conducting parametric analysis, each part was endowed with the material parameters of continuous change to describe the nature of the transition section stiffness change.
The large difference in stiffness between abutment and backfill at the junction of pavement and bridge, and the stress response generated by vehicle load is transmitted to the junction. However, most of the energy is reflected back on the surface of the abutment, and only a small part is transmitted to the inside abutment. The stress response of the abutment was not considered in this work of establishing numerical model. It is assumed that all the loads transmitted to the junction can be reflected back to the subgrade. Therefore, horizontal constraint conditions are adopted at the junction of pavement and bridge in the model.

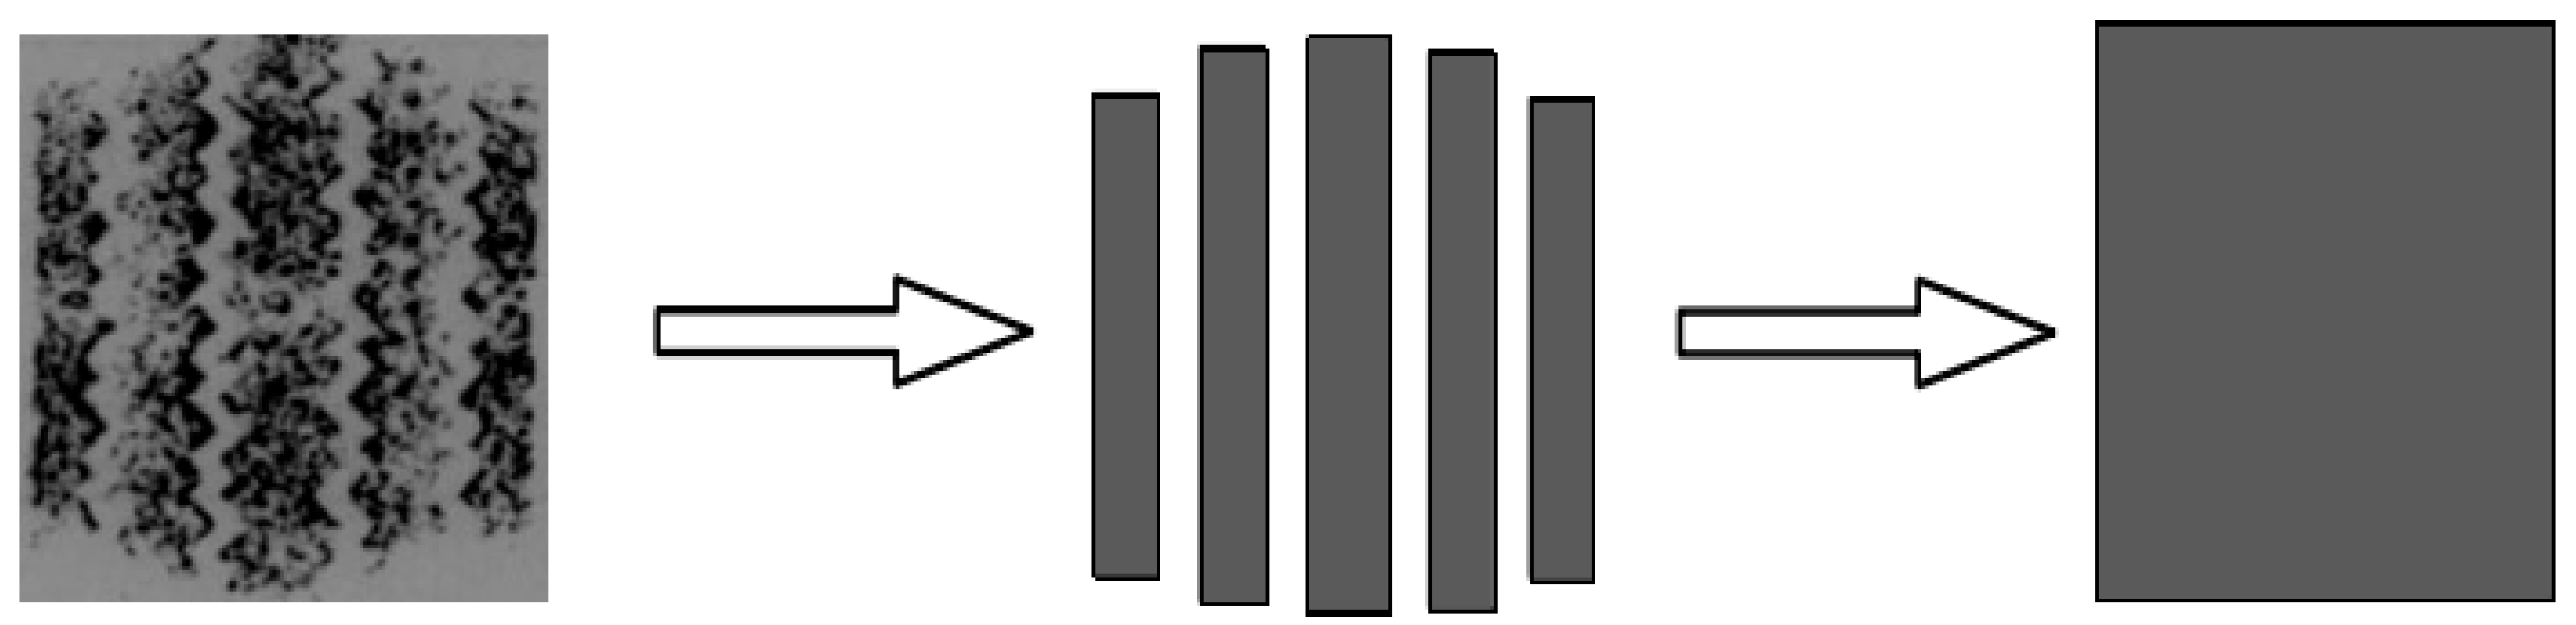
2.2. Simplified Model of Load

Using the existing theory to analyze pavement stress state, the vehicle load was simplified to a circular uniform distributed load. A large number of investigations and experimental research results showed that the shape of the wheel contacting with the pavement was closer to a rectangle and indicated a non-uniform characteristic phenomenon [10]. Based on the comprehensive research results, Figure 3 can be selected as the simplified model of wheel load, the double-type load was simplified into distributed pressure of two rectangular loads. The dimensions were 0.22 m × 0.16 m. The distance between two rectangular centers was 0.32 m, and load intensity was 0.7 MPa.

2.3. Material Parameters

Assuming that each of the layer structures was line elastomer, the elastic modulus and Poisson’s ratio were control parameters. This paper focused on the influence of subgrade stiffness on the pavement structure, and a combination structure of semi-rigid pavement, structural grouping, and material parameters were shown in Table 1.
The subgrade material was used as the analytical parameter of the material in this paper. It was assumed that the variation of subgrade stiffness is from 30,000 MPa to 40 MPa and corresponding Poisson’s ratio ranges from 0.2 to 0.35, as shown in Table 1.

3. The Influence of Changes in the Way the Stiffness of Bridge–Subgrade Transition Section on Structural Stress State

3.1. Selecting the Calculation Index

When ignoring the stiffness difference between the abutments and bridge–subgrade transition section, the stiffness of the internal bridge–subgrade transition section varies continuously. Although there is no stress concentration phenomenon, stiffness changes within a certain range and it can also cause stress redistribution in the transition section of the pavement structure. Considering that the pavement structure has different stiffness sensitivities, the stress state of pavement may exceed the strength of pavement structure when the stiffness has decreased to a certain value. Based on the results, according to the stress characteristics, the stress magnitude, and variation range of each structural pavement layers, four indicators can be selected as the pavement surface deflection value. Tensile strain at the bottom of the middle layer, tensile stress at the bottom of the base layer, and subgrade top surface compressive strain were selected to describe the stress state change in the pavement structure of the transition section when the subgrade stiffness decreases along the pavement by the longitudinal.

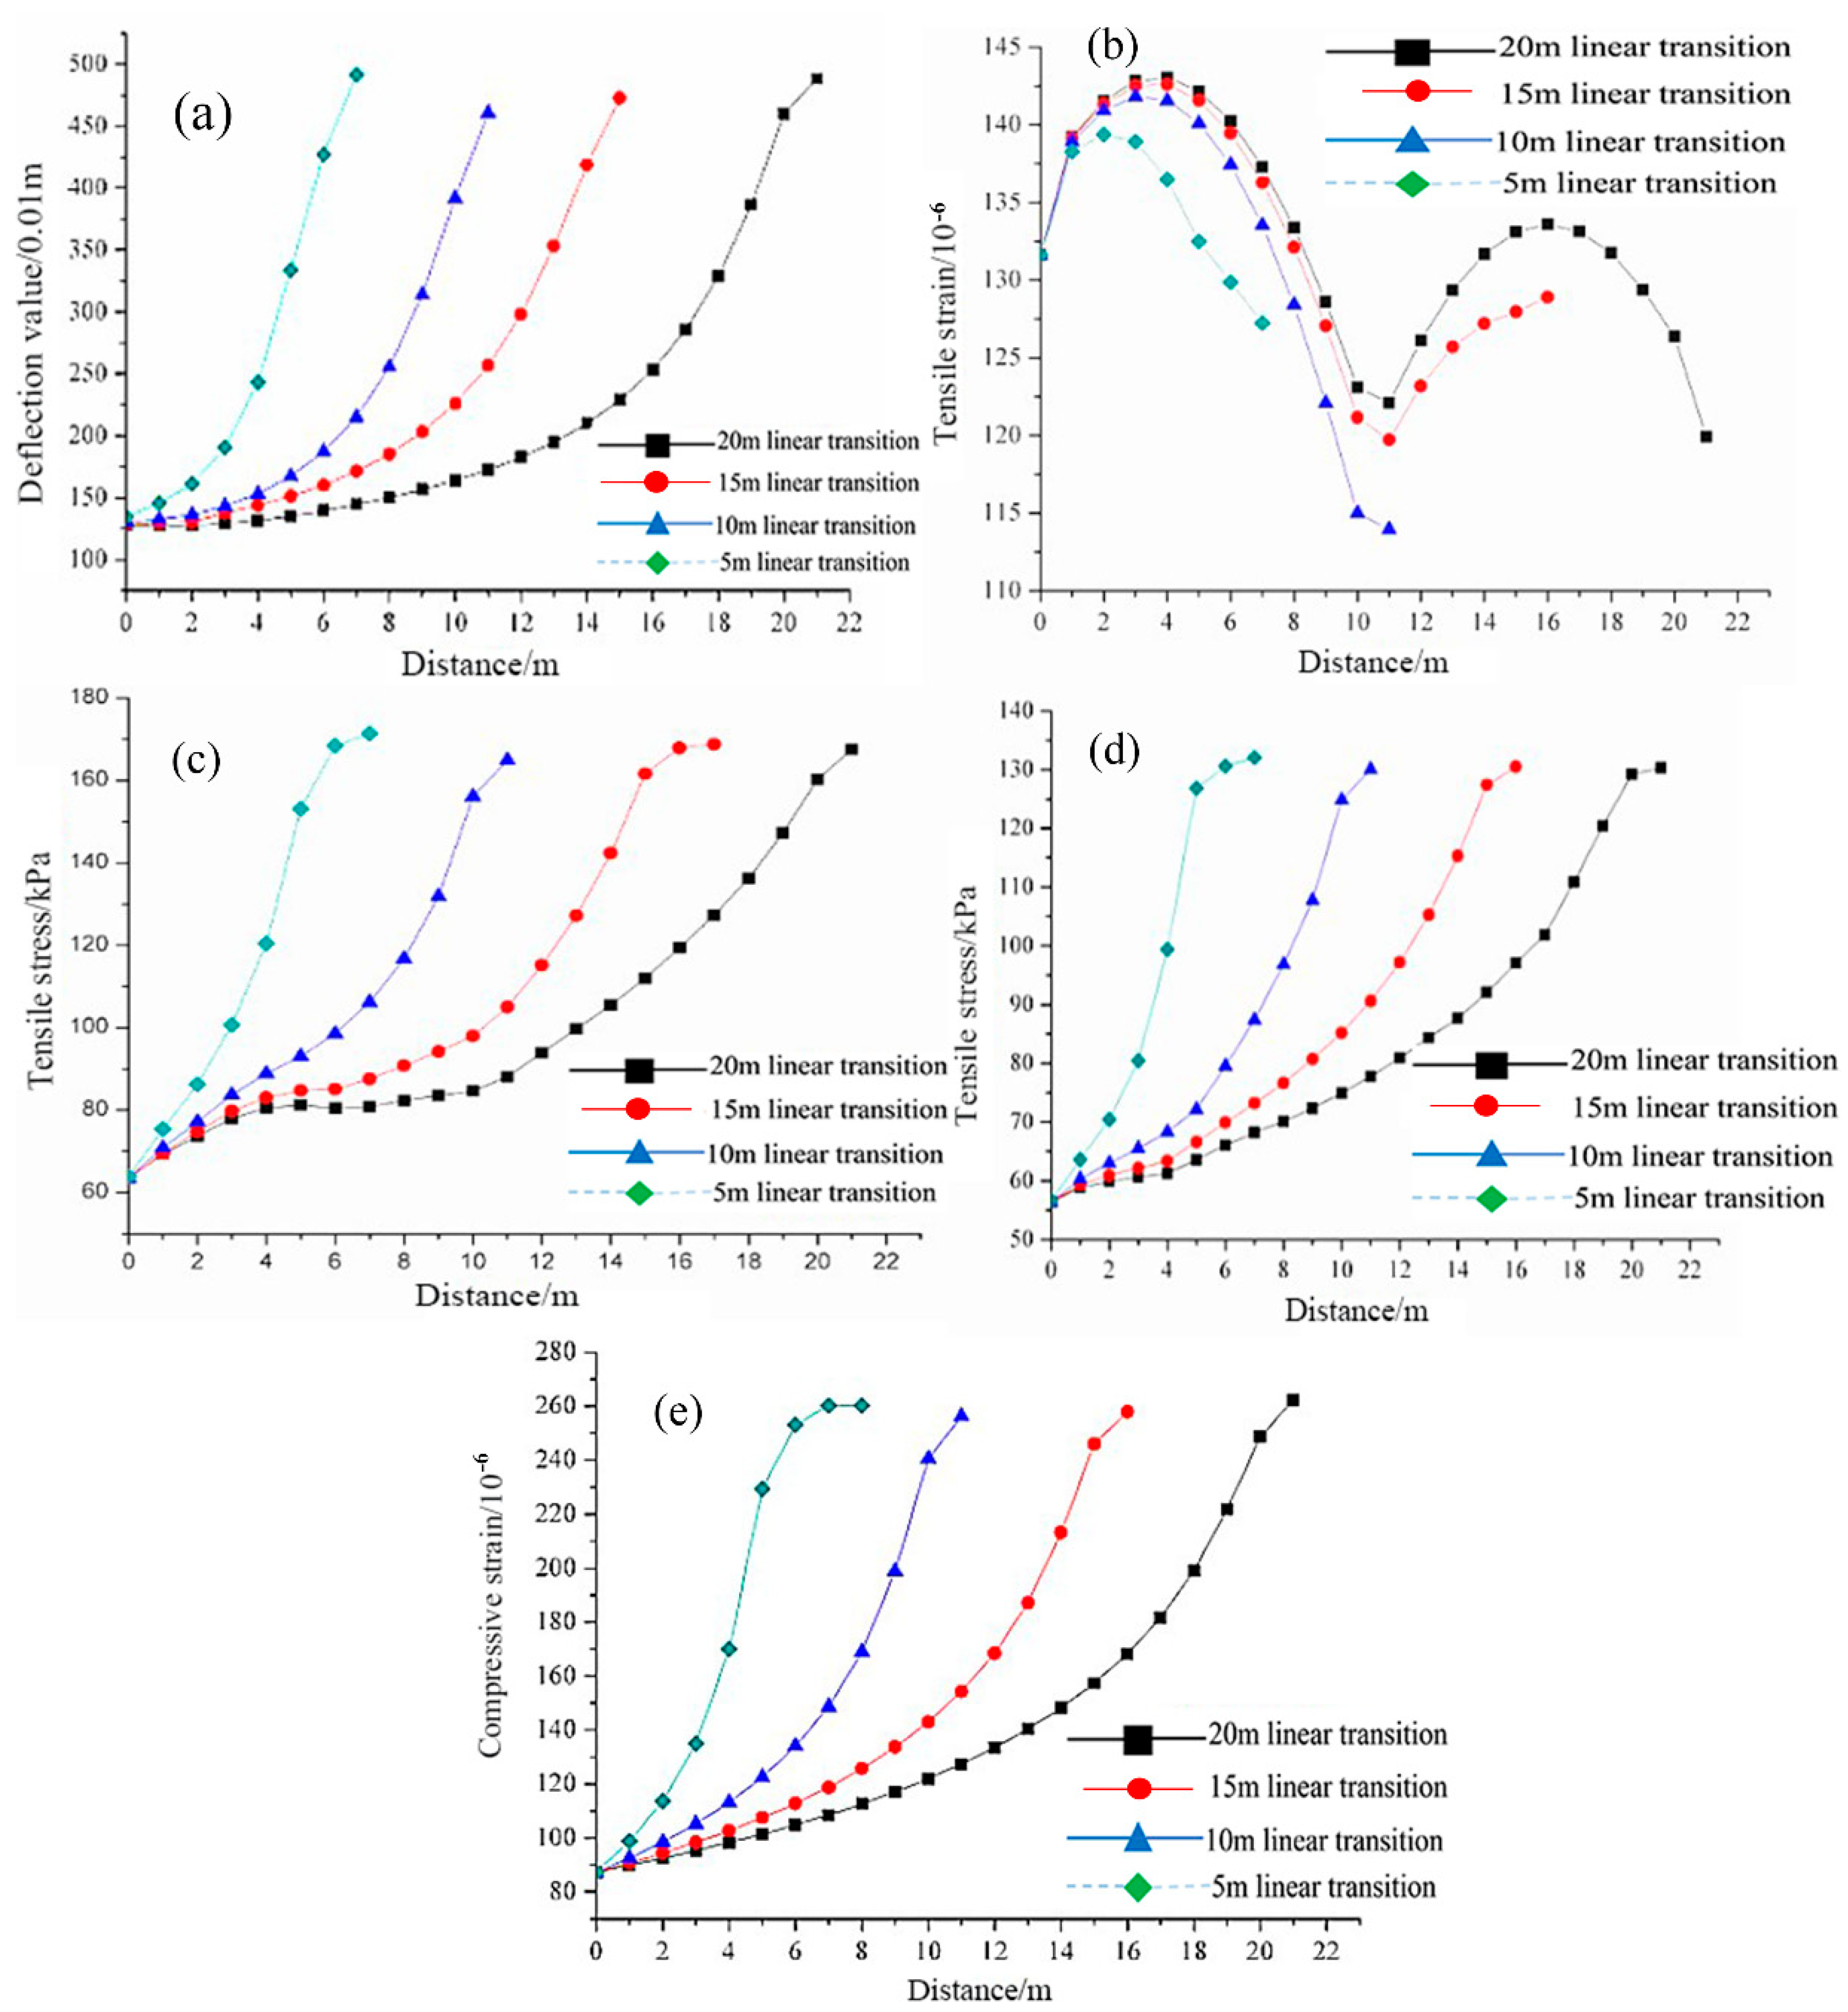
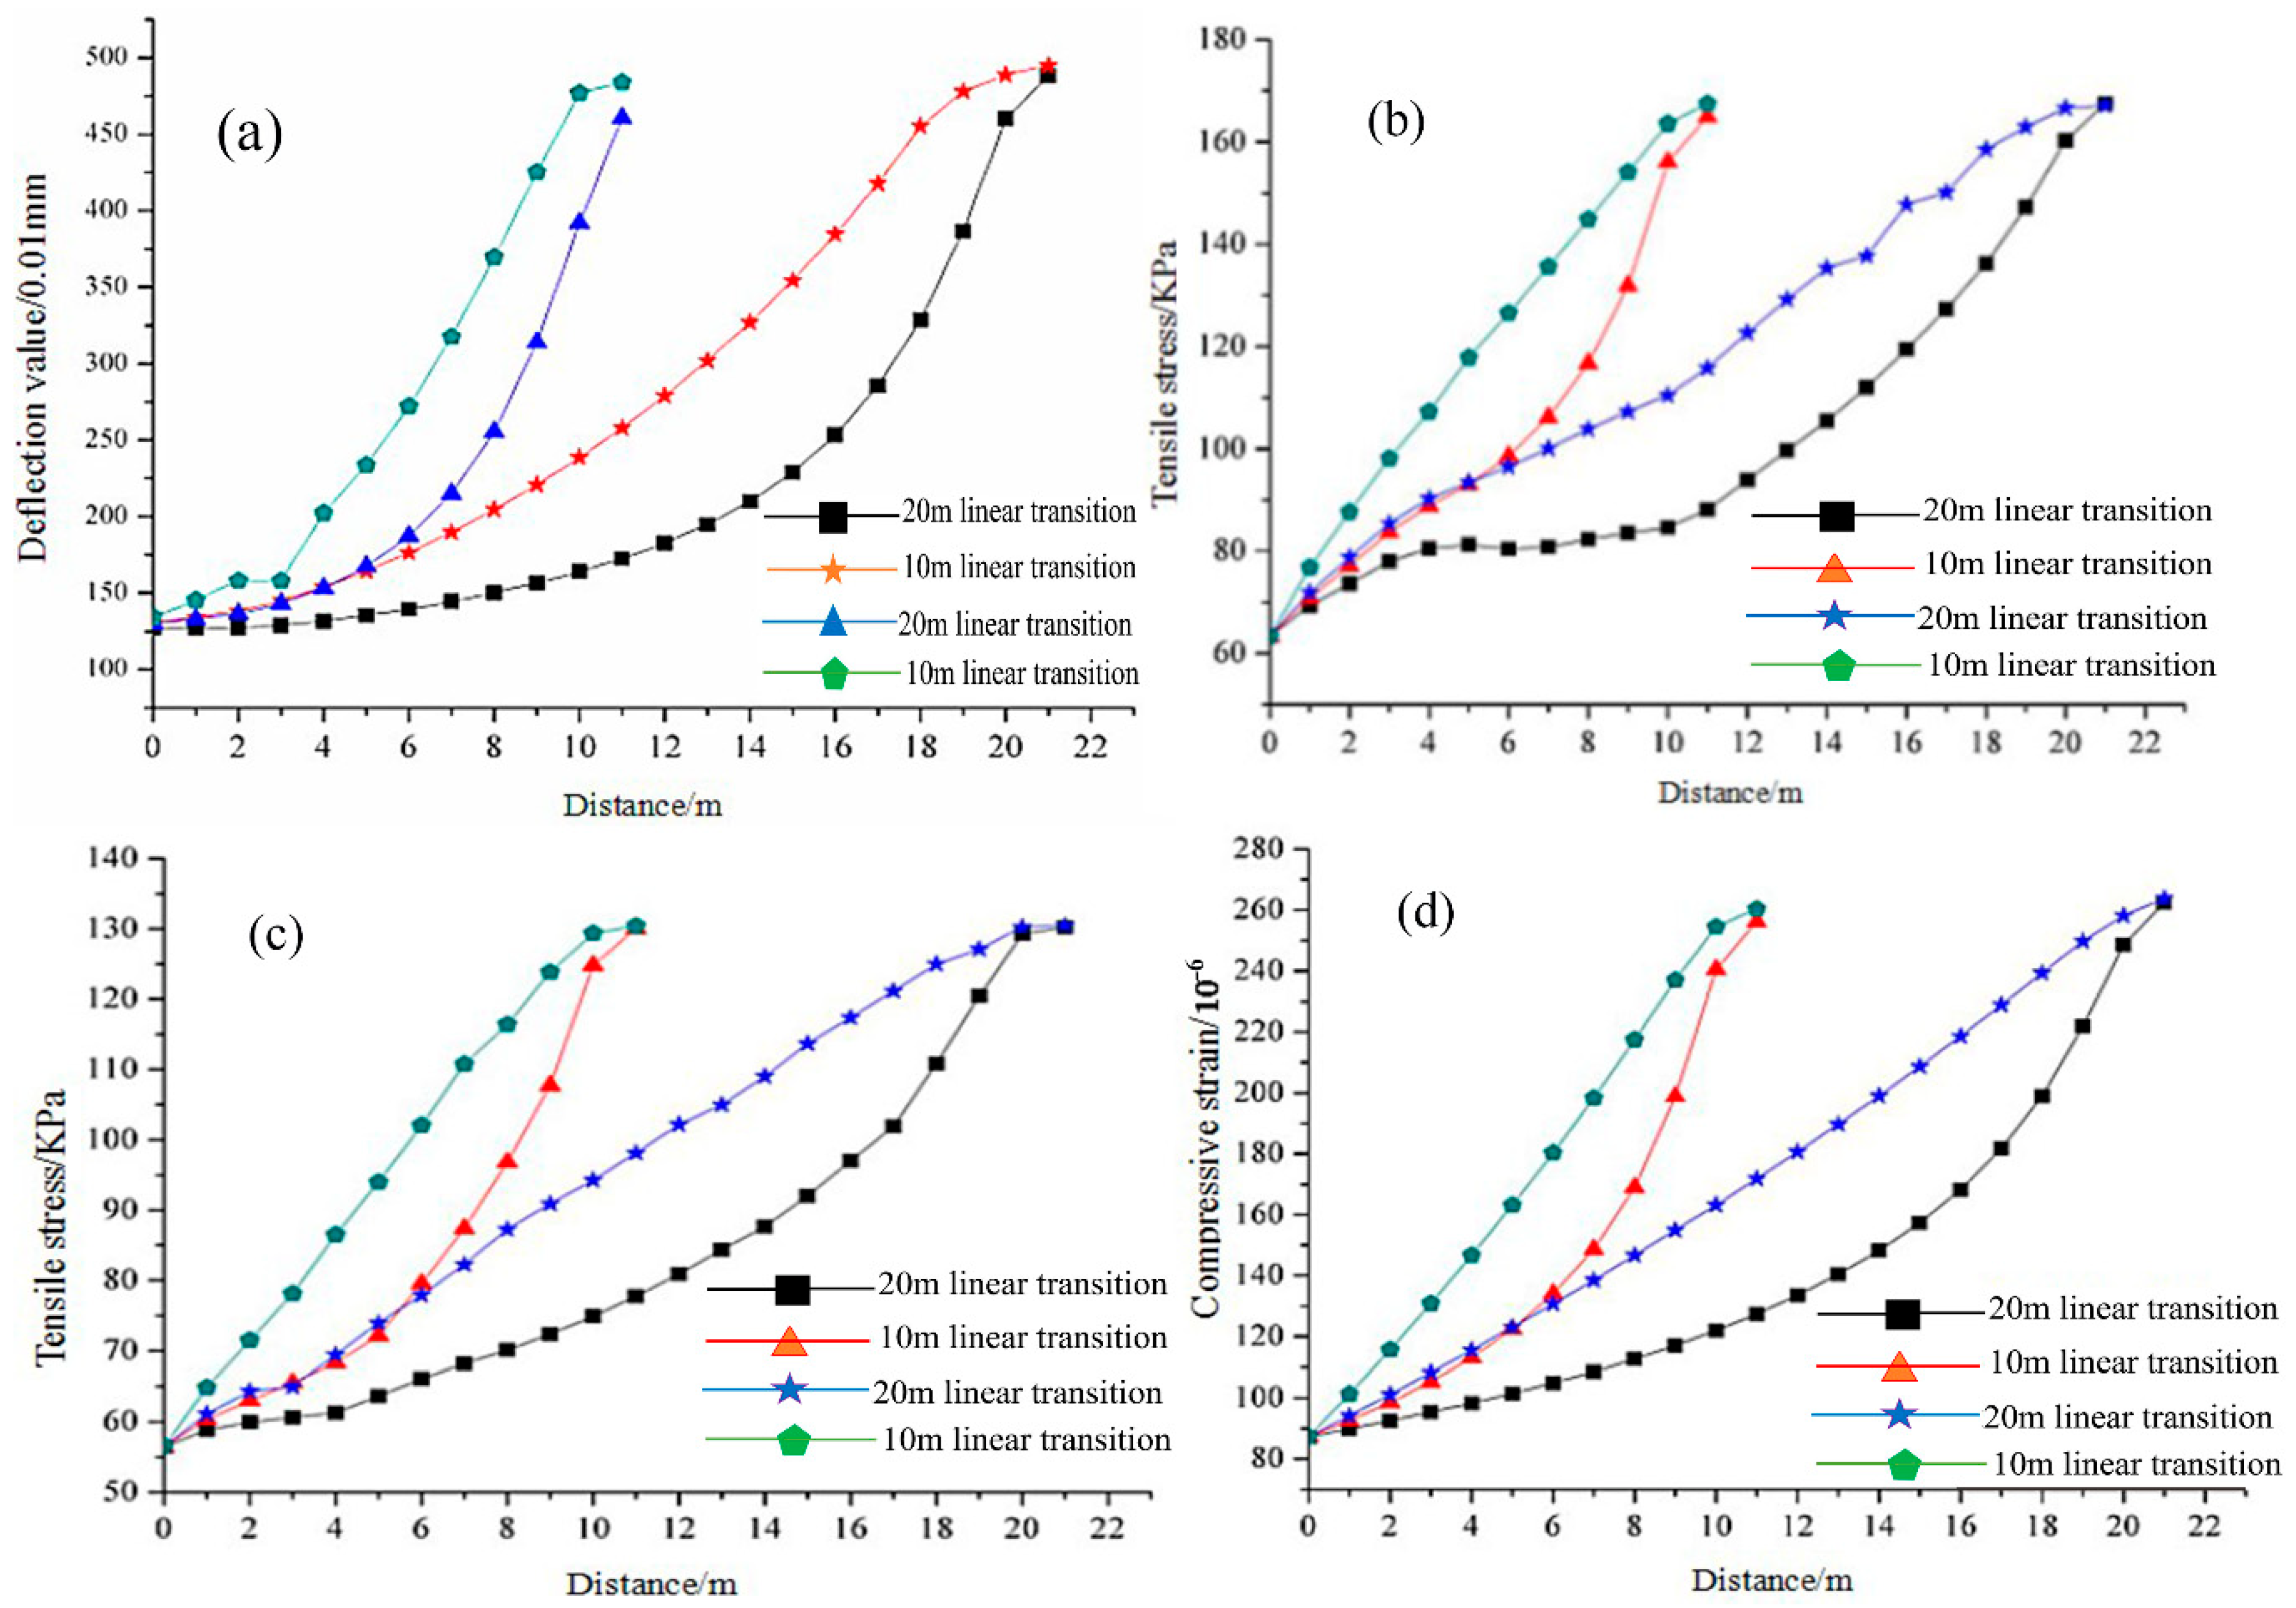
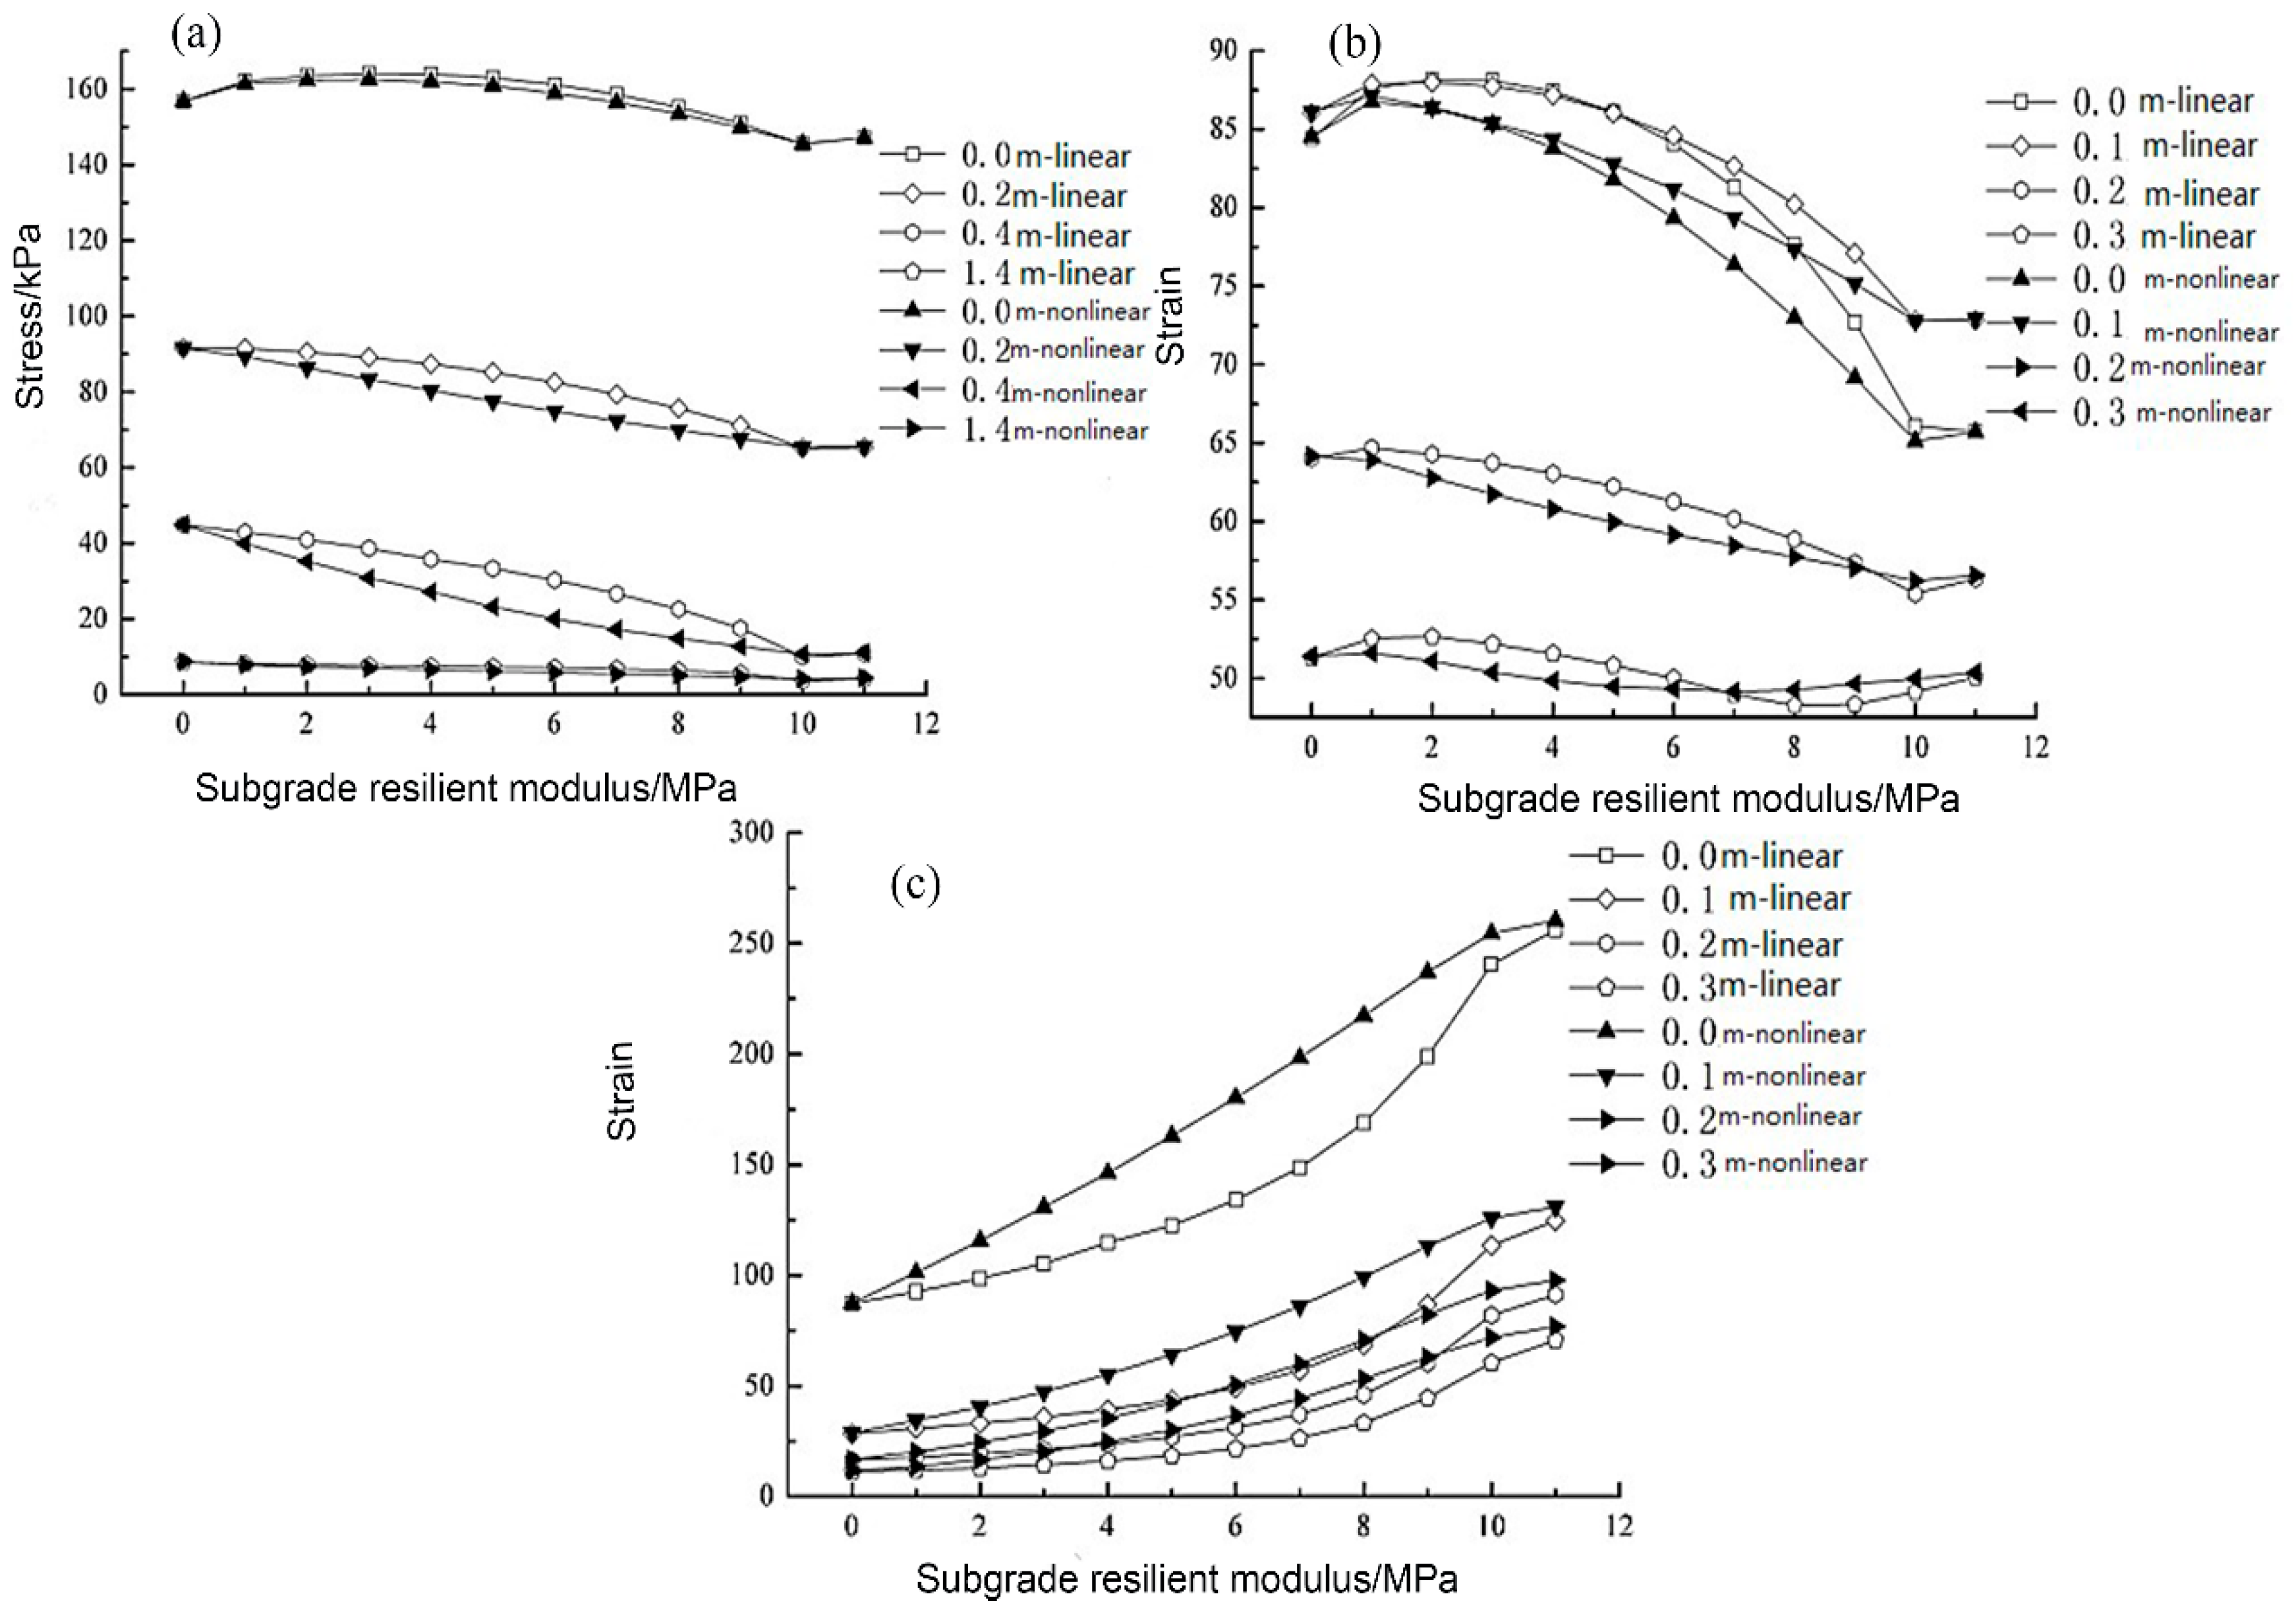
3.2. The Influence of Stiffness Linear Change on Structural Stress State

At present, the backfilling scheme was mainly in the form of an inverted trapezoid and a positive trapezoid, which was based on stiffness with the backfill material thickness in order to achieve uniform continuous reduction. However, the ratio of stiffness difference and the bridge–subgrade transition section will affect the stress state of pavement and the filling cost directly. It is necessary to explore the transition form and proportion of the transition section. In this paper, the minimum value of the subgrade stiffness near abutment and the bridge–subgrade transition section were 500 MPa and 40 MPa, respectively. In addition, using a linear proportional transition, the filling length of the bridge–subgrade transition sections were analyzed by 20, 15, 10 and 5-m, as shown in Figure 4a–e.
In addition to the different variations of tensile strain of the middle layer, the stress state of each layer structure in the transition section has a similar variation rule. First, pavement surface deflection, the tensile stress of the base layer, and the compressive strain of the top of subgrade were all increased with the distance from the abutment. Second, with the length of the transition section decrease, the stiffness transition ratio and the variation rate of the pavement structure stress state increase. However, the stress state of the pavement structure under different stiffness transition ratios has little difference when compared to the pavement stiffness. Therefore, the stress state of the pavement structure is mainly affected by the stiffness of the subgrade and less by the variation rate subgrade stiffness which directly affected the variation rate of stress state of the pavement structure. Third, the variation rate of the stress and strain were increased with the distance from the abutment. As the stiffness was large, the sensitivity of the stress state was weak and as the stiffness of the pavement gradually decreases, the sensitivity was strong.
In a word, tension stress on the bottom of the middle surface course was affected largely by the boundary condition. The oversize length–width ratio of the numerical model was the main reason for this result.

3.3. The Influence of the Nonlinear Stiffness Ratio to the Structural Stress State

Simulation results showed that the variation of pavement stress state and stiffness change have a good correlation with the form of the denary logarithm. Although the homogeneous continuous change of stiffness can occur, the stress state of the pavement doesn’t achieve a homogeneous continuous change. In actual pavement construction, the ideal pavement stress state should change continuously and homogeneously along the pavement longitudinal line. Therefore, this study attempts to realize a pavement structure stress state that varies linearly when the stiffness of the pavement bridge transition section changes nonlinearly in the same change interval along the longitudinal direction. When the subgrade stiffness along the longitudinal pavements are in the range of 500~40 MPa, continuous transition was realized in the 20 m and 10 m length range and in the form of the denary logarithm, as shown in Figure 5a–d.

4. The Influence of the Stiffness Variation Mode of the Transition Section on the Stress and Strain Field

Permanent deformation of aggregates and soil was affected by internal factors and environmental factors, it was also affected by load factors and major load size and load times were considered as primary load factors. For foundation settlement, its additional load contains vehicle loads and superstructure gravity loads, and because of the limited influence depth of vehicle load, the vehicle load can be simplified as the equivalent height of the soil. The additional load on the subgrade was a uniformly distributed strip load and vehicle load imposed on the pavement, vehicle load exists in a limited subgrade depth, the load stress values at different layers varied greatly. In addition, the vehicle load in subgrade often exists in the form of dynamic loads and impact loads, which cause the complicated subgrade settlement problems. The boundary conditions of the bridge transition section were complex. The subgrade modulus changes are orderly along the longitudinal line of pavement, which make the stress field and strain field of the subgrade in the bridge transition section different from other general sections.

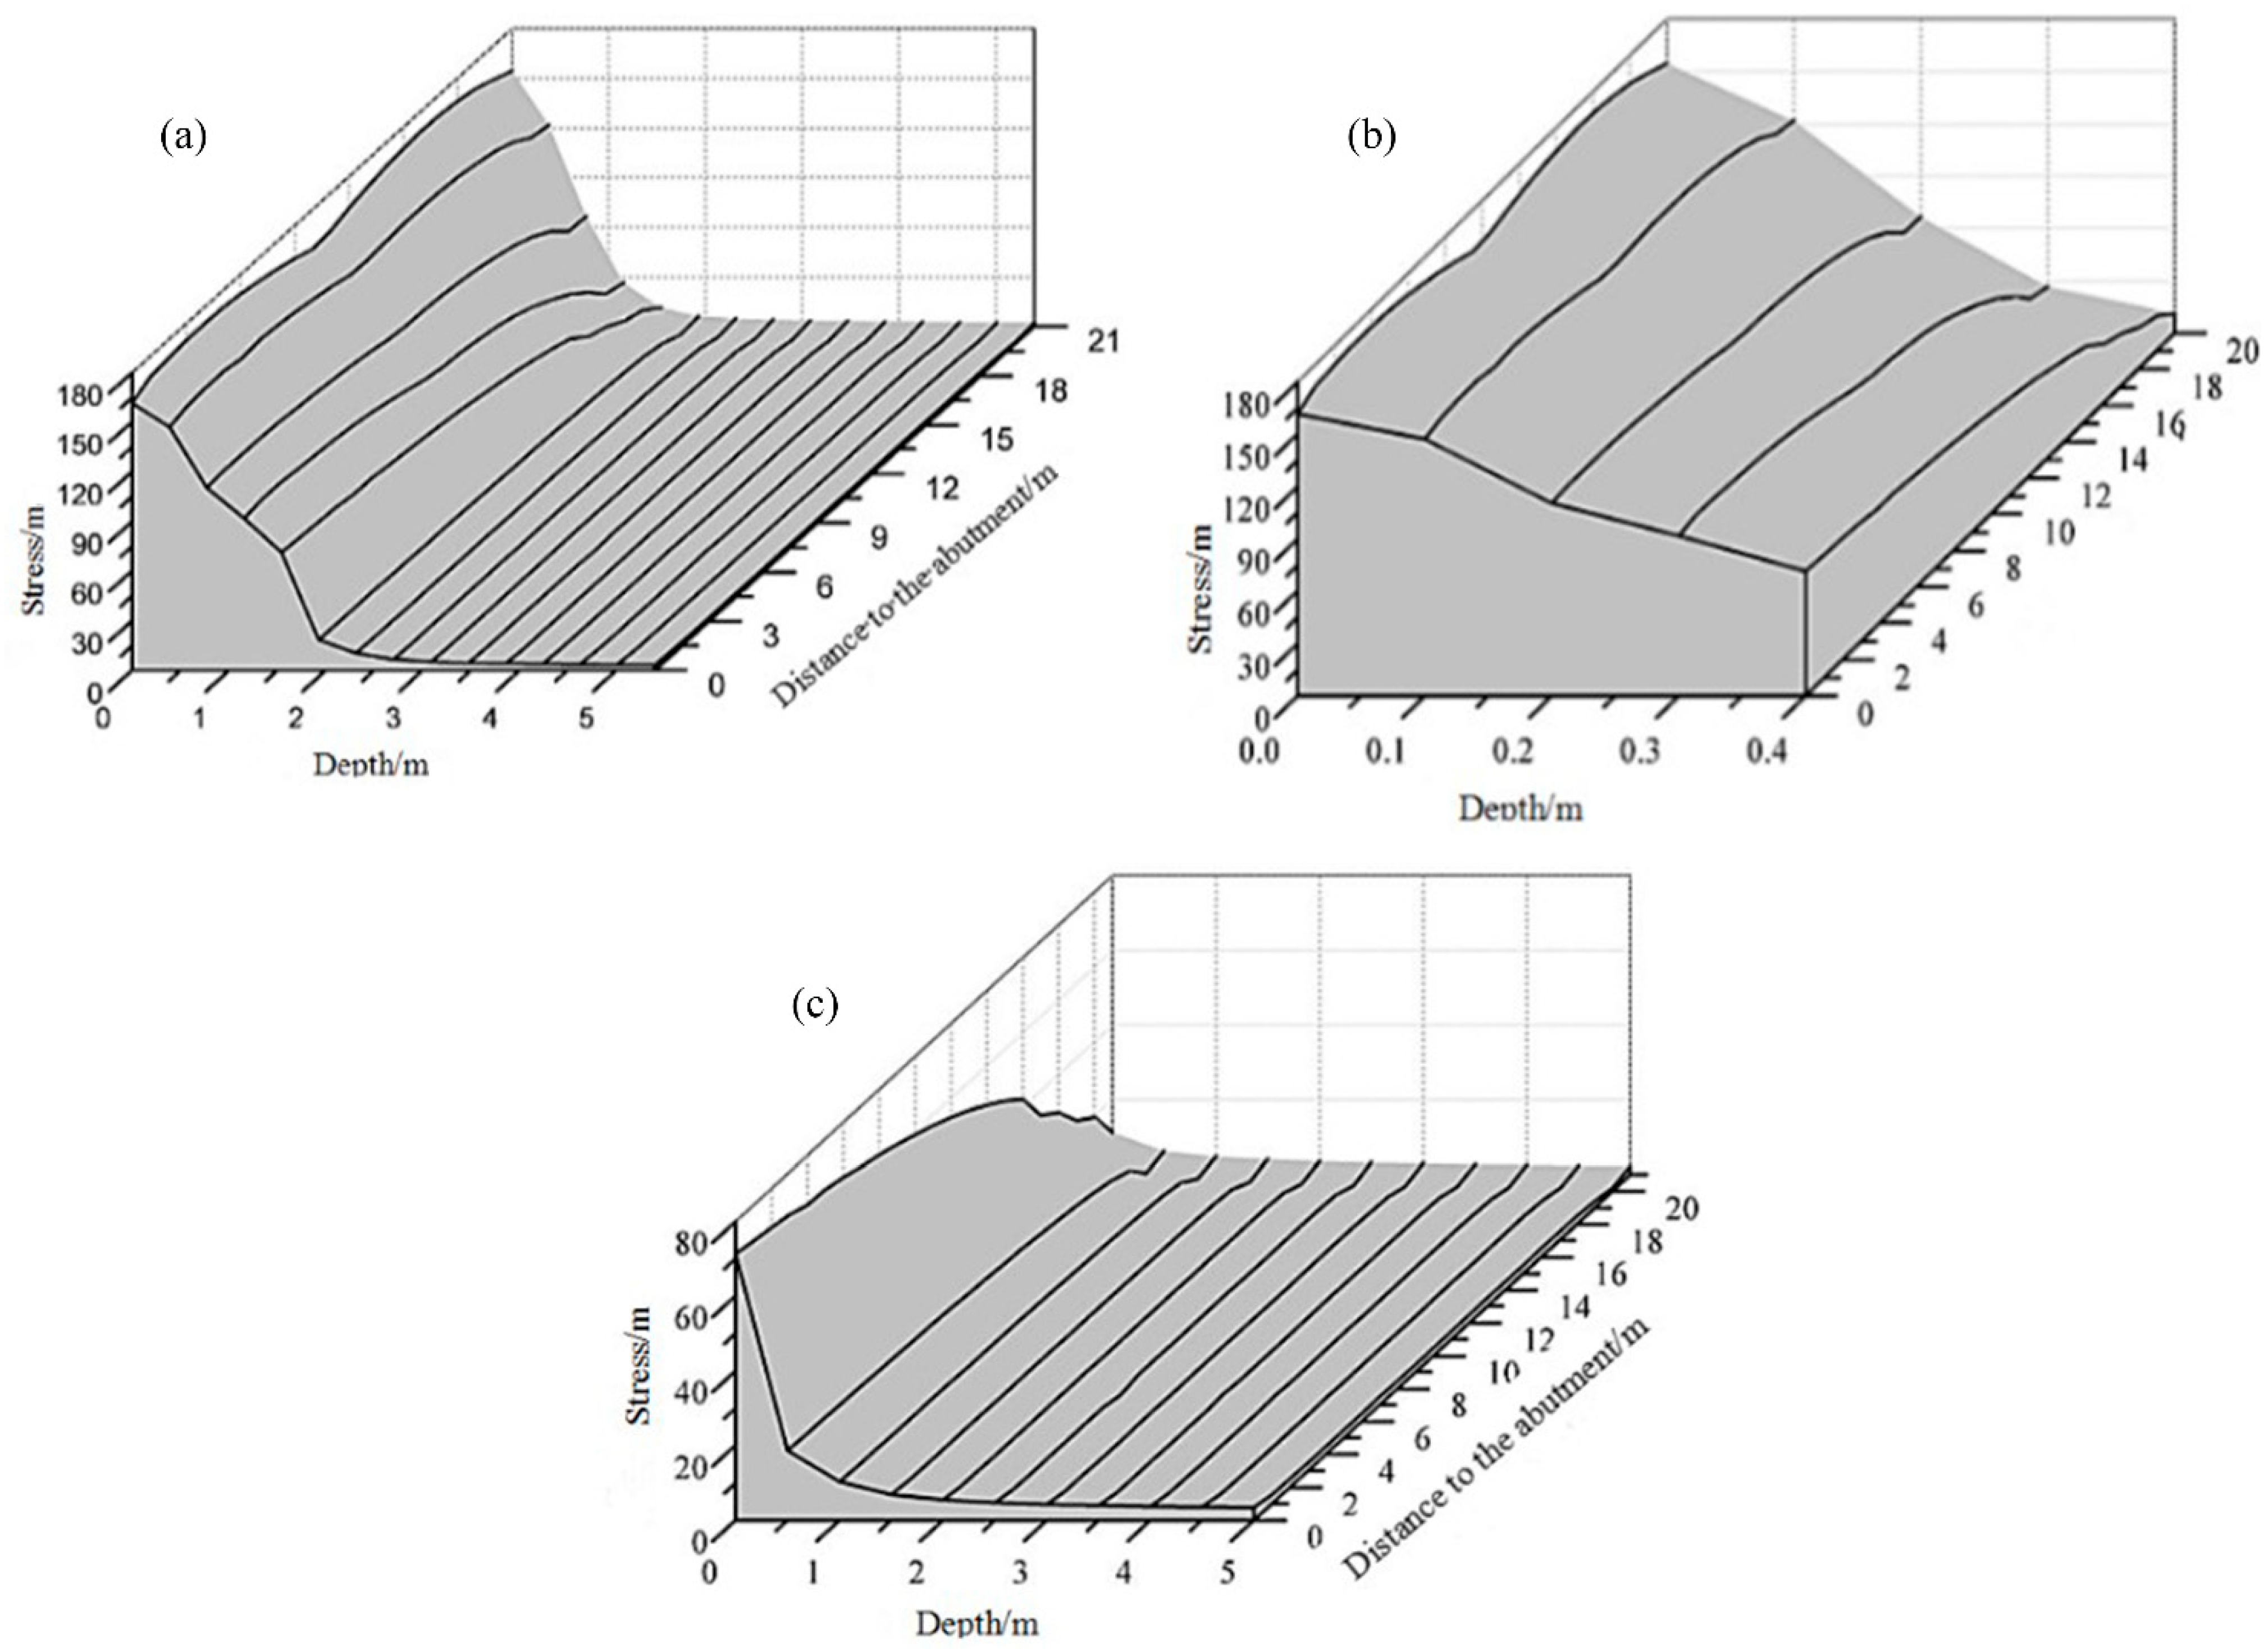
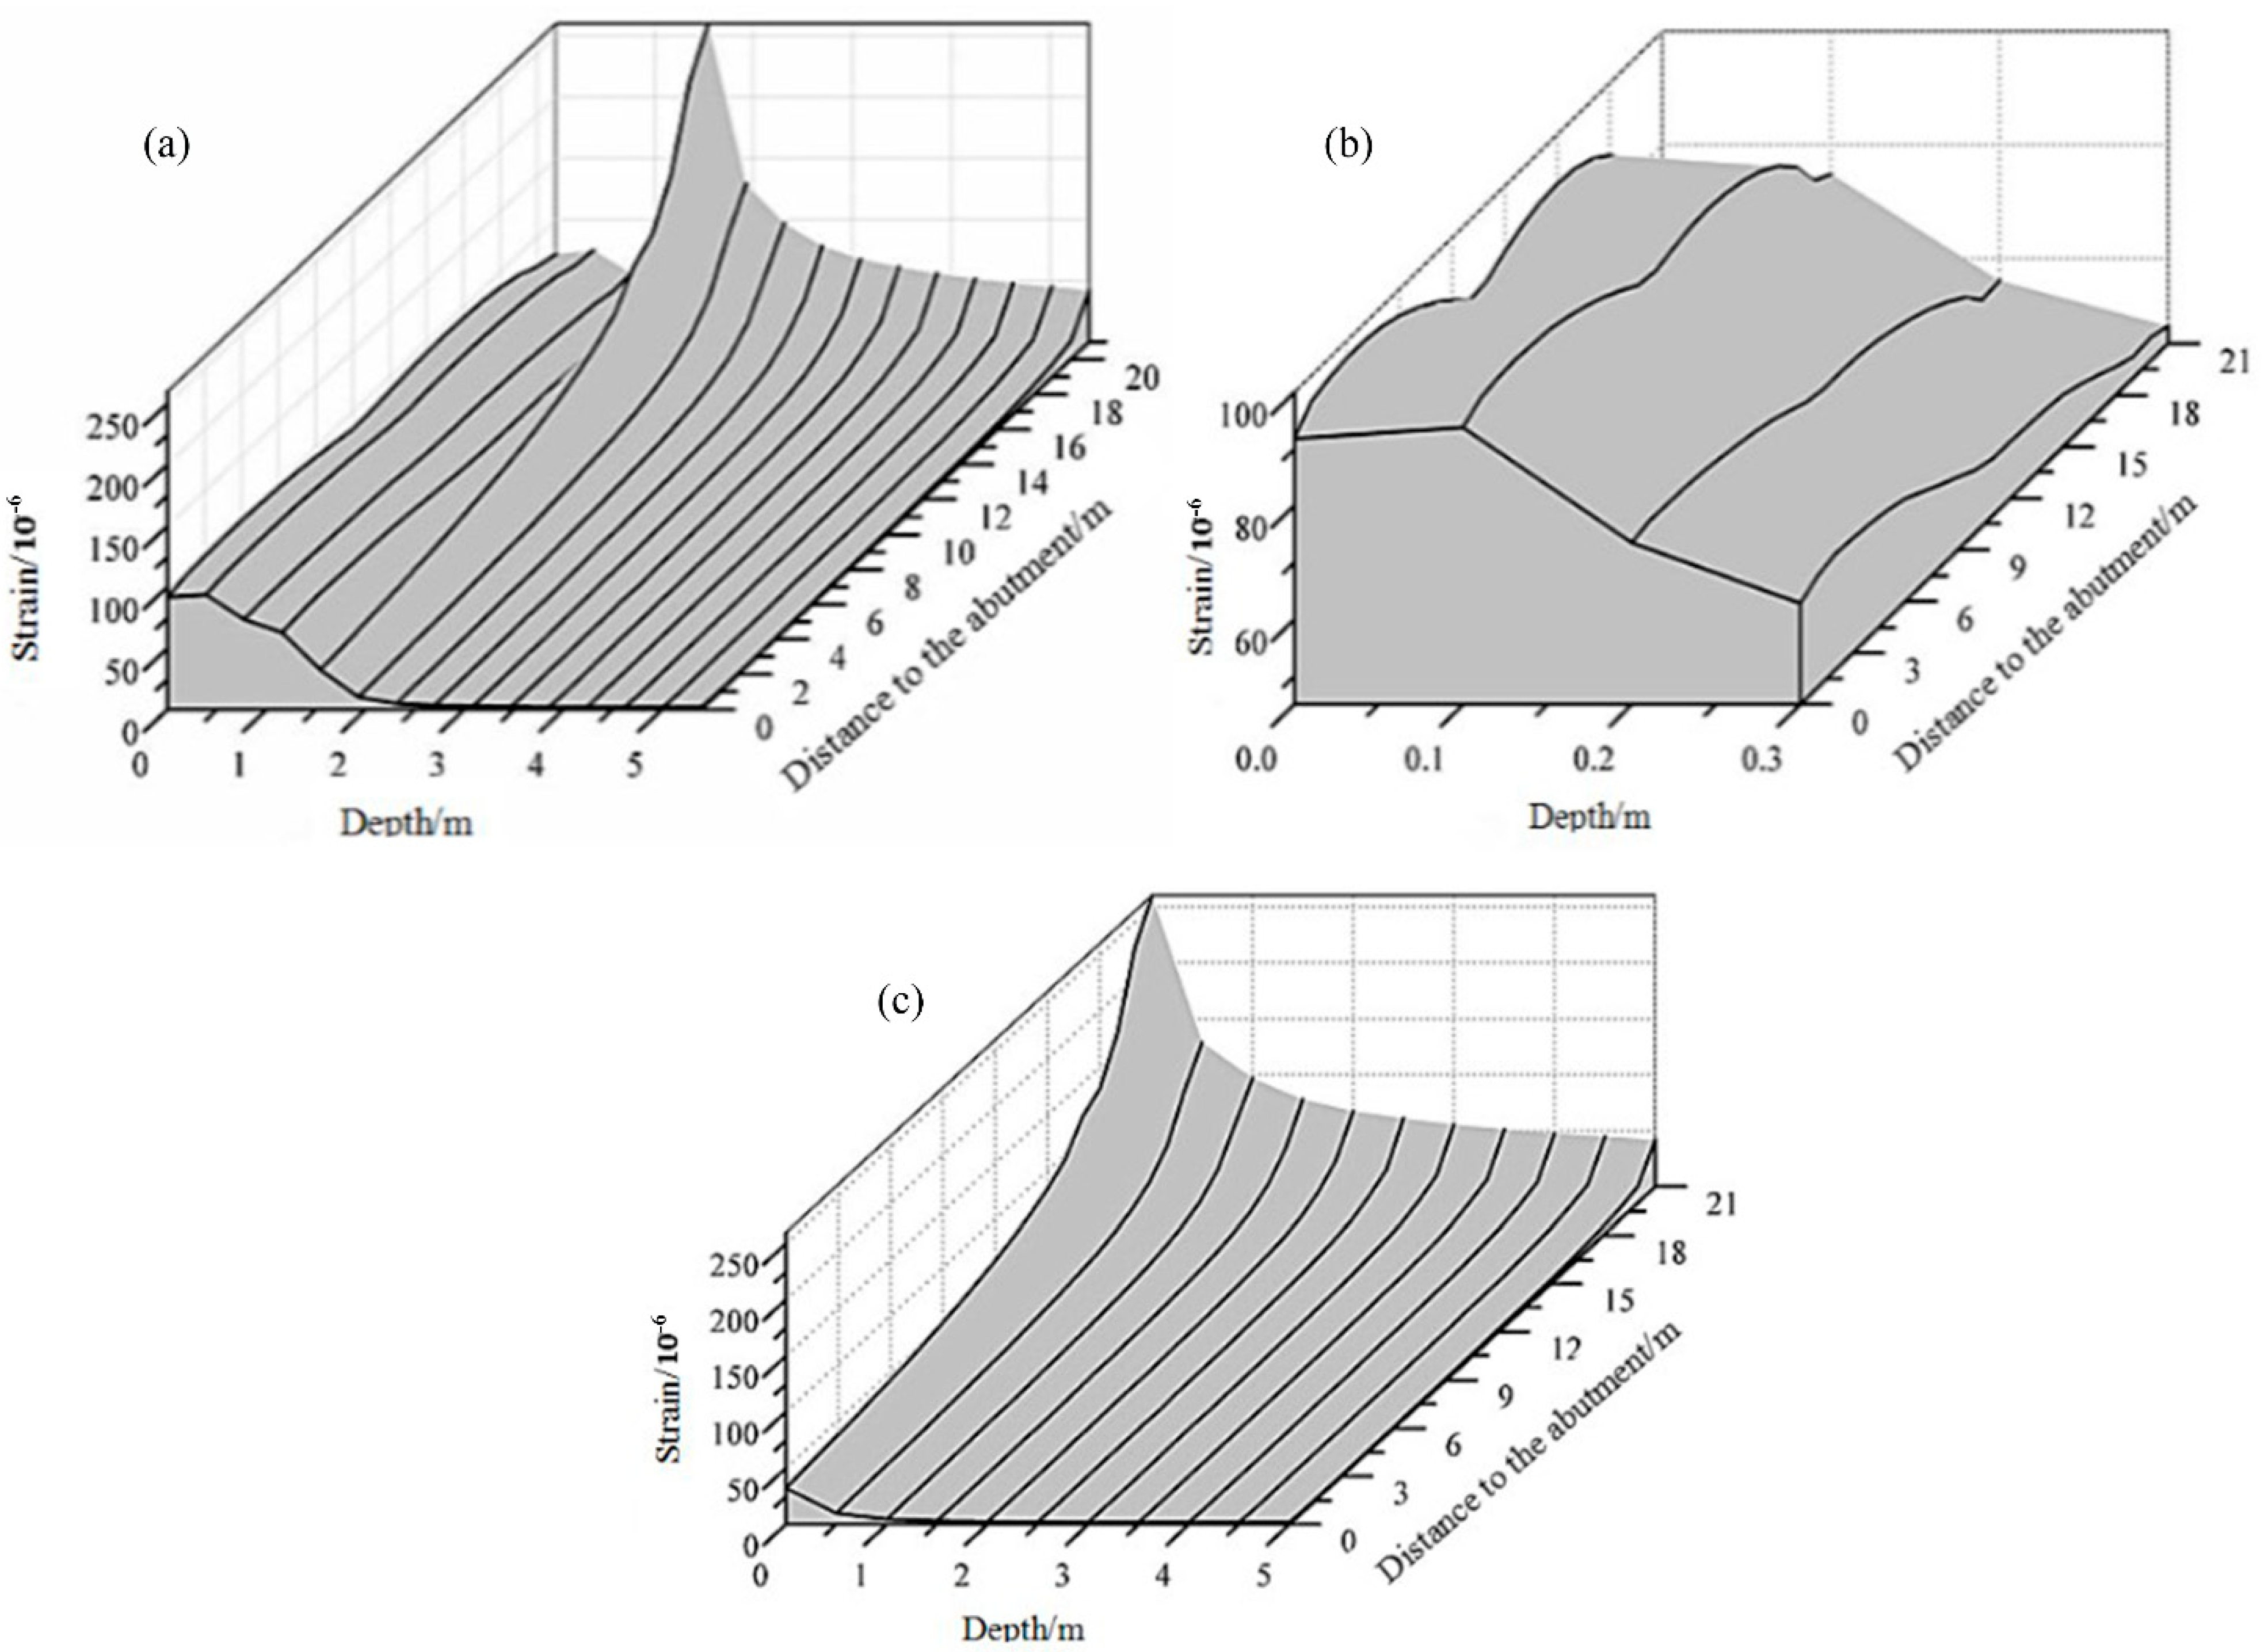
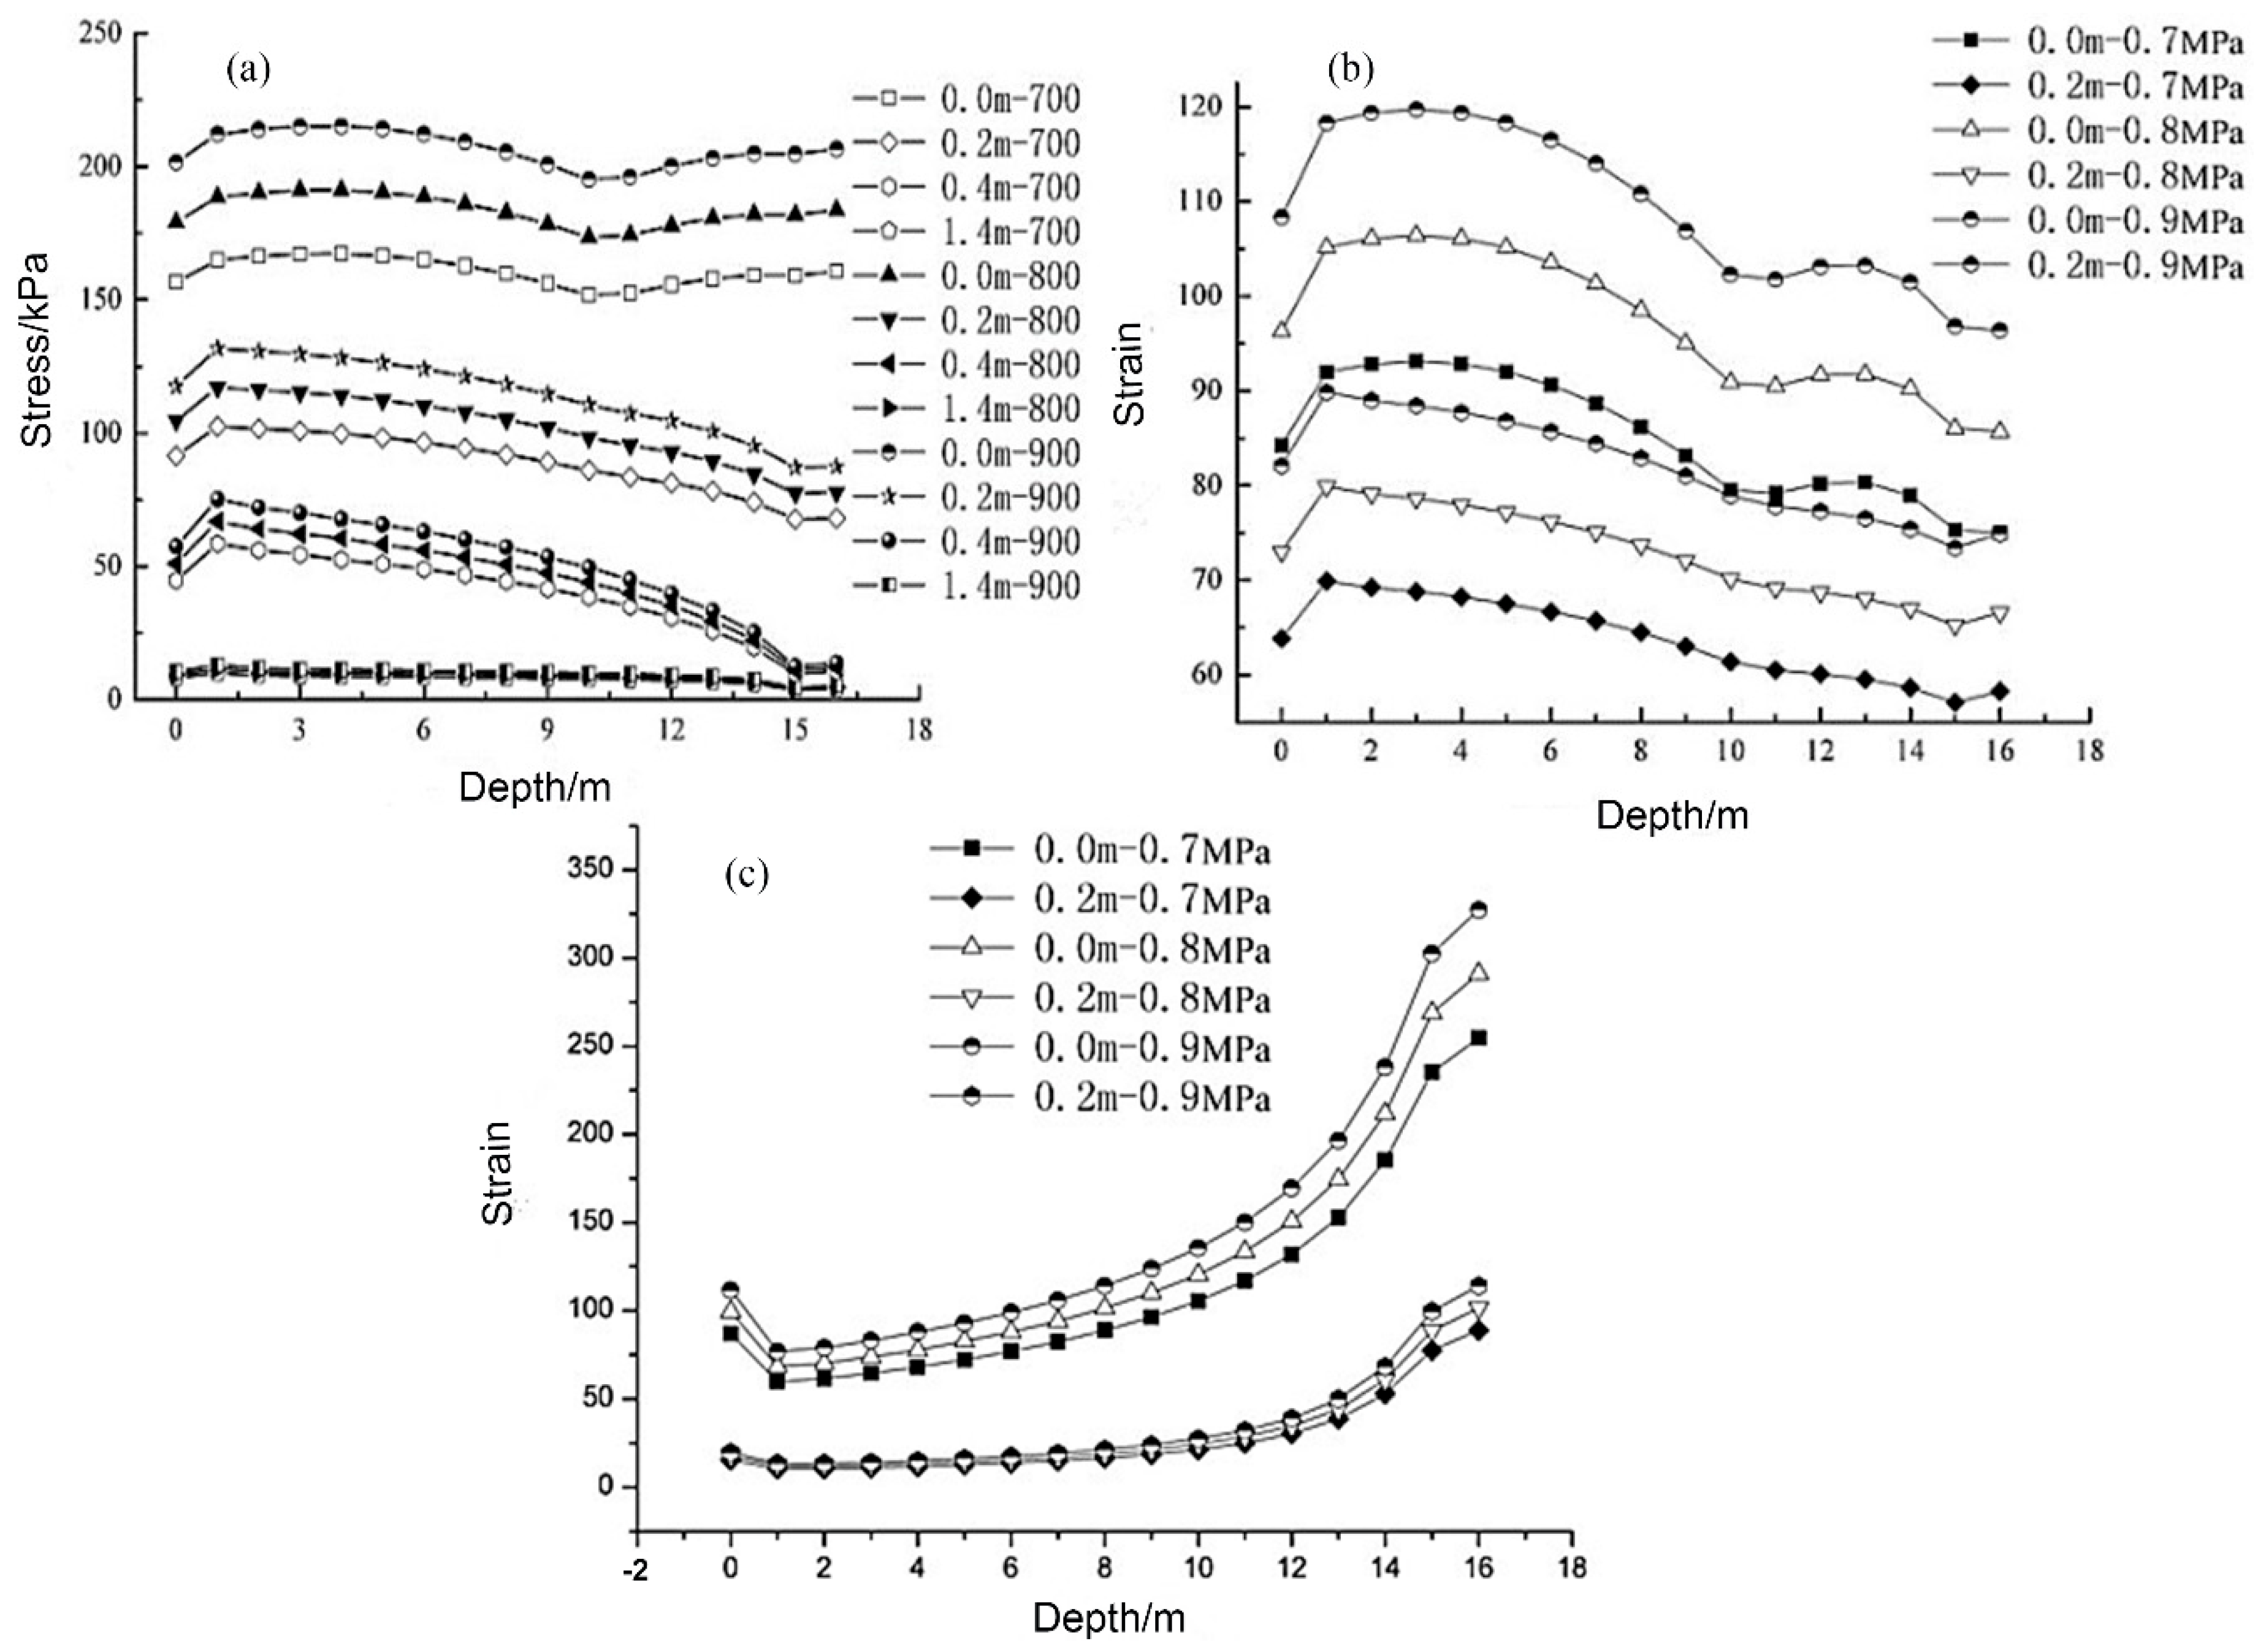
4.1. The Influence of Variation of Subgrade Stiffness on Stress and Strain Field

When the resilient modulus of the subgrade is in the range of 40~2000 MPa and the length of transition section is within 20-m, the distribution of stress field is in the base and subgrade. Note that the abscissa “depth” was not the true depth value, it was defined that the top surface of the base was the starting point-zero. Then the depth of boundary of the bottom of subgrade and surface of basement layer was 0.4 m. For the need of drawing and reading, the abscissa was only an approximate coordinate in Figure 6a. The stress field distribution of base and subgrade in a real depth coordinate is shown in Figure 6b,c.
It can be seen from Figure 7a–c that resilience modulus of subgrade in the bridge transition section decreases linearly as the distance increases. However, the variation in the stiffness of subgrade has little influence on vertical stress in the top surface of the basement layer. With the distance from the top surface to the base layer increasing (i.e., the depth increasing), the impact of changes in subgrade stiffness on the stress field in the base layer and subgrade increases. As the depth increases, the base layer and subgrade stress field decline rapidly. At the same time, the concept of “subgrade work area” can verify that the impact of stress on the subgrade vehicle load occurs within a limited depth, typically 0.8 m [11]. When this model subgrade depth is 2 m, vehicle load and subgrade stiffness’ effect on the stress field was very small and can be ignored.
Variation of strain and stress field were significantly different from each other, and the performance was more complex. There was a big difference in the distribution of the base layer and the subgrade strain field. With the increase of the distance that the abutment or subgrade stiffness decreases, the stress field in the substratum and subgrade decreases. The strain field in the substratum also showed the same trend, but the strain field in the subgrade increased. Second, with the increase of depth, the stress field was gradually reduced. When the subgrade stiffness was small, the strain field meet this rule. When the subgrade stiffness decreases to a certain value, the strain field on the top of the subgrade will break the rule. At the same time of the emergence of a maximum strain, the strain field in the subgrade will be stronger than the stress field in the substratum. Moreover, the maximum value of medium pressure stress exists on the surface of the base and the maximum value of the compressive strain appears in a certain depth under the substratum. This model appeared at 10 cm. Finally, with the reduction of stiffness, the difference of compressive stress in different depths decreases and the compressive strain increases.

4.2. Effect of Subgrade Stiffness Variation on Stress and Strain Field

In chapter 4.2, the rule of stress and strain field in the base and subgrade was introduced. During the structural designs of the bridge–subgrade transition section, the subgrade stiffness or the resilient modulus of subgrade may be changed. For this reason, compared with the maximum subgrade resilient modulus, respectively, as 2000 MPa, 1000 Mpa, and 500 MPa, the corresponding stress and strain field were changed with the linear variation in 20 m, 15 m, and 10 m.
Figure 8a is a “stiffness equivalent” approach (i.e., the corresponding stress value was drawn by the subgrade stiffness value, the equivalent stress field was obtained). Ignoring the boundary conditions of the numerical model itself, different horizons of the transition section and the vertical stress field at different locations were only related to the subgrade stiffness (modulus of resilience) and had little relation with the rate of change of stiffness.
Figure 8b,c corresponds to the base and the distribution rule of the strain field in the subgrade. It can be concluded that the strain field also satisfies the same rule and the compressive strain values at different positions and locations on the transition section were related to the stiffness (modulus) of subgrade at its location and had little relation with the change of stiffness (modulus of resilience).
The rule of the stress and strain field along with the change of the subgrade stiffness in the bridge–subgrade transitional section was shown once again. Stiffness difference and settlement difference can be solved by collaborative design of structures and materials. However, stiffness needs continuous change. Too much difference can result in stress redistribution, especially a stress concentration phenomenon. The functional relationship between the compressive stress value and the subgrade stiffness value, the compressive strain value, and the subgrade stiffness value need to be further determined and modified.
When the subgrade stiffness (modulus of resilience) of bridge–subgrade transition section was a linear or nonlinear variation, the stress and strain field were also related to the size of stiffness. However, stiffness variation was relative (i.e., stiffness variation within a certain distance or between two adjacent points). The variation of the stress and strain field can only be judged by the change of the adjacent two points or a certain distance. Analysis of the rule of the reaction from Figure 9a, the relationship between strain and stiffness was an exponential function, which also fit the reasoning above. The subgrade stiffness was nonlinear variation, and the change of stress state on pavement structure was more balanced. Figure 9b,c once again verifies this inference.
From the above three figures, we can conclude that when the subgrade stiffness (modulus of resilience) forms a nonlinear function change, the stress and strain field in base and subgrade approximate linear variation along with the increase of the longitudinal distance of the pavement; and the change was balanced and continuous.
In a further comparison, the results of non-linear changes in the stress field are slightly smaller than the linear variation in the stress field, and the strain field in the base also fits this rule. In the subgrade strain field, the results of nonlinear changes are slightly larger than the result of a linear change. This phenomenon was determined by the subgrade stiffness value and the sensitivity of stress and strain to the change of stiffness.

4.3. Effect of Load Size on the Stress and Strain Field

The distribution of stress and strain in a bridge–subgrade transition section was influenced by its structure and boundary conditions and the size of the load. The result of the previous paper was based on the vehicle load size of 0.7 MPa. Considering the real traffic load, the load was selected as 0.7 MPa, 0.8 MPa, and 0.9 MPa. The condition to analyze the effect of the load size on the stress and strain field was also provided in this paper.
As can be seen from Figure 10a–c, the change of the load size does not change the rule of the stress field and the strain field in base and subgrade. When the load increases, the stress and strain in base and subgrade were obviously increased. As the depth increases, the influence of the load size on the stress and strain field was weakened. The influence of load size on the stress and strain field in the subgrade was very limited. In addition, the data shown in this paper is within 2 m depth.

4.4. The Relation between Stress and Strain Field

In the previous paper, it has been revealed that the change of the stress and strain field in the base and subgrade was affected by the change of the stiffness and the load in the subgrade. Further comprehensive explanation of the rule was shown as follows.
As can be seen from Figure 11a–c, the stress and strain field of the base have similar variation, which is compressive stress and strain increasing with the distance increased from the abutment and reducing with the subgrade stiffness decreases. The stress and strain field of subgrade have the opposite variation, which is the stress field decreasing with the subgrade stiffness decreases and the opposite situation with the strain field. The strain field in base and the strain field in the subgrade have the opposite variation, but the rule of the stress field variation is the same. When the subgrade stiffness changed by a nonlinear rule along the longitudinal pavement, the stress and strain field were changed more evenly and continuously.
In general, the stress and strain field of base were relatively stable and the sensitivity to the subgrade stiffness was weak. If the change of stress field caused by the stiffness of subgrade was less than 50 kPa at a certain depth, and the strain field changes less than 50 micro-strain, the stress and strain field at a certain depth in the subgrade were much higher than this standard. When the resilient modulus of subgrade was lower than 500 MPa, the resilient modulus of subgrade near the abutment should be higher than 500 MPa. In addition, when the resilient modulus of subgrade of transition section was lower than 500 MPa, the modulus change rate should be reduced appropriately to ensure that the stress and strain field were changed continuously and evenly.

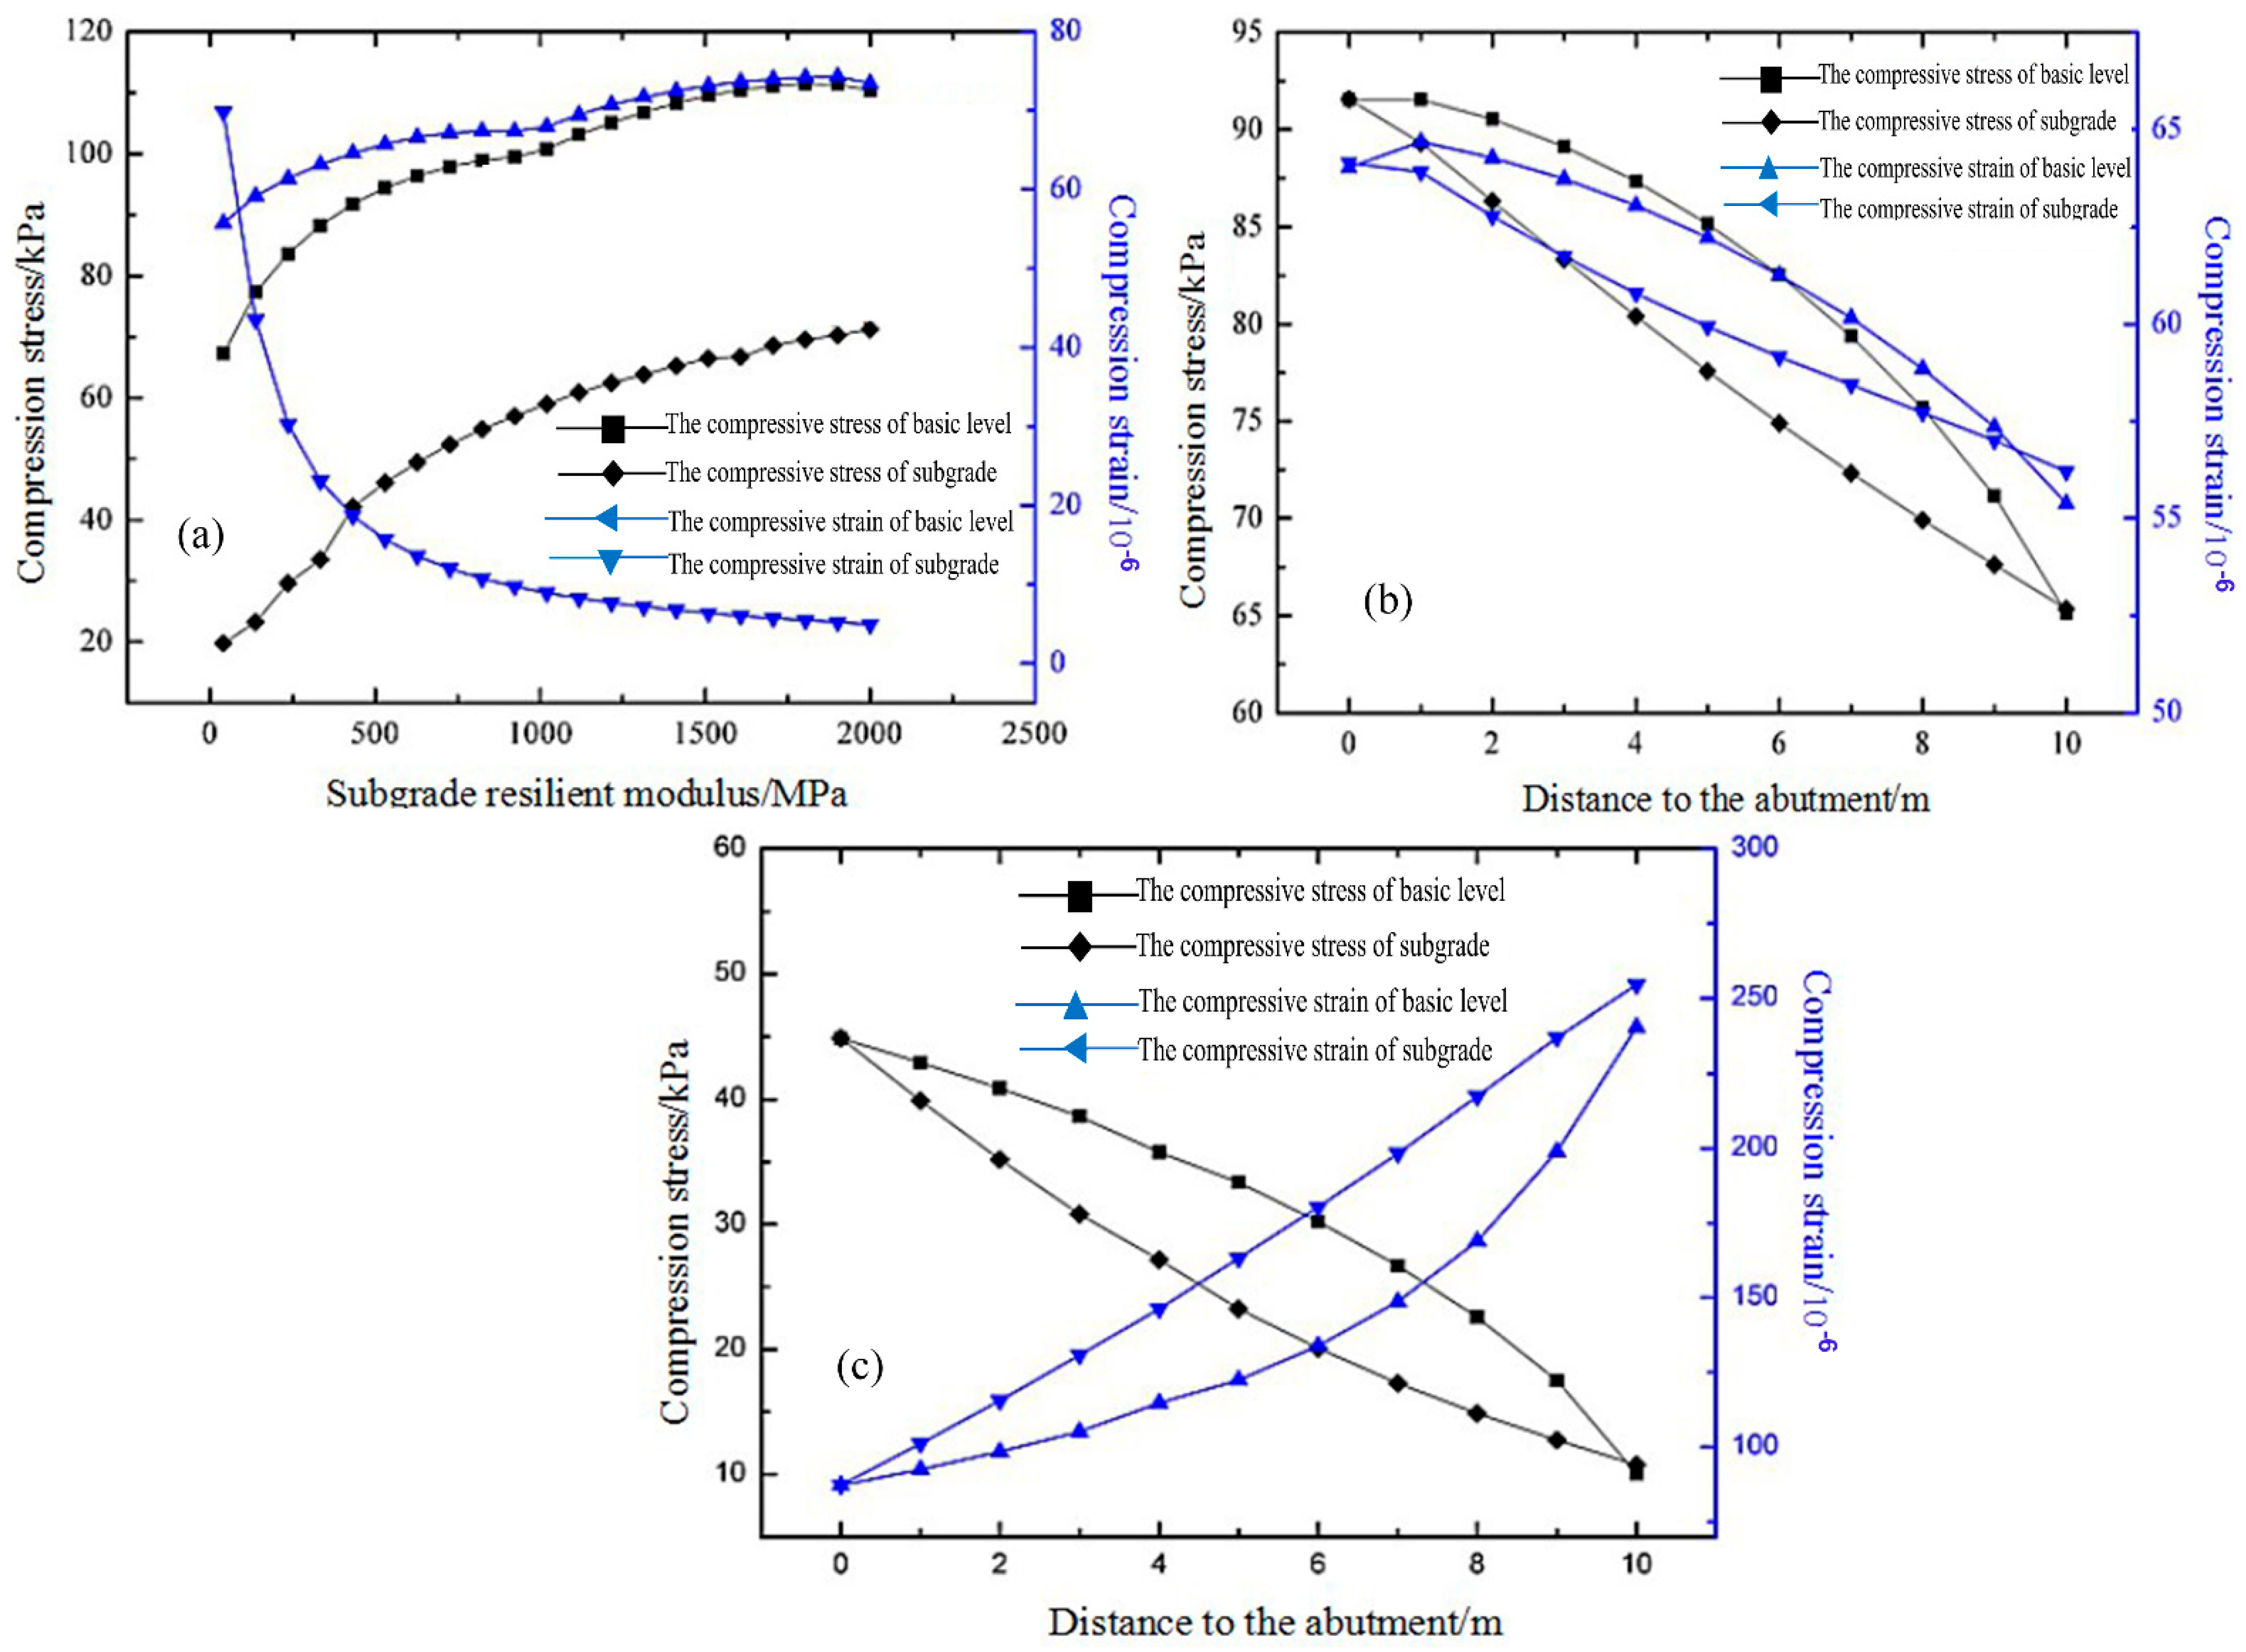
5. The Coordinated Control of the Stiffness and Permanent Deformation in Bridge–Subgrade Transition Section

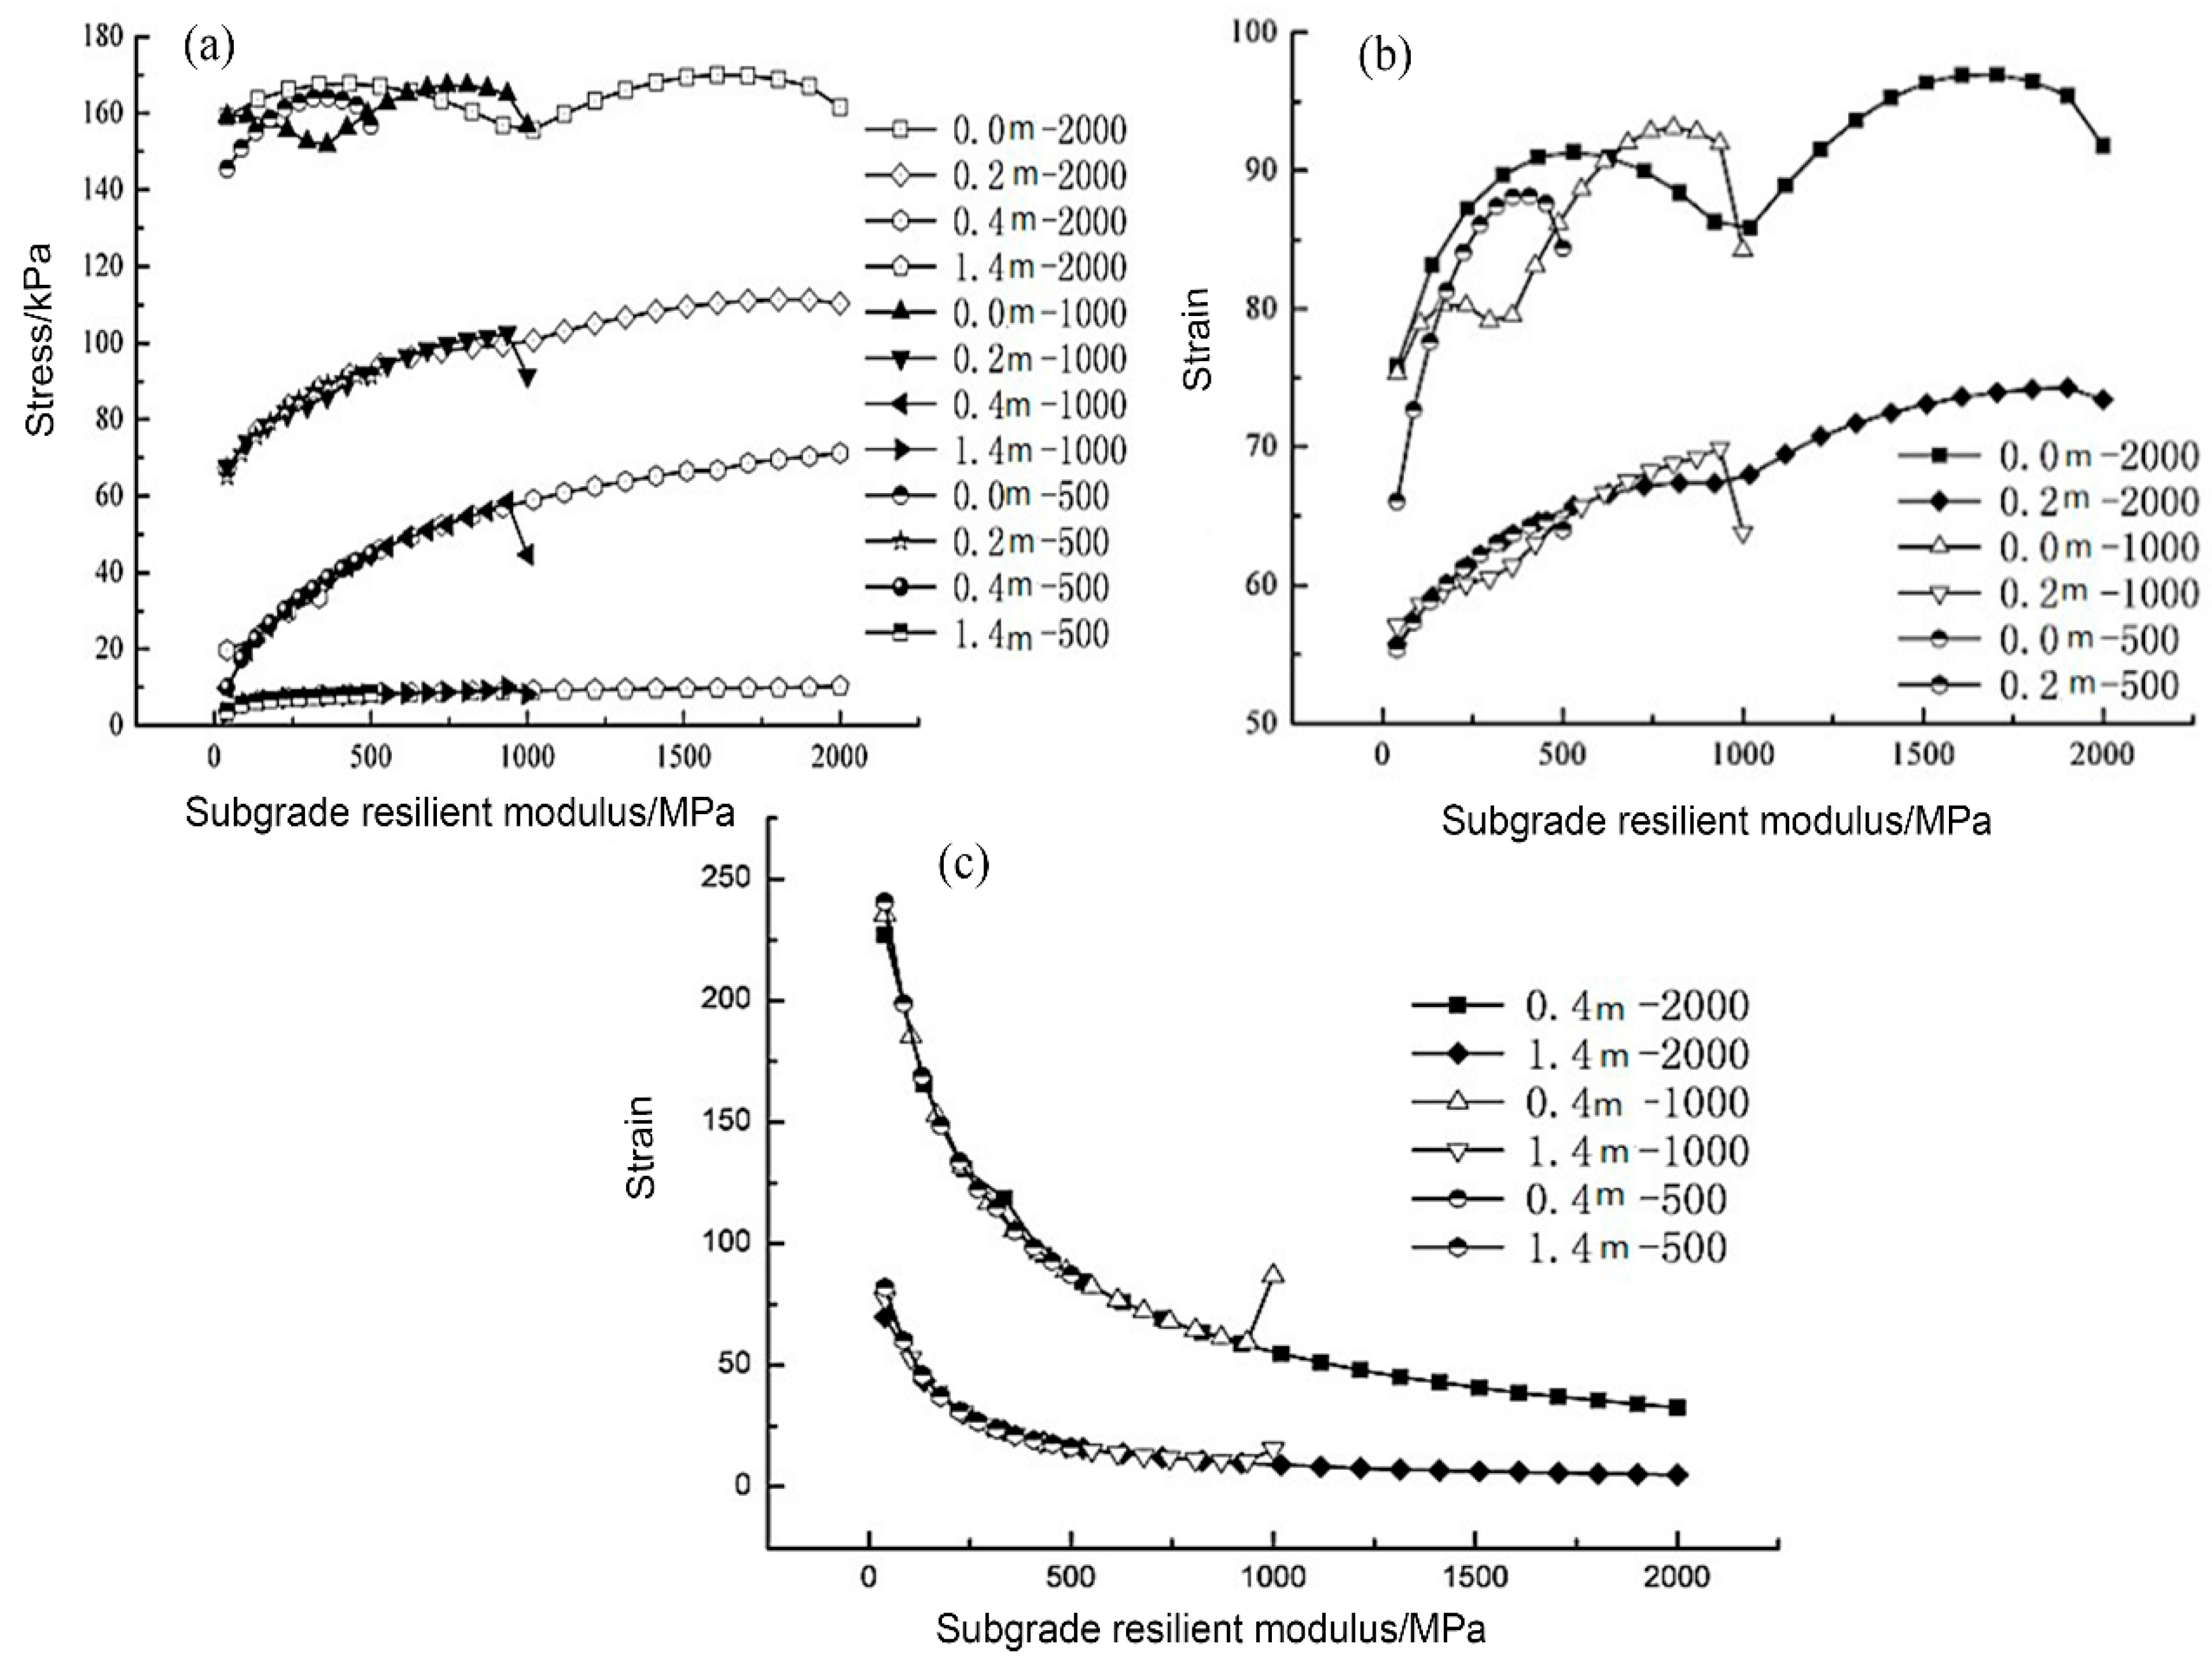
5.1. The Main Factors Influencing Permanent Deformation of Aggregate and Soil

The filling materials of the subgrade and the base in the bridge–subgrade transition section are granular materials, and nonlinear elastic plastic materials. The strain under the load was composed of two parts (i.e., resilience strain and permanent strain) [12,13]. Although the permanent stress of aggregate and soil variables by each load was very small, it gradually accumulated in many repeated traffic loads, resulting in over large post-construction settlement in the bridge–subgrade transition section.
The repeated stress level and loading times are the most important factors affecting the permanent deformation and accumulation of aggregates and soil. Many repeated loading tests of three axes have proved that the axial permanent stress variable and sum of accumulation increased with the increase of the partial stress. In addition, with the repeated action of the load, the permanent strain of aggregate and soil can produce tiny increments. The permanent strain tends to be stable or destroyed when it reaches a certain amount of accumulation. Under the expected service life or the traffic loads, a point in the spatial structure of transition section of the stress level and loading times is constant. Therefore, we can make the permanent stress change in the controllable range by choosing reasonable materials or predicting the permanent deformation of the bridge–subgrade transition section.

5.2. The Prediction Model of Permanent Strain

By studying the permanent strain long-term character of aggregate and soil, many scholars have established the constitutive model which can predict permanent strain accumulation. These models mainly consider the permanent strain in different natures and states of aggregate and soil, the rule of gradual accumulation along with the increase of the number of loads, and the important role of different stress conditions and levels in the accumulation of permanent strain [14]. The following contents were mainly introduced in the model in the same load action times and stress conditions.
By relating the accumulation of permanent strain with the number of loads and the corresponding stress levels (partial stress q and confining stress σ 3 ), Kim used 13 kinds of stress combinations on an aggregate of base to conduct a constant confining pressure stress three axis test and established the following model [15]:
ε 1 p = a q b σ 3 c N d   ( R 2 = 0.843 )
ε 1 p = a ( q σ 3 ) b N d   ( R 2 = 0.167 )
where: a, b, c, d are the model parameters obtained by regression analysis.
By using the experimental methods of staged repeated loading, Gidel concluded that the permanent strain increased with the increase of the average principal stress, ratio of the partial stress, and the average principal stress, correlating with the stress path length and height of stress ratio. A permanent strain model was established which was composed of the number of role functions and the role stress functions [16].
ε 1 p = A 1 ( N 100 ) b ε 0 ( L max p a ) n ( m + s p max q max p max ) 1
where: ε 0 , m, n, s—test parameters;
p a —reference stress (1000 kPa);
L max —stress path length. L max 2 = p max 2 + q max 2 .
The COST337 project of the European Commission considers that establishing a relationship between the permanent strain and the resilient modulus can easily calculate the cumulative amount of permanent deformation by incremental damage mode [17].
ε p = a ε r b N c
or   ε p = a ε r b ( σ r p a ) N d
where: σ r —rebound stress;
p a —reference stress, taken as the atmospheric pressure (100 kPa); a, b, c, d—coefficient of restitution.
According to Uzan, a function can be used between the number of times and the ratio of permanent strain and rebound strain in cohesive soil subgrade [18].
lg ε p ε r = a 0 + b 0 lg N
where: ε p , ε r —permanent strain and rebound strain;
N—action times;
a 0 , b 0 —constant.
The permanent deformation model used by Tseng is shown as follows [19].
ε p ε r = ( ε 0 ε r ) e ( ρ N ) β
where: ε 0 , ρ , β —the parameters relating to properties of materials.
The Mechanics-Empirical method of pavement design experience guide uses the summation of stratified strain method to estimate permanent deformation of granular layer and subgrade based on the permanent strain model established by Tseng. The correction model was put forward to predict the permanent deformation of granular layer and subgrade layer [20].
δ p ( N ) = β C ( ε 0 ε r ) e ( ρ N ) ε V h
lg β = 0.61119 0.017638 ω c
lg ( ε 0 ε r ) = 0.5 ( e ρ β × a 1 E r b 1 ) + 0.5 e ( ρ 10 7 ) β × a 2 E r b 2
ρ = 10 7 c 0 1 ( 10 7 ) β β
ω c = 51.712 ( E r 2555 ) 1 0.64 0.3586 × d W 0.1192
c 0 = ln ( a 1 E r b 1 a 2 E r b 2 )
where: δ p ( N ) —permanent deformation of the layer after loading N times;
ε 0 , ρ , β —property parameters in the layer material;
ε r —the resilience strain in the laboratory tests for obtain the material properties;
ε V —the average vertical rebound strain in the layer was obtained from the basic response model;
h —thickness of the layer;
β C —calibration coefficients in the model;
ω c —water content;
E r —resilient modulus of the layer;
d W —deep underground water level;
a 1 , b 1 , a 2 and b 2 —coefficient, corresponding to 1.0942 × 10⁻¹⁸, 3.520049, 0.03162278 and 0.5.

5.3. Cooperative Control the Difference of Stiffness and Settlement

The post-construction settlement of bridge–subgrade transition period is mainly composed of three parts: foundation settlement, consolidation settlement of subgrade and compression deformation of subgrade. However, there was a great difference in actual engineering that the contribution ratio of the three parts hadn’t been given a reasonable range. Therefore, the common method is to enable the three parts to achieve “zero settlement”.
The permanent strain accumulation rule of aggregate and soil was connected with repeated load levels and action times. The present experimental studies have shown that a critical stress level can make a granular layer and a subgrade tend to be stable under the action of repeated loads, called the “stability limit”. When the maximum stress in the granular layer and the subgrade soil do not exceed this stability limit, the granular layer or substrate show resilience after repeated loading. Meanwhile, the accumulation of permanent deformation can be controlled within a limited range.
At present, in the main method of pavement design, the Shell and AI method [21], the permanent deformation of the subgrade was effectively controlled by controlling the compressive strain and the compressive stress on the top of the subgrade. Compressive strain on the top of the subgrade method was mainly based on the direct ratio of material plastic and elastic strain. The elastic strain was controlled within the effective range, and the plastic strain can be effectively controlled [22]. If the elastic strain level of the subgrade was limited, the plastic strain and the permanent deformation of subgrade and pavement can be limited.
The analysis in the previous work shown that there was a good correlation between the variation of subgrade stiffness and the stress [23]. The strain field of subgrade and the size of stress and strain field at a certain depth in subgrade was only related to the stiffness of the subgrade. The strain field in subgrade increases with the decrease of the subgrade stiffness. The function characteristic of bridge–subgrade transition section requires that the transition section to achieve the settlement transition by longitudinal along the pavement, therefore, the permanent deformation of the subgrade can be realized by controlling the change rule of subgrade stiffness.

6. Conclusions

Pavement surface deflection value, tensile strain at the bottom of the middle plane, tensile stress at the bottom of the base layer, and subgrade top surface compressive strain were chosen as the indices of stress state analysis on the transition section. The influence of the subgrade stiffness variation on stress state was discussed in this paper. Based on the analysis, the following conclusions can be made: first, when the subgrade stiffness of bridge–subgrade transition section linear decreased longitudinally along the pavement, the four indicators had a better correlation. In addition, when the stiffness value was low, the rate of change of each index increased, which is caused by the sensitivity of stress state increasing with the decrease of the stiffness value. Second, the stress and strain level in the stress state of the pavement structure were mainly related to the subgrade stiffness and the rate of stiffness change was mainly related to the rate of subgrade stiffness change. Third, when the subgrade stiffness has nonlinear variation in the form of an exponential function, the stress state change within the pavement structure is more uniform and continuous than a stiffness linear variation. It can better ensure the continuity of the overall structure on the pavement.
On the other hand, the variation rule of the vertical compressive stress and vertical compressive strain in the base and subgrade under wheel load was described when the subgrade stiffness changed in the bridge–subgrade transition section. The stress field in subgrade and base was only related to the subgrade stiffness. The rate of stress and strain field in subgrade and base was related to the rate of stiffness variation. When the stiffness was small, the rate of change was large. The variation rule of the stress field was similar to the strain field in base layer, both decrease with the decrease of the subgrade stiffness. The rule of change of the stress and strain field in the subgrade was the opposite, the stress field in the subgrade decreases with the decrease of the stiffness. The strain field increases with the decrease of the stiffness. The stress field and strain field were limited in the propagation depth of the subgrade. The depth of the model was 2 m.
By mastering the variation rule of the strain field in the subgrade, the accumulation of permanent deformation can be predicted scientifically. Theoretical analysis shows that coordination design of the stiffness difference and settlement difference can be realized in the bridge–subgrade transition section by regulating the change rule of subgrade stiffness.

Author Contributions

Formal analysis, Y.Z.; data curation, R.L.; funding acquisition, J.C. All authors have read and agreed to the published version of the manuscript.

Funding

This research was funded by the Science and technology planning project of Zhejiang Provincial Highway and Transportation Management Center (No. 211821200009) and the Science and technology planning project of Zhejiang Provincial Department of Transportation (No. 211821220089).

Institutional Review Board Statement

Not applicable.

Informed Consent Statement

Not applicable.

Data Availability Statement

Not applicable.

Conflicts of Interest

The authors declare no conflict of interest.

References

  1. Wahls, H.E. Design and Construction of Bridge Approaches; Transportation Research Board: Washionton, DC, USA, 1990. [Google Scholar]
  2. Stark, T.D.; Olson, S.M.; Long, J.H. Differential Movement at the Embankment/Structure Interface-Mitigation and Rehabilitation; Final Report; National Technical Information Service: Urbana, IL, USA, 1995. [Google Scholar]
  3. Zhang, H.; Changshun, H.U.; Gao, J. Method for Analyzing Dynamic Vehicle-roadway Interaction in Roadway-bridge Transition Sections. Cent. South Highw. Eng. 2005. [Google Scholar]
  4. Wang, H.; Rath, P.; Buttlar, W.G. Recycled asphalt shingle modified asphalt mixture design and performance evaluation. J. Traffic Transp. Eng. 2020, 7, 205–214. [Google Scholar] [CrossRef]
  5. Ba, R. The Subgrade Disease Characteristics of Bridge-Subgrade Transition Section and Treatment Method Research; Chang’an University: Xi’an, China, 2005. [Google Scholar]
  6. Liu, D. Study on the Theory and Application of Rigid—Flexible Transition in Bridge Jump; Hunan University: Hunan, China, 2001. [Google Scholar]
  7. Yu, H.J. Study on Reasonable Cross-Sectional Connection of Expressway Bridge (Road) Tunnel Transition Section; Chang’an University: Xi’an, China, 2010. [Google Scholar]
  8. Wu, S. Study on Shearing Fatigue Property and Evaluation of Interlayer Contact Condition between Base Course and Surface Course for Semi-Rigid Base Asphalt Pavement; Chang’an University: Xi’an, China, 2013. [Google Scholar]
  9. Zhang, H. Study on Top-Down Crack Propagation Law near Load Formation Mechanism and Area of Asphalt Pavement; Chang’an University: Xi’an, China, 2011. [Google Scholar]
  10. Hu, X.D. Stress Response Analysis of Asphalt Pavement under Measured Tire Ground Pressure of Heavy Vehicle; Tongji University: Shanghai, China, 2006. [Google Scholar]
  11. Deng, X. Road Subgrade and Pavement Engineering, 3rd ed.; China Communications Press: Beijing, China, 2008. [Google Scholar]
  12. Sun, M. Research on the Prediction Structrual Performance of Asphalt Pavement; Chang’an University: Xi’an, China, 2013. [Google Scholar]
  13. Barksdale, R.D. Laboratory evaluation of rutting in basecourse materials. In Proceedings of the Third International Conference on the Structural Design of Asphalt Pavements Grosvenor House, Park Lane, London, UK, 11–15 September 1972. [Google Scholar]
  14. Yao, Z. Structral Design of Asphalt Pavement; China Communications Press: Beijing, China, 2011. [Google Scholar]
  15. Kim, I.T.; Kwon, J.; Tutumluer, E. Rutting of Airport Pavement Granular Layers. In Airfield Pavements. Challenges and New Technologies; ASCE Press: Reston, VA, USA, 2004; pp. 334–347. [Google Scholar]
  16. Gidel, G. A new approach for investigating the permanent deformation behaviour of unbound granular material using the repeated load triaxial apparatus. Bull. Lab. Ponts Chaussees 2001, 233, 5–21. [Google Scholar]
  17. Zhang, Y.J.; Tan, S.L.; Lang, J.C.; Su, S.M. A novel water-based acrylic luminescent coating with long lasting photoluminescence. J. Funct. Mater. Devices 2002, 8, 415–417. [Google Scholar]
  18. Uzan, J. Permanent Deformation in Flexible Pavements. J. Transp. Eng. 2004, 130, 6–13. [Google Scholar] [CrossRef]
  19. Tseng, K.-H.; Lytton, R.L. Prediction of Permanent Deformation in Flexible Pavement Materials. In Implication of Aggregates in the Design, Construction, and Performance of Flexible Pavements; ASTM International: West Conshohocken, PA, USA, 1989; Volume 1016, pp. 154–172. [Google Scholar]
  20. NCHRP. Guide for Mechanistic-Empirical Design of New and Rehabilitated Pavement Structures; NCHRP: Washington, DC, USA, 2004. [Google Scholar]
  21. Huang, Y.H. Pavement Analysis and Design; Pearson: London, UK, 1993. [Google Scholar]
  22. Nassiraei, H.; Rezadoost, P. Stress concentration factors in tubular T/Y-joints strengthened with FRP subjected to compressive load in offshore structures. Int. J. Fatigue 2020, 140, 105719. [Google Scholar] [CrossRef]
  23. Peng, J.; Zhang, J.; Li, J.; Yao, Y.; Zhang, A. Modeling humidity and stress-dependent subgrade soils in flexible pavements. Comput. Geotech. 2020, 120, 103413. [Google Scholar] [CrossRef]
Figure 1. Numerical model of bridge–subgrade transition section.
Symmetry 14 00950 g001
Figure 2. Numerical model grid of subgrade structure.
Symmetry 14 00950 g002
Figure 3. Simplified model of wheel load.
Symmetry 14 00950 g003
Figure 4. (a) Surfacing deflection under the linear change of stiffness, (b) Tension strain of the middle plane under the linear change of stiffness, (c) Transverse tensile stress of the bottom of semi-rigid base under the linear change of stiffness, (d) Longitudinal tensile stress of subgrade under linear change of stiffness, (e) The compressive strain of subgrade under the linear change of stiffness.
Symmetry 14 00950 g004
Figure 5. (a) The deflection value under the nonlinear change of stiffness, (b) Transverse tensile stress at the bottom of base under the nonlinear change of stiffness, (c) Longitudinal tensile stress of subgrade bottom under the nonlinear change of stiffness, (d) Compressive strain on the top of subgrade under the nonlinear change of stiffness.
Symmetry 14 00950 g005
Figure 6. (a) Stress field of base and subgrade when the resilient modulus of subgrade is changed, (b) Distribution of stress field in base, (c) Distribution of stress field in subgrade.
Symmetry 14 00950 g006
Figure 7. (a) Strain field of base and subgrade when the subgrade modulus is changed, (b) Strain field in base, (c) Strain field in subgrade.
Symmetry 14 00950 g007
Figure 8. (a) Distribution of stress field when the subgrade modulus is changed, (b) Distribution of strain field in base when the subgrade modulus is changed, (c) Distribution of strain field in subgrade when the subgrade modulus is changed.
Symmetry 14 00950 g008
Figure 9. (a) The state of stress field when subgrade stiffness varies in different ways, (b) The state of strain field in base when subgrade stiffness varies in different ways, (c) The state of strain field in subgrade when subgrade stiffness varies in different ways.
Symmetry 14 00950 g009
Figure 10. (a) The influence of load on stress field, (b) The influence of load on base strain field, (c) The influence of load on subgrade strain field.
Symmetry 14 00950 g010
Figure 11. (a) Stress and strain in subgrade and base, (b) Stress and strain field in base, (c) Stress and strain field in subgrade.
Symmetry 14 00950 g011
Table 1. Material parameters in the calculation model.
Structural LayerMaterial and ThicknessElastic Modulus EPoisson’s Ratio µ
Upper layerAsphalt concrete ac-10/4 cmE = 1500 MPaµ = 0.3
Middle surfaceAsphalt concrete ac-16/6 cmE = 1200 MPaµ = 0.3
Bottom layerAsphalt concrete ac-20/8 cmE = 1000 MPaµ = 0.3
Semi-rigid baseCement stabilized crushed stone/40 cmE = 1500 MPaµ = 0.3
Subgrade/E = 30,000~10,000 MPaµ = 0.2
E = 10,000~5000 MPaµ = 0.25
E = 5000~1000 MPaµ = 0.3
E = 1000~40 MPaµ = 0.35
AbutmentCement concreteE = 30,000 MPaµ = 0.2
Publisher’s Note: MDPI stays neutral with regard to jurisdictional claims in published maps and institutional affiliations.

