Article

Shaking Table Tests and Simulations of Grouting Sleeve Connecting Prefabricated Bridge Piers

1
School of Civil Engineering, Northeast Forestry University, Harbin 150040, China
2
MCC Capital Engineering & Research Incorporation Limited, Beijing 100176, China
*
Author to whom correspondence should be addressed.
Symmetry 2022, 14(4), 652; https://doi.org/10.3390/sym14040652
Submission received: 8 March 2022 / Revised: 18 March 2022 / Accepted: 21 March 2022 / Published: 23 March 2022

Abstract

:
To investigate the seismic performance of prefabricated piers with a grouting sleeve connection, two scaled model specimens of symmetrical prefabricated piers with different reinforcement anchorage lengths, and two cast-in-place (CIP) comparison symmetrical specimens, were designed and manufactured. The fabricated specimens were connected by a grouting sleeve, which was in the column of the pier. The height of the pier column of the test piece was 1.425 m, the diameter of the pier column was 0.25 m, and the size of the bearing platform was 0.85 m × 0.85 m × 0.5 m. Shake table tests were performed on the specimens to evaluate crack development, dynamic characteristics, acceleration response and relative displacement of the pier tops, as well as strain in the plastic hinge area. The results revealed the dominant failure mode of the test piers was bending failure, while the cracks were generally horizontal through-cracks. The failure location of the prefabricated specimens with the grouting sleeve was concentrated within one diameter of the pier in the upper sleeve region. Compared with the CIP specimens, the plastic hinge exhibited an obvious upward movement. Under a maximum test loading condition, the peak acceleration at the pier top of the fabricated pier was 11.0% smaller than that of the CIP specimen, the peak relative displacement was 34.2% smaller than that of the CIP specimen, and the peak tensile strain of the pier body was 46.8% smaller. The seismic performance of the prefabricated pier connected via the grouting sleeves was barely affected by changing the anchoring length of the reinforcements in the grouting sleeves. An ABAQUS finite element model was established for the specimens, with good agreement between the model and experimental results. When the seismic load was 0.65 g, the difference between the peak acceleration of the pier top in the X direction and the Y direction of the numerical simulation and the experimental data was less than 15%.

1. Introduction

China lies between two major global seismic belts, the circum Pacific seismic belt and the Eurasian seismic belt. Due to the compression of the Pacific, India and Philippine sea plates, the seismic fault zone is well developed, and earthquakes occur frequently. Over 70 earthquakes of magnitudes between 7.0 and 7.9, and seven earthquakes of magnitude 8.0 or above, have occurred in China since the 20th century. The majority of earthquakes (e.g., Tangshan and Wenchuan) have had grave impacts on the national economy [1]. Seismicity in China is characterized by high frequency, high intensity, shallow sources and wide distribution, thus earthquake disasters can be very serious. As an indispensable component of traffic engineering, bridges not only exhibit a complex structure, but are also highly costly. Once a bridge is damaged, the recovery of the traffic line following an earthquake proves to be difficult, preventing efficient operation of any required rescue operation [2]. Therefore, it is of great practical importance to improve the seismic performance of bridge structures. As the main load-bearing component of bridges, piers play an important role in the seismic performance of bridges.
In recent years, China has vigorously promoted prefabricated manufacture of piers. Such piers are widely used in the substructure of large and medium-sized bridges due to their ease of construction, economic efficiency and positive environmental impacts. For example, grouting sleeves are used in the connection of the column foundations, column caps and column units of the S6 and S7 bridges on the Shanghai Jiamin highway [3]. Numerous experiments and theoretical studies have been performed to clarify the mechanisms of grouting sleeve assembled bridges. Qian Han [4] proposed a method to evaluate the mechanism of shear cracking and the shear strength of precast columns connected by grouting sleeves. Yang Liu [5,6] designed and constructed five pier specimen models that were then subjected to quasi-static tests. The energy dissipation capacity of grouting sleeves in the column was weaker than that for the CIP specimens, while the ultimate bearing capacity was stronger than that of CIP specimens. Furthermore, the seismic performance of the sleeve connector in the pile cap was similar to that of CIP. Guangtao Xin [7] designed a one-third scale CIP model and carried out quasi-static tests on three sample types. Following this, the authors developed and verified an estimation method for the bearing capacity of a grouting sleeve assembled pier. Ruilong Wang [8] investigated the seismic performance of a prefabricated pier with a grouting sleeve connection. The results demonstrated the vibration response of the prefabricated pier with the grouting sleeve to be similar to that of the CIP pier. The ultimate lateral force of the prefabricated pier with the grouting sleeve was observed to increase by approximately 10%, with a ductility that was 40–60% weaker than that of the CIP specimen. M. J. Ameli [9] designed and constructed three pier specimens with a similarity ratio of 1:2. The specimens were then subjected to pseudo-static tests in order to develop a calculation model, with strong agreement between the final test results and model results observed. Despite its common application in the studies referred to, quasi-static testing is less accurate in simulating the stress mechanism of bridge piers under real earthquake loads compared to the shaking table test.
To better simulate the seismic characteristics of bridge piers under real seismic load conditions, numerous scholars have performed shaking table tests. Wei Yuan [10] prepared four structural specimens with different degrees of corrosion and evaluated the natural period, damping ratio, displacement and acceleration response, and average curvature distribution of specimens, using shaking tables tests. Using a deep-water high-pier bridge as the prototype, and applying the elastic similarity law, Gaojie Yun [11] performed a shaking table test on a 1:220 geometric scale model under the combined actions of earthquake, wave and current. To consider the seismic characteristics of curved bridges, Zhang et al. [12] studied their damping and anti-unseating properties. Taking a double-tower-pier curved bridge as an engineering example, a finite element model of the curved bridge, considering the non-uniform contact collision between adjacent components, was established and analyzed using ABAQUS; the results indicated that a combination of three kinds of seismic measures were effective at reducing the response to pounding force, stress, damage, girder torsion and displacement, and achieved the goals of seismic mitigation and prevention of unseating. Xia Xiushen [13] proposed a railway pier with a concrete column as the key component and a steel truss as the replaceable component. Shaking table tests were carried out with a 1/10 scale model to analyze the acceleration response, displacement and strain of the pier under three input seismic wave types, and to determine the pier components sensitive to seismic action. Deng et al. [14] strengthened the pier with steel jacket and carried out shaking table tests, then established the optical fiber model using OpenSees. The results showed that the seismic performance of pier strengthened with steel jacket was significantly improved, and the simulation results were consistent with the experimental results.
At present, research concerning the seismic performance of fabricated piers is mainly based on quasi-static load testing. The research objects of the shaking table test are mostly CIP piers, and there is a lack of systematic research on the seismic performance of fabricated piers. Moreover, due to the essential difference between the quasi-static test and real ground motion, the test cannot truly reproduce the nonlinear characteristics of the rapid change in ground motion with time when earthquakes occur. The test therefore has significant limitations, as most of the test data do not closely represent the engineering reality. Therefore, it is very important to carry out shaking table tests and dynamic time history analysis on prefabricated piers.
In this paper, a 38.6 m long prefabricated bridge was taken as the study subject and four pier scale specimens were designed and manufactured at a 1:4 scale. Shaking table tests were performed on the scale specimens to analyze and compare seismic performance differences between a grouting sleeve connected prefabricated pier and a CIP pier under strong earthquake conditions. In addition, the influence of the reinforcement anchorage length on the seismic response of the prefabricated pier was considered.

2. Shaking Table Test

2.1. Specimen Design and Fabrication

The test model bridge was based on a pedestrian pre-stressed concrete continuous girder bridge. The main span pier included a prefabricated column. The pier height, section radius, and cap size were 5.4 m, 0.5 m, and 4.5 × 2 × 1.5 m, respectively. The grouting sleeve, which connected the column and pile cap, was arranged on the bottom surface of the pier column. By comprehensively considering the test conditions, the scale ratio was set as 1:4. Table 1 reports the similarity proportions of other key specimen parameters based on the similarity principle [15]. The geometrical parameters of the four specimens were as follows: pier height of 1.425 m, section radius of 0.125 m, pile cap size of 0.85 × 0.85 × 0.5 m, weight box size of 0.5 × 0.5 × 0.4 m, and counter-weight of 0.4 t. Two specimens were prefabricated piers connected by a grouting sleeve and the remaining two were CIP piers. The two CIP specimens were comparison pieces with the same design, marked as CIP1 and CIP2. The only difference between the two prefabricated specimens was the reinforcement anchoring length in the grouting sleeve (10 d and 8 d, marked as GS1 and GS2, respectively). The specimens were made of C20 concrete, and the longitudinal reinforcement of the model specimen was HRB400, with a reinforcement ratio that was 1.80% similar to that of the original pier. The stirrup was an HPB300 plain bar with a volume reinforcement ratio of 0.43%. Figure 1 depicts the specific reinforcement.

2.2. Test Scheme Design

The test was performed in the 5 × 5 m triaxial excitation shake table system located at the Institute of Engineering Mechanics, China Earthquake Administration. Table 2 reports the key details of the parameters. The bridge area is a class II site category and the seismic fortification level is v. Considering the type of original pier site, and the seismic fortification level and dynamic characteristics of the specimen, El Centro, Taft 111 and Taft 21 waves were selected as the seismic wave inputs for the test.
By comprehensively considering the structural characteristics of the CIP and fabricated piers, as well as the finite element simulation results and key research aims, we arranged the sensors in a vulnerable area of the pier where strong seismic responses are common. Structural seismic response indexes (i.e., concrete strain, reinforcement strain, displacement of the pier top and table face, and acceleration time-history response) were measured during the pier loading process. To test the seismic strain response of the key bridge pier components, acceleration sensors and wire displacement meters were arranged on the top and platform of the bridge pier in the X and Y directions, respectively. Moreover, concrete strain and steel strain gauges were placed at 10 cm and 38 cm from the bottom of the bridge pier. For each specimen, four acceleration sensors, four wire-drawing displacement meters, six reinforcement strain gauges and eight concrete strain gauges were provided. Figure 2 depicts the specific locations of the measuring points.

2.3. Test Conditions

For the El Centro wave, the loading mode applied X + Y bidirectional excitation, and the ratio of the acceleration peak in the X and Y directions was 1:0.85. For the Taft wave, two loading modes were applied: for the first mode, two natural waves (Taft 21 and Taft 111) were taken as the X and Y directions, respectively, referring to real seismic records, while the input ratio was determined as 1:0.88; for the second mode, the natural wave Taft 111 was applied as X + Y bidirectional excitation and the ratio of the acceleration peak in the X and Y directions was 1:0.85. The input peak ground acceleration (PGA) of the shaking table was determined by considering the seismic load intensity under the seismic fortification level specified in the Chinese Code for Seismic Design of Buildings (GB 50011–2010) and the Chinese Code for the Seismic Design of Highway Bridges (JTG/t2231–01–2020). The custom peak value was inserted to ensure continuity of the loading conditions. White noise was included following each seismic wave input to analyze the changes in the dynamic characteristics of the bridge piers. Table 3 reports the arrangement of the test loading conditions.

3. Analysis of the Test Results

Following a PGA of 0.274 g, the CIP and fabricated specimens initially produced cracks from the bottom of the pier and from the upper region of the sleeve, respectively. As the PGA increased, the cracks continued to extend upwards, while the original cracks became wider and deeper and new cracks appeared. All pier specimens exhibited horizontal through-cracks, five for the CIP specimens and four for the fabricated specimens. Specific test phenomena under each PGA are shown in Table 4.
The test results showed the damage to the CIP pier specimens to generally manifest as the generation and development of cracks in the plastic hinge area of the pier bottom with increasing PGA. The damage to the prefabricated bridge pier specimen typically appeared as the occurrence and development of cracks at the top of the bridge pier sleeve. The plastic hinge region of the fabricated specimen was observed to clearly move upward, while cracks in the CIP pier specimens were denser than those in the prefabricated specimens, with less observed spacing (Figure 3). Moreover, the crack generation and development in the CIP bridge pier specimens was more rapid than in the prefabricated bridge pier specimens. Thus, the damage development of the prefabricated bridge pier specimens was observed to be slower than that of the CIP bridge pier specimens.

3.1. Dynamic Characteristics of Specimens

The time history of the input acceleration determined from the shaking table test differed slightly from the actual acceleration time history of the table surface, while the peak values differed within a reasonable range. Taking the three operating conditions with the greatest difference in PGA (0.391 g) as examples, Figure 4 compares the input curve of the acceleration time history with the measured values of the table surface. The values of the acceleration time history measured on the table surface were in good agreement with the theoretical waveform, with the peak values for the three cases differing by 13.6%, 3.1% and 9.0%, respectively. The input seismic waves were thus reproduced accurately in the shaking table test.
Table 5 reports the frequency variations of each specimen with the PGA. The frequency of each specimen was observed to range from 6 to 11 Hz and decreased with increasing PGA. This was attributed to the damage to the specimen under the action of ground motion, which consequently reduced the stiffness, frequency attenuation and period extension of the specimen. Comparing CIP1, CIP2, GS1 and GS2 revealed limited differences between the frequencies. This indicated the degree of similarity between the initial structural stiffness of the prefabricated and CIP specimens. However, after the action of an earthquake load, the frequency of the CIP specimens was significantly lower than that of the prefabricated specimens, and the damage to the former was more serious. The final basic frequencies of specimens GS1 and GS2 were almost equal, indicating that changing the anchoring length of the reinforcement of the grouting sleeve had little effect on the reduced final fundamental frequency of the prefabricated specimens.
Figure 5 depicts the basic frequency change rate curve of each specimen for increasing PGA. Comparing CIP1, CIP2, GS1 and GS2 revealed the frequency decline of the CIP specimens to be more rapid than that of the prefabricated specimens. This indicated that the damage and frequency attenuation of the CIP specimens were relatively severe, with GS1 and GS2 exhibiting reductions that were essentially equal, demonstrating the limited effect of the reinforcement anchoring length of the grouting sleeve on reducing the specimen basic frequency. Compared with the CIP specimen, the column of the fabricated specimen had a grouting sleeve, and the addition of the grouting sleeve caused the stiffness at the bottom of the column of the fabricated specimen to be significantly greater than that of the CIP specimen, making the fabricated specimen less likely to be damaged after being subjected to a seismic load. Therefore, the damage rate of the cast-in-situ specimen was higher than that of the CIP specimen.

3.2. Acceleration Response of the Specimen Pier Top

Figure 6 illustrates the peak accelerations of the pier top of each specimen under three input conditions. The peak acceleration of all specimens increased with PGA, with the pier top peak accelerations of the specimens observed to be slightly larger than the input accelerations. This was attributed to the greater stiffness of the specimens, resulting in a more obvious amplification of the acceleration. Under the same PGA, GS2 exhibited the lowest peak acceleration, followed by GS1, CIP1 and CIP2, respectively. There was a limited difference between the CIP and prefabricated specimens for PGA equal to 0.391 g, indicating that the influence of the specimen structure on the peak acceleration of the pier top was small for PGA values less than 0.391 g. However, large differences were observed once PGA reached 0.391 g. The pier-top peak acceleration of the CIP specimen was greater than that of the prefabricated specimen. The peak accelerations of GS1 and GS2 were observed to decrease by 13% and 9%, respectively, compared to CIP1 under an El Centro wave of 0.9 g. This was because the grouting sleeve was employed at the bottom of the fabricated specimen, resulting in a shorter vibration range for the pier column of the fabricated specimen compared to that of the CIP specimen, and consequently, a smaller vibration amplitude. Comparing GS1 and GS2 demonstrated that the change in the reinforcement anchoring length in the reinforcement sleeve had little influence on the specimen. Thus, varying the anchoring length of the reinforcement had a minimal impact on the dynamic response of the specimen within the allowable range of the specification.
Figure 7 demonstrates that the acceleration time histories of the prefabricated pier specimen connected by the grouting sleeve and the CIP pier were essentially the same. However, the former exhibited a smaller acceleration peak value, thus further reducing the shaking of the upper bridge structure, and under the same upper structure mass, the inertial force may also be reduced.

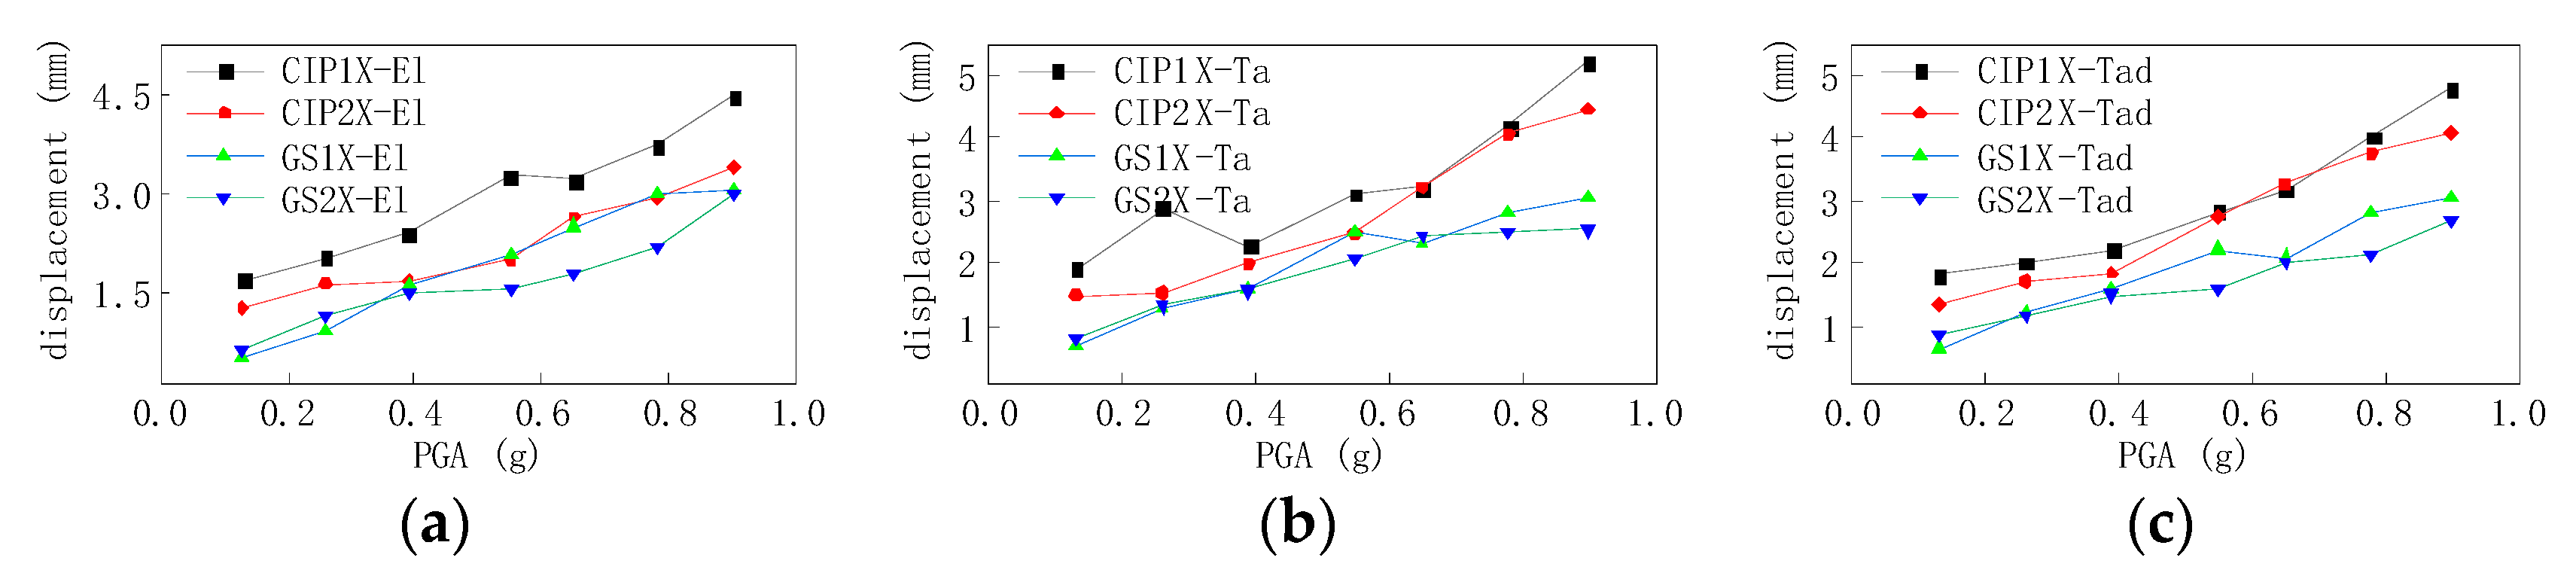
3.3. Displacement Analysis

Figure 8 presents the maximum relative displacements at the top of the prefabricated and CIP piers in the X direction under three seismic wave loading conditions. As demonstrated in Figure 5, the relative displacement of the pier top increased with PGA for all specimens. Under the same seismic wave loading condition, the prefabricated pier exhibited a lower relative displacement peak value compared to that of the CIP pier. This was attributed to the greater stiffness of the fabricated pier compared to the CIP pier for PGA values exceeding 0.391 g due to the grouting sleeve at the lower component. This consequently reduced the relative displacement of the top of the fabricated pier compared to that of the CIP pier under higher seismic loading conditions. Small differences existed between the peak values of the relative displacements at the pier bottom of the two prefabricated specimens. This indicated that changing the anchorage length of the reinforcement in the sleeve had little effect on the structural displacement response.

3.4. Strain Analysis

Figure 9 depicts the curves of the peak concrete tensile and compressive strains of the four specimens with increasing PGA. The strain values of all specimens exhibited an increasing trend with PGA. Under the same PGA values, the tensile strain and compressive strains of the CIP specimens were larger than those of the prefabricated pier specimens. At a PGA of 0.9 g, the average peak value of the compressive concrete strain of the two CIP specimens was 2.37 times that of the prefabricated pier specimens, and 1.88 times for the tensile strain. The peak value of the compressive strain exceeded that of the tensile strain under the same PGA, with concrete mainly bearing the compression. This indicates that the design of the specimens was reasonable. The upward trend of the curve suggests a relatively moderate growth of the strain prior to the working condition of 0.391 g, while following this, the growth rate of the strain became larger. Thus, the damage to the bridge pier began to intensify after 0.391 g. This resulted in damage to the local concrete.
Figure 10 presents the peak tensile strain curves of the steel bars in the plastic hinge zone of the four specimens with increasing PGA. Due to errors in the manufacturing process of the specimens, only the measuring point with the largest measured strain value at each test pier was taken for analysis. The strain peak of the specimen increased with increasing PGA. This was linked to the enhanced inertial force generated by the top load of the specimen with increasing PGA, resulting in continuous increase in the strain of the main stress component of the specimens. Almost no differences were observed in the reinforcement strain of the CIP and prefabricated specimens. This was because both reinforcements were maintained in the elastic stage, where the strain was small and differences were insignificant. The peak strain curves of the two prefabricated specimens did not exhibit any marked differences, demonstrating that variation in the reinforcement anchorage length in the sleeve had little effect on the strain of the reinforcement in the prefabricated bridge pier connected by the grouting sleeve.

4. Comparison between the Finite Element Simulations and Test Results

4.1. Finite Element Modeling Process

The finite element software ABAQUS (version 6.14, ABAQUS Inc., Palo Alto, CA, USA) was employed to analyze the time history of the finite element simulation of the shake table. The CIP model specimen included three components: the reinforcement skeleton, the bridge pier and the pile cap, while the prefabricated specimen also contained sleeve and grouting material. The pier reinforcement was drawn via the line-plane method, the sleeve via the shell-stretch method, and the bridge pier, pile cap and grouting material via the solid-stretch method. The concrete and other solid parts adopted solid unit C3D8R, the sleeve adopted the S4R unit, and the reinforcement adopted the supporting truss unit T3D3. Figure 11a,b depicts the overall finite element model structure, reinforcement and sleeve. The concrete damaged plasticity (CDP) model was adopted as the concrete constitutive model, while the double-broken-line model was used for reinforcement.
The reinforcement cage was inlaid into the concrete and the sleeve was bound together with the grouting material. Both were subsequently inlaid into the concrete pier. Note that slippage was not considered. The pier and pile cap of the CIP specimen formed one component, while for the prefabricated specimen, the general contact-hard contact simulation was adopted for the pier and pile cap. The seismic wave was loaded via acceleration and angular acceleration in the boundary conditions.

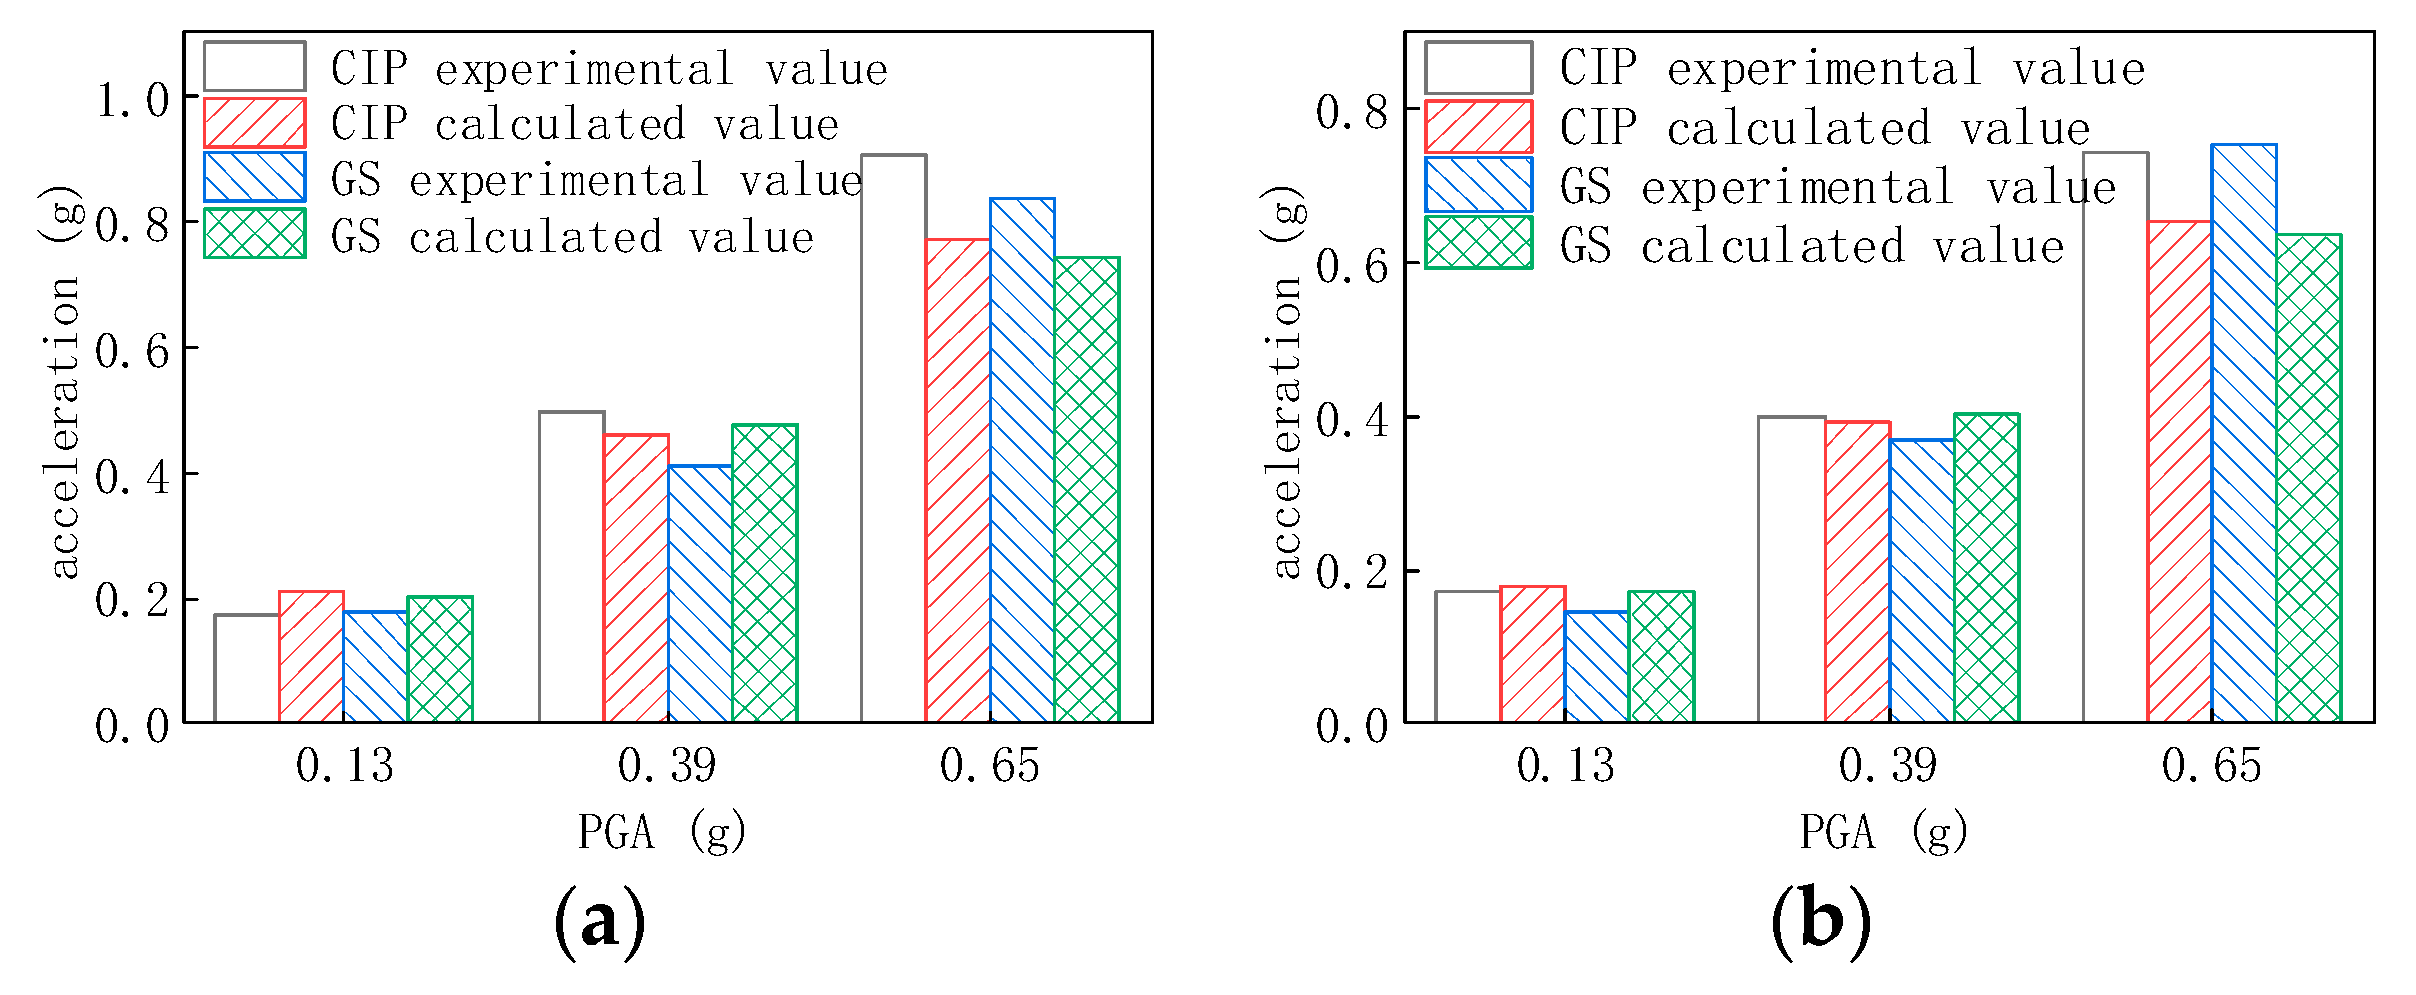
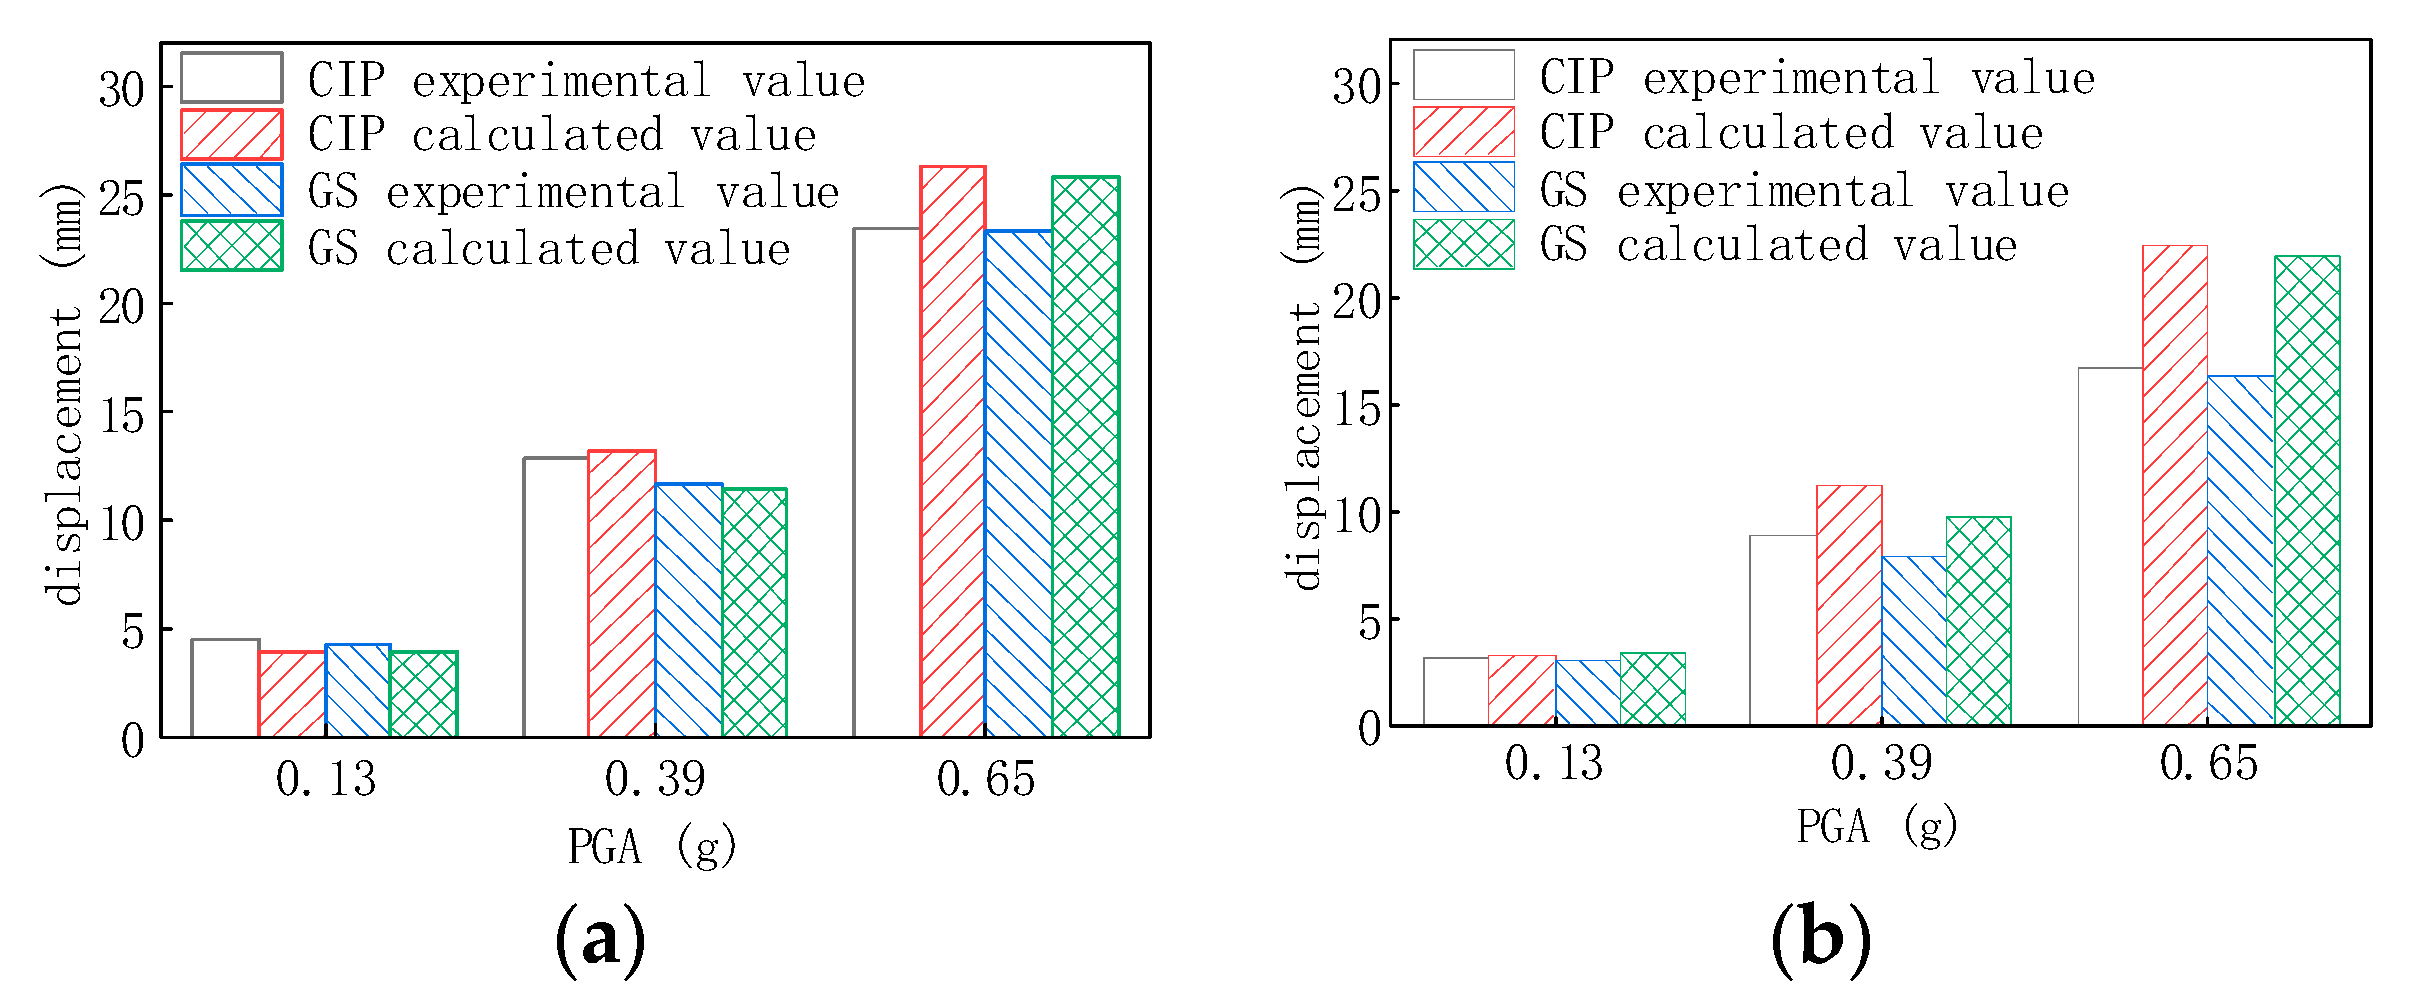
4.2. Comparison of Finite Element Numerical Results

Figure 12 depicts the test peak values of the absolute acceleration and finite element numerical simulations at the pier tops of the CIP and prefabricated specimens under the El Centro wave. There was little difference between the test values and the finite element numerical simulations for low PGA values (i.e., less than or equal to 0.391 g). When the PGA was 0.65 g, the differences between the two specimens were large. The difference between the test and simulation values of the CIP specimen was 17%, while the difference between the peak test value and simulation of the fabricated specimen was 12.5%. This was attributed to the difficulty for the finite element method to accurately simulate all test conditions of the test. In particular, if an artificial test error existed, the errors became more obvious for larger PGA values. Moreover, the finite element simulation failed to adopt incremental dynamic analysis, with no corresponding damage accumulation. As a result, the stiffness of the finite element specimen at larger PGAs was larger than that of the real test, while the peak acceleration at the pier top was reduced.
Figure 13 presents the time-history curves of the finite element simulations and the test pier-top acceleration for the CIP and prefabricated specimens at a PGA equal to 0.65 g. A good fit was observed between the finite element and test data, with a consistent general trend. However, differences existed in the peak value properties.
Figure 14 presents the peak test values of the absolute pier-top displacement and the finite element numerical simulations of the CIP and prefabricated specimens under the El Centro wave. At low PGA values (i.e., less than or equal to 0.391 g), there was little difference between the test values and the finite element numerical simulations in the X direction, while a big difference was observed in the Y direction. When the PGA was 0.65 g, large differences were observed between the test values and simulations of the two specimen types. More specifically, the value for the pier top displacement peak value in the X direction of the CIP (pier) specimens was 10.9% (9.9%) different from that of the fabricated specimen.
Figure 15 presents the time-history curves of the finite element simulations and test pier top displacement of the CIP and prefabricated specimens at a PGA of 0.65 g. A good fit was observed between the finite element data and experimental data, and the overall trend was consistent, with the exception of a gap in the peak value. This may be attributed to the cumulative damage in the test, which reduced the overall stiffness. When the PGA was large, the overall displacement did not reach the levels determined by the finite element method.

4.3. Comparisons of the Pier Body Failure State

Figure 16 depicts the failure modes when the finite element PGA of the CIP and prefabricated specimens was 0.65 g. Large differences were observed between the two specimens in terms of the failure positions. More specifically, for the CIP specimens, the failure positions were concentrated within one radius (starting from the bottom of the pier), while they also had a tendency to extend upwards. In contrast, due to the existence of the sleeve at the bottom of the pier, the failure positions of the prefabricated specimens moved upwards. Furthermore, the damaged area of the CIP specimens was smaller and more concentrated than that of the prefabricated specimens. These results were consistent with the real test values.

5. Conclusions

We performed shake table tests and finite element simulations for two CIP specimens and two prefabricated specimens with anchored reinforcement in the sleeve. The results demonstrated that:
(1) As the PGA increased, the most common crack type of the specimens was the annular through-crack, which gradually showed bending failure. The cracks of the CIP specimens generally appeared within the range of one pier diameter (starting from the bottom of the pier), while the cracks of the prefabricated specimens were observed to be within the range of one pier diameter above the sleeve (within the range of 35–60 cm from the pier bottom), and the plastic hinge exhibited an upward shift. The cracks of the CIP specimens were denser than those of the prefabricated specimens, and the stiffness of the latter was greater than that of the former. The dynamic characteristics of the bridge pier determined via the white noise sweep frequency revealed the reduced stiffness of the prefabricated specimens to be significantly less than that of the CIP specimens, while the damage to the CIP specimens increased in severity after the PGA exceeded 0.391 g.
(2) Under the same loading conditions, the peak acceleration of the pier top, the peak value of the relative displacement of the pier top, and the strain response in the plastic hinge area of the prefabricated specimen significantly decreased compared to those of the CIP specimens. Such a decrease can inhibit the inertia force generated by the superstructure mass under a seismic load and can thus improve the seismic performance of the pier. No significant differences were observed in the pier-top peak acceleration, relative peak displacement, and strain response of the prefabricated piers. It can be concluded that variation in the reinforcement anchorage length in the sleeve had little influence on the seismic performance of the prefabricated piers connected by the grouting sleeve within the feasible range.
(3) The failure modes, acceleration time-history curves and displacement time-history curves of the specimens obtained via finite element analysis were in good agreement with the test results, indicating the suitability of the finite element model. Further research will focus on the seismic performance of the grouting sleeve prefabricated piers and CIP piers through finite element analysis.

Author Contributions

Conceptualization, M.Y., Y.J. and D.L.; formal analysis, analysis and writing, M.Y.; writing and review, M.Y. and Y.J.; methodology, M.Y. All authors have read and agreed to the published version of the manuscript.

Funding

This study was supported by the Natural Science Foundation of Heilongjiang Province of China (E2017003) and the Scientific Research Project of Capital Engineering & Research Incorporation Limited of China (01-20090230-286-304369).

Data Availability Statement

Not applicable.

Conflicts of Interest

The authors declare no conflict of interest.

References

  1. Zhang, X.; Wu, J. Earthquake disaster investigation and risk assessment. City Dis. Reduct. 2021, 2, 10–13. [Google Scholar]
  2. Li, J.Z.; Guan, Z.G. Research Progress on Bridge Seismic Design: Target from Seismic Alleviation to Post earthquake Structural Resilience. China J. Highw. Transp. 2017, 30, 1–9, 59. [Google Scholar]
  3. Xiang, Y.; Zhu, S.; Zhao, Y. Research and development on accelerated bridge construction technology. China J. Highw. Transp. 2018, 31, 1–27. [Google Scholar]
  4. Han, Q.; Li, X.; Xu, K.; Lu, Y.; Wang, Z. Shear strength and cracking mechanism of precast bridge columns with grouted sleeve connections. Eng. Struct. 2021, 230, 111616. [Google Scholar] [CrossRef]
  5. Liu, Y. Study on the Joint Mechanical Behavior of Precast Bridge Piers with Grouted Sleeve Connection. Master’s Thesis, South China University of Technology, Guangzhou, China, 2020. [Google Scholar]
  6. Liu, Y.; Li, X.; Zheng, X. Experimental study on seismic response of precast bridge piers with double-grouted sleeve connections. Eng. Struct. 2020, 221, 111023. [Google Scholar] [CrossRef]
  7. Xin, G.; Xu, W.; Wang, J. Seismic performance of fabricated concrete piers with grouted sleeve joints and bearing-capacity estimation method. Structures 2021, 33, 169–186. [Google Scholar] [CrossRef]
  8. Wang, R.; Ma, B.; Chen, X. Seismic performance of pre-fabricated segmental bridge piers with grouted splice sleeve connections. Eng. Struct. 2021, 229, 111668. [Google Scholar] [CrossRef]
  9. Ameli, M.J.; Pantelides, C.P. Seismic Analysis of Precast Concrete Bridge Columns Connected with Grouted Splice Sleeve Connectors. J. Struct. Eng. 2016, 143, 04016176.1–04016176.13. [Google Scholar] [CrossRef]
  10. Wei, Y.; Guo, A.; Wei, Y. Shaking table tests of coastal bridge piers with different levels of corrosion damage caused by chloride penetration. Constr. Build. Mater. 2018, 173, 160–171. [Google Scholar]
  11. Yun, G.; Liu, C. Shaking table tests on a deep-water high-pier whole bridge under joint earthquake, wave and current action. Appl. Ocean. Res. 2020, 103, 102329. [Google Scholar] [CrossRef]
  12. Li, Z.; Kang, S.; You, C. Seismic Mitigation of Curved Continuous Girder Bridge Considering Collision Effect. Symmetry 2022, 14, 129. [Google Scholar] [CrossRef]
  13. Xia, X.; Zhang, X.; Wang, J. Shaking table test of a novel railway bridge pier with replaceable components. Eng. Struct. 2021, 232, 111808. [Google Scholar] [CrossRef]
  14. Deng, B.; Jia, Y.; Liang, D. Study on the Seismic Performance of Prefabricated Single-Segment Steel Jacket Bridge Piers. Symmetry 2021, 13, 2312. [Google Scholar] [CrossRef]
  15. Zhang, M. Study on similitude laws for shaking table tests. Earthq. Eng. Eng. Dyn. 1997, 2, 52–58. [Google Scholar]
Figure 1. Reinforcement diagram of specimen: (a) prefabricated specimen; (b) CIP specimen.
Symmetry 14 00652 g001
Figure 2. Layout of measuring points: (a) prefabricated specimen; (b) CIP specimen.
Symmetry 14 00652 g002
Figure 3. Crack distribution after shaking table test. (a) CIP1 specimen; (b) CIP2 specimen; (c) GS1 specimen; (d) GS2 specimen.
Symmetry 14 00652 g003
Figure 4. Time history diagram of table collection acceleration and input acceleration: (a) El Centro wave; (b) Taft 111 wave; (c) Taft 21 wave.
Symmetry 14 00652 g004
Figure 5. Frequency change rate diagram of each specimen.
Symmetry 14 00652 g005
Figure 6. Peak value of acceleration at the top of pier: (a) El Centro wave; (b) Taft 111 wave; (c) Taft 111+21 wave.
Symmetry 14 00652 g006
Figure 7. Acceleration time history diagram of pier top: (a) El Centro wave; (b) Taft 111 wave; (c) Taft 111+21 wave.
Symmetry 14 00652 g007
Figure 8. Peak diagram of relative displacement of pier top: (a) El Centro wave; (b) Taft 111 wave; (c) Taft 111+21 wave.
Symmetry 14 00652 g008
Figure 9. Peak concrete strain of specimen: (ac) tensile strain; (df) compressive strain.
Symmetry 14 00652 g009
Figure 10. Peak tensile strain of longitudinal reinforcement in plastic hinge region of specimen: (a) El Centro wave; (b) Taft 111 wave; (c) Taft 111+21 wave.
Symmetry 14 00652 g010
Figure 11. Finite element model: (a) Finite element model of specimen; (b) Steel bar and sleeve construction.
Symmetry 14 00652 g011
Figure 12. Peak acceleration of pier top: (a) X-direction acceleration peak of specimen; (b) Y-direction acceleration peak of specimen.
Symmetry 14 00652 g012
Figure 13. Acceleration time history of pier top: (a) X-direction acceleration peak of specimen; (b) Y-direction acceleration peak of specimen.
Symmetry 14 00652 g013
Figure 14. Peak displacement of pier top: (a) X-direction acceleration peak of specimen; (b) Y-direction acceleration peak of specimen.
Symmetry 14 00652 g014
Figure 15. Acceleration time history of pier top: (a) X-direction acceleration peak of specimen; (b) Y-direction acceleration peak of specimen.
Symmetry 14 00652 g015
Figure 16. Finite element simulation of damage morphology: (a) CIP specimen; (b) prefabricated specimen. Some like 9.609e-01 mean 9.609 × 10⁻¹.
Symmetry 14 00652 g016
Table 1. Similar relationship for the mode.
Physical QuantitySimilarity RelationSimilitude Ratio
length l a 1/4
area S a = l a 2 1/16
displacement χ a = l a 1/4
elastic modulus E a 0.689
equivalent density ρ a ¯ = m o + m a + m l m l a 3 m p + m p l 1.409
time t a = l a ρ a ¯ / E a 0.358
speed v a = E a / ρ a ¯ 0.699
acceleration a a = E a / l a ρ a ¯ 1.957
l a : length scale factor, S a : area scale factor, χ a : displacement scale factor, E a : elastic modulus scale factor, ρ a ¯ : equivalent density scale factor, m o : model’s own mass, m a : artificial mass, m l m : live load mass, m p : prototype mass, m p l : prototype live load mass, t a : time scale factor, v a : speed scale factor, a a : acceleration scale factor.
Table 2. Parameters of shaking table.
Platform SizeMaximum LoadMaximum Overturning MomentMaximum Acceleration at Full LoadMaximum SpeedMaximum DisplacementFrequency Range
5 m × 5 m30 t75 t-m1 g60 cm/s±8 cm0.5–40 Hz
Table 3. The conditions of the test.
ConditionLoading ModePGAConditionLoading ModePGA
1El Centro0.137 g5El Centro0.650 g
Taft 111Taft 111
taft111/taft21taft111/taft21
2El Centro0.274 g6El Centro0.783 g
Taft 111Taft 111
taft111/taft21taft111/taft21
3El Centro0.391 g7El Centro0.900 g
Taft 111Taft 111
taft111/taft21taft111/taft21
4El Centro0.550 g
Taft 111
taft111/taft21
Table 4. Phenomena of the test.
Loading ConditionsTest Observations
0.137 gThe specimens vibrated slightly, and no visible cracks were observed.
0.274 gThe vibration of the specimens was obvious and slight cracks began to appear. Short cracks were observed within a range of 25 cm at the bottom of the CIP specimens, while cracks appeared within a range of 35–60 cm from the bottom of the prefabricated specimens. The majority of the cracks were horizontal.
0.391 gThe vibration of the specimens intensified, and the cracks increased. The original cracks began to develop and became longer. The crack widths barely changed.
0.55 gThe vibration of the specimens was markedly enhanced, and the cracks continued to increase. The original cracks began to develop and became longer.
0.65 gThe original cracks began to widen and continued to extend.
0.783 gThe specimens swung obviously and there was a sound of collision between the pile cap and the table surface in test. The newly added cracks of the CIP specimen were reduced, and the cracks gradually formed a circular connection. The cracks of the prefabricated specimens no longer increased, and the original cracks continued to extend laterally.
0.9 gThe vibration of the specimens became severe, and circular through-cracks were observed. For the CIP specimens, new cracks no longer appeared, and the original cracks continued to widen and extend laterally. The original cracks of the prefabricated specimens widened and extended gradually to form horizontal penetrating cracks, while for the CIP specimens, the cracks continued upward.
Table 5. Fundamental frequency (Hz) of model specimen under various conditions.
PGA/gCIP1CIP2GS1GS2
initial9.609.769.9110.90
0.1379.039.199.2910.48
0.2748.448.518.879.93
0.3918.828.139.0810.10
0.5508.188.178.189.98
0.6507.477.348.509.73
0.7837.277.478.0510.10
0.9006.896.888.039.27
change rate28.15%29.51%18.97%15.88%
Publisher’s Note: MDPI stays neutral with regard to jurisdictional claims in published maps and institutional affiliations.

