
Symmetric versus Asymmetric Features of Homologous Homodimeric Amine Oxidases: When Water and Cavities Make the Difference

 , , , , ,
Abstract
:1. Introduction
2. Materials and Methods
2.1. Enzymes
2.2. Fluorescence Assays
2.3. Molecular Graphics and Cavity Detection
2.4. Molecular Dynamics and Contact Network Analysis
2.5. Protein Contact Networks Analysis
- A clustering color map: a graphical representation of the clustering matrix, whose generic element, , reports the number of the cluster, which is identified by the clustering algorithm, as 1 if the i-th and the j-th residues (nodes) belong to the same cluster, and as 0 if otherwise;
- A clustering heat map projected onto ribbon protein structures; the residues belonging to the same clusters have the same colors.
3. Results and Discussion
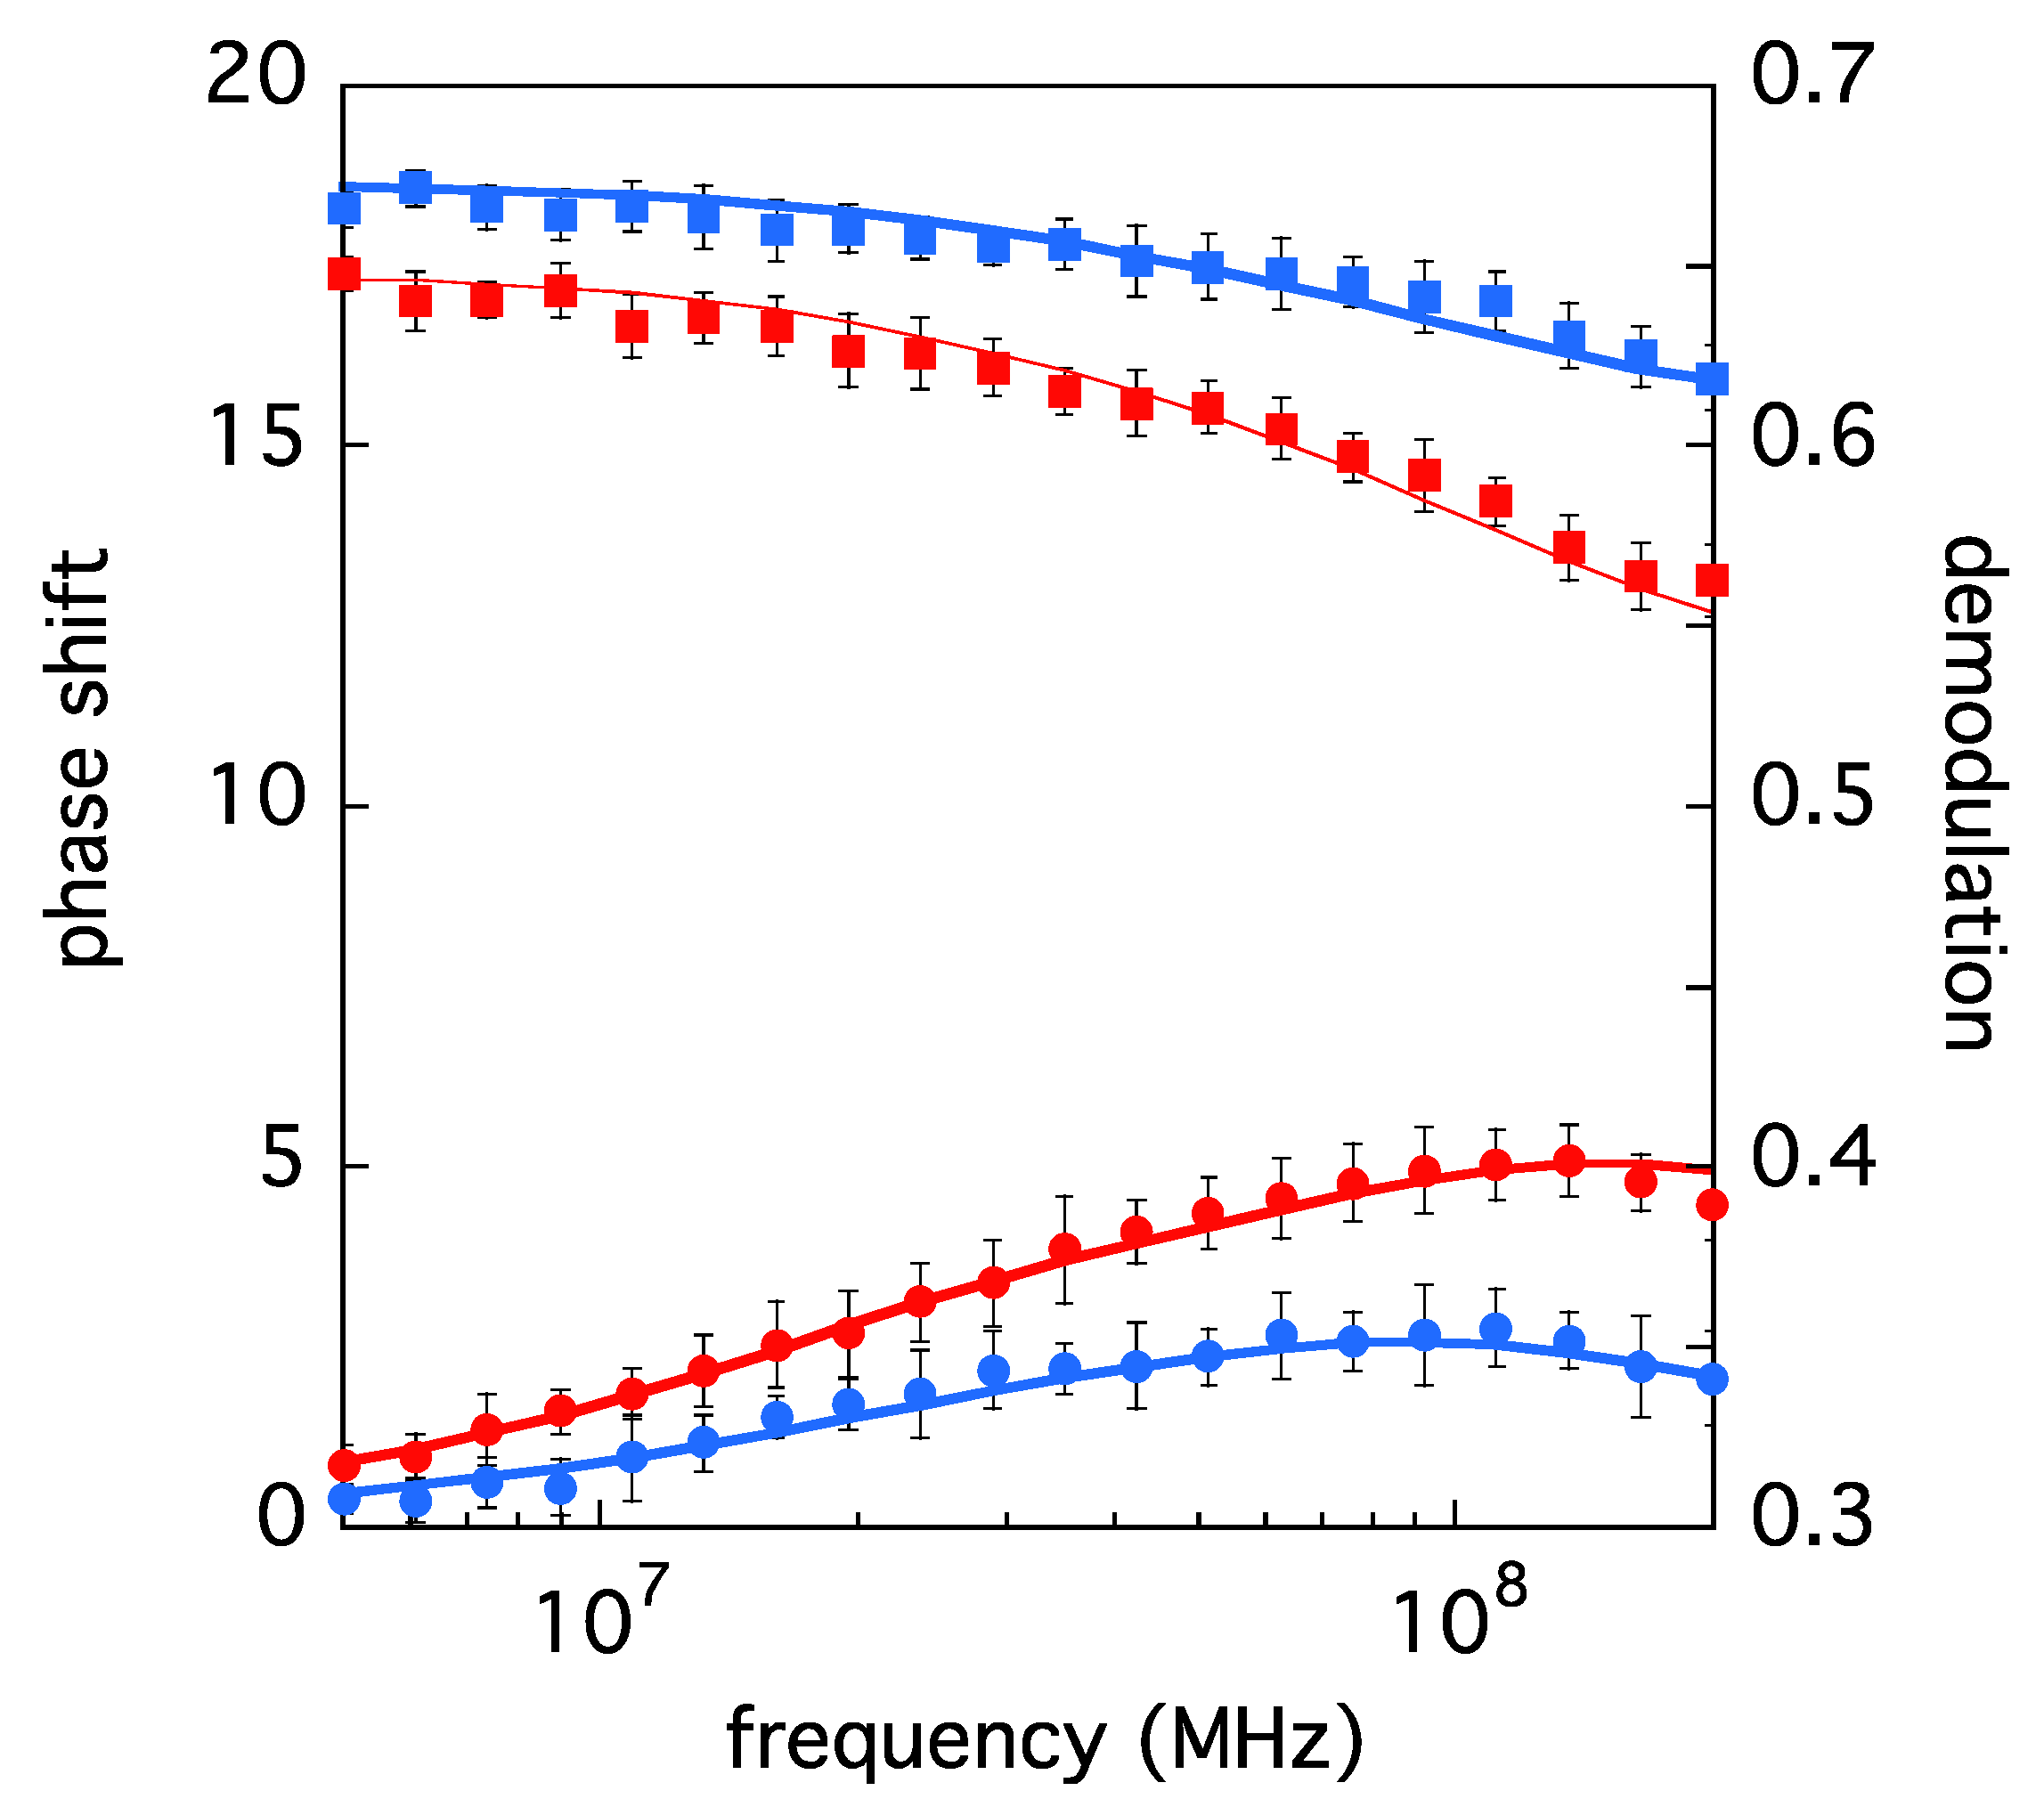
3.1. LSAO and ELAO Dynamic Fluorescence Measurements
3.2. Insights on Amine Oxidase Structural Features by In Silico Simulations and ANS Binding
3.3. Surface and Internal Cavity Search: A Combination of Experimental and Theoretical Approaches
3.4. Topological Characterization of AO Interfaces
Author Contributions
Funding
Institutional Review Board Statement
Informed Consent Statement
Conflicts of Interest
References
- Levy, E.D.; Teichmann, S. Structural, evolutionary, and assembly principles of protein oligomerization. Prog. Mol. Biol. Transl. Sci. 2013, 117, 25–51. [Google Scholar] [CrossRef] [PubMed]
- Goodsell, D.S.; Olson, A.J. Structural symmetry and protein function. Annu. Rev. Biophys. Biomol. Struct. 2000, 29, 105–153. [Google Scholar] [CrossRef] [PubMed]
- Levy, E.D.; Pereira-Leal, J.B.; Chothia, C.; Teichmann, S.A. 3D complex: A structural classification of protein complexes. PLoS Comput. Biol. 2006, 2, e155. [Google Scholar] [CrossRef]
- Lukatsky, D.B.; Shakhnovich, B.E.; Mintseris, J.; Shakhnovich, E.I. Structural similarity enhances interaction propensity of proteins. J. Mol. Biol. 2007, 365, 1596–1606. [Google Scholar] [CrossRef] [PubMed] [Green Version]
- Swapna, L.S.; Srikeerthana, K.; Srinivasan, N. Extent of structural asymmetry in homodimeric proteins: Prevalence and relevance. PLoS ONE 2012, 7, e36688. [Google Scholar] [CrossRef] [Green Version]
- Levy, E.D.; Boeri Erba, E.; Robinson, C.V.; Teichmann, S.A. Assembly reflects evolution of protein complexes. Nature 2008, 453, 1262–2655. [Google Scholar] [CrossRef] [Green Version]
- Tavladoraki, P.; Cona, A.; Angelini, R. Copper-containing amine oxidases and FAD-dependent polyamine oxidases are key players in plant tissue differentiation and organ development. Front. Plant Sci. 2016, 7, 824. [Google Scholar] [CrossRef] [PubMed] [Green Version]
- Kumar, V.; Dooley, D.M.; Freeman, H.C.; Guss, J.M.; Harvey, I.; McGuirl, M.A.; Wilce, M.C.; Zubak, V.M. Crystal structure of a eukaryotic (pea seedling) copper-containing amine oxidase at 2.2 A resolution. Structure 1996, 4, 943–955. [Google Scholar] [CrossRef] [Green Version]
- Dainese, E.; Sabatucci, A.; Pintus, F.; Medda, R.; Angelucci, C.B.; Floris, G.; Maccarrone, M. Domain mobility as probed by small-angle X-ray scattering may account for substrate access to the active site of two copper-dependent amine oxidases. Acta Crystallogr. D Biol. Crystallogr. 2014, 70 Pt 8, 2101–2110. [Google Scholar] [CrossRef]
- Di Venere, A.; Nicolai, E.; Rosato, N.; Rossi, A.; Finazzi Agrò, A.; Mei, G. Characterization of monomeric substates of ascorbate oxidase. FEBS J. 2011, 278, 1585–1593. [Google Scholar] [CrossRef]
- Humphrey, W.; Dalke, A.; Schulten, K. VMD: Visual molecular dynamics. J. Mol. Graph. 1996, 14, 33–38. [Google Scholar] [CrossRef]
- La, D.; Esquivel-Rodríguez, J.; Venkatraman, V.; Li, B.; Sael, L.; Ueng, S.; Ahrendt, S.; Kihara, D. 3D-SURFER: Software for high-throughput protein surface comparison and analysis. Bioinformatics 2009, 25, 2843–2844. [Google Scholar] [CrossRef] [Green Version]
- Yu, J.; Zhou, Y.; Tanaka, I.; Yao, M. Roll: A new algorithm for the detection of protein pockets and cavities with a rolling probe sphere. Bioinformatics 2010, 26, 46–52. [Google Scholar] [CrossRef] [Green Version]
- Abraham, M.J.; Murtola, T.; Schulz, R.; Pàll, S.; Smith, J.C.; Hess, B.; Lindahl, E. GROMACS: High performance molecular simulations through multi-level parallelism from laptops to supercomputers. SoftwareX 2015, 1–2, 19–25. [Google Scholar] [CrossRef] [Green Version]
- MacKerell, A.D., Jr.; Feig, M.; Brooks, C.L., III. Extending the treatment of backbone energetics in protein force fields: Limitations of gas-phase quantum mechanics in reproducing protein conformational distributions in molecular dynamics simulations. J. Comput. Chem. 2004, 25, 1400–1415. [Google Scholar] [CrossRef]
- Bussi, G.; Donadio, D.; Parrinello, M. Canonical sampling through velocity rescaling. J. Chem. Phys. 2007, 126, 014101. [Google Scholar] [CrossRef] [Green Version]
- Berendsen, H.J.C.; Postma, J.P.M.; van Gunsteren, W.F.; Di Nola, A.; Haak, J.R. Molecular dynamics with coupling to an external bath. J Chem Phys. 1984, 81, 3684–3690. [Google Scholar] [CrossRef] [Green Version]
- Hess, B.; Bekker, H.; Berendsen, H.J.C.; Fraaije, J.G.E.M. Lincs: A linear constraint solver for molecular simulations. J. Comput. Chem. 1997, 18, 1463–1472. [Google Scholar] [CrossRef]
- Darden, T.; York, D.; Pedersen, L. Particle mesh ewald: An N log (N) method for ewald sums in large systems. J. Chem. Phys. 1993, 98, 10089–10092. [Google Scholar] [CrossRef] [Green Version]
- Minicozzi, V.; Di Venere, A.; Nicolai, E.; Giuliani, A.; Caccuri, A.M.; Di Paola, L.; Mei, G. Non-Symmetrical Structural Behavior of a Symmetric Protein: The Case of Homo-Trimeric TRAF2 (Tumor Necrosis Factor-Receptor Associated Factor 2). J. Biomol. Struct. Dyn. 2021, 39, 319–329. [Google Scholar] [CrossRef]
- Di Paola, L.; De Ruvo, M.; Paci, P.; Santoni, D.; Giuliani, A. Protein contact networks: An emerging paradigm in chemistry. Chem. Rev. 2013, 113, 1598–1613. [Google Scholar] [CrossRef] [PubMed]
- Di Paola, L.; Mei, G.; Di Venere, A.; Giuliani, A. Disclosing allostery through protein contact networks. In Allostery; Humana: New York, NY, USA, 2021; pp. 7–20. [Google Scholar]
- Tasdighian, S.; Di Paola, L.; De Ruvo, M.; Paci, P.; Santoni, D.; Palumbo, P.; Mei, G.; Di Venere, A.; Giuliani, A. Modules identification in protein structures: The topological and geometrical solutions. Inf. Model. 2014, 54, 159–168. [Google Scholar] [CrossRef] [PubMed]
- Shi, J.; Malik, J. Motion segmentation and tracking using normalized cuts. In Proceedings of the Sixth International Conference on Computer Vision (IEEE Cat. No. 98CH36271), Bombay, India, 7 January 1998; Volume 1154. [Google Scholar]
- Di Paola, L.; Giuliani, A. Protein contact network topology: A natural language for allostery. Curr. Opin. Struct. Biol. 2015, 31, 43–48. [Google Scholar] [CrossRef] [PubMed]
- Lakowicz, J.R. Time-dependent anisotropy decays. In Principles of Fluorescence Spectroscopy; Kluwer Academic/Plenum Publishers: New York, NY, USA, 1999; pp. 321–346. [Google Scholar]
- Nicolai, E.; Di Venere, A.; Rosato, N.; Rossi, A.; Finazzi Agro, A.; Mei, G. Physico-chemical properties of molten dimer ascorbate oxidase. FEBS J. 2006, 273, 5194–5204. [Google Scholar] [CrossRef] [PubMed]
- Mei, G.; Di Venere, A.; Nicolai, E.; Angelucci, C.B.; Ivanov, I.; Sabatucci, A.; Dainese, E.; Kuhn, H.; Maccarrone, M. Structural properties of plant and mammalian lipoxygenases. Temperature-dependent conformational alterations and membrane binding ability. Biochemistry 2008, 47, 9234–9242. [Google Scholar] [CrossRef]
- Ceccarelli, A.; Di Venere, A.; Nicolai, E.; De Luca, A.; Minicozzi, V.; Rosato, N.; Caccuri, A.M.; Mei, G. TNFR-Associated Factor-2 (TRAF2): Not Only a Trimer. Biochemistry 2015, 54, 6153–6161. [Google Scholar] [CrossRef]
- Di Venere, A.; Nicolai, E.; Ivanov, I.; Dainese, E.; Adel, S.; Angelucci, B.C.; Kuhn, H.; Maccarrone, M.; Mei, G. Probing conformational changes in lipoxygenases upon membrane binding: Fine-tuning by the active site inhibitor ETYA. Biochim. Biophys. Acta 2014, 1841, 1–10. [Google Scholar] [CrossRef]
- Cantor, C.R.; Schimmel, P.R. Biophysical Chemistry. Part II; Freeman and Company: San Francisco, CA, USA, 1980; pp. 454–465. [Google Scholar]
- Creighton, T.E. Physical and chemical properties of soluble proteins. In Proteins; Freeman and Company: New York, NY, USA, 1993; pp. 268–269. [Google Scholar]
- Howard, J. Mass, Stiffness, and Damping of Proteins. In Mechanics of Motor Proteins and the Cytoskeleton; Sinauer Associates Inc. Publishers: Sunderland, MA, USA, 2001; pp. 30–37. [Google Scholar]
- Howard, J. Mechanics of the Cytoskeleton. In Mechanics of Motor Proteins and the Cytoskeleton; Sinauer Associates Inc. Publishers: Sunderland, MA, USA, 2001; pp. 147–148. [Google Scholar]
- Roche, J.; Caro, J.A.; Norberto, D.R.; Barthe, P.; Roumestand, C.; Schlessman, J.L.; Garcia, A.E.; García-Moreno, B.; Royer, C.A. Cavities determine the pressure unfolding of proteins. Proc. Natl. Acad. Sci. USA 2012, 109, 6945–6950. [Google Scholar] [CrossRef] [Green Version]
- Weber, G.; Drickamer, H.G. The effect of high pressure upon proteins and other biomolecules. Q. Rev. Biophys. 1983, 16, 89–112. [Google Scholar] [CrossRef]
- Mei, G.; Di Venere, A.; Gasperi, V.; Nicolai, E.; Masuda, K.R.; Finazzi-Agrò, A.; Cravatt, B.F.; Maccarrone, M. Closing the gate to the active site: Effect of the inhibitor methoxyarachidonyl fluorophosphonate on the conformation and membrane binding of fatty acid amide hydrolase. J. Biol. Chem. 2007, 282, 3829–3836. [Google Scholar] [CrossRef] [Green Version]
- Royer, C.A. Revisiting volume changes in pressure-induced protein unfolding. Biochim. Biophys. Acta 2002, 1595, 201–209. [Google Scholar] [CrossRef]
- Wilce, M.C.; Dooley, D.M.; Freeman, H.C.; Guss, J.M.; Matsunami, H.; McIntire, W.S.; Ruggiero, C.E.; Tanizawa, K.; Yamaguchi, H. Crystal structures of the copper-containing amine oxidase from Arthrobacter globiformis in the holo and apo forms: Implications for the biogenesis of topaquinone. Biochemistry 1997, 36, 16116–16133. [Google Scholar] [CrossRef] [PubMed]
- Takahashi, K.; Klinman, J.P. Relationship of stopped flow to steady state parameters in the dimeric copper amine oxidase from Hansenula polymorpha and the role of zinc in inhibiting activity at alternate copper-containing subunits. Biochemistry 2006, 45, 4683–4694. [Google Scholar] [CrossRef]
- Klema, V.J.; Wilmot, C.M. The role of protein crystallography in defining the mechanisms of biogenesis and catalysis in copper amine oxidase. Int. J. Mol. Sci. 2012, 13, 5375–5405. [Google Scholar] [CrossRef] [Green Version]
- Moosavi-Nejad, S.Z.; Moosavi-Movahedi, A.A.; Rezaei-Tavirani, M.; Floris, G.; Medda, R. Conformational lock and dissociative thermal inactivation of lentil seedling amine oxidase. J. Biochem. Mol. Biol. 2003, 36, 167–172. [Google Scholar] [CrossRef] [PubMed]
- Gaule, T.G.; Smith, M.A.; Pearson, A.R.; Knowles, P.F.; McPherson, M.J. Probing the molecular mechanisms in copper amine oxidases by generating heterodimers. Chembiochemistry 2015, 16, 559–564. [Google Scholar] [CrossRef] [PubMed] [Green Version]
- Kim, T.H.; Mehrabi, P.; Ren, Z.; Sljoka, A.; Ing, C.; Bezginov, A.; Ye, L.; Pomès, R.; Prosser, R.S.; Pai, E.F. The role of dimer asymmetry and protomer dynamics in enzyme catalysis. Science 2017, 355, eaag2355. [Google Scholar] [CrossRef]
- Mehrabi, P.; Di Pietrantonio, C.; Kim, T.H.; Sljoka, A.; Taverner, K.; Ing, C.; Kruglyak, N.; Pomès, R.; Pai, E.F.; Prosser, R.S. Substrate-Based Allosteric Regulation of a Homodimeric Enzyme. J. Am. Chem. Soc. 2019, 141, 11540–11556. [Google Scholar] [CrossRef]
- Bonjack, M.; Avnir, D. The near-symmetry of protein oligomers: NMR-derived structures. Sci. Rep. 2020, 10, 8367. [Google Scholar] [CrossRef]


| Sample | χ2 | θ1 (ns) | θ2 (ns) | F01 | F02 |
|---|---|---|---|---|---|
| ELAO | 1.03 | 3.7 ± 0.2 | 61 ± 3 | 0.17 ± 0.01 | 0.11 ± 0.01 |
| LSAO | 1.00 | 2.7 ± 0.2 | 60 ± 3 | 0.23 ± 0.03 | 0.05 ± 0.02 |
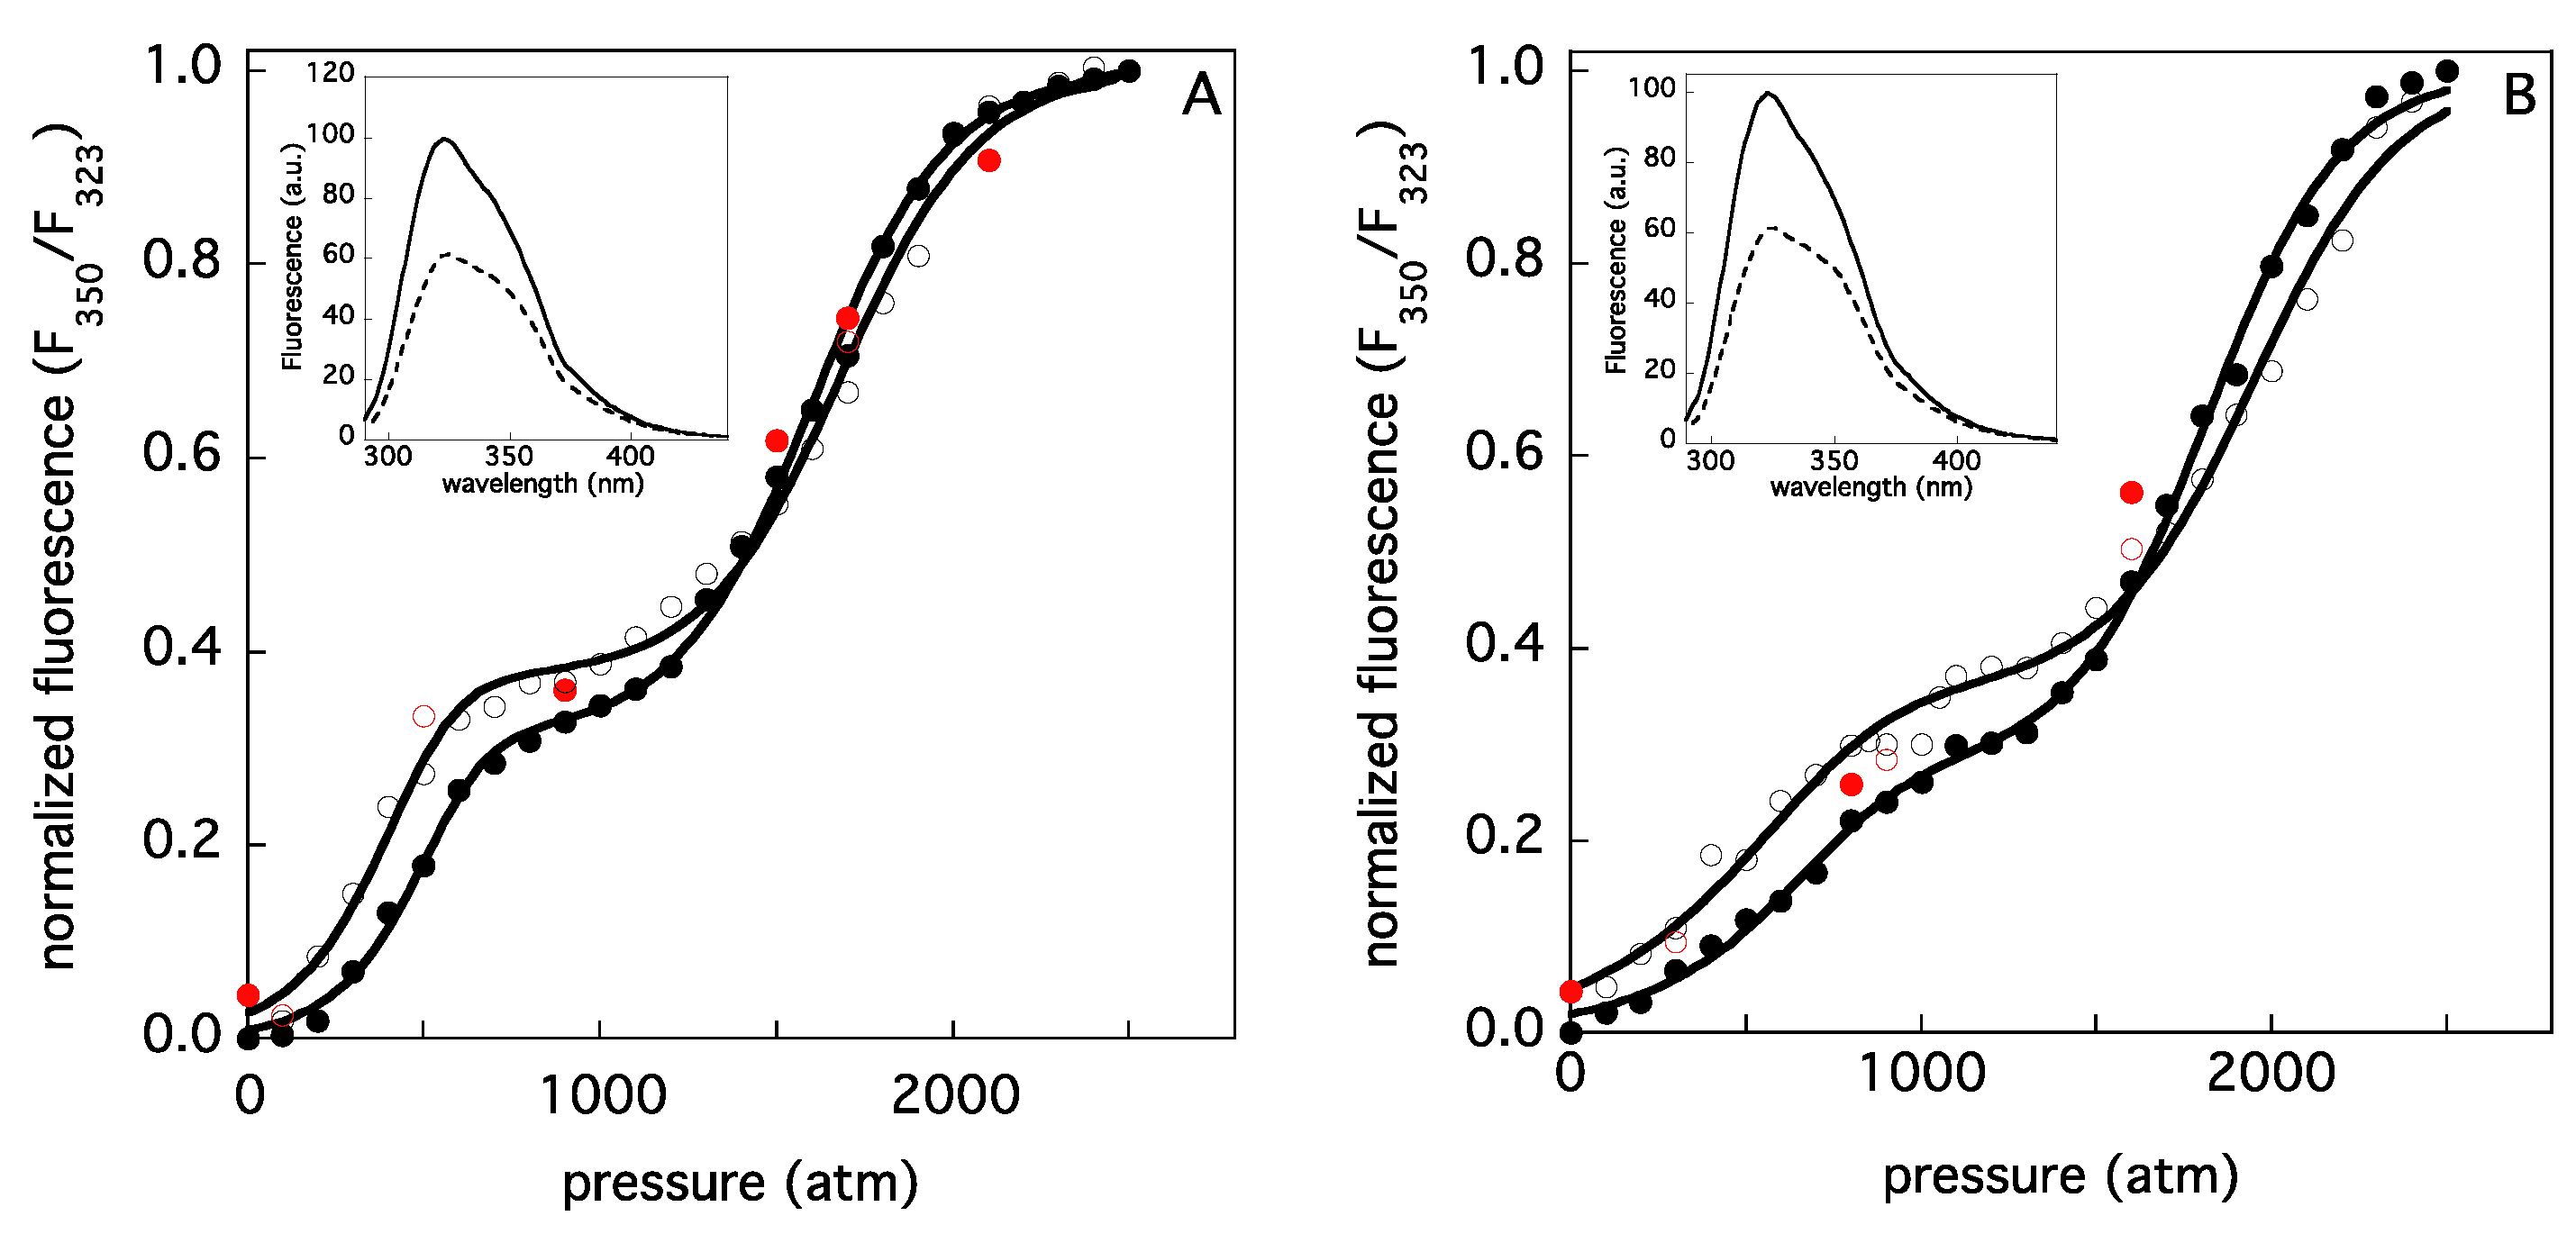
| Sample Concentration (μM) | χ2 | ΔG1 (kcal M−1) | ΔG2 (kcal M−1) | m1 (cal/mol atm) | m2 (cal/mol atm) | ΔV1 (mL/mol) | ΔV2 (mL/mol) | Yi |
|---|---|---|---|---|---|---|---|---|
| [ELAO] = 0.7 | 0.998 | 11.2 ± 0.2 | 5.1 ± 0.1 | 7.2 ± 0.1 | 3.0 ± 0.1 | ≈−297 | ≈−123 | 0.38 ± 0.01 |
| [ELAO] = 6.6 | 0.999 | 11.0 ± 0.2 | 4.9 ± 0.1 | 7.7 ± 0.3 | 3.1 ± 0.1 | ≈−318 | ≈−128 | 0.31 ± 0.01 |
| [LSAO] = 0.8 | 0.997 | 10.4 ± 0.2 | 5.5 ± 0.3 | 3.8 ± 0.2 | 2.8 ± 0.2 | ≈−157 | ≈−116 | 0.36 ± 0.02 |
| [LSAO] = 7.0 | 0.999 | 9.9 ± 0.2 | 5.5 ± 0.2 | 4.4 ± 0.2 | 3.0 ± 0.1 | ≈−182 | ≈−124 | 0.28 ± 0.02 |
Publisher’s Note: MDPI stays neutral with regard to jurisdictional claims in published maps and institutional affiliations. |
© 2022 by the authors. Licensee MDPI, Basel, Switzerland. This article is an open access article distributed under the terms and conditions of the Creative Commons Attribution (CC BY) license (https://creativecommons.org/licenses/by/4.0/).
Share and Cite
Nicolai, E.; Minicozzi, V.; Di Paola, L.; Medda, R.; Pintus, F.; Mei, G.; Di Venere, A. Symmetric versus Asymmetric Features of Homologous Homodimeric Amine Oxidases: When Water and Cavities Make the Difference. Symmetry 2022, 14, 522. https://doi.org/10.3390/sym14030522
Nicolai E, Minicozzi V, Di Paola L, Medda R, Pintus F, Mei G, Di Venere A. Symmetric versus Asymmetric Features of Homologous Homodimeric Amine Oxidases: When Water and Cavities Make the Difference. Symmetry. 2022; 14(3):522. https://doi.org/10.3390/sym14030522
Chicago/Turabian StyleNicolai, Eleonora, Velia Minicozzi, Luisa Di Paola, Rosaria Medda, Francesca Pintus, Giampiero Mei, and Almerinda Di Venere. 2022. "Symmetric versus Asymmetric Features of Homologous Homodimeric Amine Oxidases: When Water and Cavities Make the Difference" Symmetry 14, no. 3: 522. https://doi.org/10.3390/sym14030522