
Hybrid Reptile Search Algorithm and Remora Optimization Algorithm for Optimization Tasks and Data Clustering


Abstract
:1. Introduction
- A novel hybrid optimization method is proposed using the original Reptile Search Algorithm (RSA) and Remora Optimization Algorithm (ROA).
- A new transition method is proposed to handle the mechanisms’ search processes and help the proposed method in enabling the suitable search operator during the optimization process.
- The performance of the proposed HRSA method is tested on several benchmark functions to show the mai.
- A real-world problem, data clustering, is used to prove further the proposed HRSA’s ability to deal with complicated problems, finding symmetric and asymmetric objects.
- The results showed the superiority of the proposed method in solving the given problems compared to other various state-of-the-art methods.
2. Background
2.1. Reptile Search Algorithm (RSA)
2.1.1. Encircling Phase (Exploration)
2.1.2. Hunting Phase (Exploitation)
2.2. Remora Optimization Algorithm (ROA)
2.2.1. Free Travel (Exploration)
SFO Strategy
Experience Attack
2.2.2. Eat Thoughtfully (Exploitation)
WOA Strategy
Host Feeding
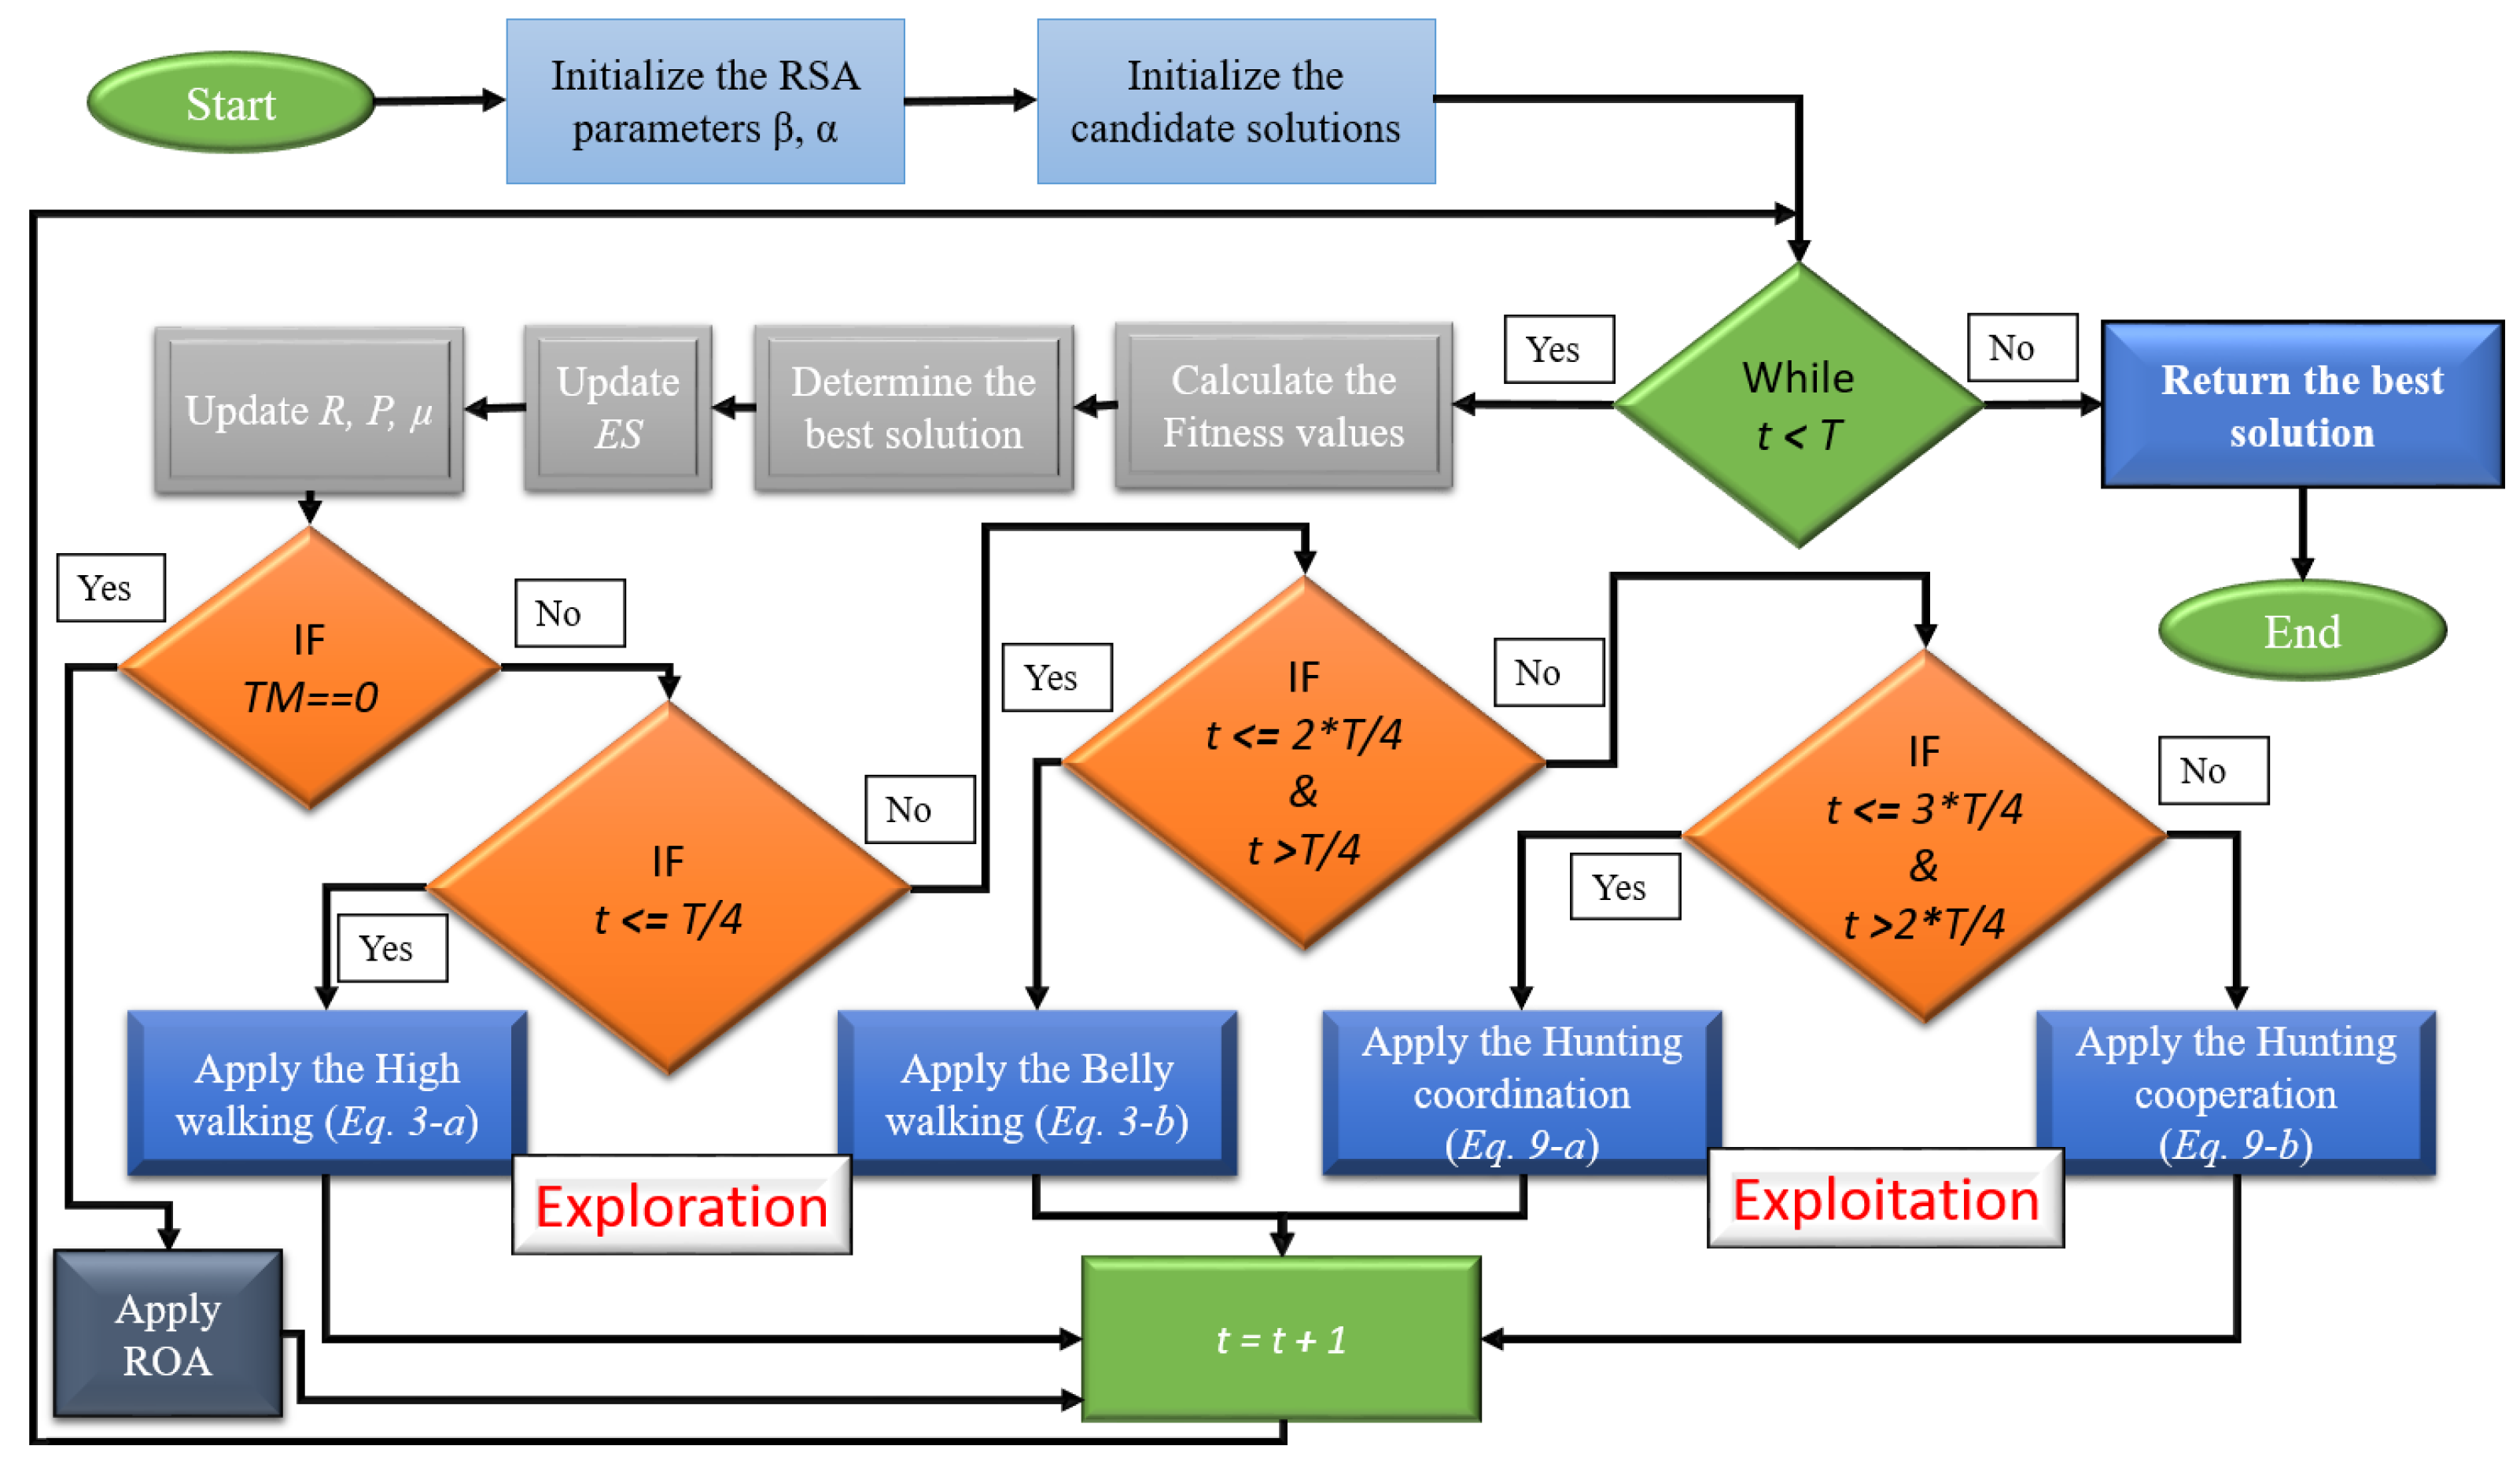
2.3. The Proposed HRSA Method
2.3.1. Initialization Phase
2.3.2. The Proposed Mean Transition Mechanism (MTM)
| Algorithm 1 The proposed Mean Transition Mechanism (MTM). |
|
2.3.3. The Detailed Process of the HRSA
3. Results and Discussion
3.1. Experimental Settings
3.2. Benchmark Function: Experiments
3.3. Data Clustering: Experiments
4. Conclusions
Author Contributions
Funding
Institutional Review Board Statement
Informed Consent Statement
Data Availability Statement
Acknowledgments
Conflicts of Interest
References
- Fiorini, L.; Cavallo, F.; Dario, P.; Eavis, A.; Caleb-Solly, P. Unsupervised machine learning for developing personalised behaviour models using activity data. Sensors 2017, 17, 1034. [Google Scholar] [CrossRef] [PubMed] [Green Version]
- Alswaitti, M.; Albughdadi, M.; Isa, N.A.M. Density-based particle swarm optimization algorithm for data clustering. Expert Syst. Appl. 2018, 91, 170–186. [Google Scholar] [CrossRef]
- Gao, K.; Khan, H.A.; Qu, W. Clustering with Missing Features: A Density-Based Approach. Symmetry 2022, 14, 60. [Google Scholar] [CrossRef]
- Jain, A.K.; Murty, M.N.; Flynn, P.J. Data clustering: A review. ACM Comput. Surv. (CSUR) 1999, 31, 264–323. [Google Scholar] [CrossRef]
- Kushwaha, N.; Pant, M.; Kant, S.; Jain, V.K. Magnetic optimization algorithm for data clustering. Pattern Recognit. Lett. 2018, 115, 59–65. [Google Scholar] [CrossRef]
- Kant, S.; Ansari, I.A. An improved K means clustering with Atkinson index to classify liver patient dataset. Int. J. Syst. Assur. Eng. Manag. 2016, 7, 222–228. [Google Scholar] [CrossRef]
- Rout, R.; Parida, P.; Alotaibi, Y.; Alghamdi, S.; Khalaf, O.I. Skin lesion extraction using multiscale morphological local variance reconstruction based watershed transform and fast fuzzy C-means clustering. Symmetry 2021, 13, 2085. [Google Scholar] [CrossRef]
- Chander, S.; Vijaya, P.; Dhyani, P. Multi kernel and dynamic fractional lion optimization algorithm for data clustering. Alex. Eng. J. 2018, 57, 267–276. [Google Scholar] [CrossRef]
- George, G.; Parthiban, L. Multi objective hybridized firefly algorithm with group search optimization for data clustering. In Proceedings of the 2015 IEEE International Conference on Research in Computational Intelligence and Communication Networks (ICRCICN), Kolkata, India, 20–22 November 2015; pp. 125–130. [Google Scholar]
- Kumar, Y.; Kaur, A. Variants of bat algorithm for solving partitional clustering problems. Eng. Comput. 2021, 1–27. Available online: https://www.springerprofessional.de/en/variants-of-bat-algorithm-for-solving-partitional-clustering-pro/18956468 (accessed on 20 January 2022).
- Mittal, H.; Pandey, A.C.; Saraswat, M.; Kumar, S.; Pal, R.; Modwel, G. A comprehensive survey of image segmentation: Clustering methods, performance parameters, and benchmark datasets. Multimed. Tools Appl. 2021, 1–26. Available online: https://link.springer.com/article/10.1007/s11042-021-10594-9 (accessed on 20 January 2022).
- Yin, X.; Chen, S.; Hu, E.; Zhang, D. Semi-supervised clustering with metric learning: An adaptive kernel method. Pattern Recognit. 2010, 43, 1320–1333. [Google Scholar] [CrossRef] [Green Version]
- Koryshev, N.; Hodashinsky, I.; Shelupanov, A. Building a fuzzy classifier based on whale optimization algorithm to detect network intrusions. Symmetry 2021, 13, 1211. [Google Scholar] [CrossRef]
- Hussein, A.M.; Abdullah, R.; AbdulRashid, N. Flower Pollination Algorithm With Profile Technique For Multiple Sequence Alignment. In Proceedings of the 2019 IEEE Jordan International Joint Conference on Electrical Engineering and Information Technology (JEEIT), Amman, Jordan, 9–11 April 2019; pp. 571–576. [Google Scholar]
- Hussein, A.M.; Abdullah, R.; AbdulRashid, N.; Ali, A.N.B. Protein multiple sequence alignment by basic flower pollination algorithm. In Proceedings of the 2017 8th International Conference on Information Technology (ICIT), Amman, Jordan, 17–18 May 2017; pp. 833–838. [Google Scholar]
- Das, P.; Das, D.K.; Dey, S. A new class topper optimization algorithm with an application to data clustering. IEEE Trans. Emerg. Top. Comput. 2018, 8, 948–959. [Google Scholar] [CrossRef]
- Alam, S.; Dobbie, G.; Riddle, P. An evolutionary particle swarm optimization algorithm for data clustering. In Proceedings of the 2008 IEEE Swarm Intelligence Symposium, St. Louis, MO, USA, 21–23 September 2008; pp. 1–6. [Google Scholar]
- Agbaje, M.B.; Ezugwu, A.E.; Els, R. Automatic data clustering using hybrid firefly particle swarm optimization algorithm. IEEE Access 2019, 7, 184963–184984. [Google Scholar] [CrossRef]
- Rahnema, N.; Gharehchopogh, F.S. An improved artificial bee colony algorithm based on whale optimization algorithm for data clustering. Multimed. Tools Appl. 2020, 79, 32169–32194. [Google Scholar] [CrossRef]
- Bijari, K.; Zare, H.; Veisi, H.; Bobarshad, H. Memory-enriched big bang–big crunch optimization algorithm for data clustering. Neural Comput. Appl. 2018, 29, 111–121. [Google Scholar] [CrossRef] [Green Version]
- Kao, Y.T.; Zahara, E.; Kao, I.W. A hybridized approach to data clustering. Expert Syst. Appl. 2008, 34, 1754–1762. [Google Scholar] [CrossRef]
- Mahmoudi, M.R.; Akbarzadeh, H.; Parvin, H.; Nejatian, S.; Rezaie, V.; Alinejad-Rokny, H. Consensus function based on cluster-wise two level clustering. Artif. Intell. Rev. 2021, 54, 639–665. [Google Scholar] [CrossRef]
- Mahapatra, S.; Dey, B.; Raj, S. A novel ameliorated Harris hawk optimizer for solving complex engineering optimization problems. Int. J. Intell. Syst. 2021, 36, 7641–7681. [Google Scholar] [CrossRef]
- Raj, S.; Bhattacharyya, B. Optimal placement of TCSC and SVC for reactive power planning using Whale optimization algorithm. Swarm Evol. Comput. 2018, 40, 131–143. [Google Scholar] [CrossRef]
- Shaikh, M.S.; Hua, C.; Raj, S.; Kumar, S.; Hassan, M.; Ansari, M.M.; Jatoi, M.A. Optimal parameter estimation of 1-phase and 3-phase transmission line for various bundle conductor’s using modified whale optimization algorithm. Int. J. Electr. Power Energy Syst. 2022, 138, 107893. [Google Scholar] [CrossRef]
- Shekarappa, G.S.; Mahapatra, S.; Raj, S. Voltage constrained reactive power planning problem for reactive loading variation using hybrid harris hawk particle swarm optimizer. Electr. Power Components Syst. 2021, 49, 421–435. [Google Scholar] [CrossRef]
- Abualigah, L.; Abd Elaziz, M.; Sumari, P.; Geem, Z.W.; Gandomi, A.H. Reptile Search Algorithm (RSA): A nature-inspired meta-heuristic optimizer. Expert Syst. Appl. 2022, 191, 116158. [Google Scholar] [CrossRef]
- Jia, H.; Peng, X.; Lang, C. Remora optimization algorithm. Expert Syst. Appl. 2021, 185, 115665. [Google Scholar] [CrossRef]
- Shinawi, A.E.; Ibrahim, R.A.; Abualigah, L.; Zelenakova, M.; Elaziz, M.A. Enhanced Adaptive Neuro-Fuzzy Inference System Using Reptile Search Algorithm for Relating Swelling Potentiality Using Index Geotechnical Properties: A Case Study at El Sherouk City, Egypt. Mathematics 2021, 9, 3295. [Google Scholar] [CrossRef]
- Agushaka, J.O.; Ezugwu, A.E.; Abualigah, L. Dwarf Mongoose Optimization Algorithm. Comput. Methods Appl. Mech. Eng. 2022, 391, 114570. [Google Scholar] [CrossRef]
- Oyelade, O.N.; Ezugwu, A.E.; Mohamed, T.I.; Abualigah, L. Ebola Optimization Search Algorithm: A new nature-inspired metaheuristic algorithm. IEEE Access 2022. [Google Scholar] [CrossRef]
- Abualigah, L.; Yousri, D.; Abd Elaziz, M.; Ewees, A.A.; Al-qaness, M.A.; Gandomi, A.H. Aquila Optimizer: A novel meta-heuristic optimization Algorithm. Comput. Ind. Eng. 2021, 157, 107250. [Google Scholar] [CrossRef]
- Kennedy, J.; Eberhart, R. Particle swarm optimization. In Proceedings of the ICNN’95-International Conference on Neural Networks, Perth, WA, Australia, 27 November–1 December 1995; Volume 4, pp. 1942–1948. [Google Scholar]
- Mirjalili, S.; Mirjalili, S.M.; Lewis, A. Grey wolf optimizer. Adv. Eng. Softw. 2014, 69, 46–61. [Google Scholar] [CrossRef] [Green Version]
- Abdollahzadeh, B.; Gharehchopogh, F.S.; Mirjalili, S. African vultures optimization algorithm: A new nature-inspired metaheuristic algorithm for global optimization problems. Comput. Ind. Eng. 2021, 158, 107408. [Google Scholar] [CrossRef]
- Mirjalili, S.; Lewis, A. The whale optimization algorithm. Adv. Eng. Softw. 2016, 95, 51–67. [Google Scholar] [CrossRef]
- Abualigah, L.; Diabat, A.; Mirjalili, S.; Abd Elaziz, M.; Gandomi, A.H. The arithmetic optimization algorithm. Comput. Methods Appl. Mech. Eng. 2021, 376, 113609. [Google Scholar] [CrossRef]
- Gupta, S.; Abderazek, H.; Yıldız, B.S.; Yildiz, A.R.; Mirjalili, S.; Sait, S.M. Comparison of metaheuristic optimization algorithms for solving constrained mechanical design optimization problems. Expert Syst. Appl. 2021, 183, 115351. [Google Scholar] [CrossRef]
- Wang, X.; Mao, X.; Khodaei, H. A multi-objective home energy management system based on internet of things and optimization algorithms. J. Build. Eng. 2021, 33, 101603. [Google Scholar] [CrossRef]
- Abunama, T.; Ansari, M.; Awolusi, O.O.; Gani, K.M.; Kumari, S.; Bux, F. Fuzzy inference optimization algorithms for enhancing the modelling accuracy of wastewater quality parameters. J. Environ. Manag. 2021, 293, 112862. [Google Scholar] [CrossRef] [PubMed]


| No. | Algorithm | Parameter | Value |
|---|---|---|---|
| 1 | AO | 0.1 | |
| 0.1 | |||
| 2 | DMOA | - | - |
| 3 | WOA | Decreased from 2 to 0 | |
| 4 | SCA | 0.05 | |
| 5 | DA | w | 0.2–0.9 |
| s, a, and c | 0.1 | ||
| f and e | 1 | ||
| 6 | GWO | Convergence parameter (a) | Linear reduction from 2 to 0 |
| 7 | PSO | Topology | Fully connected |
| Cognitive and social constant | (C1, C2) 2, 2 | ||
| Inertia weight | Linear reduction from 0.9 to 0.1 | ||
| Velocity limit | 10% of dimension range | ||
| 8 | ALO | I ratio | |
| w | 2–6 | ||
| 9 | RSA | 0.1 | |
| 0.1 | |||
| 10 | ROA | ||
| 11 | AOA | 5 | |
| 0.5 |
| Function | Description | Dimensions | Range | |
|---|---|---|---|---|
| F1 | 30 | [−100, 100 ] | 0 | |
| F2 | 30 | [−10, 10] | 0 | |
| F3 | 30 | [−100, 100] | 0 | |
| F4 | 30 | [−100, 100] | 0 | |
| F5 | 30 | [−30, 30] | 0 | |
| F6 | 30 | [−100, 100] | 0 | |
| F7 | 30 | [−128, 128] | 0 | |
| F8 | 30 | [−500, 500] | −418.9829 × n | |
| F9 | 30 | [−5.12, 5.12] | 0 | |
| F10 | 10, 50, 100, 500 | [−32, 32] | 0 | |
| F11 | 10, 50, 100, 500 | [−600, 600] | 0 | |
| F12 | , where | 10, 50, 100, 500 | [−50, 50] | 0 |
| F13 | 10, 50, 100, 500 | [−50, 50] | 0 | |
| F14 | 2 | [−65, 65] | 1 | |
| F15 | 4 | [−5, 5] | 0.00030 | |
| F16 | 2 | [−5, 5] | −1.0316 | |
| F17 | f(x)= | 2 | [−5, 5] | 0.398 |
| F18 | 2 | [−2, 2] | 3 | |
| F19 | 3 | [−1, 2] | −3.86 | |
| F20 | 6 | [0, 1] | −0.32 | |
| F21 | 4 | [0, 1] | −10.1532 | |
| F22 | 4 | [0, 1] | −10.4028 | |
| F23 | 4 | [0, 1] | −10.5363 |
| Function | Measure | 5 | 10 | 15 | 20 | 25 | 30 | 35 | 40 | 45 | 50 |
|---|---|---|---|---|---|---|---|---|---|---|---|
| F1 | Worst | 2.4747 | 6.4678E-136 | 2.8320E-177 | 2.2056E-208 | 5.9945E-205 | 5.8746E-229 | 6.0049E-227 | 1.3563E-230 | 3.3278E-254 | 1.3704E-266 |
| Average | 6.1871E-105 | 1.6169E-136 | 7.0802E-178 | 5.5316E-209 | 1.4989E-205 | 1.4686E-229 | 1.5012E-227 | 3.3908E-231 | 8.3559E-255 | 6.0726E-267 | |
| Best | 1.7132E-122 | 2.3073E-181 | 1.0868E-188 | 2.5028E-230 | 3.0316E-229 | 1.1620E-250 | 1.0445E-254 | 2.0923E-260 | 4.1230E-268 | 1.7295E-268 | |
| STD | 1.2373E-104 | 3.2339E-136 | 0.0000E+00 | 0.0000E+00 | 0.0000E+00 | 0.0000E+00 | 0.0000E+00 | 0.0000E+00 | 0.0000E+00 | 0.0000E+00 | |
| p-value | 3.5589E-01 | 3.5592E-01 | 0.0000E+00 | 0.0000E+00 | 0.0000E+00 | 0.0000E+00 | 0.0000E+00 | 0.0000E+00 | 0.0000E+00 | NaN | |
| h | 0 | 0 | 1 | 1 | 1 | 1 | 1 | 1 | 1 | NaN | |
| Rank | 10 | 9 | 8 | 6 | 7 | 4 | 5 | 3 | 2 | 1 | |
| F2 | Worst | 6.3944E-47 | 5.2868E-67 | 4.0457E-80 | 1.1923E-88 | 1.7276E-100 | 6.8430E-110 | 1.2810E-100 | 1.8795E-124 | 2.0288E-123 | 1.4249E-128 |
| Average | 1.5986E-47 | 1.3217E-67 | 1.0114E-80 | 2.9806E-89 | 4.3190E-101 | 1.7115E-110 | 3.2025E-101 | 4.7064E-125 | 5.2010E-124 | 3.5621E-129 | |
| Best | 3.3103E-60 | 4.1024E-89 | 2.7546E-94 | 1.0822E-103 | 7.0032E-118 | 2.6356E-120 | 3.0698E-128 | 2.1073E-131 | 3.8662E-147 | 8.3559E-146 | |
| STD | 3.1972E-47 | 2.6434E-67 | 2.0229E-80 | 5.9613E-89 | 8.6380E-101 | 3.4210E-110 | 6.4050E-101 | 9.3922E-125 | 1.0061E-123 | 7.1243E-129 | |
| p-value | 3.5592E-01 | 3.5592E-01 | 3.5592E-01 | 3.5592E-01 | 3.5592E-01 | 3.5567E-01 | 3.5592E-01 | 3.5497E-01 | 3.4104E-01 | NaN | |
| h | 0 | 0 | 0 | 0 | 0 | 0 | 0 | 0 | 0 | NaN | |
| Rank | 10 | 9 | 8 | 7 | 6 | 4 | 5 | 2 | 3 | 1 | |
| F3 | Worst | 1.1542E-95 | 2.8253E-120 | 9.8997E-157 | 1.8030E-178 | 2.3521E-187 | 1.3326E-211 | 7.9637E-213 | 2.8098E-222 | 2.8110E-233 | 1.6957E-242 |
| Average | 2.8854E-96 | 7.0633E-121 | 2.4749E-157 | 4.5380E-179 | 5.8803E-188 | 3.3315E-212 | 1.9910E-213 | 7.4675E-223 | 7.0275E-234 | 4.2392E-243 | |
| Best | 3.0414E-114 | 7.5406E-152 | 1.8961E-182 | 2.1924E-204 | 3.3927E-233 | 1.0810E-246 | 1.7336E-244 | 1.0691E-248 | 4.9841E-270 | 1.5279E-254 | |
| STD | 5.7708E-96 | 1.4127E-120 | 4.9498E-157 | 0.0000E+00 | 0.0000E+00 | 0.0000E+00 | 0.0000E+00 | 0.0000E+00 | 0.0000E+00 | 0.0000E+00 | |
| p-value | 3.5592E-01 | 3.5592E-01 | 3.5592E-01 | 0.0000E+00 | 0.0000E+00 | 0.0000E+00 | 0.0000E+00 | 0.0000E+00 | 0.0000E+00 | NaN | |
| h | 0 | 0 | 0 | 1 | 1 | 1 | 1 | 1 | 1 | NaN | |
| Rank | 10 | 9 | 8 | 7 | 6 | 5 | 4 | 3 | 2 | 1 | |
| F4 | Worst | 6.7596E-46 | 8.2864E-74 | 1.9127E-75 | 1.7531E-93 | 1.1163E-105 | 2.6519E-116 | 1.4328E-120 | 2.4350E-119 | 2.1190E-126 | 1.7474E-105 |
| Average | 1.6904E-46 | 2.0807E-74 | 4.7818E-76 | 4.3827E-94 | 2.7908E-106 | 6.6381E-117 | 5.5115E-121 | 6.0987E-120 | 5.8450E-127 | 4.3685E-106 | |
| Best | 4.7321E-65 | 6.0592E-86 | 4.5588E-101 | 5.9253E-110 | 1.2821E-121 | 1.7840E-126 | 8.5900E-132 | 5.2160E-129 | 6.2314E-144 | 2.3244E-136 | |
| STD | 3.3795E-46 | 4.1371E-74 | 9.5637E-76 | 8.7654E-94 | 5.5814E-106 | 1.3254E-116 | 6.9125E-121 | 1.2168E-119 | 1.0282E-126 | 8.7370E-106 | |
| p-value | 3.5575E-01 | 3.5330E-01 | 3.5592E-01 | 3.5592E-01 | 7.7114E-01 | 3.5592E-01 | 3.5592E-01 | 3.5592E-01 | 3.5592E-01 | NaN | |
| h | 0 | 0 | 0 | 0 | 0 | 0 | 0 | 0 | 0 | NaN | |
| Rank | 10 | 9 | 8 | 7 | 5 | 4 | 2 | 3 | 1 | 6 | |
| F5 | Worst | 7.3201E-01 | 4.2782E+00 | 8.8137E-02 | 2.0246E-01 | 1.1176E+00 | 6.5509E-01 | 4.8630E-01 | 1.8790E-01 | 6.5660E-03 | 4.7512E-03 |
| Average | 3.7175E-01 | 2.1207E+00 | 4.6264E-02 | 1.1134E-01 | 6.2657E-01 | 1.7565E-01 | 2.4688E-01 | 7.6736E-02 | 4.1207E-03 | 2.7667E-03 | |
| Best | 2.6965E-02 | 3.5751E-02 | 2.1097E-03 | 2.5725E-02 | 2.7785E-05 | 3.2879E-03 | 9.0213E-03 | 9.5005E-04 | 2.2449E-04 | 1.0521E-03 | |
| STD | 3.9810E-01 | 2.1511E+00 | 4.4485E-02 | 9.0553E-02 | 5.5939E-01 | 3.2008E-01 | 2.4001E-01 | 9.0754E-02 | 2.7340E-03 | 1.5925E-03 | |
| p-value | 1.1321E-01 | 9.6456E-02 | 9.8468E-02 | 5.3473E-02 | 6.7238E-02 | 3.2152E-01 | 8.8159E-02 | 1.5426E-01 | 4.2490E-01 | NaN | |
| h | 0 | 0 | 0 | 0 | 0 | 0 | 0 | 0 | 0 | NaN | |
| Rank | 8 | 10 | 3 | 5 | 9 | 6 | 7 | 4 | 2 | 1 | |
| F6 | Worst | 4.7030E-02 | 4.2363E-02 | 3.4359E-02 | 8.7423E-04 | 5.6272E-04 | 2.1748E-03 | 1.2425E-04 | 1.3411E-05 | 2.5108E-04 | 1.2028E-03 |
| Average | 1.4920E-02 | 1.9973E-02 | 2.0603E-02 | 3.6704E-04 | 3.1818E-04 | 5.7056E-04 | 3.5022E-05 | 8.5049E-06 | 7.3295E-05 | 3.1146E-04 | |
| Best | 1.3919E-04 | 2.3726E-03 | 5.1250E-05 | 1.3368E-04 | 4.9138E-05 | 2.1389E-06 | 4.5662E-07 | 1.5411E-09 | 1.0425E-05 | 4.5718E-06 | |
| STD | 2.2106E-02 | 1.6781E-02 | 1.5420E-02 | 3.4119E-04 | 2.2059E-04 | 1.0705E-03 | 5.9621E-05 | 5.8732E-06 | 1.1857E-04 | 5.9438E-04 | |
| p-value | 2.3457E-01 | 5.7698E-02 | 3.9066E-02 | 8.7648E-01 | 9.8378E-01 | 6.8688E-01 | 3.9040E-01 | 3.4736E-01 | 4.6182E-01 | NaN | |
| h | 0 | 0 | 1 | 0 | 0 | 0 | 0 | 0 | 0 | NaN | |
| Rank | 8 | 9 | 10 | 6 | 5 | 7 | 2 | 1 | 3 | 4 | |
| F7 | Worst | 3.7601E-03 | 1.8822E-03 | 4.1801E-04 | 8.7768E-04 | 9.9437E-04 | 3.0691E-04 | 3.7996E-04 | 6.6713E-04 | 4.1421E-04 | 3.8482E-04 |
| Average | 1.5895E-03 | 8.3426E-04 | 3.4047E-04 | 4.2797E-04 | 4.0431E-04 | 1.0489E-04 | 1.5896E-04 | 2.6070E-04 | 2.1306E-04 | 1.6105E-04 | |
| Best | 4.3482E-04 | 1.3493E-04 | 2.2475E-04 | 2.0057E-04 | 1.1769E-04 | 3.2972E-06 | 4.2216E-06 | 2.5180E-06 | 5.6248E-05 | 1.2834E-05 | |
| STD | 1.5014E-03 | 7.9204E-04 | 8.9592E-05 | 3.0489E-04 | 4.0016E-04 | 1.3758E-04 | 1.6578E-04 | 3.0787E-04 | 1.5096E-04 | 1.8018E-04 | |
| p-value | 1.0776E-01 | 1.4847E-01 | 1.2481E-01 | 1.8244E-01 | 3.1004E-01 | 6.3793E-01 | 9.8696E-01 | 5.9658E-01 | 6.7359E-01 | NaN | |
| h | 0 | 0 | 0 | 0 | 0 | 0 | 0 | 0 | 0 | NaN | |
| Rank | 10 | 9 | 6 | 8 | 7 | 1 | 2 | 5 | 4 | 3 | |
| F8 | Worst | −2.9767E+03 | −4.1011E+03 | −4.1441E+03 | −4.1849E+03 | −4.1786E+03 | −3.2613E+03 | −4.1882E+03 | −4.1859E+03 | −4.1801E+03 | −4.1859E+03 |
| Average | −3.2853E+03 | −4.1648E+03 | −4.1761E+03 | −4.1869E+03 | −4.1842E+03 | −3.9426E+03 | −4.1889E+03 | −4.1880E+03 | −4.1861E+03 | −4.1884E+03 | |
| Best | −4.1887E+03 | −4.1891E+03 | −4.1896E+03 | −4.1881E+03 | −4.1886E+03 | −4.1881E+03 | −4.1896E+03 | −4.1894E+03 | −4.1898E+03 | −4.1897E+03 | |
| STD | 6.0233E+02 | 4.2628E+01 | 2.1419E+01 | 1.4465E+00 | 4.9729E+00 | 4.5495E+02 | 5.9991E-01 | 1.5980E+00 | 4.2186E+00 | 1.6695E+00 | |
| p-value | 2.4045E-02 | 3.1031E-01 | 2.9508E-01 | 2.2261E-01 | 1.5675E-01 | 3.2146E-01 | 5.6735E-01 | 7.4173E-01 | 3.5032E-01 | NaN | |
| h | 1 | 0 | 0 | 0 | 0 | 0 | 0 | 0 | 0 | NaN | |
| Rank | 10 | 8 | 7 | 4 | 6 | 9 | 1 | 3 | 5 | 2 | |
| F9 | Worst | 0.0000E+00 | 0.0000E+00 | 0.0000E+00 | 0.0000E+00 | 0.0000E+00 | 0.0000E+00 | 0.0000E+00 | 0.0000E+00 | 0.0000E+00 | 0.0000E+00 |
| Average | 0.0000E+00 | 0.0000E+00 | 0.0000E+00 | 0.0000E+00 | 0.0000E+00 | 0.0000E+00 | 0.0000E+00 | 0.0000E+00 | 0.0000E+00 | 0.0000E+00 | |
| Best | 0.0000E+00 | 0.0000E+00 | 0.0000E+00 | 0.0000E+00 | 0.0000E+00 | 0.0000E+00 | 0.0000E+00 | 0.0000E+00 | 0.0000E+00 | 0.0000E+00 | |
| STD | 0.0000E+00 | 0.0000E+00 | 0.0000E+00 | 0.0000E+00 | 0.0000E+00 | 0.0000E+00 | 0.0000E+00 | 0.0000E+00 | 0.0000E+00 | 0.0000E+00 | |
| p-value | NaN | NaN | NaN | NaN | NaN | NaN | NaN | NaN | NaN | NaN | |
| h | NaN | NaN | NaN | NaN | NaN | NaN | NaN | NaN | NaN | NaN | |
| Rank | 1 | 1 | 1 | 1 | 1 | 1 | 1 | 1 | 1 | 1 | |
| F10 | Worst | 8.8818E-16 | 8.8818E-16 | 8.8818E-16 | 8.8818E-16 | 8.8818E-16 | 8.8818E-16 | 8.8818E-16 | 8.8818E-16 | 8.8818E-16 | 8.8818E-16 |
| Average | 8.8818E-16 | 8.8818E-16 | 8.8818E-16 | 8.8818E-16 | 8.8818E-16 | 8.8818E-16 | 8.8818E-16 | 8.8818E-16 | 8.8818E-16 | 8.8818E-16 | |
| Best | 8.8818E-16 | 8.8818E-16 | 8.8818E-16 | 8.8818E-16 | 8.8818E-16 | 8.8818E-16 | 8.8818E-16 | 8.8818E-16 | 8.8818E-16 | 8.8818E-16 | |
| STD | 0.0000E+00 | 0.0000E+00 | 0.0000E+00 | 0.0000E+00 | 0.0000E+00 | 0.0000E+00 | 0.0000E+00 | 0.0000E+00 | 0.0000E+00 | 0.0000E+00 | |
| p-value | NaN | NaN | NaN | NaN | NaN | NaN | NaN | NaN | NaN | NaN | |
| h | NaN | NaN | NaN | NaN | NaN | NaN | NaN | NaN | NaN | NaN | |
| Rank | 1 | 1 | 1 | 1 | 1 | 1 | 1 | 1 | 1 | 1 | |
| F11 | Worst | 0.0000E+00 | 0.0000E+00 | 0.0000E+00 | 0.0000E+00 | 0.0000E+00 | 0.0000E+00 | 0.0000E+00 | 0.0000E+00 | 0.0000E+00 | 0.0000E+00 |
| Average | 0.0000E+00 | 0.0000E+00 | 0.0000E+00 | 0.0000E+00 | 0.0000E+00 | 0.0000E+00 | 0.0000E+00 | 0.0000E+00 | 0.0000E+00 | 0.0000E+00 | |
| Best | 0.0000E+00 | 0.0000E+00 | 0.0000E+00 | 0.0000E+00 | 0.0000E+00 | 0.0000E+00 | 0.0000E+00 | 0.0000E+00 | 0.0000E+00 | 0.0000E+00 | |
| STD | 0.0000E+00 | 0.0000E+00 | 0.0000E+00 | 0.0000E+00 | 0.0000E+00 | 0.0000E+00 | 0.0000E+00 | 0.0000E+00 | 0.0000E+00 | 0.0000E+00 | |
| p-value | NaN | NaN | NaN | NaN | NaN | NaN | NaN | NaN | NaN | NaN | |
| h | NaN | NaN | NaN | NaN | NaN | NaN | NaN | NaN | NaN | NaN | |
| Rank | 1 | 1 | 1 | 1 | 1 | 1 | 1 | 1 | 1 | 1 | |
| F12 | Worst | 4.0854E-02 | 2.2289E-04 | 1.3389E-03 | 6.8061E-04 | 5.6103E-04 | 1.7179E-04 | 1.0947E-04 | 7.3013E-04 | 5.0295E-05 | 2.0846E-05 |
| Average | 1.7935E-02 | 6.9673E-05 | 6.5105E-04 | 2.9193E-04 | 2.0389E-04 | 6.2899E-05 | 4.1642E-05 | 2.6116E-04 | 3.0538E-05 | 5.6652E-06 | |
| Best | 4.3072E-03 | 7.2701E-06 | 2.2544E-06 | 1.9810E-05 | 7.6314E-07 | 3.2039E-06 | 3.2509E-07 | 5.7498E-06 | 7.3791E-06 | 2.7871E-07 | |
| STD | 1.7213E-02 | 1.0248E-04 | 7.0379E-04 | 3.0985E-04 | 2.5034E-04 | 7.5121E-05 | 4.7190E-05 | 3.4009E-04 | 1.7759E-05 | 1.0124E-05 | |
| p-value | 8.2358E-02 | 2.6020E-01 | 1.1637E-01 | 1.1430E-01 | 1.6466E-01 | 1.8175E-01 | 1.8660E-01 | 1.8382E-01 | 5.0921E-02 | 1.0000E+00 | |
| h | 0 | 0 | 0 | 0 | 0 | 0 | 0 | 0 | 0 | 0 | |
| Rank | 10 | 5 | 9 | 8 | 6 | 4 | 3 | 7 | 2 | 1 | |
| F13 | Worst | 7.4368E-02 | 1.5589E-02 | 7.8932E-04 | 2.0129E-03 | 2.2940E-03 | 2.1774E-04 | 2.3244E-04 | 2.0152E-04 | 8.1074E-04 | 1.0923E-04 |
| Average | 2.3931E-02 | 3.9380E-03 | 2.2898E-04 | 8.3051E-04 | 8.9919E-04 | 1.3918E-04 | 8.5703E-05 | 1.1051E-04 | 3.0715E-04 | 7.3491E-05 | |
| Best | 2.4372E-03 | 4.2232E-06 | 2.0465E-05 | 1.4455E-04 | 3.8590E-05 | 6.9042E-05 | 9.0061E-06 | 3.9783E-05 | 1.9733E-05 | 5.4162E-07 | |
| STD | 3.4057E-02 | 7.7679E-03 | 3.7411E-04 | 8.8825E-04 | 1.0825E-03 | 6.1273E-05 | 1.0189E-04 | 7.0518E-05 | 3.4733E-04 | 5.0235E-05 | |
| p-value | 2.1075E-01 | 3.5817E-01 | 4.4154E-01 | 1.3969E-01 | 1.7838E-01 | 1.4839E-01 | 8.3690E-01 | 4.2532E-01 | 2.3136E-01 | NaN | |
| h | 0 | 0 | 0 | 0 | 0 | 0 | 0 | 0 | 0 | NaN | |
| Rank | 10 | 9 | 5 | 7 | 8 | 4 | 2 | 3 | 6 | 1 | |
| Mean ranking | 7.6154E+00 | 6.8462E+00 | 5.7692E+00 | 5.2308E+00 | 5.2308E+00 | 3.9231E+00 | 2.7692E+00 | 2.8462E+00 | 2.5385E+00 | 1.8462E+00 | |
| Final ranking | 10 | 9 | 8 | 6 | 6 | 5 | 3 | 4 | 2 | 1 |
| Fun | Measure | Comparative Algorithms | |||||||||||
|---|---|---|---|---|---|---|---|---|---|---|---|---|---|
| AO | DMOA | WOA | SCA | DA | GWO | PSO | ALO | RSA | ROA | AOA | HRSA | ||
| F1 | Worst | 1.1571E-100 | 2.1046E-09 | 7.6673E-63 | 2.6611E-09 | 2.6788E+01 | 1.1340E-47 | 2.2231E-17 | 2.2742E-07 | 9.5757E-56 | 6.8209E-11 | 5.2731E-70 | 2.0773E-108 |
| Average | 2.8927E-101 | 1.1143E-09 | 1.9168E-63 | 7.2690E-10 | 1.7523E+01 | 3.2797E-48 | 1.0342E-17 | 9.2064E-08 | 2.9793E-56 | 2.3922E-11 | 1.3183E-70 | 5.1931E-109 | |
| Best | 3.0073E-116 | 5.0980E-10 | 1.1259E-72 | 4.4844E-13 | 8.6835E+00 | 3.8585E-51 | 5.8258E-20 | 1.8748E-08 | 6.6334E-60 | 1.9429E-12 | 3.2582E-152 | 3.4580E-138 | |
| STD | 5.7855E-101 | 6.8881E-10 | 3.8336E-63 | 1.2935E-09 | 8.6400E+00 | 5.3931E-48 | 1.1728E-17 | 9.3965E-08 | 4.5319E-56 | 3.0232E-11 | 2.6365E-70 | 1.0386E-108 | |
| p-value | 3.5592E-01 | 1.7790E-02 | 3.5592E-01 | 3.0400E-01 | 6.6787E-03 | 2.6956E-01 | 1.2823E-01 | 9.7758E-02 | 2.3659E-01 | 1.6461E-01 | 3.5592E-01 | NaN | |
| h | 0 | 1 | 0 | 0 | 1 | 0 | 0 | 0 | 0 | 0 | 0 | NaN | |
| Rank | 2 | 10 | 4 | 9 | 12 | 6 | 7 | 11 | 5 | 8 | 3 | 1 | |
| F2 | Worst | 6.3194E-60 | 1.6949E-02 | 7.4584E-52 | 3.5524E-09 | 2.1903E+00 | 1.6706E-27 | 3.9759E-10 | 5.6065E-01 | 1.4412E-32 | 9.6848E-09 | 0.0000E+00 | 5.3364E-49 |
| Average | 1.5799E-60 | 4.2476E-03 | 3.3970E-52 | 1.3483E-09 | 1.4024E+00 | 6.0495E-28 | 2.3544E-10 | 1.4063E-01 | 6.9571E-33 | 6.0154E-09 | 0.0000E+00 | 1.4410E-49 | |
| Best | 7.3417E-75 | 1.1089E-05 | 5.7800E-54 | 1.5327E-11 | 2.4793E-01 | 1.6624E-28 | 4.9298E-11 | 1.5065E-05 | 2.1170E-33 | 1.5222E-09 | 0.0000E+00 | 1.5588E-55 | |
| STD | 3.1597E-60 | 8.4673E-03 | 3.7501E-52 | 1.6440E-09 | 8.3182E-01 | 7.1418E-28 | 1.4544E-10 | 2.8002E-01 | 5.7688E-33 | 3.4094E-09 | 0.0000E+00 | 2.6047E-49 | |
| p-value | 3.1092E-01 | 3.5445E-01 | 3.1197E-01 | 1.5207E-01 | 1.5007E-02 | 1.4118E-01 | 1.7740E-02 | 3.5393E-01 | 5.2432E-02 | 1.2387E-02 | 3.1092E-01 | NaN | |
| h | 0 | 0 | 0 | 0 | 1 | 0 | 1 | 0 | 0 | 1 | 0 | NaN | |
| Rank | 2 | 10 | 3 | 8 | 12 | 6 | 7 | 11 | 5 | 9 | 1 | 4 | |
| F3 | Worst | 2.5481E-104 | 8.6720E-02 | 2.6247E+03 | 7.8583E-02 | 5.3797E+03 | 4.1665E-22 | 6.3364E-05 | 3.6192E-01 | 5.3170E-25 | 3.6758E-02 | 5.8269E-68 | 5.7223E-116 |
| Average | 6.3723E-105 | 2.1726E-02 | 9.6402E+02 | 3.7630E-02 | 2.6504E+03 | 2.2794E-22 | 1.9621E-05 | 2.3056E-01 | 1.3293E-25 | 1.4828E-02 | 1.4571E-68 | 1.4306E-116 | |
| Best | 7.0353E-112 | 1.4915E-05 | 1.5954E-05 | 3.1383E-06 | 2.5278E+01 | 1.3713E-23 | 1.8828E-06 | 8.6392E-02 | 2.7157E-32 | 9.8927E-04 | 6.3905E-108 | 1.7975E-141 | |
| STD | 1.2739E-104 | 4.3330E-02 | 1.1759E+03 | 4.2007E-02 | 3.0089E+03 | 1.7380E-22 | 2.9324E-05 | 1.4879E-01 | 2.6585E-25 | 1.5408E-02 | 2.9132E-68 | 2.8611E-116 | |
| p-value | 3.5574E-01 | 3.5467E-01 | 1.5221E-01 | 1.2338E-01 | 1.2859E-01 | 3.9423E-02 | 2.2931E-01 | 2.1140E-02 | 3.5592E-01 | 1.0260E-01 | 3.5578E-01 | NaN | |
| h | 0 | 0 | 0 | 0 | 0 | 1 | 0 | 1 | 0 | 0 | 0 | NaN | |
| Rank | 2 | 8 | 11 | 9 | 12 | 5 | 6 | 10 | 4 | 7 | 3 | 1 | |
| F4 | Worst | 4.3892E-61 | 2.9025E-05 | 1.6160E+01 | 6.5799E-03 | 5.9530E+00 | 2.8186E-15 | 7.4656E-04 | 9.9430E-02 | 5.3933E-20 | 4.2407E+00 | 8.1594E-18 | 3.0089E-51 |
| Average | 1.0973E-61 | 2.3631E-05 | 9.1448E+00 | 3.2700E-03 | 4.1841E+00 | 1.9128E-15 | 3.9903E-04 | 3.7199E-02 | 2.5279E-20 | 2.7561E+00 | 2.0398E-18 | 7.7646E-52 | |
| Best | 9.6316E-79 | 1.6075E-05 | 1.3178E-01 | 2.3195E-04 | 2.7084E+00 | 9.4618E-16 | 7.2129E-05 | 2.7512E-03 | 1.3331E-21 | 1.4819E+00 | 2.2242E-67 | 6.9049E-60 | |
| STD | 2.1946E-61 | 6.2330E-06 | 6.6791E+00 | 3.1005E-03 | 1.6482E+00 | 1.0353E-15 | 3.1951E-04 | 4.3576E-02 | 2.7085E-20 | 1.1532E+00 | 4.0797E-18 | 1.4890E-51 | |
| p-value | 3.3717E-01 | 2.7356E-04 | 3.3811E-02 | 7.9449E-02 | 2.2717E-03 | 1.0148E-02 | 4.6670E-02 | 1.3863E-01 | 1.1120E-01 | 3.0628E-03 | 3.5592E-01 | NaN | |
| h | 0 | 1 | 1 | 0 | 1 | 1 | 1 | 0 | 0 | 1 | 0 | NaN | |
| Rank | 1 | 6 | 12 | 8 | 11 | 5 | 7 | 9 | 3 | 10 | 4 | 2 | |
| F5 | Worst | 1.0090E-02 | 6.8476E+02 | 7.4820E+00 | 8.7223E+00 | 7.1798E+02 | 7.1956E+00 | 5.8258E+00 | 3.7504E+02 | 5.8100E+00 | 1.1307E+01 | 8.6967E+00 | 1.5772E+00 |
| Average | 2.9026E-03 | 1.9907E+02 | 7.1510E+00 | 8.1759E+00 | 2.6870E+02 | 6.6393E+00 | 5.2538E+00 | 1.8256E+02 | 5.5321E+00 | 5.9579E+00 | 8.4321E+00 | 8.0915E-01 | |
| Best | 2.3533E-04 | 8.2388E+00 | 6.7911E+00 | 7.8712E+00 | 7.2106E+01 | 6.1326E+00 | 4.5532E+00 | 5.7113E+00 | 5.2342E+00 | 2.0689E+00 | 8.1501E+00 | 8.5112E-02 | |
| STD | 4.7968E-03 | 3.2628E+02 | 2.8261E-01 | 3.7457E-01 | 3.0211E+02 | 5.3406E-01 | 5.3658E-01 | 2.0333E+02 | 2.3553E-01 | 3.9620E+00 | 2.2871E-01 | 6.8245E-01 | |
| p-value | 5.6073E-02 | 2.6991E-01 | 2.4973E-06 | 1.4062E-06 | 1.2652E-01 | 1.0441E-05 | 5.0597E-05 | 1.2404E-01 | 1.2291E-05 | 4.2831E-02 | 7.2168E-07 | NaN | |
| h | 0 | 0 | 1 | 1 | 0 | 1 | 1 | 0 | 1 | 1 | 1 | NaN | |
| Rank | 1 | 11 | 7 | 8 | 12 | 6 | 3 | 10 | 4 | 5 | 9 | 2 | |
| F6 | Worst | 3.0958E-04 | 2.0121E-09 | 2.2052E-01 | 7.9699E-01 | 1.0822E+01 | 2.5028E-01 | 1.5409E-02 | 8.8196E-08 | 1.3446E-12 | 2.1400E-10 | 6.1615E-01 | 3.4780E-17 |
| Average | 1.2661E-04 | 1.3904E-09 | 6.2350E-02 | 5.9809E-01 | 5.2641E+00 | 6.2573E-02 | 4.5459E-03 | 3.1304E-08 | 3.5418E-13 | 6.8957E-11 | 4.1272E-01 | 1.3592E-17 | |
| Best | 1.8530E-06 | 8.1527E-10 | 1.8655E-03 | 4.7048E-01 | 1.1840E-01 | 1.3983E-06 | 1.3847E-04 | 8.7919E-09 | 1.8773E-15 | 1.4982E-12 | 1.9619E-01 | 6.5669E-20 | |
| STD | 1.5073E-04 | 5.8512E-10 | 1.0587E-01 | 1.4410E-01 | 5.3834E+00 | 1.2514E-01 | 7.2704E-03 | 3.8019E-08 | 6.6091E-13 | 9.8755E-11 | 1.7518E-01 | 1.4849E-17 | |
| p-value | 2.6986E-01 | 2.5767E-01 | 3.1779E-01 | 1.7408E-04 | 9.8511E-02 | 3.9025E-01 | 2.5767E-01 | 2.5768E-01 | 2.5767E-01 | 2.5767E-01 | 3.4818E-03 | NaN | |
| h | 0 | 0 | 0 | 1 | 0 | 0 | 0 | 0 | 0 | 0 | 1 | NaN | |
| Rank | 6 | 4 | 8 | 11 | 12 | 9 | 7 | 5 | 2 | 3 | 10 | 1 | |
| F7 | Worst | 5.8742E-03 | 1.7491E-02 | 3.2814E-03 | 2.8844E-03 | 1.3477E-01 | 5.4463E-04 | 8.4784E-03 | 1.8516E-01 | 7.7024E-04 | 4.6724E-02 | 9.2704E-04 | 2.8372E-04 |
| Average | 3.4183E-03 | 1.0077E-02 | 2.0021E-03 | 1.6652E-03 | 6.3525E-02 | 4.1147E-04 | 6.1809E-03 | 1.0811E-01 | 4.7066E-04 | 2.6367E-02 | 4.7710E-04 | 1.3225E-04 | |
| Best | 5.0335E-04 | 1.3412E-03 | 4.7093E-04 | 6.0223E-04 | 6.4245E-03 | 2.8956E-04 | 4.3349E-03 | 7.1808E-02 | 3.4456E-04 | 1.3936E-02 | 1.3284E-04 | 1.1502E-05 | |
| STD | 2.2207E-03 | 6.9666E-03 | 1.4820E-03 | 9.9504E-04 | 5.9631E-02 | 1.3949E-04 | 1.8209E-03 | 5.1922E-02 | 2.0081E-04 | 1.4979E-02 | 3.6519E-04 | 1.1275E-04 | |
| p-value | 2.5427E-02 | 1.1841E-01 | 3.2958E-01 | 1.9972E-01 | 9.0584E-02 | 3.5451E-02 | 1.0270E-01 | 6.8887E-03 | 3.8341E-02 | 2.3070E-02 | 3.9919E-02 | NaN | |
| h | 1 | 0 | 0 | 0 | 0 | 1 | 0 | 1 | 1 | 1 | 1 | NaN | |
| Rank | 7 | 9 | 6 | 5 | 11 | 2 | 8 | 12 | 3 | 10 | 4 | 1 | |
| F8 | Worst | −1.9843E+03 | −2.4441E+03 | −2.2903E+03 | −1.8464E+03 | −2.6001E+03 | −1.9888E+03 | −1.8626E+03 | −1.9257E+03 | −2.7610E+03 | −2.5286E+03 | −2.1284E+03 | −1.7313E+03 |
| Average | −2.3457E+03 | −2.7747E+03 | −2.8848E+03 | −1.9811E+03 | −2.7868E+03 | −2.3539E+03 | −2.1875E+03 | −2.1323E+03 | −3.2678E+03 | −3.0607E+03 | −2.2242E+03 | −2.9708E+03 | |
| Best | −3.0047E+03 | −3.2028E+03 | −3.7732E+03 | −2.1068E+03 | −2.9924E+03 | −2.8849E+03 | −2.5174E+03 | −2.3933E+03 | −3.7146E+03 | −3.3592E+03 | −2.3744E+03 | −4.1376E+03 | |
| STD | 4.5283E+02 | 3.6950E+02 | 6.6467E+02 | 1.3411E+02 | 1.6730E+02 | 3.9855E+02 | 2.8876E+02 | 2.4258E+02 | 4.1710E+02 | 3.9285E+02 | 1.0526E+02 | 1.2856E+03 | |
| p-value | 3.9442E-01 | 7.7926E-01 | 9.0927E-01 | 1.7657E-01 | 7.8607E-01 | 3.9466E-01 | 2.7939E-01 | 2.4719E-01 | 6.7574E-01 | 8.9796E-01 | 2.9101E-01 | NaN | |
| h | 0 | 0 | 0 | 0 | 0 | 0 | 0 | 0 | 0 | 0 | 0 | NaN | |
| Rank | 8 | 6 | 4 | 12 | 5 | 7 | 10 | 11 | 1 | 2 | 9 | 3 | |
| F9 | Worst | 0.0000E+00 | 4.2783E+01 | 0.0000E+00 | 4.2364E-02 | 3.8089E+01 | 4.4666E+00 | 1.2955E+01 | 5.2733E+01 | 1.9899E+00 | 1.8904E+01 | 0.0000E+00 | 0.0000E+00 |
| Average | 0.0000E+00 | 2.5869E+01 | 0.0000E+00 | 1.3584E-02 | 2.9275E+01 | 1.1166E+00 | 8.4629E+00 | 3.3331E+01 | 4.9748E-01 | 1.2437E+01 | 0.0000E+00 | 0.0000E+00 | |
| Best | 0.0000E+00 | 1.1940E+01 | 0.0000E+00 | 1.7081E-11 | 1.9416E+01 | 0.0000E+00 | 5.9724E+00 | 2.3879E+01 | 0.0000E+00 | 6.9647E+00 | 0.0000E+00 | 0.0000E+00 | |
| STD | 0.0000E+00 | 1.4869E+01 | 0.0000E+00 | 1.9999E-02 | 7.6693E+00 | 2.2333E+00 | 3.1025E+00 | 1.3112E+01 | 9.9496E-01 | 5.8862E+00 | 0.0000E+00 | 0.0000E+00 | |
| p-value | NaN | 1.3149E-02 | NaN | 2.2319E-01 | 2.6354E-04 | 3.5592E-01 | 1.5792E-03 | 2.2563E-03 | 3.5592E-01 | 5.5259E-03 | NaN | NaN | |
| h | NaN | 1 | NaN | 0 | 1 | 0 | 1 | 1 | 0 | 1 | NaN | NaN | |
| Rank | 1 | 10 | 1 | 5 | 11 | 7 | 8 | 12 | 6 | 9 | 1 | 1 | |
| F10 | Worst | 8.8818E-16 | 2.3168E+00 | 4.4409E-15 | 8.4300E-01 | 9.6530E+00 | 1.5099E-14 | 7.5055E-10 | 1.1551E+00 | 7.9936E-15 | 1.6462E+00 | 8.8818E-16 | 8.8818E-16 |
| Average | 8.8818E-16 | 1.1568E+00 | 4.4409E-15 | 2.1075E-01 | 4.7552E+00 | 9.7700E-15 | 4.3526E-10 | 2.8891E-01 | 5.3291E-15 | 7.0034E-01 | 8.8818E-16 | 8.8818E-16 | |
| Best | 8.8818E-16 | 1.0766E-05 | 4.4409E-15 | 3.7578E-08 | 1.2042E+00 | 7.9936E-15 | 1.6850E-10 | 1.3290E-04 | 4.4409E-15 | 1.8206E-06 | 8.8818E-16 | 8.8818E-16 | |
| STD | 0.0000E+00 | 9.4585E-01 | 0.0000E+00 | 4.2150E-01 | 3.6264E+00 | 3.5527E-15 | 2.6089E-10 | 5.7749E-01 | 1.7764E-15 | 8.3317E-01 | 0.0000E+00 | 0.0000E+00 | |
| p-value | NaN | 5.0059E-02 | 0.0000E+00 | 3.5592E-01 | 3.9450E-02 | 2.4523E-03 | 1.5676E-02 | 3.5566E-01 | 2.4523E-03 | 1.4373E-01 | NaN | NaN | |
| h | NaN | 0 | 1 | 0 | 1 | 1 | 1 | 0 | 1 | 0 | NaN | NaN | |
| Rank | 1 | 11 | 4 | 8 | 12 | 6 | 7 | 9 | 5 | 10 | 1 | 1 | |
| F11 | Worst | 0.0000E+00 | 2.9276E-01 | 3.5207E-01 | 3.2525E-01 | 1.6235E+00 | 7.9759E-02 | 3.8586E-01 | 3.3696E-01 | 3.6867E-02 | 2.6592E-01 | 4.6191E-01 | 0.0000E+00 |
| Average | 0.0000E+00 | 2.1408E-01 | 1.1366E-01 | 1.2380E-01 | 7.0711E-01 | 2.9156E-02 | 2.0913E-01 | 2.3681E-01 | 9.2168E-03 | 1.7540E-01 | 1.1548E-01 | 0.0000E+00 | |
| Best | 0.0000E+00 | 1.5241E-01 | 0.0000E+00 | 2.0962E-02 | 2.8492E-01 | 0.0000E+00 | 3.6894E-02 | 1.0578E-01 | 0.0000E+00 | 1.1568E-01 | 0.0000E+00 | 0.0000E+00 | |
| STD | 0.0000E+00 | 7.2479E-02 | 1.6613E-01 | 1.3697E-01 | 6.1877E-01 | 3.7949E-02 | 1.7441E-01 | 9.6929E-02 | 1.8434E-02 | 6.3894E-02 | 2.3096E-01 | 0.0000E+00 | |
| p-value | NaN | 1.0464E-03 | 2.2022E-01 | 1.2064E-01 | 6.2324E-02 | 1.7530E-01 | 5.3428E-02 | 2.7485E-03 | 3.5592E-01 | 1.5288E-03 | 3.5591E-01 | NaN | |
| h | NaN | 1 | 0 | 0 | 0 | 0 | 0 | 1 | 0 | 1 | 0 | NaN | |
| Rank | 1 | 10 | 5 | 7 | 12 | 4 | 9 | 11 | 3 | 8 | 6 | 1 | |
| F12 | Worst | 1.3494E-05 | 3.1771E-01 | 2.5782E-02 | 1.4964E-01 | 3.1991E+00 | 3.9305E-02 | 5.2225E-21 | 3.0893E+00 | 2.9389E-14 | 3.1101E-01 | 3.1390E-01 | 4.9570E-03 |
| Average | 7.2659E-06 | 7.9520E-02 | 1.3371E-02 | 1.1590E-01 | 2.0861E+00 | 2.9329E-02 | 1.3975E-21 | 2.8577E+00 | 1.5102E-14 | 2.3402E-01 | 2.7789E-01 | 2.9149E-03 | |
| Best | 1.5855E-06 | 2.5293E-09 | 7.7458E-04 | 7.7385E-02 | 1.0996E+00 | 1.9865E-02 | 5.4669E-23 | 2.4977E+00 | 1.2207E-17 | 3.0462E-03 | 2.5509E-01 | 4.1431E-04 | |
| STD | 5.1084E-06 | 1.5879E-01 | 1.3032E-02 | 3.7574E-02 | 1.0350E+00 | 1.0893E-02 | 2.5510E-21 | 2.5268E-01 | 1.2422E-14 | 1.5398E-01 | 2.6953E-02 | 2.0243E-03 | |
| p-value | 2.8325E-02 | 3.7191E-01 | 1.6391E-01 | 9.6003E-04 | 6.9177E-03 | 3.1008E-03 | 2.8060E-02 | 4.9186E-07 | 2.8060E-02 | 2.3963E-02 | 9.1600E-07 | NaN | |
| h | 1 | 0 | 0 | 1 | 1 | 1 | 1 | 1 | 1 | 1 | 1 | NaN | |
| Rank | 3 | 7 | 5 | 8 | 11 | 6 | 1 | 12 | 2 | 9 | 10 | 4 | |
| F13 | Worst | 4.2945E-05 | 1.0998E-02 | 1.2529E-01 | 5.1405E-01 | 1.0400E+00 | 2.9491E-05 | 1.5412E-18 | 1.0998E-02 | 1.9342E-02 | 4.3949E-02 | 9.9607E-01 | 3.3472E-12 |
| Average | 1.7247E-05 | 2.7496E-03 | 6.6985E-02 | 4.0342E-01 | 5.9742E-01 | 1.4054E-05 | 5.9650E-19 | 2.7507E-03 | 8.9798E-03 | 1.3734E-02 | 9.3206E-01 | 9.0107E-13 | |
| Best | 5.7395E-07 | 7.7572E-10 | 1.4365E-02 | 2.9787E-01 | 2.5289E-01 | 6.3059E-06 | 3.5953E-22 | 4.1725E-07 | 1.2013E-05 | 9.5274E-10 | 8.5068E-01 | 7.2496E-16 | |
| STD | 1.8515E-05 | 5.4991E-03 | 4.7274E-02 | 1.0001E-01 | 3.3453E-01 | 1.0516E-05 | 7.3949E-19 | 5.4982E-03 | 9.9037E-03 | 2.0798E-02 | 6.0197E-02 | 1.6339E-12 | |
| p-value | 1.2029E-01 | 3.1351E-01 | 5.3160E-02 | 2.2602E-04 | 1.2572E-02 | 1.2018E-01 | 1.1971E-01 | 3.1357E-01 | 1.1971E-01 | 6.9412E-01 | 8.6395E-08 | NaN | |
| h | 0 | 0 | 0 | 1 | 1 | 0 | 0 | 0 | 0 | 0 | 1 | NaN | |
| Rank | 4 | 5 | 9 | 10 | 11 | 3 | 1 | 6 | 7 | 8 | 12 | 2 | |
| Mean ranking | 3.0000E+00 | 8.2308E+00 | 6.0769E+00 | 8.3077E+00 | 1.1077E+01 | 5.5385E+00 | 6.2308E+00 | 9.9231E+00 | 3.8462E+00 | 7.5385E+00 | 5.6154E+00 | 1.8462E+00 | |
| Final ranking | 2 | 9 | 6 | 10 | 12 | 4 | 7 | 11 | 3 | 8 | 5 | 1 | |
| Fun | Measure | Comparative Algorithms | |||||||||||
|---|---|---|---|---|---|---|---|---|---|---|---|---|---|
| AO | DMOA | WOA | SCA | DA | GWO | PSO | ALO | RSA | ROA | AOA | HRSA | ||
| F1 | Worst | 4.0782E-98 | 3.1718E+01 | 5.8226E-61 | 1.3866E+03 | 3.9007E+03 | 8.5638E-17 | 7.7635E-01 | 7.3039E+02 | 1.1830E-28 | 4.9992E+01 | 1.2631E-02 | 2.8449E-106 |
| Average | 1.0196E-98 | 2.2918E+01 | 1.4557E-61 | 8.8436E+02 | 1.6626E+03 | 4.9381E-17 | 4.7025E-01 | 2.2654E+02 | 3.2097E-29 | 3.5959E+01 | 5.8299E-03 | 7.1122E-107 | |
| Best | 3.0185E-123 | 9.3735E+00 | 1.0884E-73 | 1.3827E+02 | 3.6367E+02 | 5.5387E-18 | 1.4462E-01 | 5.4808E+01 | 2.3156E-30 | 2.5600E+01 | 1.8742E-10 | 7.5850E-149 | |
| STD | 2.0391E-98 | 1.0166E+01 | 2.9112E-61 | 5.6464E+02 | 1.6147E+03 | 3.3504E-17 | 2.6084E-01 | 3.3591E+02 | 5.7483E-29 | 1.0735E+01 | 6.1114E-03 | 1.4224E-106 | |
| p-value | 3.5590E-01 | 4.0661E-03 | 3.5589E-01 | 2.0260E-02 | 8.5130E-02 | 2.5688E-02 | 1.1290E-02 | 2.2608E-01 | 3.0682E-01 | 5.3690E-04 | 1.0502E-01 | NaN | |
| h | 0 | 1 | 0 | 1 | 0 | 1 | 1 | 0 | 0 | 1 | 0 | NaN | |
| Rank | 2 | 8 | 3 | 11 | 12 | 5 | 7 | 10 | 4 | 9 | 6 | 1 | |
| F2 | Worst | 3.7433E-50 | 1.0812E+02 | 5.4876E-47 | 3.8977E-01 | 1.8393E+01 | 2.7882E-10 | 5.2010E+00 | 2.0965E+02 | 5.2108E-18 | 2.2379E+00 | 2.6869E-32 | 1.5364E-60 |
| Average | 9.3863E-51 | 4.1687E+01 | 1.4222E-47 | 2.0333E-01 | 1.2972E+01 | 1.8202E-10 | 3.3373E+00 | 1.0497E+02 | 3.5046E-18 | 1.5655E+00 | 6.7172E-33 | 3.8427E-61 | |
| Best | 1.2613E-57 | 1.1616E+01 | 1.6943E-51 | 4.6794E-02 | 8.4600E+00 | 6.8138E-11 | 1.2963E+00 | 2.3419E+01 | 1.5445E-18 | 1.0772E+00 | 6.7796E-60 | 1.3859E-75 | |
| STD | 1.8698E-50 | 4.4775E+01 | 2.7117E-47 | 1.5993E-01 | 4.1353E+00 | 9.3938E-11 | 1.6588E+00 | 9.4076E+01 | 1.5059E-18 | 5.0391E-01 | 1.3434E-32 | 7.6807E-61 | |
| p-value | 3.5413E-01 | 1.1190E-01 | 3.3491E-01 | 4.3918E-02 | 7.6223E-04 | 8.2145E-03 | 6.9291E-03 | 6.7126E-02 | 3.4872E-03 | 8.0222E-04 | 3.5592E-01 | NaN | |
| h | 0 | 0 | 0 | 1 | 1 | 1 | 1 | 0 | 1 | 1 | 0 | NaN | |
| Rank | 2 | 11 | 3 | 7 | 10 | 6 | 9 | 12 | 5 | 8 | 4 | 1 | |
| F3 | Worst | 2.36803E-93 | 16951.21302 | 420591.1857 | 59991.69346 | 110891.9087 | 3.600143592 | 3296.378763 | 60132.02142 | 0.031346296 | 9792.661794 | 0.314587915 | 2.4468E-111 |
| Average | 5.92006E-94 | 14078.94053 | 259808.0922 | 53400.71341 | 78018.00548 | 1.18948309 | 2064.355479 | 37864.25151 | 0.00819798 | 7542.713664 | 0.160888346 | 6.1182E-112 | |
| Best | 3.6969E-112 | 9664.548042 | 164862.827 | 41214.97962 | 49573.50799 | 0.130123735 | 1085.580554 | 18446.14994 | 1.16188E-05 | 5634.887889 | 0.082118372 | 8.7014E-149 | |
| STD | 1.18401E-93 | 3249.194475 | 111450.2066 | 8824.145524 | 25173.64 | 1.627422681 | 914.7006548 | 17791.76731 | 0.015444974 | 2050.038886 | 0.108252379 | 1.2233E-111 | |
| p-value | 0.355917684 | 0.000130212 | 0.003458995 | 1.93238E-05 | 0.000812637 | 0.194109297 | 0.004044426 | 0.005342487 | 0.329279344 | 0.000322532 | 0.024877921 | NaN | |
| h | 0 | 1 | 1 | 1 | 1 | 0 | 1 | 1 | 0 | 1 | 1 | NaN | |
| Rank | 2 | 8 | 12 | 10 | 11 | 5 | 6 | 9 | 3 | 7 | 4 | 1 | |
| F4 | Worst | 6.8610E-60 | 3.1812E+01 | 9.0999E+01 | 7.4864E+01 | 4.3456E+01 | 5.5896E-03 | 6.5534E+00 | 3.6673E+01 | 8.9361E-06 | 4.8080E+01 | 8.2925E-02 | 1.7208E-54 |
| Average | 2.5424E-60 | 2.5308E+01 | 7.0297E+01 | 7.1699E+01 | 3.1073E+01 | 2.8448E-03 | 4.4164E+00 | 3.2017E+01 | 3.8129E-06 | 3.7531E+01 | 5.8325E-02 | 4.3063E-55 | |
| Best | 1.0303E-72 | 1.8835E+01 | 1.6764E+01 | 6.5484E+01 | 1.1452E+01 | 7.6601E-04 | 2.8777E+00 | 2.8534E+01 | 1.4312E-06 | 3.3232E+01 | 4.3176E-02 | 5.7683E-63 | |
| STD | 3.2744E-60 | 5.5607E+00 | 3.5899E+01 | 4.2435E+00 | 1.5349E+01 | 2.0889E-03 | 1.6731E+00 | 3.7908E+00 | 3.4653E-06 | 7.0710E+00 | 1.7231E-02 | 8.6015E-55 | |
| p-value | 3.5534E-01 | 9.8768E-05 | 7.8348E-03 | 4.4709E-08 | 6.7336E-03 | 3.4467E-02 | 1.8666E-03 | 2.7512E-06 | 7.0044E-02 | 4.1159E-05 | 5.0739E-04 | NaN | |
| h | 0 | 1 | 1 | 1 | 1 | 1 | 1 | 1 | 0 | 1 | 1 | NaN | |
| Rank | 1 | 7 | 11 | 12 | 8 | 4 | 6 | 9 | 3 | 10 | 5 | 2 | |
| F5 | Worst | 1.6654E-02 | 4.2719E+04 | 4.8760E+01 | 2.2741E+07 | 4.0217E+05 | 4.8697E+01 | 1.1119E+03 | 3.6622E+04 | 4.6787E+01 | 2.1306E+03 | 4.8918E+01 | 4.5067E+01 |
| Average | 6.2950E-03 | 1.4282E+04 | 4.8536E+01 | 1.4207E+07 | 1.4645E+05 | 4.8074E+01 | 6.9694E+02 | 2.6873E+04 | 4.6359E+01 | 1.1988E+03 | 4.8877E+01 | 1.9759E+01 | |
| Best | 1.8375E-04 | 9.0197E+02 | 4.8283E+01 | 1.2060E+06 | 4.5968E+04 | 4.7080E+01 | 4.5280E+02 | 1.7436E+04 | 4.5956E+01 | 6.4804E+02 | 4.8824E+01 | 3.4406E-01 | |
| STD | 7.4526E-03 | 1.9583E+04 | 2.1777E-01 | 9.1797E+06 | 1.7082E+05 | 7.5301E-01 | 2.9226E+02 | 8.5652E+03 | 3.8440E-01 | 6.4881E+02 | 4.0631E-02 | 1.8644E+01 | |
| p-value | 7.8400E-02 | 1.9548E-01 | 2.1475E-02 | 2.1243E-02 | 1.3727E-01 | 2.2949E-02 | 3.5979E-03 | 7.6452E-04 | 2.9069E-02 | 1.0925E-02 | 2.0489E-02 | NaN | |
| h | 0 | 0 | 1 | 1 | 0 | 1 | 1 | 1 | 1 | 1 | 1 | NaN | |
| Rank | 1 | 9 | 5 | 12 | 11 | 4 | 7 | 10 | 3 | 8 | 6 | 2 | |
| F6 | Worst | 7.4586E-03 | 4.0782E+01 | 2.8398E+00 | 4.1424E+03 | 2.1428E+03 | 4.6882E+00 | 1.5872E+00 | 3.2536E+02 | 5.2899E-01 | 4.0330E+01 | 8.8853E+00 | 5.0952E-02 |
| Average | 2.0732E-03 | 2.4752E+01 | 2.5240E+00 | 1.7732E+03 | 1.5093E+03 | 3.5812E+00 | 7.6906E-01 | 2.1992E+02 | 4.3057E-01 | 2.8780E+01 | 8.5206E+00 | 2.1823E-02 | |
| Best | 8.0662E-05 | 1.5665E+01 | 2.1190E+00 | 3.7947E+02 | 6.3968E+02 | 2.6152E+00 | 1.8089E-01 | 1.0497E+02 | 2.6481E-01 | 1.2823E+01 | 8.1968E+00 | 8.4905E-04 | |
| STD | 3.5956E-03 | 1.1063E+01 | 3.2233E-01 | 1.7914E+03 | 6.3437E+02 | 9.3390E-01 | 6.0022E-01 | 9.0506E+01 | 1.2080E-01 | 1.2291E+01 | 3.2283E-01 | 2.4930E-02 | |
| p-value | 1.6789E-01 | 4.2335E-03 | 4.5982E-06 | 9.5071E-02 | 3.1321E-03 | 2.6630E-04 | 4.7309E-02 | 2.8246E-03 | 5.6882E-04 | 3.3981E-03 | 3.2074E-09 | NaN | |
| h | 0 | 1 | 1 | 0 | 1 | 1 | 1 | 1 | 1 | 1 | 1 | NaN | |
| Rank | 1 | 8 | 5 | 12 | 11 | 6 | 4 | 10 | 3 | 9 | 7 | 2 | |
| F7 | Worst | 8.2152E-04 | 7.8054E-01 | 6.5132E-03 | 2.8601E+00 | 3.8227E-01 | 8.1132E-03 | 1.2213E+01 | 1.9458E+00 | 3.5460E-03 | 1.3288E+00 | 4.7987E-03 | 1.1384E-04 |
| Average | 5.5749E-04 | 6.9759E-01 | 3.3080E-03 | 2.6546E+00 | 2.5167E-01 | 4.0133E-03 | 7.1154E+00 | 1.3356E+00 | 2.4778E-03 | 9.4944E-01 | 1.8265E-03 | 7.3664E-05 | |
| Best | 2.2004E-04 | 5.5688E-01 | 1.2007E-03 | 2.4594E+00 | 1.3103E-01 | 1.6145E-03 | 1.7505E+00 | 7.0578E-01 | 1.4960E-03 | 6.5989E-01 | 4.8190E-04 | 2.4998E-05 | |
| STD | 2.9741E-04 | 9.7832E-02 | 2.5103E-03 | 1.7191E-01 | 1.1463E-01 | 2.9558E-03 | 4.4619E+00 | 5.0639E-01 | 8.4777E-04 | 3.2501E-01 | 1.9976E-03 | 4.0096E-05 | |
| p-value | 2.5556E-01 | 7.5583E-06 | 3.9132E-01 | 7.6873E-08 | 4.7787E-03 | 2.6615E-01 | 1.8871E-02 | 1.8873E-03 | 5.7030E-01 | 1.1198E-03 | 1.2985E-01 | NaN | |
| h | 0 | 1 | 0 | 1 | 1 | 0 | 1 | 1 | 0 | 1 | 0 | NaN | |
| Rank | 2 | 8 | 5 | 11 | 7 | 6 | 12 | 10 | 4 | 9 | 3 | 1 | |
| F8 | Worst | −5.4374E+03 | −1.1297E+04 | −3.1741E+03 | −4.5531E+03 | −6.7763E+03 | −6.5491E+03 | −4.5026E+03 | −9.0295E+03 | −1.3621E+04 | −1.0546E+04 | −4.6339E+03 | −1.3186E+04 |
| Average | −5.8281E+03 | −1.2227E+04 | −6.8610E+03 | −4.9929E+03 | −7.9585E+03 | −8.9655E+03 | −5.4962E+03 | −9.0590E+03 | −1.4362E+04 | −1.2700E+04 | −5.6555E+03 | −1.7042E+04 | |
| Best | −6.0837E+03 | −1.3238E+04 | −1.0029E+04 | −5.2303E+03 | −9.1043E+03 | −1.0478E+04 | −6.0557E+03 | −9.1475E+03 | −1.5873E+04 | −1.4023E+04 | −6.5546E+03 | −2.0457E+04 | |
| STD | 2.9576E+02 | 9.1368E+02 | 3.1291E+03 | 3.1477E+02 | 9.5197E+02 | 1.7889E+03 | 7.2763E+02 | 5.9039E+01 | 1.0288E+03 | 1.5246E+03 | 7.9497E+02 | 3.7487E+03 | |
| p-value | 5.3540E-01 | 1.6567E-02 | 5.8778E-03 | 2.7973E-01 | 5.2715E-01 | 2.8720E-01 | 4.2813E-01 | 2.0974E-01 | 3.8734E-03 | 1.5321E-02 | 4.8344E-01 | NaN | |
| h | 0 | 1 | 1 | 0 | 0 | 0 | 0 | 0 | 1 | 1 | 0 | NaN | |
| Rank | 9 | 4 | 8 | 12 | 7 | 6 | 11 | 5 | 2 | 3 | 10 | 1 | |
| F9 | Worst | 0.0000E+00 | 1.7042E+02 | 0.0000E+00 | 2.4160E+02 | 3.2010E+02 | 1.0984E+01 | 2.4610E+02 | 1.6151E+02 | 0.0000E+00 | 1.6151E+02 | 0.0000E+00 | 0.0000E+00 |
| Average | 0.0000E+00 | 1.3938E+02 | 0.0000E+00 | 1.5839E+02 | 2.4885E+02 | 4.4390E+00 | 1.8299E+02 | 1.4673E+02 | 0.0000E+00 | 1.2378E+02 | 0.0000E+00 | 0.0000E+00 | |
| Best | 0.0000E+00 | 1.1625E+02 | 0.0000E+00 | 7.4822E+01 | 1.2753E+02 | 1.3074E-12 | 1.4064E+02 | 1.2878E+02 | 0.0000E+00 | 9.6050E+01 | 0.0000E+00 | 0.0000E+00 | |
| STD | 0.0000E+00 | 2.2879E+01 | 0.0000E+00 | 6.9738E+01 | 8.5115E+01 | 5.4063E+00 | 4.6890E+01 | 1.4200E+01 | 0.0000E+00 | 2.7639E+01 | 0.0000E+00 | 0.0000E+00 | |
| p-value | NaN | 1.8591E-05 | NaN | 3.9229E-03 | 1.1037E-03 | 1.5167E-01 | 2.3326E-04 | 8.3516E-07 | NaN | 1.0816E-04 | NaN | NaN | |
| h | NaN | 1 | NaN | 1 | 1 | 0 | 1 | 1 | NaN | 1 | NaN | NaN | |
| Rank | 1 | 8 | 1 | 10 | 12 | 6 | 11 | 9 | 1 | 7 | 1 | 1 | |
| F10 | Worst | 8.8818E-16 | 7.2668E+00 | 7.9936E-15 | 2.0531E+01 | 8.9559E+00 | 4.3052E-09 | 2.2928E+00 | 1.5690E+01 | 3.2863E-14 | 1.8274E+01 | 8.9706E-14 | 8.8818E-16 |
| Average | 8.8818E-16 | 6.3388E+00 | 2.6645E-15 | 2.0518E+01 | 7.2218E+00 | 1.7663E-09 | 1.9853E+00 | 1.3964E+01 | 2.9310E-14 | 1.3315E+01 | 3.0198E-14 | 8.8818E-16 | |
| Best | 8.8818E-16 | 5.0825E+00 | 8.8818E-16 | 2.0502E+01 | 2.5486E+00 | 6.3157E-10 | 1.5281E+00 | 1.2007E+01 | 2.2204E-14 | 7.0599E+00 | 8.8818E-16 | 8.8818E-16 | |
| STD | 0.0000E+00 | 1.0504E+00 | 3.5527E-15 | 1.3307E-02 | 3.1222E+00 | 1.7071E-09 | 3.5009E-01 | 1.5522E+00 | 5.0243E-15 | 5.5342E+00 | 4.1873E-14 | 0.0000E+00 | |
| p-value | NaN | 1.9647E-05 | 3.5592E-01 | 7.8486E-20 | 3.5922E-03 | 8.3967E-02 | 2.8134E-05 | 1.8957E-06 | 2.8538E-05 | 2.9642E-03 | 2.1106E-01 | NaN | |
| h | NaN | 1 | 0 | 1 | 1 | 0 | 1 | 1 | 1 | 1 | 0 | NaN | |
| Rank | 1 | 8 | 3 | 12 | 9 | 6 | 7 | 11 | 4 | 10 | 5 | 1 | |
| F11 | Worst | 0.0000E+00 | 1.4645E+00 | 0.0000E+00 | 2.0234E+01 | 3.6048E+01 | 2.5535E-15 | 3.9694E-02 | 1.2654E+01 | 1.9767E-02 | 3.9317E+00 | 1.9048E+02 | 0.0000E+00 |
| Average | 0.0000E+00 | 1.3439E+00 | 0.0000E+00 | 9.2396E+00 | 2.3041E+01 | 1.7764E-15 | 3.2452E-02 | 4.8686E+00 | 4.9418E-03 | 3.2721E+00 | 1.4421E+02 | 0.0000E+00 | |
| Best | 0.0000E+00 | 1.2505E+00 | 0.0000E+00 | 1.0859E+00 | 1.4278E+01 | 8.8818E-16 | 1.9305E-02 | 1.4139E+00 | 0.0000E+00 | 2.4109E+00 | 6.4878E+01 | 0.0000E+00 | |
| STD | 0.0000E+00 | 8.8867E-02 | 0.0000E+00 | 7.9891E+00 | 9.2263E+00 | 8.4552E-16 | 9.0096E-03 | 5.2453E+00 | 9.8836E-03 | 7.4831E-01 | 5.5403E+01 | 0.0000E+00 | |
| p-value | NaN | 8.6692E-08 | NaN | 6.0017E-02 | 2.4653E-03 | 5.6744E-03 | 3.6224E-04 | 1.1279E-01 | 3.5592E-01 | 1.2373E-04 | 2.0035E-03 | NaN | |
| h | NaN | 1 | NaN | 0 | 1 | 1 | 1 | 0 | 0 | 1 | 1 | NaN | |
| Rank | 1 | 7 | 1 | 10 | 11 | 4 | 6 | 9 | 5 | 8 | 12 | 1 | |
| F12 | Worst | 1.9117E-05 | 2.5588E+01 | 1.4664E-01 | 4.0491E+07 | 6.6827E+02 | 2.8083E-01 | 3.5885E-01 | 3.4507E+01 | 1.1554E-02 | 1.7816E+01 | 9.6573E-01 | 8.0067E-03 |
| Average | 8.4702E-06 | 2.2619E+01 | 8.4062E-02 | 2.0830E+07 | 1.8766E+02 | 1.9121E-01 | 1.6972E-01 | 2.9519E+01 | 7.4900E-03 | 1.1387E+01 | 9.2738E-01 | 3.8133E-03 | |
| Best | 3.1725E-07 | 1.9885E+01 | 4.8423E-02 | 1.6156E+06 | 8.4537E+00 | 1.1625E-01 | 8.8199E-02 | 2.4029E+01 | 3.5678E-03 | 4.9788E+00 | 9.0628E-01 | 2.6674E-04 | |
| STD | 8.4354E-06 | 2.9640E+00 | 4.3658E-02 | 1.5959E+07 | 3.2131E+02 | 7.4155E-02 | 1.2719E-01 | 4.2896E+00 | 4.1085E-03 | 6.5611E+00 | 2.6314E-02 | 3.4784E-03 | |
| p-value | 7.1305E-02 | 4.9996E-06 | 1.0521E-02 | 4.0099E-02 | 2.8709E-01 | 2.3369E-03 | 4.0232E-02 | 9.1566E-06 | 2.2093E-01 | 1.3305E-02 | 5.9237E-10 | NaN | |
| h | 0 | 1 | 1 | 1 | 0 | 1 | 1 | 1 | 0 | 1 | 1 | NaN | |
| Rank | 1 | 9 | 4 | 12 | 11 | 6 | 5 | 10 | 3 | 8 | 7 | 2 | |
| F13 | Worst | 4.0331E-05 | 1.0818E+02 | 2.0088E+00 | 1.6061E+08 | 3.3433E+05 | 2.7364E+00 | 1.5053E+00 | 4.8113E+02 | 2.0736E+00 | 8.8261E+01 | 5.0058E+00 | 1.1317E-01 |
| Average | 1.9831E-05 | 9.1281E+01 | 1.6522E+00 | 7.5789E+07 | 1.2868E+05 | 2.4842E+00 | 9.7940E-01 | 2.3566E+02 | 1.5259E+00 | 7.5221E+01 | 4.9380E+00 | 4.5541E-02 | |
| Best | 1.0784E-06 | 7.4225E+01 | 1.3225E+00 | 1.5273E+07 | 2.9743E+03 | 2.3287E+00 | 4.5078E-01 | 1.2480E+02 | 1.2655E+00 | 6.0365E+01 | 4.8917E+00 | 6.8088E-05 | |
| STD | 2.1054E-05 | 1.3883E+01 | 3.6834E-01 | 6.1269E+07 | 1.4529E+05 | 1.8175E-01 | 5.9857E-01 | 1.6546E+02 | 3.7101E-01 | 1.4243E+01 | 5.0444E-02 | 5.1091E-02 | |
| p-value | 1.2504E-01 | 1.1971E-05 | 1.3233E-04 | 4.8197E-02 | 1.2689E-01 | 2.2178E-07 | 2.0875E-02 | 2.9258E-02 | 2.1731E-04 | 4.2502E-05 | 1.0526E-11 | NaN | |
| h | 0 | 1 | 1 | 1 | 0 | 1 | 1 | 1 | 1 | 1 | 1 | NaN | |
| Rank | 1 | 9 | 5 | 12 | 11 | 6 | 3 | 10 | 4 | 8 | 7 | 2 | |
| Mean ranking | 1.9231E+00 | 8.0000E+00 | 5.0769E+00 | 1.1000E+01 | 1.0077E+01 | 5.3846E+00 | 7.2308E+00 | 9.5385E+00 | 3.3846E+00 | 8.0000E+00 | 5.9231E+00 | 1.3846E+00 | |
| Final ranking | 2 | 8 | 4 | 12 | 11 | 5 | 7 | 10 | 3 | 8 | 6 | 1 | |
| Fun | Measure | Comparative Algorithms | |||||||||||
|---|---|---|---|---|---|---|---|---|---|---|---|---|---|
| AO | DMOA | WOA | SCA | DA | GWO | PSO | ALO | RSA | ROA | AOA | HRSA | ||
| F14 | Worst | 1.2671E+01 | 9.9800E-01 | 1.0763E+01 | 2.9821E+00 | 1.9920E+00 | 1.2671E+01 | 8.8408E+00 | 6.9033E+00 | 9.9800E-01 | 1.2671E+01 | 1.2671E+01 | 9.9800E-01 |
| Average | 4.9092E+00 | 9.9800E-01 | 4.6720E+00 | 1.5058E+00 | 1.2465E+00 | 4.6607E+00 | 6.3958E+00 | 3.4654E+00 | 9.9800E-01 | 1.0248E+01 | 1.0010E+01 | 9.9800E-01 | |
| Best | 1.9920E+00 | 9.9800E-01 | 9.9800E-01 | 9.9846E-01 | 9.9800E-01 | 9.9800E-01 | 9.9800E-01 | 9.9800E-01 | 9.9800E-01 | 2.9821E+00 | 2.9821E+00 | 9.9800E-01 | |
| STD | 5.1952E+00 | 1.2820E-16 | 4.6790E+00 | 9.8443E-01 | 4.9701E-01 | 5.4010E+00 | 3.7126E+00 | 2.6033E+00 | 2.2204E-16 | 4.8442E+00 | 4.7070E+00 | 1.2820E-16 | |
| p-value | 1.8345E-01 | 8.7691E-03 | 1.4881E-01 | 1.2260E-02 | 1.0122E-02 | 1.7440E-01 | 2.5362E-01 | 4.8667E-02 | 8.7691E-03 | 8.7691E-03 | 9.4612E-01 | NaN | |
| h | 0 | 1 | 0 | 1 | 1 | 0 | 0 | 1 | 1 | 1 | 0 | NaN | |
| Rank | 9 | 3 | 8 | 5 | 4 | 7 | 10 | 6 | 2 | 12 | 11 | 1 | |
| F15 | Worst | 1.6162E-03 | 2.0364E-02 | 8.5450E-04 | 1.5480E-03 | 2.0363E-02 | 2.0363E-02 | 1.0751E-03 | 1.5316E-03 | 1.6133E-03 | 1.2232E-03 | 4.8245E-02 | 5.4450E-04 |
| Average | 1.1160E-03 | 5.6279E-03 | 5.3753E-04 | 1.1086E-03 | 6.6307E-03 | 5.4880E-03 | 9.4454E-04 | 1.1987E-03 | 7.1362E-04 | 1.0923E-03 | 2.4085E-02 | 4.1911E-04 | |
| Best | 6.9512E-04 | 5.3740E-04 | 3.1440E-04 | 5.5412E-04 | 1.6554E-03 | 3.2074E-04 | 7.2990E-04 | 7.6864E-04 | 3.2839E-04 | 6.9969E-04 | 4.8440E-04 | 3.2524E-04 | |
| STD | 3.8035E-04 | 9.8253E-03 | 2.5721E-04 | 4.9369E-04 | 9.1594E-03 | 9.9180E-03 | 1.4908E-04 | 3.1653E-04 | 6.0669E-04 | 2.6174E-04 | 2.1027E-02 | 9.1516E-05 | |
| p-value | 1.1888E-02 | 3.9415E-01 | 4.5309E-02 | 9.8187E-01 | 2.7425E-01 | 4.1222E-01 | 4.3345E-01 | 7.4953E-01 | 3.0403E-01 | 9.2164E-01 | 7.1625E-02 | NaN | |
| h | 1 | 0 | 1 | 0 | 0 | 0 | 0 | 0 | 0 | 0 | 0 | NaN | |
| Rank | 7 | 10 | 2 | 6 | 11 | 9 | 4 | 8 | 3 | 5 | 12 | 1 | |
| F16 | Worst | −1.0306E+00 | −1.0316E+00 | −1.0316E+00 | −1.0314E+00 | −1.0316E+00 | −1.0316E+00 | −1.0167E+00 | −1.0316E+00 | −1.0316E+00 | −1.0316E+00 | −1.0316E+00 | −1.0316E+00 |
| Average | −1.0313E+00 | −1.0316E+00 | −1.0316E+00 | −1.0315E+00 | −1.0316E+00 | −1.0316E+00 | −1.0231E+00 | −1.0316E+00 | −1.0316E+00 | −1.0316E+00 | −1.0316E+00 | −1.0316E+00 | |
| Best | −1.0316E+00 | −1.0316E+00 | −1.0316E+00 | −1.0316E+00 | −1.0316E+00 | −1.0316E+00 | −1.0301E+00 | −1.0316E+00 | −1.0316E+00 | −1.0316E+00 | −1.0316E+00 | −1.0316E+00 | |
| STD | 4.4362E-04 | 7.4564E-15 | 9.7513E-09 | 9.0048E-05 | 1.5128E-05 | 4.4567E-08 | 6.6134E-03 | 1.8769E-13 | 1.2820E-16 | 0.0000E+00 | 1.5246E-07 | 1.2820E-16 | |
| p-value | 4.8620E-02 | 4.2224E-02 | 4.2224E-02 | 4.4387E-02 | 4.2563E-02 | 4.2225E-02 | 4.2224E-02 | 4.2224E-02 | 4.2224E-02 | 4.2224E-02 | 4.2230E-02 | NaN | |
| h | 1 | 1 | 1 | 1 | 1 | 1 | 1 | 1 | 1 | 1 | 1 | NaN | |
| Rank | 11 | 4 | 6 | 10 | 9 | 7 | 12 | 5 | 3 | 1 | 8 | 1 | |
| F17 | Worst | 3.9953E-01 | 3.9789E-01 | 3.9791E-01 | 4.0439E-01 | 3.9789E-01 | 3.9789E-01 | 3.9789E-01 | 3.9789E-01 | 3.9789E-01 | 3.9789E-01 | 1.0787E+00 | 3.9789E-01 |
| Average | 3.9852E-01 | 3.9789E-01 | 3.9790E-01 | 4.0041E-01 | 3.9789E-01 | 3.9789E-01 | 3.9789E-01 | 3.9789E-01 | 3.9789E-01 | 3.9789E-01 | 6.0895E-01 | 3.9789E-01 | |
| Best | 3.9792E-01 | 3.9789E-01 | 3.9789E-01 | 3.9796E-01 | 3.9789E-01 | 3.9789E-01 | 3.9789E-01 | 3.9789E-01 | 3.9789E-01 | 3.9789E-01 | 4.3913E-01 | 3.9789E-01 | |
| STD | 7.2792E-04 | 5.0805E-14 | 1.0205E-05 | 2.7695E-03 | 2.6877E-08 | 9.9580E-07 | 0.0000E+00 | 4.3341E-13 | 0.0000E+00 | 1.7764E-15 | 3.1333E-01 | 0.0000E+00 | |
| p-value | 3.2798E-01 | 2.2294E-01 | 2.2422E-01 | 8.4769E-01 | 2.2294E-01 | 2.2324E-01 | 2.2294E-01 | 2.2294E-01 | 2.2294E-01 | 2.2294E-01 | 2.3258E-01 | NaN | |
| h | 0 | 0 | 0 | 0 | 0 | 0 | 0 | 0 | 0 | 0 | 0 | NaN | |
| Rank | 10 | 5 | 9 | 11 | 7 | 8 | 1 | 6 | 1 | 4 | 12 | 1 | |
| F18 | Worst | 3.0717E+00 | 3.0000E+00 | 3.0022E+00 | 3.0003E+00 | 3.0000E+00 | 8.4000E+01 | 3.0000E+00 | 3.0000E+00 | 3.0089E+01 | 3.0000E+00 | 9.3087E+01 | 3.0000E+00 |
| Average | 3.0363E+00 | 3.0000E+00 | 3.0007E+00 | 3.0001E+00 | 3.0000E+00 | 2.3250E+01 | 3.0000E+00 | 3.0000E+00 | 1.0151E+01 | 3.0000E+00 | 4.8067E+01 | 3.0000E+00 | |
| Best | 3.0066E+00 | 3.0000E+00 | 3.0001E+00 | 3.0000E+00 | 3.0000E+00 | 3.0000E+00 | 3.0000E+00 | 3.0000E+00 | 3.1441E+00 | 3.0000E+00 | 3.0000E+00 | 3.0000E+00 | |
| STD | 3.3175E-02 | 3.5171E-13 | 9.9674E-04 | 1.3095E-04 | 1.5141E-10 | 4.0500E+01 | 2.8320E-15 | 5.9994E-13 | 1.3294E+01 | 5.1279E-16 | 5.1876E+01 | 1.7578E-15 | |
| p-value | 3.2559E-01 | 3.2333E-01 | 3.2338E-01 | 3.2334E-01 | 3.2333E-01 | 5.6139E-01 | 3.2333E-01 | 3.2333E-01 | 3.2333E-01 | 3.2333E-01 | 2.0653E-01 | NaN | |
| h | 0 | 0 | 0 | 0 | 0 | 0 | 0 | 0 | 0 | 0 | 0 | NaN | |
| Rank | 9 | 4 | 8 | 7 | 6 | 11 | 2 | 5 | 10 | 1 | 12 | 3 | |
| F19 | Worst | −3.85522E+00 | −3.85628E+00 | −3.7519E+00 | −3.85491E+00 | −3.85626E+00 | −3.85556E+00 | −3.85628E+00 | −3.85628E+00 | −3.85628E+00 | −3.3798E+00 | −3.85415E+00 | −3.85628E+00 |
| Average | −3.85578E+00 | −3.85628E+00 | −3.85251E+00 | −3.85520E+00 | −3.85627E+00 | −3.85589E+00 | −3.85628E+00 | −3.85628E+00 | −3.85628E+00 | −3.5949E+00 | −3.85450E+00 | −3.85628E+00 | |
| Best | −3.85627E+00 | −3.85628E+00 | −3.85555E+00 | −3.85547E+00 | −3.85628E+00 | −3.85627E+00 | −3.85628E+00 | −3.85628E+00 | −3.85628E+00 | −3.7898E+00 | −3.85523E+00 | −3.85628E+00 | |
| STD | 4.3471E-03 | 1.2362E-09 | 4.9029E-02 | 2.8013E-03 | 7.9323E-05 | 3.6209E-03 | 0.0000E+00 | 5.3811E-13 | 3.6260E-16 | 1.8733E-01 | 4.9600E-03 | 0.0000E+00 | |
| p-value | 3.0902E-02 | 2.8796E-02 | 5.4899E-02 | 3.3516E-02 | 2.8824E-02 | 3.0430E-02 | 2.8796E-02 | 2.8796E-02 | 2.8796E-02 | 2.8796E-02 | 3.7043E-02 | NaN | |
| h | 1 | 1 | 0 | 1 | 1 | 1 | 1 | 1 | 1 | 1 | 1 | NaN | |
| Rank | 8 | 5 | 11 | 9 | 6 | 7 | 1 | 4 | 1 | 12 | 10 | 1 | |
| F20 | Worst | −2.9938E+00 | −3.1768E+00 | −2.3872E+00 | −1.6547E+00 | −3.1527E+00 | −3.0868E+00 | −3.2031E+00 | −3.2013E+00 | −3.2031E+00 | −3.2031E+00 | −2.7968E+00 | −3.1517E+00 |
| Average | −3.0975E+00 | −3.1830E+00 | −2.6300E+00 | −2.4959E+00 | −3.2132E+00 | −3.2632E+00 | −3.2625E+00 | −3.2617E+00 | −3.2625E+00 | −3.2923E+00 | −2.9562E+00 | −3.2723E+00 | |
| Best | −3.1846E+00 | −3.1954E+00 | −2.7676E+00 | −3.1119E+00 | −3.3191E+00 | −3.3220E+00 | −3.3220E+00 | −3.3220E+00 | −3.3220E+00 | −3.3220E+00 | −3.0427E+00 | −3.3179E+00 | |
| STD | 9.9666E-02 | 8.5867E-03 | 1.7319E-01 | 6.8763E-01 | 7.3171E-02 | 1.1761E-01 | 6.8643E-02 | 6.9618E-02 | 6.8643E-02 | 5.9446E-02 | 1.0898E-01 | 8.0742E-02 | |
| p-value | 3.4017E-03 | 6.9842E-04 | 5.2693E-04 | 7.1830E-01 | 8.0921E-04 | 9.2451E-04 | 4.9920E-04 | 5.0808E-04 | 4.9920E-04 | 3.5429E-04 | 1.8894E-02 | NaN | |
| h | 1 | 1 | 1 | 0 | 1 | 1 | 1 | 1 | 1 | 1 | 1 | NaN | |
| Rank | 9 | 8 | 11 | 12 | 7 | 3 | 4 | 6 | 5 | 1 | 10 | 2 | |
| F21 | Worst | −1.0044E+01 | −2.6829E+00 | −5.0520E+00 | −8.7837E-01 | −2.6304E+00 | −4.9130E+00 | −2.6829E+00 | −5.0552E+00 | −2.6305E+00 | −2.6829E+00 | −1.5765E+00 | −1.0149E+01 |
| Average | −1.0120E+01 | −6.4180E+00 | −6.3064E+00 | −2.7683E+00 | −4.4716E+00 | −6.2894E+00 | −5.1435E+00 | −7.6156E+00 | −8.2722E+00 | −6.4180E+00 | −2.9887E+00 | −1.0151E+01 | |
| Best | −1.0149E+01 | −1.0153E+01 | −1.0065E+01 | −4.8735E+00 | −5.1008E+00 | −1.0143E+01 | −1.0153E+01 | −1.0153E+01 | −1.0153E+01 | −1.0153E+01 | −4.5023E+00 | −1.0152E+01 | |
| STD | 5.1114E-02 | 4.3130E+00 | 2.5056E+00 | 2.1882E+00 | 1.2277E+00 | 2.5702E+00 | 3.5220E+00 | 2.9302E+00 | 3.7612E+00 | 4.3130E+00 | 1.2935E+00 | 1.4880E-03 | |
| p-value | 2.4617E-02 | 9.6079E-01 | 9.9274E-01 | 8.2021E-02 | 2.4900E-01 | 2.3863E-02 | 6.1801E-01 | 5.2156E-01 | 4.1747E-01 | 9.6079E-01 | 6.1581E-02 | NaN | |
| h | 1 | 0 | 0 | 0 | 0 | 1 | 0 | 0 | 0 | 0 | 0 | NaN | |
| Rank | 2 | 6 | 7 | 12 | 10 | 8 | 9 | 4 | 3 | 5 | 11 | 1 | |
| F22 | Worst | −5.0378E+00 | −2.7519E+00 | −4.9987E+00 | −5.2107E-01 | −1.0188E+01 | −1.0400E+01 | −3.7243E+00 | −2.7519E+00 | −2.7659E+00 | −2.7659E+00 | −1.2534E+00 | −1.0375E+01 |
| Average | −6.9590E+00 | −6.5774E+00 | −5.0645E+00 | −1.4625E+00 | −1.0307E+01 | −1.0401E+01 | −6.0962E+00 | −5.8531E+00 | −8.4937E+00 | −6.8240E+00 | −2.5652E+00 | −1.0391E+01 | |
| Best | −1.0056E+01 | −1.0403E+01 | −5.0875E+00 | −3.5117E+00 | −1.0398E+01 | −1.0402E+01 | −1.0403E+01 | −1.0403E+01 | −1.0403E+01 | −1.0403E+01 | −4.5544E+00 | −1.0401E+01 | |
| STD | 2.4015E+00 | 4.4173E+00 | 4.3892E-02 | 1.3783E+00 | 9.4078E-02 | 9.5577E-04 | 2.9465E+00 | 3.2335E+00 | 3.8185E+00 | 4.1511E+00 | 1.4088E+00 | 1.1408E-02 | |
| p-value | 2.8864E-02 | 8.8433E-01 | 1.6576E-01 | 7.3654E-03 | 3.1727E-02 | 2.8553E-02 | 6.6582E-01 | 6.0274E-01 | 5.2161E-01 | 9.5693E-01 | 1.9658E-02 | NaN | |
| h | 1 | 0 | 0 | 1 | 1 | 1 | 0 | 0 | 0 | 0 | 1 | NaN | |
| Rank | 5 | 7 | 10 | 12 | 3 | 1 | 8 | 9 | 4 | 6 | 11 | 2 | |
| F23 | Worst | −1.0512E+01 | −4.8806E+00 | −1.8585E+00 | −9.4646E-01 | −2.4217E+00 | −2.4217E+00 | −2.8711E+00 | −2.8066E+00 | −2.4217E+00 | −3.85354E+00 | −1.2013E+00 | −1.0536E+01 |
| Average | −1.0523E+01 | −6.9426E+00 | −4.9871E+00 | −3.2865E+00 | −4.7987E+00 | −8.5059E+00 | −8.6201E+00 | −8.6040E+00 | −8.5077E+00 | −7.1859E+00 | −4.2224E+00 | −1.0536E+01 | |
| Best | −1.0535E+01 | −9.3471E+00 | −1.0536E+01 | −4.6174E+00 | −1.0528E+01 | −1.0535E+01 | −1.0536E+01 | −1.0536E+01 | −1.0536E+01 | −1.0536E+01 | −7.3080E+00 | −1.0536E+01 | |
| STD | 1.0420E-02 | 2.2857E+00 | 3.9644E+00 | 1.6939E+00 | 3.8764E+00 | 4.0562E+00 | 3.8326E+00 | 3.8649E+00 | 4.0573E+00 | 3.8688E+00 | 2.5257E+00 | 4.0454E-11 | |
| p-value | 2.0261E-02 | 1.9951E-02 | 4.2554E-01 | 4.2320E-02 | 3.7748E-01 | 5.2688E-01 | 4.8060E-01 | 4.8724E-01 | 5.2649E-01 | 9.1729E-01 | 1.6135E-01 | NaN | |
| h | 1 | 1 | 0 | 1 | 0 | 0 | 0 | 0 | 0 | 0 | 0 | NaN | |
| Rank | 2 | 8 | 9 | 12 | 10 | 6 | 3 | 4 | 5 | 7 | 11 | 1 | |
| Mean ranking | 7.2000E+00 | 6.0000E+00 | 8.1000E+00 | 9.6000E+00 | 7.3000E+00 | 6.7000E+00 | 5.4000E+00 | 5.7000E+00 | 3.7000E+00 | 5.4000E+00 | 1.0800E+01 | 1.4000E+00 | |
| Final ranking | 8 | 6 | 10 | 11 | 9 | 7 | 3 | 5 | 2 | 3 | 12 | 1 | |
| Dataset | Features No. | Instances No. | Classes No. |
|---|---|---|---|
| Cancer | 9 | 683 | 2 |
| CMC | 10 | 1473 | 3 |
| Glass | 9 | 214 | 7 |
| Iris | 4 | 150 | 3 |
| Seeds | 7 | 210 | 3 |
| Heart | 13 | 270 | 2 |
| Vowels | 6 | 871 | 3 |
| Water | 13 | 178 | 3 |
| Dataset | Metric | Comparative Algorithms | ||||||||
|---|---|---|---|---|---|---|---|---|---|---|
| AO | PSO | GWO | AVOA | WOA | RSA | ROA | AOA | HRSA | ||
| Cancer | Worst | 2.9098E+03 | 1.6727E+03 | 2.9680E+03 | 3.4670E+03 | 3.5238E+03 | 3.5050E+03 | 3.5050E+03 | 3.5050E+03 | 7.1703E+02 |
| Average | 2.7388E+03 | 1.2148E+03 | 2.6393E+03 | 3.3097E+03 | 3.4419E+03 | 3.2415E+03 | 3.2415E+03 | 3.2415E+03 | 4.9848E+02 | |
| Best | 2.6050E+03 | 6.7650E+02 | 2.3894E+03 | 3.0439E+03 | 3.3555E+03 | 2.7880E+03 | 2.7880E+03 | 2.7880E+03 | 2.5294E+02 | |
| STD | 1.2285E+02 | 4.1186E+02 | 2.7025E+02 | 2.1505E+02 | 7.5799E+01 | 3.0883E+02 | 3.0883E+02 | 3.0883E+02 | 1.9627E+02 | |
| p-value | 9.6175E-03 | 2.1793E-05 | 1.1166E-02 | 6.9577E-01 | 1.9649E-01 | 1.0000E+00 | 1.6244E-07 | 1.0000E+00 | NaN | |
| h | 1 | 1 | 1 | 0 | 0 | 0 | 1 | 0 | NaN | |
| Rank | 4 | 2 | 3 | 8 | 9 | 5 | 5 | 5 | 1 | |
| CMC | Worst | 3.3274E+02 | 1.0104E+02 | 3.1034E+02 | 3.3504E+02 | 3.3443E+02 | 3.3470E+02 | 3.3470E+02 | 3.3470E+02 | 8.1049E+01 |
| Average | 3.2908E+02 | 8.4904E+01 | 3.0460E+02 | 3.3428E+02 | 3.3407E+02 | 3.3332E+02 | 3.3332E+02 | 3.3332E+02 | 6.7316E+01 | |
| Best | 3.2649E+02 | 6.0653E+01 | 3.0189E+02 | 3.3292E+02 | 3.3340E+02 | 3.3199E+02 | 3.3199E+02 | 3.3199E+02 | 5.0947E+01 | |
| STD | 2.3268E+00 | 1.4951E+01 | 3.2968E+00 | 8.1148E-01 | 4.6832E-01 | 1.1409E+00 | 1.1409E+00 | 1.1409E+00 | 1.3054E+01 | |
| p-value | 6.3870E-03 | 3.0919E-10 | 7.7964E-08 | 1.6589E-01 | 2.1389E-01 | 1.0000E+00 | 6.1264E-11 | 1.0000E+00 | NaN | |
| h | 1 | 1 | 1 | 0 | 0 | 0 | 1 | 0 | NaN | |
| Rank | 4 | 2 | 3 | 9 | 8 | 5 | 5 | 5 | 1 | |
| Glass | Worst | 3.1433E+01 | 1.6129E+01 | 2.9980E+01 | 3.5149E+01 | 3.4978E+01 | 3.5062E+01 | 4.3268E+00 | 3.5062E+01 | 3.5062E+01 |
| Average | 3.0876E+01 | 1.2067E+01 | 2.9199E+01 | 3.4583E+01 | 3.3710E+01 | 3.4938E+01 | 1.3341E+00 | 3.4938E+01 | 3.4938E+01 | |
| Best | 3.0338E+01 | 9.9866E+00 | 2.7810E+01 | 3.4088E+01 | 3.2553E+01 | 3.4822E+01 | 0.0000E+00 | 3.4822E+01 | 3.4822E+01 | |
| STD | 5.0092E-01 | 2.3606E+00 | 8.8269E-01 | 4.4374E-01 | 9.5919E-01 | 1.1264E-01 | 1.7931E+00 | 1.1264E-01 | 1.1264E-01 | |
| p-value | 1.0662E-07 | 2.1913E-08 | 5.2248E-07 | 1.2103E-01 | 2.1695E-02 | 1.0000E+00 | 1.1771E-10 | 1.0000E+00 | 1.0000E+00 | |
| h | 1 | 1 | 1 | 0 | 1 | 0 | 1 | 0 | NaN | |
| Rank | 4 | 2 | 3 | 6 | 5 | 7 | 1 | 7 | NaN | |
| Iris | Worst | 2.1833E+01 | 6.5278E+00 | 2.1616E+01 | 2.4896E+01 | 2.4487E+01 | 2.4388E+01 | 2.4388E+01 | 2.4388E+01 | 5.5340E+00 |
| Average | 2.0176E+01 | 5.5161E+00 | 1.6522E+01 | 2.4451E+01 | 2.3746E+01 | 2.3636E+01 | 2.3636E+01 | 2.3636E+01 | 2.8836E+00 | |
| Best | 1.8980E+01 | 4.1415E+00 | 1.3271E+01 | 2.4156E+01 | 2.3303E+01 | 2.3056E+01 | 2.3056E+01 | 2.3056E+01 | 1.5958E+00 | |
| STD | 1.1616E+00 | 9.9876E-01 | 3.0780E+00 | 2.9205E-01 | 5.3502E-01 | 6.2257E-01 | 6.2257E-01 | 6.2257E-01 | 1.7265E+00 | |
| p-value | 3.7448E-04 | 5.5402E-10 | 9.7090E-04 | 2.9211E-02 | 7.7219E-01 | 1.0000E+00 | 6.4135E-09 | 1.0000E+00 | NaN | |
| h | 1 | 1 | 1 | 1 | 0 | 0 | 1 | 0 | NaN | |
| Rank | 4 | 2 | 3 | 9 | 8 | 5 | 5 | 5 | 1 | |
| Seeds | Worst | 4.0905E+01 | 1.9643E+01 | 3.9253E+01 | 5.0452E+01 | 5.0731E+01 | 5.0011E+01 | 5.0011E+01 | 5.0011E+01 | 1.0401E+01 |
| Average | 3.9847E+01 | 1.3700E+01 | 3.7736E+01 | 4.9855E+01 | 4.9928E+01 | 4.8814E+01 | 4.8814E+01 | 4.8814E+01 | 8.5169E+00 | |
| Best | 3.8646E+01 | 5.7750E+00 | 3.6119E+01 | 4.9054E+01 | 4.7994E+01 | 4.7821E+01 | 4.7821E+01 | 4.7821E+01 | 6.6314E+00 | |
| STD | 8.7573E-01 | 5.2011E+00 | 1.1579E+00 | 5.2647E-01 | 1.1100E+00 | 9.0900E-01 | 9.0900E-01 | 9.0900E-01 | 1.3364E+00 | |
| p-value | 2.4678E-07 | 4.1207E-07 | 1.5759E-07 | 5.7550E-02 | 1.2069E-01 | 1.0000E+00 | 1.1892E-11 | 1.0000E+00 | NaN | |
| h | 1 | 1 | 1 | 0 | 0 | 0 | 1 | 0 | NaN | |
| Rank | 4 | 2 | 3 | 8 | 9 | 5 | 5 | 5 | 1 | |
| Statlog | Worst | 1.4705E+03 | 5.3201E+02 | 1.2471E+03 | 1.6629E+03 | 1.6207E+03 | 1.6982E+03 | 1.6982E+03 | 1.6982E+03 | 6.6389E+01 |
| (Heart) | Average | 1.4064E+03 | 2.5262E+02 | 1.0091E+03 | 1.5678E+03 | 1.5659E+03 | 1.6325E+03 | 1.6325E+03 | 1.6325E+03 | 2.7628E+01 |
| Best | 1.2522E+03 | 0.0000E+00 | 8.0036E+02 | 1.4391E+03 | 1.4899E+03 | 1.5087E+03 | 1.5087E+03 | 1.5087E+03 | 0.0000E+00 | |
| STD | 8.8824E+01 | 2.1268E+02 | 1.5920E+02 | 8.0923E+01 | 5.2544E+01 | 7.4898E+01 | 7.4898E+01 | 7.4898E+01 | 3.1474E+01 | |
| p-value | 2.4418E-03 | 7.8363E-07 | 4.6791E-05 | 2.2569E-01 | 1.4195E-01 | 1.0000E+00 | 7.6147E-11 | 1.0000E+00 | NaN | |
| h | 1 | 1 | 1 | 0 | 0 | 0 | 1 | 0 | NaN | |
| Rank | 4 | 2 | 3 | 6 | 5 | 7 | 7 | 7 | 1 | |
| Vowels | Worst | 1.3952E+02 | 1.5133E+01 | 1.3594E+02 | 1.5347E+02 | 1.5231E+02 | 1.5336E+02 | 1.5336E+02 | 1.5336E+02 | 1.8987E+01 |
| Average | 1.3832E+02 | 1.0040E+01 | 1.3417E+02 | 1.5304E+02 | 1.5175E+02 | 1.5287E+02 | 1.5287E+02 | 1.5287E+02 | 1.5031E+01 | |
| Best | 1.3666E+02 | 0.0000E+00 | 1.3111E+02 | 1.5275E+02 | 1.5121E+02 | 1.5235E+02 | 1.5235E+02 | 1.5235E+02 | 9.6841E+00 | |
| STD | 1.2751E+00 | 6.2258E+00 | 1.8819E+00 | 2.8123E-01 | 4.5754E-01 | 3.9920E-01 | 3.9920E-01 | 3.9920E-01 | 4.2281E+00 | |
| p-value | 8.6484E-09 | 2.3486E-11 | 2.1235E-08 | 4.4898E-01 | 3.4024E-03 | 1.0000E+00 | 1.4476E-12 | 1.0000E+00 | NaN | |
| h | 1 | 1 | 1 | 0 | 1 | 0 | 1 | 0 | NaN | |
| Rank | 4 | 1 | 3 | 9 | 5 | 6 | 6 | 6 | 2 | |
| Wine | Worst | 3.4751E+03 | 3.9940E+03 | 2.9327E+03 | 4.0307E+03 | 3.9606E+03 | 3.9940E+03 | 3.9940E+03 | 3.9940E+03 | 1.6141E+03 |
| Average | 3.2725E+03 | 3.9170E+03 | 2.5840E+03 | 3.9325E+03 | 3.8541E+03 | 3.9170E+03 | 3.9170E+03 | 3.9170E+03 | 1.2385E+03 | |
| Best | 3.1515E+03 | 3.8401E+03 | 2.3275E+03 | 3.7908E+03 | 3.7249E+03 | 3.8401E+03 | 3.8401E+03 | 3.8401E+03 | 8.8523E+02 | |
| STD | 1.3674E+02 | 6.0335E+01 | 2.3210E+02 | 9.2329E+01 | 1.0214E+02 | 6.0335E+01 | 6.0335E+01 | 6.0335E+01 | 2.9581E+02 | |
| p-value | 1.1140E-05 | 4.3418E-08 | 1.6402E-06 | 7.6057E-01 | 2.6979E-01 | 1.0000E+00 | 1.2556E-10 | 1.0000E+00 | NaN | |
| h | 1 | 1 | 1 | 0 | 0 | 0 | 1 | 0 | NaN | |
| Rank | 4 | 6 | 3 | 10 | 5 | 6 | 6 | 6 | 1 | |
| Mean ranking | 4.0000E+00 | 2.3750E+00 | 3.0000E+00 | 8.1250E+00 | 6.7500E+00 | 5.7500E+00 | 5.0000E+00 | 5.7500E+00 | 1.1429E+00 | |
| Final ranking | 4 | 2 | 3 | 9 | 8 | 6 | 5 | 6 | 1 | |
Publisher’s Note: MDPI stays neutral with regard to jurisdictional claims in published maps and institutional affiliations. |
© 2022 by the authors. Licensee MDPI, Basel, Switzerland. This article is an open access article distributed under the terms and conditions of the Creative Commons Attribution (CC BY) license (https://creativecommons.org/licenses/by/4.0/).
Share and Cite
Almotairi, K.H.; Abualigah, L. Hybrid Reptile Search Algorithm and Remora Optimization Algorithm for Optimization Tasks and Data Clustering. Symmetry 2022, 14, 458. https://doi.org/10.3390/sym14030458
Almotairi KH, Abualigah L. Hybrid Reptile Search Algorithm and Remora Optimization Algorithm for Optimization Tasks and Data Clustering. Symmetry. 2022; 14(3):458. https://doi.org/10.3390/sym14030458
Chicago/Turabian StyleAlmotairi, Khaled H., and Laith Abualigah. 2022. "Hybrid Reptile Search Algorithm and Remora Optimization Algorithm for Optimization Tasks and Data Clustering" Symmetry 14, no. 3: 458. https://doi.org/10.3390/sym14030458