1. Introduction
The spreading of a drop over a liquid layer is a fundamental problem of great importance in many natural and industrial problems, such as oil spills [
1], polymer processing [
2], shaping optical lenses [
3,
4], and lab-on-a-chip devices [
5]. The mechanics of a drop spreading on an immiscible liquid layer under buoyancy have been studied extensively (e.g., [
6,
7,
8]), as two immiscible fluids create a clear interface to be characterized.
Marangoni stress (i.e., stress induced by a gradient in surface tension) can be used to manipulate the spreading dynamics of drops [
9,
10,
11]. The physical picture of drop spreading is more intricate when mixing comes into play in miscible fluids [
12,
13,
14]. Marangoni spreading of a miscible drop has been studied both in the presence of surfactants [
15,
16] and with lower surface tension of the drop [
14,
17,
18,
19]. In the latter case, the outward Marangoni flow often causes fingering instabilities [
20,
21,
22]. Despite numerous previous studies, the dynamics of a drop on a miscible liquid layer is still poorly characterized due to the complexity of visualizations [
14]. A better understanding of this topic would benefit various applications in the areas of renewable energy [
23] and biomaterials [
24].
Although a number of studies have investigated the spreading of miscible drops under outward Marangoni flow, very few studies exist that focus on an inward Marangoni flow. Tan and Thoroddsen [
25] first reported that when a drop of water impacts a bath of glycerol, the drop forms flower-like fingering patterns. They showed that the combined effect of an inward Marangoni flow with the impact inertia leads to an intermediate circle drained from the water. Similarly, when a liquid drop of calcium chloride is deposited on a bath of sodium silicate with higher surface tension, fingering patterns emerge at the growing front, whereas a spiral channel forms in the center [
26].
In this study, we present a new instability caused by the interactions between buoyancy and Marangoni effects. We conducted a series of experiments, depositing a water drop on a millimetric layer of glycerol. Unlike [
25], we observed interfacial fingers pinching off at the growing front. In addition, we observed an outer shallow layer separated from a deeper inner drop from the top-down view. We also performed experiments with different volume fractions of a glycerol-water mixture to observe its effect on the instability. The paper is organized as follows. In
Section 2, we describe our experimental procedure, along with our observations. In
Section 3 we present the results from image processing of the data and scaling arguments justifying our observations. Finally, in
Section 4 our findings and potential future studies are discussed.
2. Experiments
We gently deposit a drop of deionized water with volume
V on a bath of glycerol-water solution that is 5 mm deep, as illustrated in
Figure 1a. To remove any effects of inertia, the drops are slowly deposited using a pipette on the glycerol-water surface. The volume fraction of glycerol in the glycerol-water solution is denoted by
. To make the glycerol-water mixture, we prepare a total volume of 200
for each trial. First, we collect the required volumes of water and pure glycerol in two different containers. Then, we mix and stir the two liquids for 15–20 min until the solution turnes from a semi-transparent color to a completely transparent color. The solution is then left for at least 4–5 h before stirring again for another 5 min. We establish this procedure to ensure the homogeneity of the glycerol and water mixture. The water surface tension with air, and the glycerol-water solution’s surface tension with air, density, and viscosity are denoted by
,
,
, and
, respectively. We note that water and glycerol are miscible. In addition,
<
. To express the glycerol-water solution density, we use Equation (3) in [
27]. To find the value for the solution’s viscosity, we use Equation (6) and
Figure 1 in [
28]. To calculate the solution’s surface tension, we use the interpolation of Table 4 in [
29] after converting the volume fraction of glycerol to a mass fraction. All variables are evaluated at the room temperature (i.e.,
T = 21 C). We record the top view of the drop as it spread on the glycerol-water solution, as shown in
Figure 1b, using a digital camera (Nikon 7500) and a macro lens (Nikkor 105 mm). A small amount of food dye is added to the water for clearer visualization.
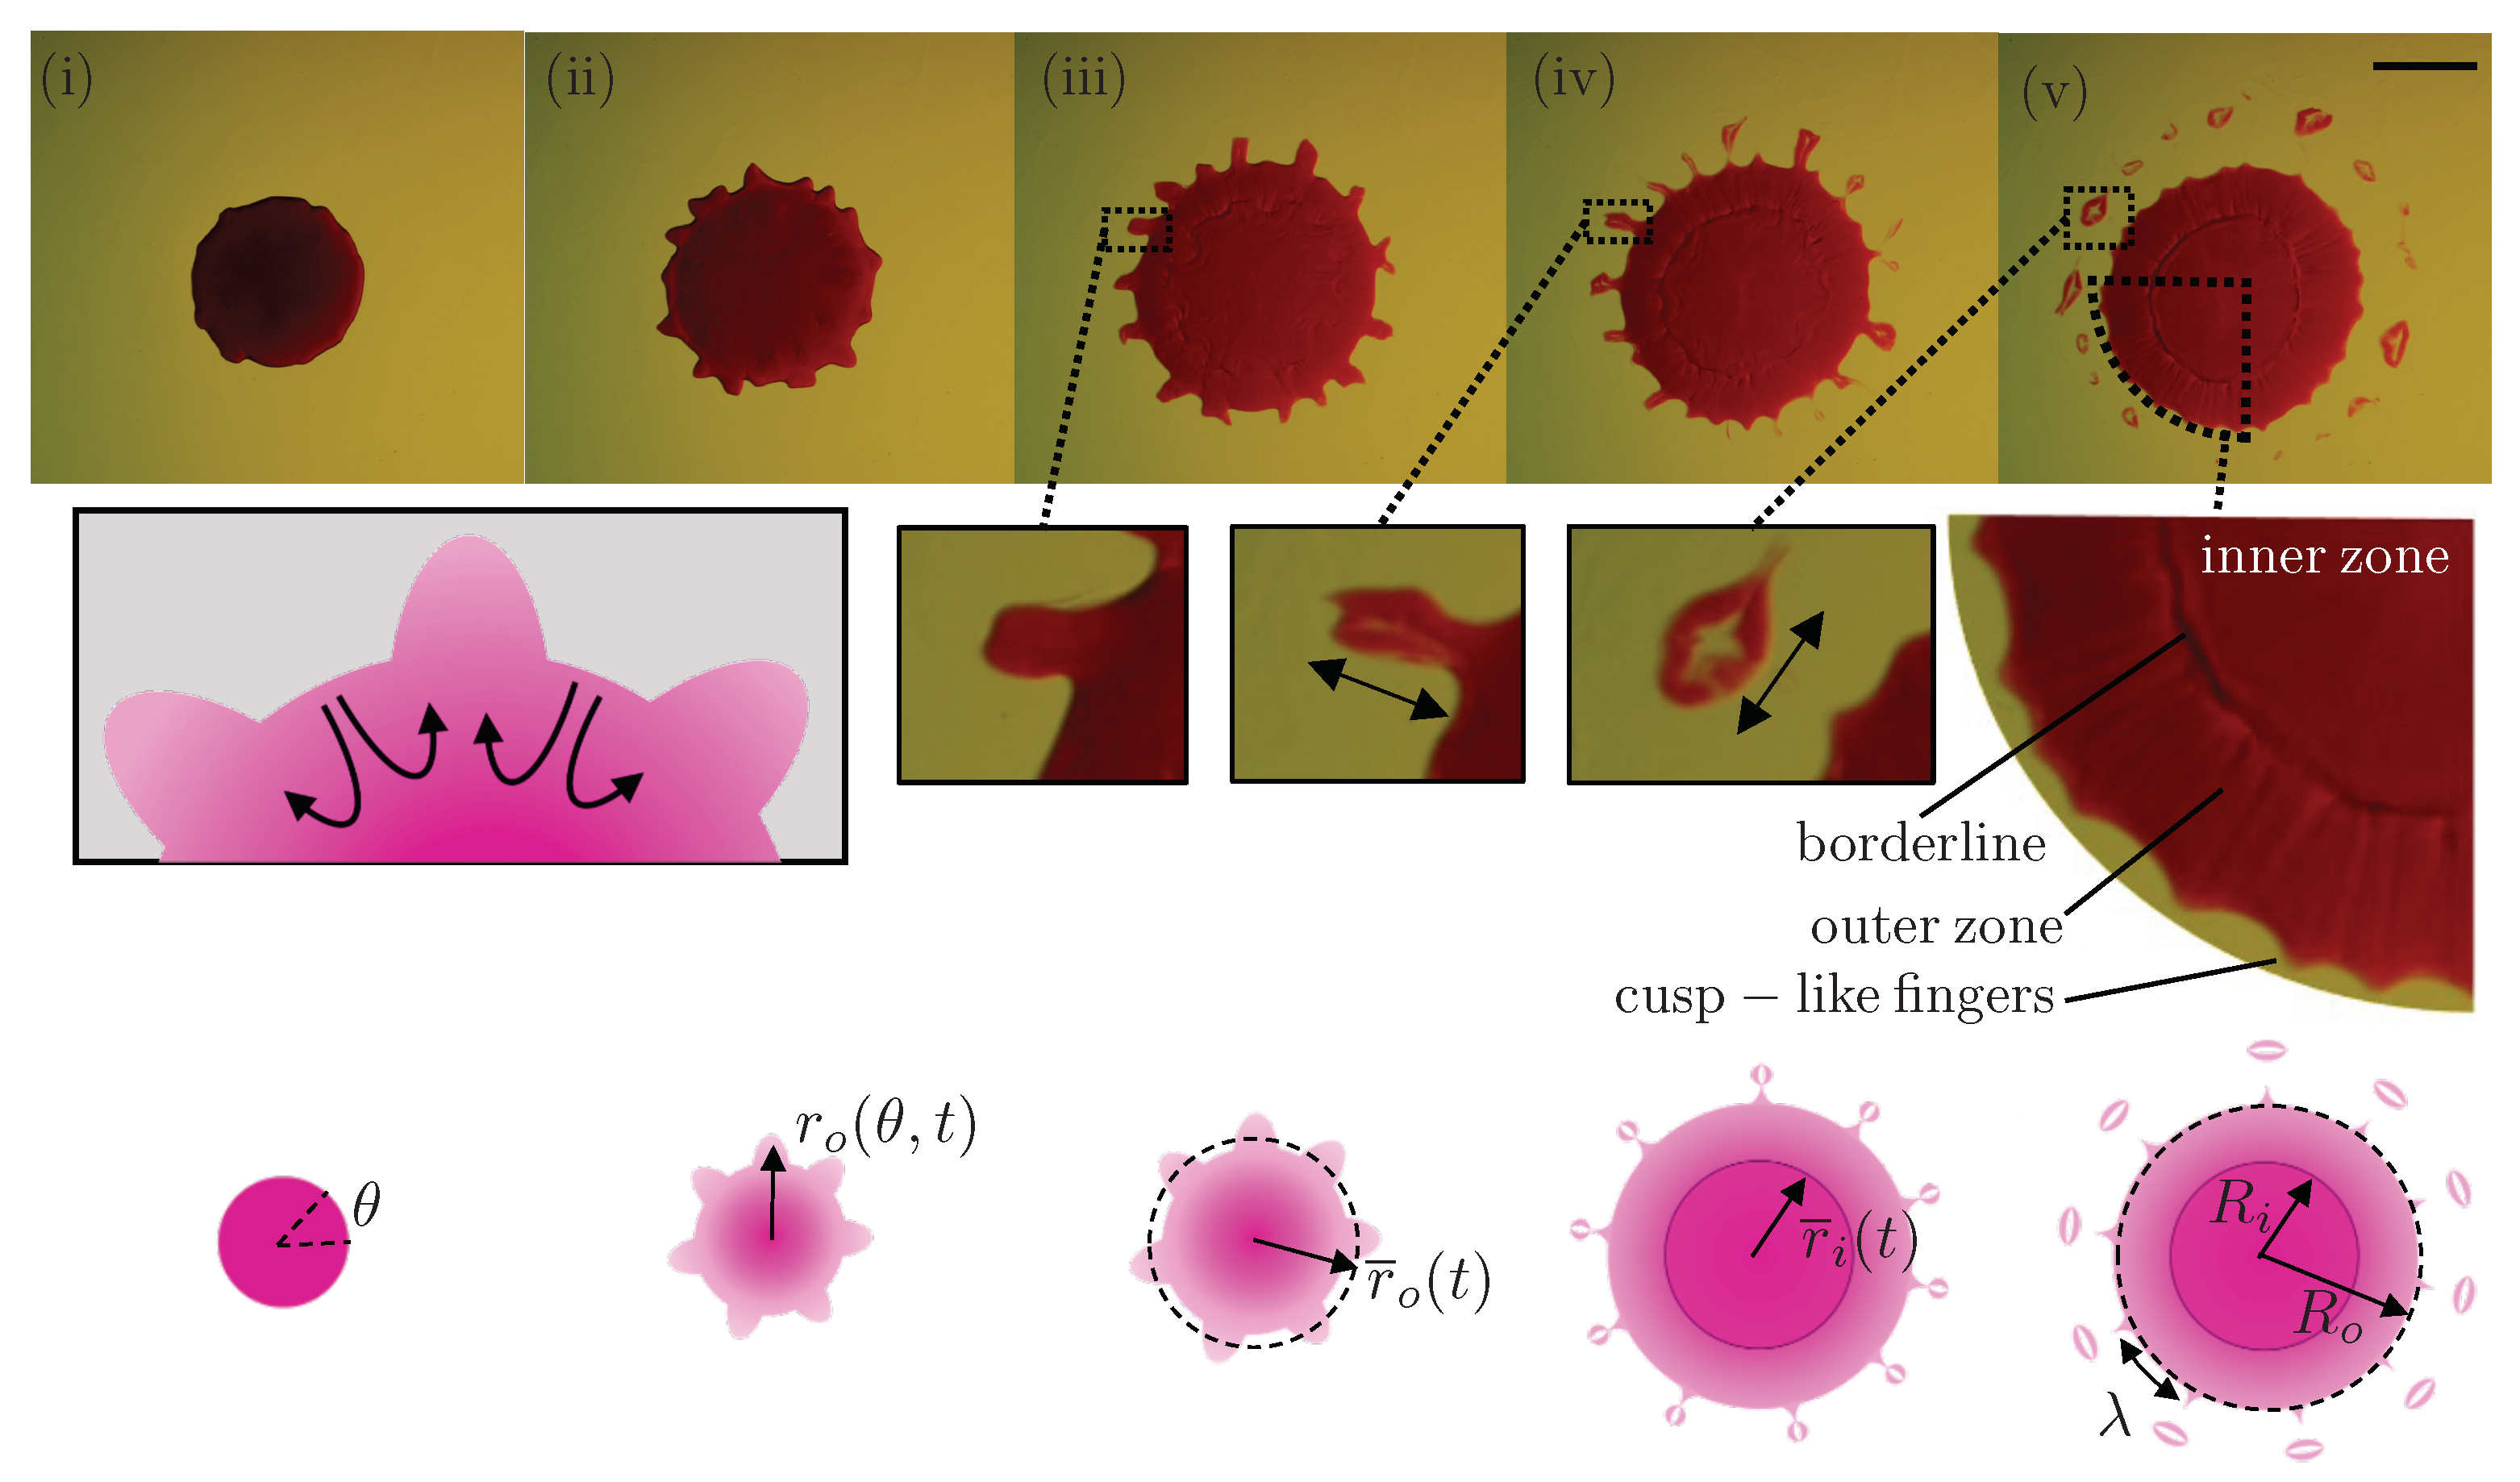
Figure 2 shows snapshots of a 500
water drop spreading on a bath of pure glycerol (i.e.,
). As the drop of water starts spreading on glycerol, the symmetry of the growing contact line is broken, and interfacial undulations emerge, as shown in
Figure 2i. The instantaneous outer radius of the drop is denoted as
, whereas the mean outer radius is denoted as
. The perturbations continue to grow as indicated in
Figure 2ii, with a certain wave number,
n, that changes with time. At the early stage of spreading, the Marangoni flow from glycerol to the water drop is strong. As the perturbations grow, a number of discrete finger-like undulations form at the interface, and continue to evolve in the radial direction, as shown in
Figure 2iii and its inset. In addition, the internal flows induced by the Marangoni stress at the mixing front begin to divide the drop into two regions of an inner zone and an outer zone. The inset of
Figure 2v demonstrates the borderline separating the two regions with a mean radius
. The dark borderline is indicative of either a depth change, which suggests that the inner zone is deeper than the outer zone, or an abrupt concentration gradient for glycerol in water. We note that the glycerol solution has a higher density than the water drop. Hence, separation of the drop into an inner and outer zone is presumably due to the Rayleigh–Taylor instability, which happens when the glycerol solution is flowing over the water drop under Marangoni effects. Confirming this hypothesis requires further investigation of visualizing the side-view of the drop, which will be carried out in a future study.
As the fingers grow, the centerline of each finger is filled with the glycerol-water mixture, as shown in the inset of
Figure 2iv. However, the fingers still continue to grow radially outward (see the inset of
Figure 2iv) until they pinch off from the miscible interface. After the pinch-off, the separated fingers start to expand along the azimuthal direction, as shown in
Figure 2v. A ring of separated fingers continues to gradually move away from the center even after the interface stops spreading, as shown in
Figure 2v and its inset. After the pinch-off event, the Marangoni flow weakens noticeably; therefore, the drop’s shape remains unchanged. At this stage, dark radial lines are seen in the outer zone, as shown in
Figure 2v, which is indicative of variations in either depth or glycerol concentration in the azimuthal direction. These variations are presumably induced by the vortical Marangoni flows as water mixes with glycerol at the interface, as illustrated in the inset of
Figure 2. The right inset of
Figure 2v shows that the final shape of the drop’s outer interface maintains its cusp-like fingers remaining from the finger pinch-off event due to the absence of interfacial tension between water and the glycerol solution. The mean outer radius and mean inner radius for the final shape of the drop are denoted as
and
, respectively. In addition, the wave number and wave length of the final drop shape are denoted as
N and
, respectively.
3. Results
In this section, we first discuss the effects of two parameters (V and ) on the growth of the fingers. We then discuss the final size and wavelength of the drop in the form of scaling arguments and dimensionless parameters.
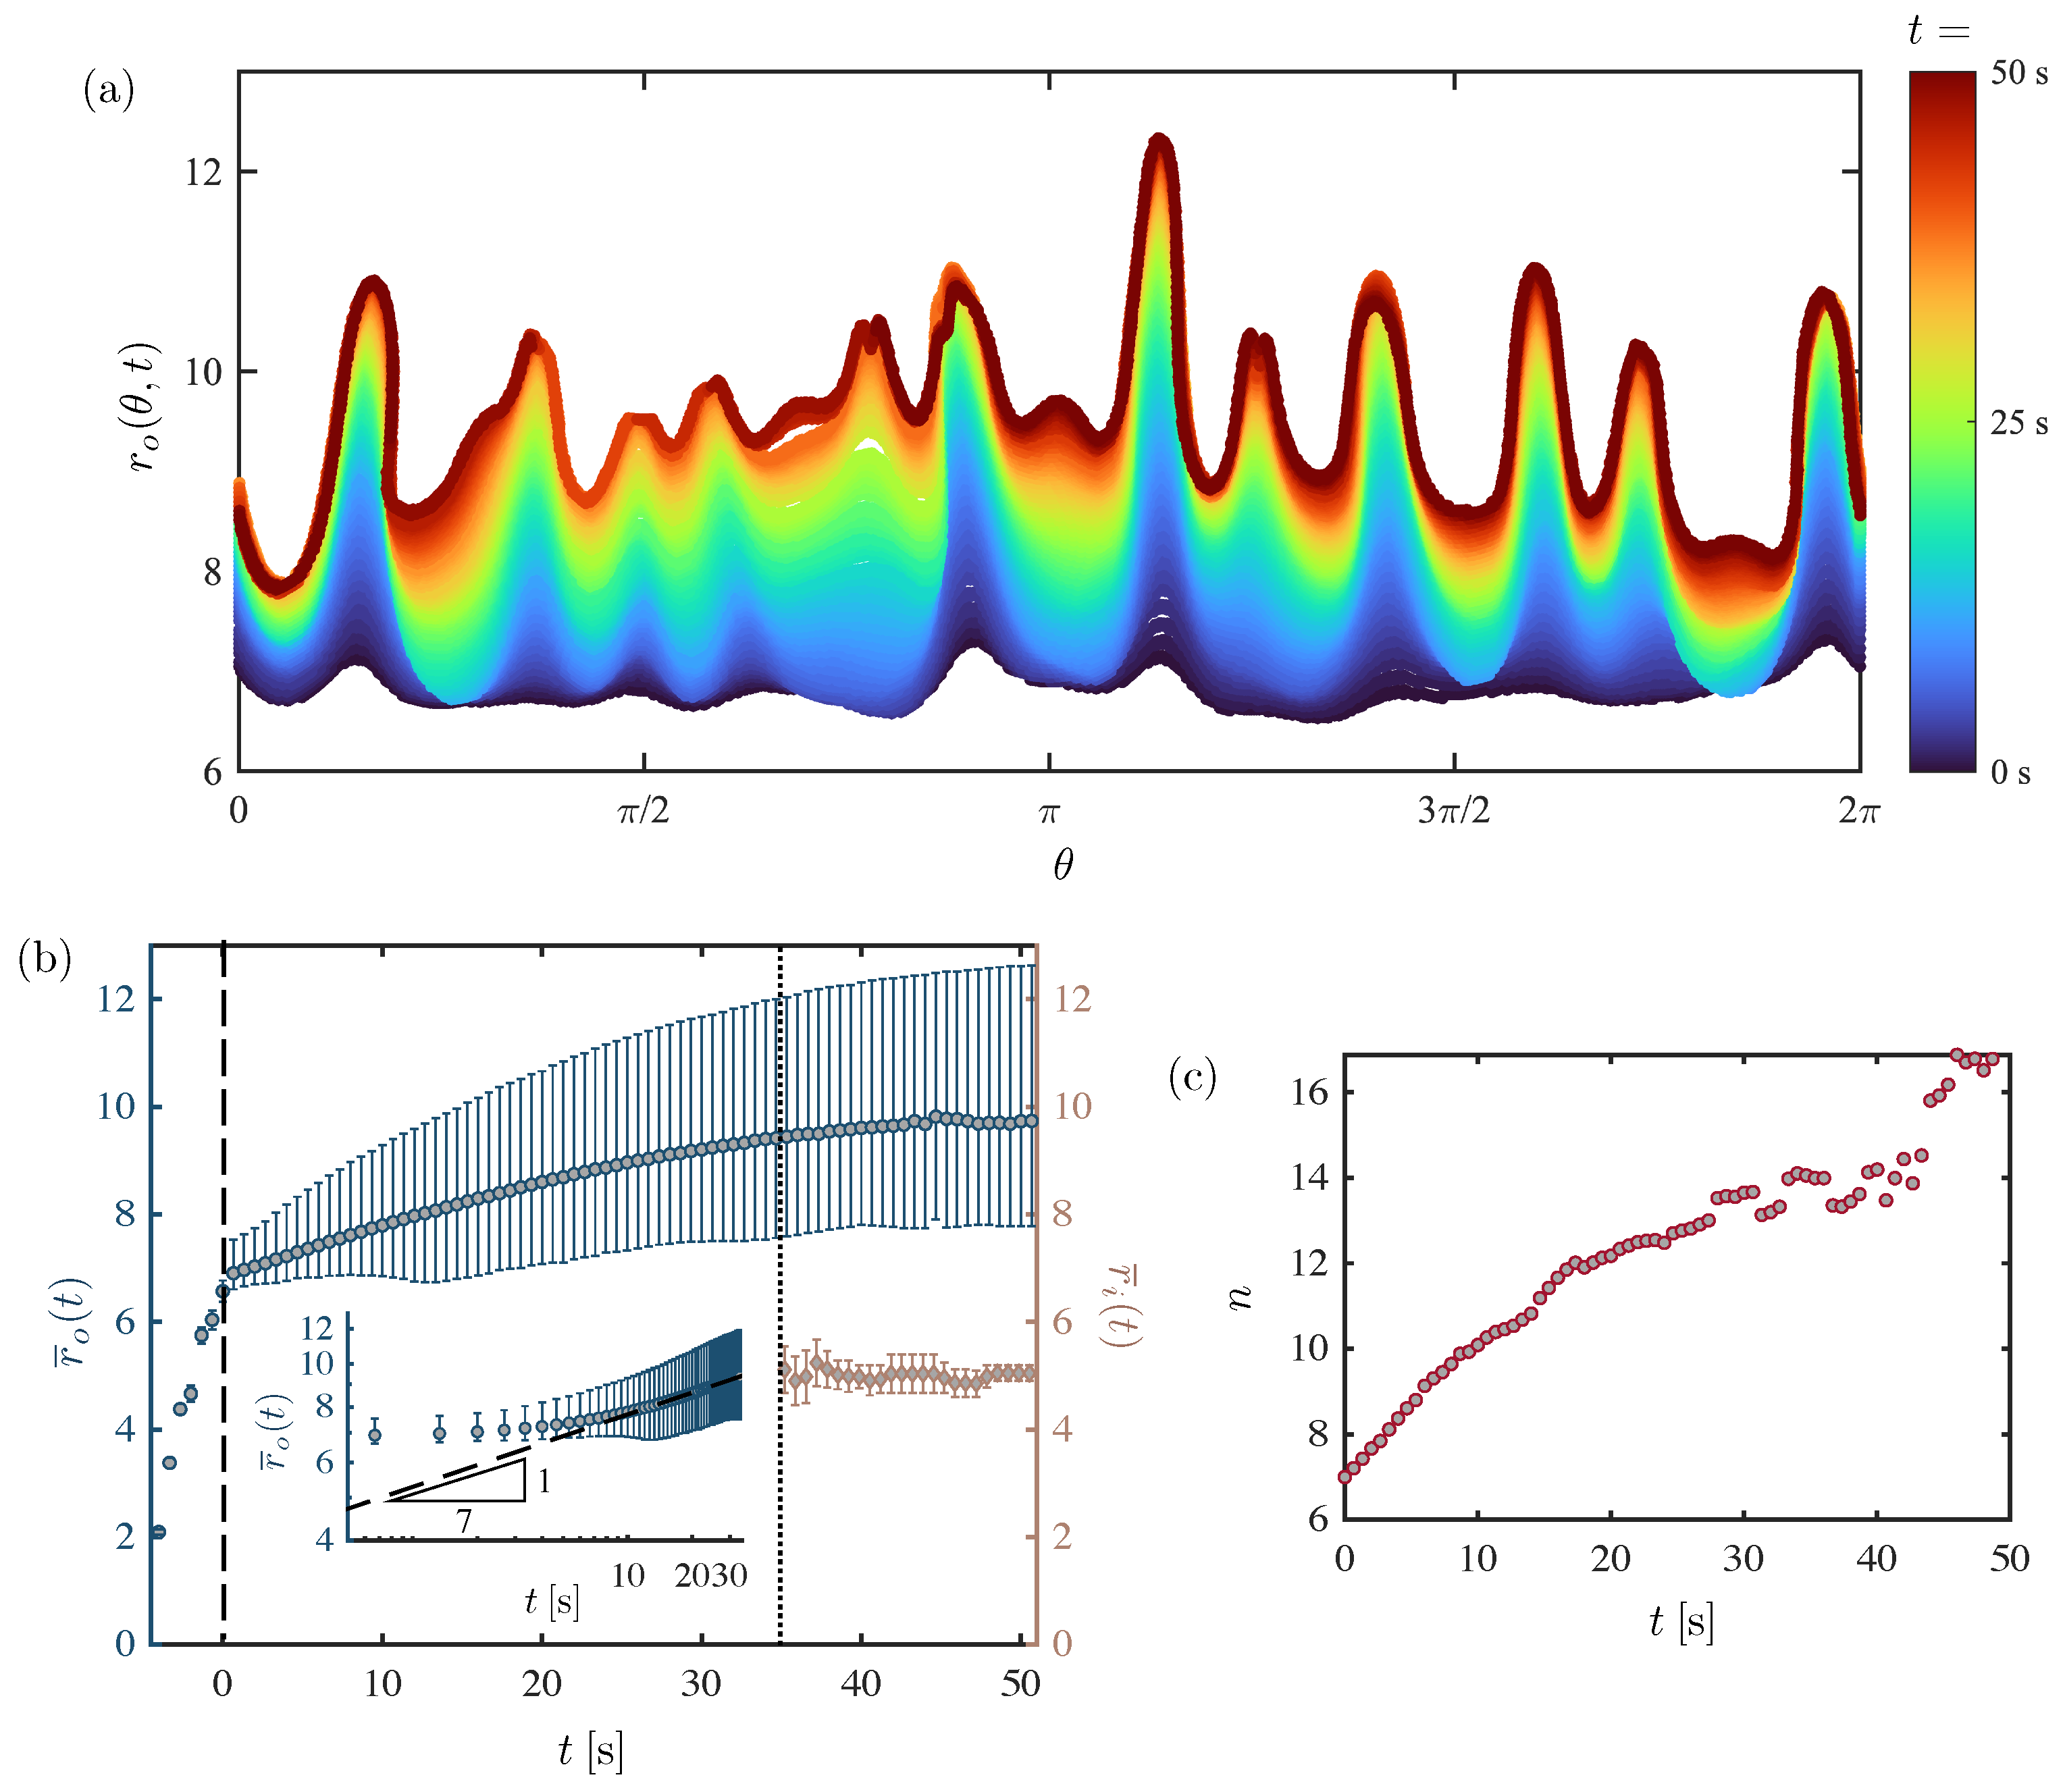
Figure 3a shows the time evolution of
along the azimuthal direction,
, starting from when the drop is completely deposited on the liquid layer. As indicated in
Figure 3a, the fingers grow over time until the drop reaches its final shape with a certain wavenumber.
Figure 3b shows
and
over the same timespan. At
the inner zone emerges when the outer interface has nearly reached its final size, as shown in
Figure 3b. Here, the size of the inner zone does not change noticeably. In addition, we note that the outer interface spreading scales as
, which is in the same range as the scalings reported for the dynamic wetting of a viscous liquid on a smooth solid surface [
30,
31,
32,
33]. Finally,
Figure 3c shows the dominant wavenumber based on the FFT results of the interface temporal shape. As seen in
Figure 3c, the wavenumber in the experiments increases with time until the drop reaches its final shape.
3.1. Effect of the Drop Volume, V
We systematically changed the volume of the deposited water drop in the range of
V = 100–600
on pure glycerol (i.e.,
) to characterize the effect of the drop volume on the final radius and shape of the drop.
Figure 4a(i–iii) shows the final shapes of three different drops with
, 400, and 600
, respectively.
Figure 4b shows how the final outer radius,
, and the inner radius,
, of the drop increase with the volume,
V. Notably,
remains nearly constant even with different
V. We also extracted the dominant wavenumber,
N, which increases monotonically with volume
V, as shown in
Figure 4c. Notably, the corresponding wavelength, namely,
, decreases with increasing
V (see the inset of
Figure 4c).
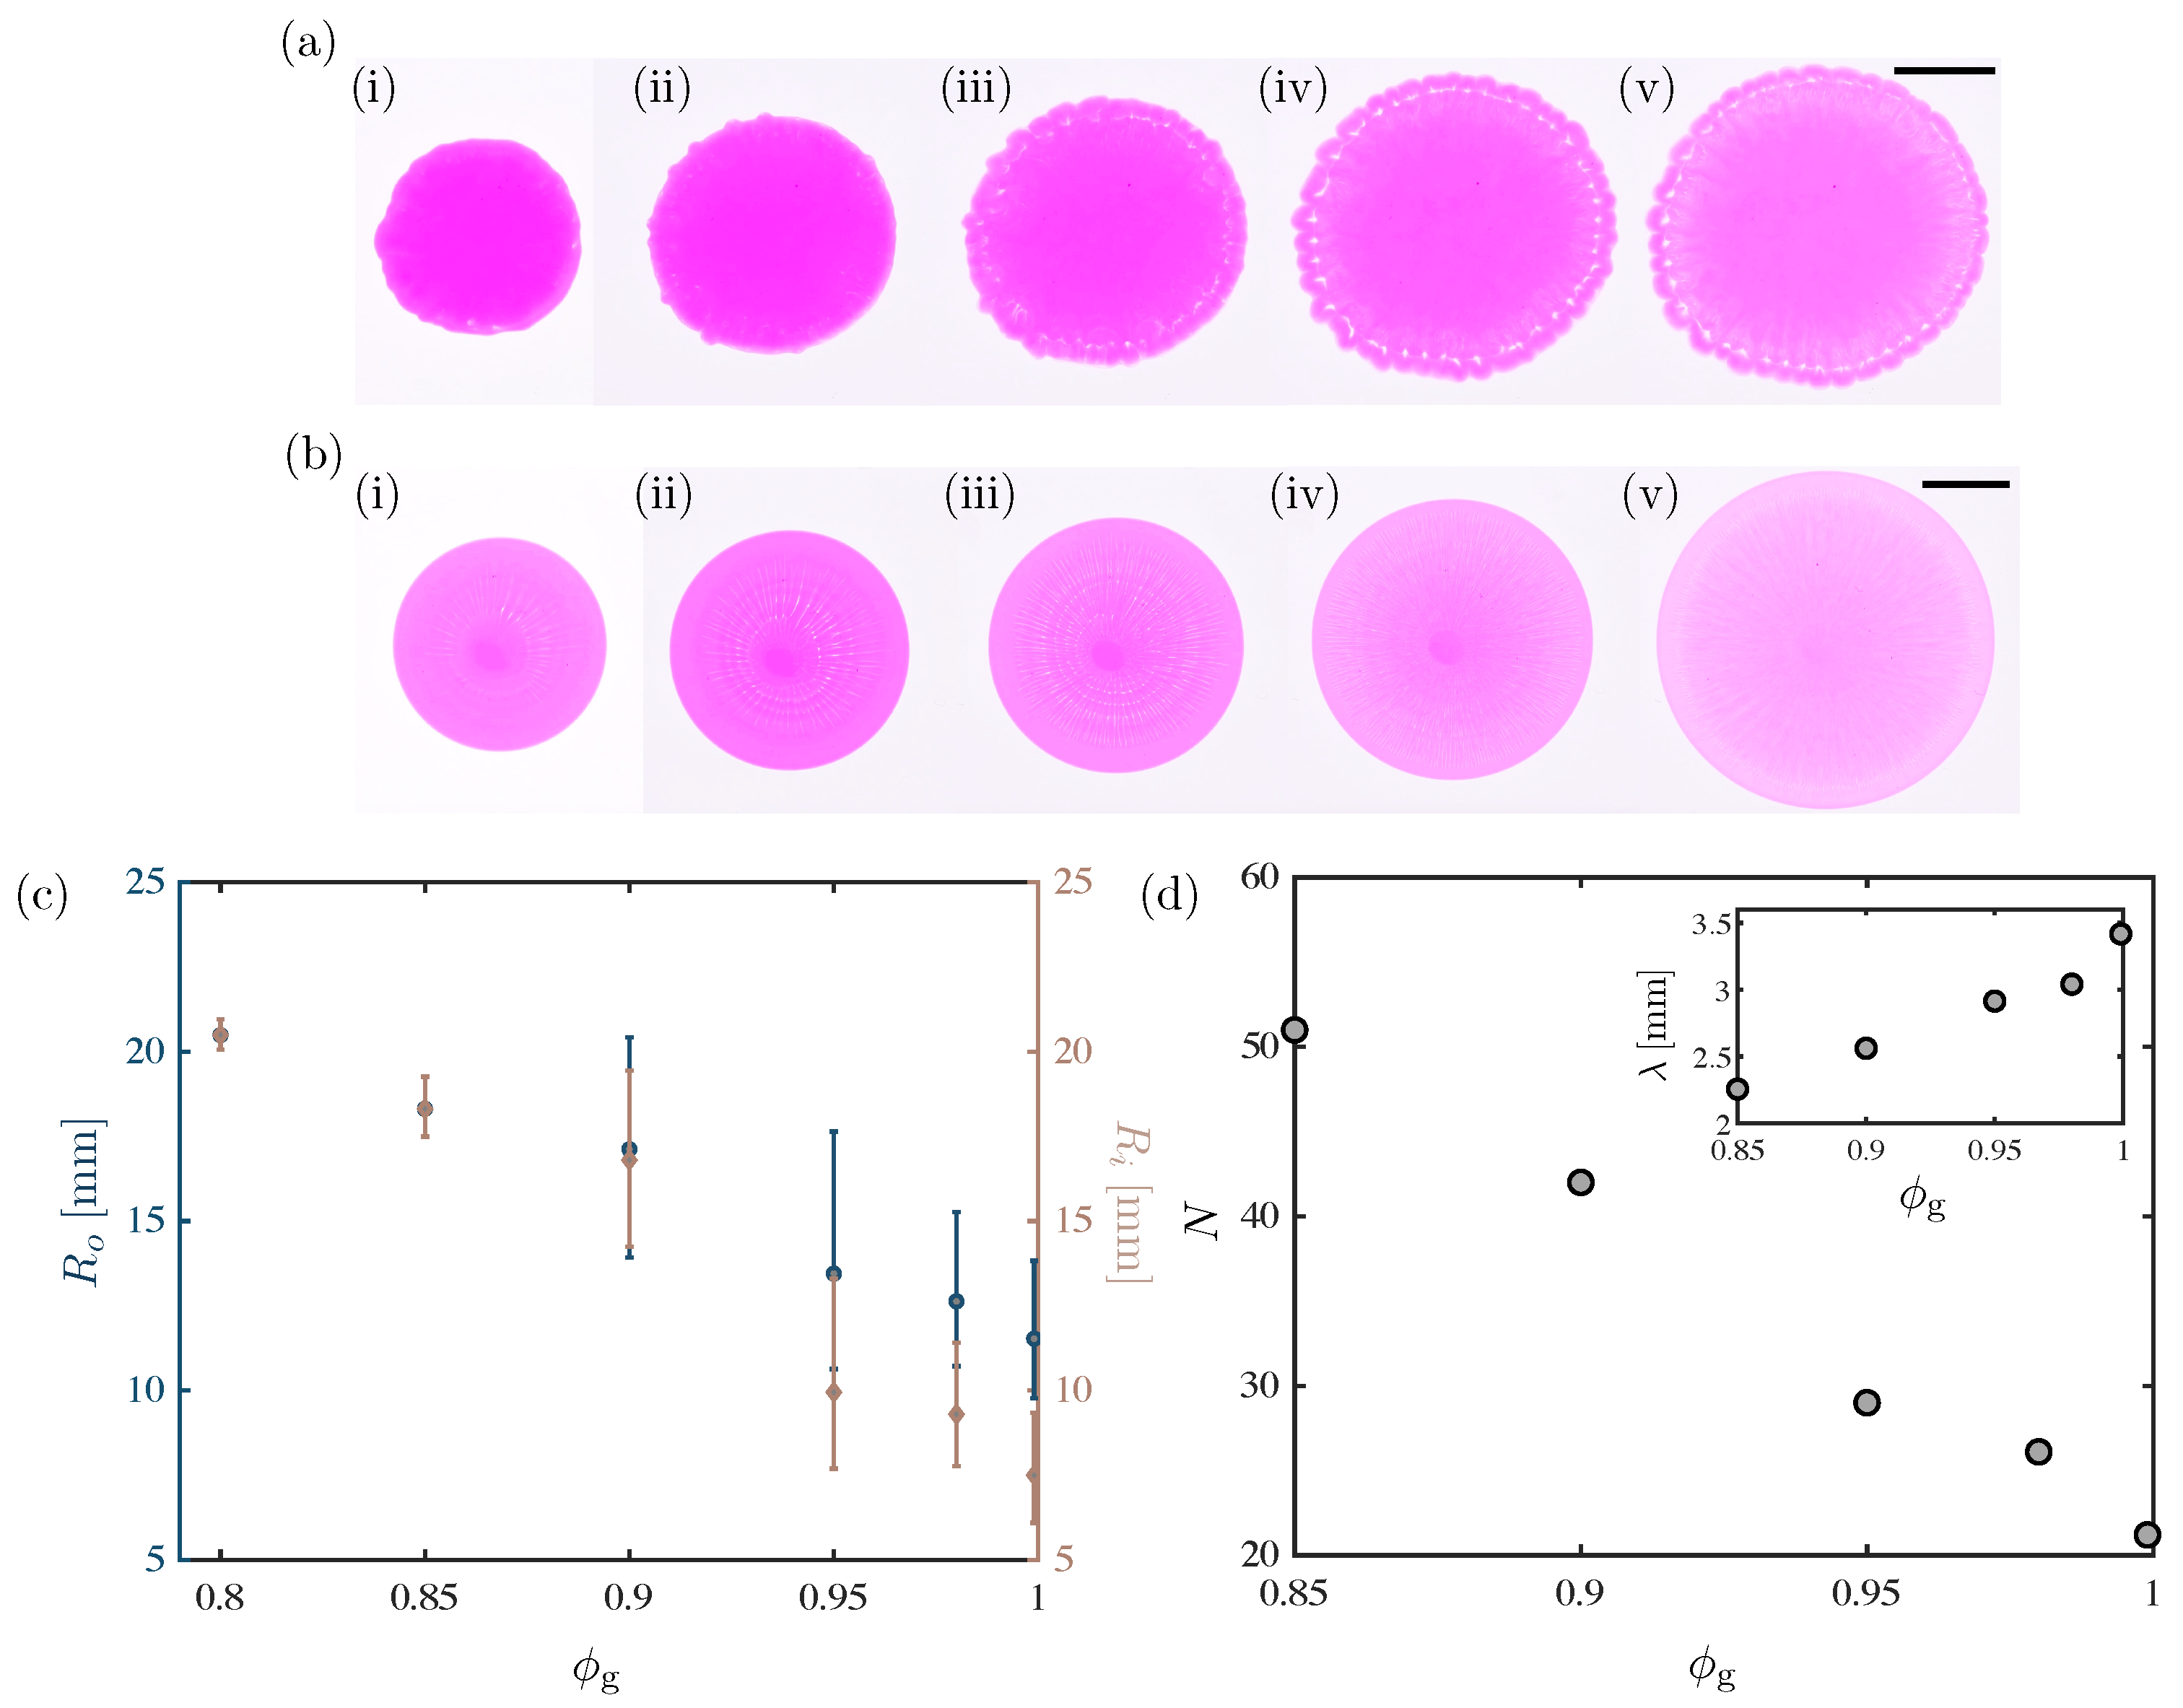
3.2. Effect of the Glycerol Volume Fraction,
We systematically changed the volume fraction of the glycerol solution in the range of
0.8–0.999 to characterize the Marangoni effects and the effects of buoyancy and viscosity on the final size and shape of the drop. With decreasing
, both the density difference and the surface tension difference between the water drop and the glycerol-water solution decrease. Therefore, the outward buoyance force and inward Marangoni stress of the drop get suppressed. The values of
,
, and
for varying
are extracted from [
27,
28,
29], and listed in the supplemental material. In addition, the corresponding molar fraction of glycerol in the mix,
, is included for varying
values in the supplemental material.
As
decreases, the shape of the fingers changes from the cusp-like fingers, shown in
Figure 2a, to rounded fingers, shown in
Figure 5a(iv–v) at
, until the outer interface becomes stable at
, as shown in
Figure 5b. However, groove-like patterns are observed to grow in the middle of the water drop at
, as shown in sequential snapshots in
Figure 5b.
Figure 5c shows that
and
decrease as
increases. Note that the inner zone forms closer to the outer interface with decreasing
until
, when
. Finally,
Figure 5d shows that
N increases and
decreases as
increases. This suggests that the Marangoni stress is more effective in stabilizing short-wavelength perturbations; therefore, inhibiting the Marangoni stress (i.e., lower
) yields smaller
.
3.3. Scaling Arguments
Here we consider the forces acting on the drop as it spreads over the fluid interface. The stress from surface tension scales as
, whereas the viscous force scales as
, where
,
u is the characteristic speed, and
H denotes the characteristic height of the drop, as indicated in
Figure 6a. Then, balancing the two forces yields a modified capillary number in the form of
. Using the mean velocity of the outer interface, the capillary number ranged from 0.009–0.04 in our experiments. Therefore, neglecting viscous forces gives buoyancy and Marangoni stress as the driving force and resisting force, respectively. The force balance yields
where
denotes the difference between the glycerol solution density and the water density. Substituting
in Equation (
1) yields
Figure 6b shows the plot of
versus
for all cases of varying
V and
. Despite the changes in
V,
, and
, all experimental data show a good agreement with the scaling for
from Equation (
2).
In addition, we nondimensionalize
by means of the capillary length,
.
Figure 6c shows that the non-dimensional wavelength is inversely proportional to the Bond number as
, where
is the Bond number. Qualitatively, it is expected that the wavelength increases with the Marangoni stress and inversely with buoyancy.
4. Discussion and Conclusions
In this paper, we have presented a new form of instability when a less viscous and less buoyant drop spreads over a millimetric miscible liquid layer that has lower surface tension than the drop. As the glycerol solution mixes with water at the moving front, an inward Marangoni flow is generated against a spreading flow under buoyancy effects. Therefore, the glycerol solution flows along the free surface under the Marangoni flow. As a high concentration of glycerol solution flows over the water drop, it becomes unstable due to buoyancy effects. Therefore, there must be a characteristic length arising from the interplay between the Marangoni flow and the occurrence of Rayleigh–Taylor instability. This characteristic length hints at the formation of the inner zone, separated by the observed borderline in the experiments, which is indicative of either a depth gradient or concentration gradient. In addition, we showed that after the outer interface stops spreading, the fingers continue to grow until they pinch off from the miscible interface. After the pinch-off, the fingers continue moving radially outward and slowly mix with the glycerol solution. In the final stages, the Marangoni flow is noticeably weakened; therefore, the drop’s outer interface maintains its cusp-like patterns.
We observed that both the outer and inner radii, and , grow with a similar trend regardless of the drop volume. In addition, the total number of fingers in the final shape increases monotonically with increasing droplet volume, whereas the final wavelength decreases. These results showed that buoyancy shortens the wavelength, thereby increasing the wavenumber. Furthermore, we showed that by adding water to glycerol and suppressing the inward Marangoni flow, the borderline between the two zones approaches the outer interface until it is not observed below 0.85. In addition, the final wavenumber increases with a decreasing volume fraction, whereas the final wavelength decreases. In other words, inhibiting the Marangoni flow yields a smaller wavelength. Therefore, the results of our two parametric experiments suggest that buoyancy destabilizes the interface as the driving force, and the Marangoni stress stabilizes small undulations as the resisting force. By balancing the two opposite forces, we incorporated scaling laws for the growing outer interface, which were in good agreement with the experiments. In addition, we found that the final wavelength is inversely proportional to the modified bond number for all cases.
Despite the similarities between our system and that of [
25], we observed new behaviors, such as the pinch-off of fingers, the formation of inner and outer zones, and new inner streak patterns that emerged for lower glycerol concentrations. These differences are presumably due to the negligible effect of inertia in the present study as opposed to that in [
25], in which drops impacted a fluid bath. The radial motion of the fingers after the pinch-off event is reminiscent of the atomization process of drops as a water-IPA drop spreads on an oil bath [
11]. However, we note that in the case of a water-IPA drop on an oil bath, outward Marangoni flow induced by IPA evaporation results in fragmentation, whereas in the current system, the inward Marangoni flow induces the fragmentation of the fingers. Further analysis is required to gain a better understanding of the underlying mechanism in order to rationalize the wavelength. More details related to the current miscible instability will be investigated in a future study.


