Article

Installation Quality Inspection for High Formwork Using Terrestrial Laser Scanning Technology

1
Faculty of Architecture, Civil and Transportation Engineering, Beijing University of Technology, Beijing 100124, China
2
Beijing Key Laboratory of Earthquake Engineering and Structural Retrofit, Beijing University of Technology, Beijing 100124, China
3
Key Laboratory of Urban Security and Disaster Engineering of China Ministry of Education, Beijing University of Technology, Beijing 100124, China
4
Faculty of Society & Design, Bond University, Gold Coast, QLD 4226, Australia
5
Department of Business Information Systems, Auckland University of Technology, Auckland 1010, New Zealand
*
Author to whom correspondence should be addressed.
Symmetry 2022, 14(2), 377; https://doi.org/10.3390/sym14020377
Submission received: 10 December 2021 / Revised: 25 January 2022 / Accepted: 1 February 2022 / Published: 14 February 2022
(This article belongs to the Special Issue Symmetry in Structural Health Monitoring)

Abstract

:
Current inspection for installation quality of high formwork is conducted by site managers based on personal experience and intuition. This non-systematic inspection is laborious and it is difficult to provide accurate dimension measurements for high formwork. The study proposed a method that uses terrestrial laser scanning (TLS) technology to collect the full range measurements of a high formwork and develop a genetic algorithm (GA) optimized artificial neutral network (ANN) model to improve measurement accuracy. First, a small-scale high formwork model set was established in the lab for scanning. Then, the collected multi-scan data were registered in a common reference system, and RGB value and symmetry of the structure were used to extract poles and tubes of the model set, removing all irrelevant data. Third, all the cross points of poles and tubes were generated. Next, the model set positioned on the moving equipment was scanned at different specified locations in order to collect sufficient data to develop an GA-ANN model that can generate accurate estimates of the point coordinates so that the accuracy of the dimension measurements can be achieved at the millimetre level. Validation experiments were conducted both on another model set and a real high formwork. The successful applications suggest that the proposed method is superior to other common techniques for obtaining the required data necessary for accurately measuring the overall structure dimensions, regarding data accuracy, cost and time. The study proposed an effective method for installation quality inspection for high formwork, especially when the inspection cannot be properly operated due to cost factors associated with common inspection methods.

1. Introduction

Formwork is a temporary structure on a construction site into which concrete or a similar substance is poured, while the falsework supports the shuttering moulds [1]. In building construction, formwork plays a major role in determining the duration and schedule of construction activities [2]. In fact, the cost of formwork construction (forming cost) accounts for 10% of the overall cost and erection and assembly of formwork systems (forming time) spend 50% of the overall construction time of the entire project [3]. Recently, with developments in the building industry, high formwork is used more widely. High formwork projects are more significant than general formwork projects due to their complex structures. Their large size and complex structure make them more vulnerable to potential safety risks.
In the installation of high formwork structures, errors are unavoidable, resulting in defects that differ from code requirements or design specifications. In general, small errors are permitted, but they must be within an acceptable error range. Otherwise, they can create potential safety risks. Any such safety risks can adversely affect subsequent processes, lower the efficiency of the construction work and increase construction costs, or worst of all, cause accidents [4]. Such accidents can lead to significant loss of life as well as financial losses. Hence, it is necessary to conduct proper, high-quality inspections for high formwork after installation. However, the inspection process for high formwork has not been dealt with systematically due to the lack of an appropriate inspection technology for such projects and a shortage of primary data necessary to establish a plan. In fact, inspecting these factors on construction site using common methods like tape measurements or plumb monitoring is exhausting and laborious.
The main concern of the inspection of installation quality for high formwork includes: (1) to check the position of the main components of the formwork such as vertical poles, horizontal tubes, bottom reinforcing tubes and the diagonal bracing; (2) to check whether the spacing of vertical pole and lift height (the distance between the two neighbour tubes) are in accordance with the requirements of the building code. Based on the investigations of [5,6,7], these factors are the main determinants of the proper function of a high formwork. According to China’s building codes related to high formwork [8,9,10], they are the main inspection terms during the inspection process. Hence, the study proposed a method for effectively checking them.
Current installation quality assessment of high formwork is mainly based on manual inspection using traditional measurement instruments like measuring tapes, which require close-up access, and are not ideal for detecting defects or for accurately measuring the dimensions and recording the data. The inspection process is mainly based on human inspection and judgement, which is labour-intensive and inefficient, especially for large-scale structures.
Different approaches have been adopted, including theodolites, joint meters, and inclinometers, as well as tachymetry, global navigation satellite system (GNSS), and robotic total station [11,12]. They can offer accurate results, but they only provide discrete monitoring points and fail to attain full area coverage. Some measurement techniques are also too expensive. Moreover, not all available techniques are suitable for inspection of high formwork due to the size and complex shape of the structure, and level of required accuracy. When choosing a suitable measurement system, factors such as cost, time required for operation, and the required skills of the user should all be considered [13,14,15].
Inspection accuracy and efficiency can be improved by using terrestrial laser scanning (TLS) technology. Another benefit of TLS is its long range, which allows data collection in inaccessible fields. The TLS system can be regarded as the best monitoring technique for high formwork owing to its ability to provide high spatial resolution and accurate measurements. A major benefit of TLS is that it provides rapid and dense measurements in inaccessible areas [16]. TLS can produce point clouds with high level of details and accuracy, which is particularly good for detailed investigations on a large scale [17,18]. The large amount of accurately measured data has great potential to deliver measurements that are difficult to achieve by other methods in such a short period of time, with simple installation requirements. TLS measurements require only a laser scanner, a laptop computer with data processing software, and several reference targets.
Previous studies have provided sound evidence for the efficiency and effectiveness of inspection operation using TLS. Gordon et al. [19] and Akinci et al. [20], for example, demonstrated that manual inspection can miss important information such as site changes and defects. However, the adoption of TLS can improve efficiency in construction inspection via timely provision of comprehensive, as-built data. Although there are advantages to adopting TLS, some studies [21,22,23] also point out the challenges that adversely influence the effective use of TLS, including difficulties in effectively extracting the required information from scan data and in generating required accuracy results.
This study provides a new method for conducting quality inspection using TLS technology. The proposed method can effectively extract important elements such as poles and tubes in high formwork from the point cloud data. A GA-ANN model was developed to increase the accuracy of the TLS measurements. To achieve these, some techniques are first proposed to rapidly extract the important points from the dense data. Secondly, a small-scale high formwork model set with set dimensions and simulated defects was built to help in collecting sufficient data to train the ANN model. The obtained measurements based on the results from the ANN model were compared to the set dimensions to evaluate the performance of the ANN model. Moreover, the genetic algorithm was adopted to optimised ANN model. The performance of the GA-ANN model was compared with other ML algorithms such as support vector machine and random forest. Next, a laboratory test was conducted to validate the proposed method. Finally, the proposed method was used on a real high formwork to validate its effectiveness.
The uniqueness of the study lies in: (1) the consideration of TLS as an effective tool in quality inspection for high formwork after installation; (2) the rapid extraction of the standard poles and tubes from the point clouds; and (3) the development of a GA-ANN model that can generate the coordinates of important points to accurately calculate the distance between the important points and thus detect defects that fall out of the acceptable error range.
The organization of the study is as follows: the literature review and the highlights of the contribution of the current study are described in Section 2. The proposed method for installation quality inspection for high formwork are illustrated in Section 3. The validation of the proposed method on a real high formwork are shown in Section 4. Section 5 provides the conclusion and future research plans.

2. Literature Review

2.1. TLS System

Several studies have been carried out focusing on the use of terrestrial laser scanning (TLS) technology as an inspection approach including the application of TLS for health monitoring and the inspection of bridge structures [24,25]; condition monitoring and defect identification for historic structures and building facades [26,27]; checking concrete conditions [16,28]; and as-built modelling [25,29]. In a study of [24] TLS that was used in building damage inspection after an earthquake, the accuracy of the measurement was achieved at the millimetre level, a performance comparable with conventional methods like displacement transducers and inclinometers.
TLS has been widely adopted in the construction field for construction progress tracking [30,31], the reconstruction of buildings [32,33,34,35], and construction quality assurance [36,37,38]. However, limited studies have been performed using TLS to inspect the installation quality of high formwork.

2.2. Object Recognition

Extensive studies on the use of TLS in object recognition have been conducted. TLS data can generally be extracted based on features. Some studies also proposed to specify the point data based on the RGB value. For example, Pu and Vosselman [33] proposed a region-growing method to effectively extract planar objects from point clouds of a building façade, and a feature recognition method was used to classify the planar objects. In the study [39], the least square method was used to fit lines to extract important lines and points from the point clouds of structural elements on buildings damaged by an earthquake.
Some studies also focused on developing an automatic algorithm to recognize and segment required objects from point clouds. For example, Riveiro et al. [40] recommended an approach that can automatically extract masonry blocks from point clouds. In the study [41], machine learning methods were used to automatically classify the morphological segments of a hillslope affected by shallow landslides into seven classes (e.g., scarp, eroded area, deposit, rock outcrop and different classes of vegetation). Lee et al. [42] used a method that automatically extracts pipelines and their detailed parts, such as elbows and tees, from point clouds. Similarly, Czerniawski et al. [43] proposed as fully automatic approach for extracting pipe spools from point clouds. Some studies also developed methods that can recognize infrastructure objects based on point clouds. For example, Holgado-Barco et al. [44] extracted features from Light Detection and Ranging (LiDAR) data to model a road axis.
Most of the studies have focused on extracting data from buildings or infrastructure such as roads or bridges. However, few studies extract important elements from point cloud data based on the specific features of a high formwork. The combination of the RGB value of the point cloud data and the symmetry of the structure and special shape of the main components of the high formwork can help to rapidly extract important data from scan data.

2.3. Quality Assessment and Control

Traditionally, structural dimension checks are performed manually. Two main inspection methods are widely used: (1) directly check based on visual observations or using a measuring tape; (2) obtain coordinates of serval feature points by using total station. However, these methods are laborious, time-consuming, and insufficiently accurate. Recently, TLS has been widely used in quality assessment and control, such as surface-defect detection [45,46] or structure dimensional check in the Architecture, Engineering & Construction (AEC) industry [47,48,49]. Moreover, some studies have proposed using TLS to check the dimensions of structures. For example, Wang et al. [50] developed an automatic method to estimate the dimensions of a precast concrete panel using point clouds data. Bosch’e [51] proposed an approach to automatically detect and calculate the as-built dimensions of a steel structure based on laser scan data. Lee & Park [52] proposed a method using both TLS and an AI model to perform a dimensional check. And Nuttens et al. [53] provided a clear work flow to illustrate how to use TLS to measure the dimensional changes in two tunnels in Belgium and to generate results with submillimeter accuracy.
Although these studies provided good examples about the adoption of TLS technology in the AEC industry, they also admitted some issues about TLS measurement. First, TLS can quickly provide as-built data, but the scan strategy should be properly designed in order to provide good-quality data. Moreover, some techniques should be used to rapidly extract important data from dense scan data. In addition, the accuracy level of the TLS measurement should be improved to satisfy the requirements.
The contribution of the study lies in three aspects. First, the study proposes using TLS technology in the inspection of high formwork installation quality. Due to the unique complex structure of the high formwork and the labor and cost concerns of the inspection process, this study provides a reasonable and cost-effective way to conduct the inspection process. Secondly, the study provides an effective to quickly extract the data related to the important components of the high formwork such as vertical poles and horizontal tubes. Thirdly, the study used genetic algorithm optimized ANN model to improve the accuracy of the TLS measurements, which can provide coordinates of the cross points of the poles and tubes at millimeter level.

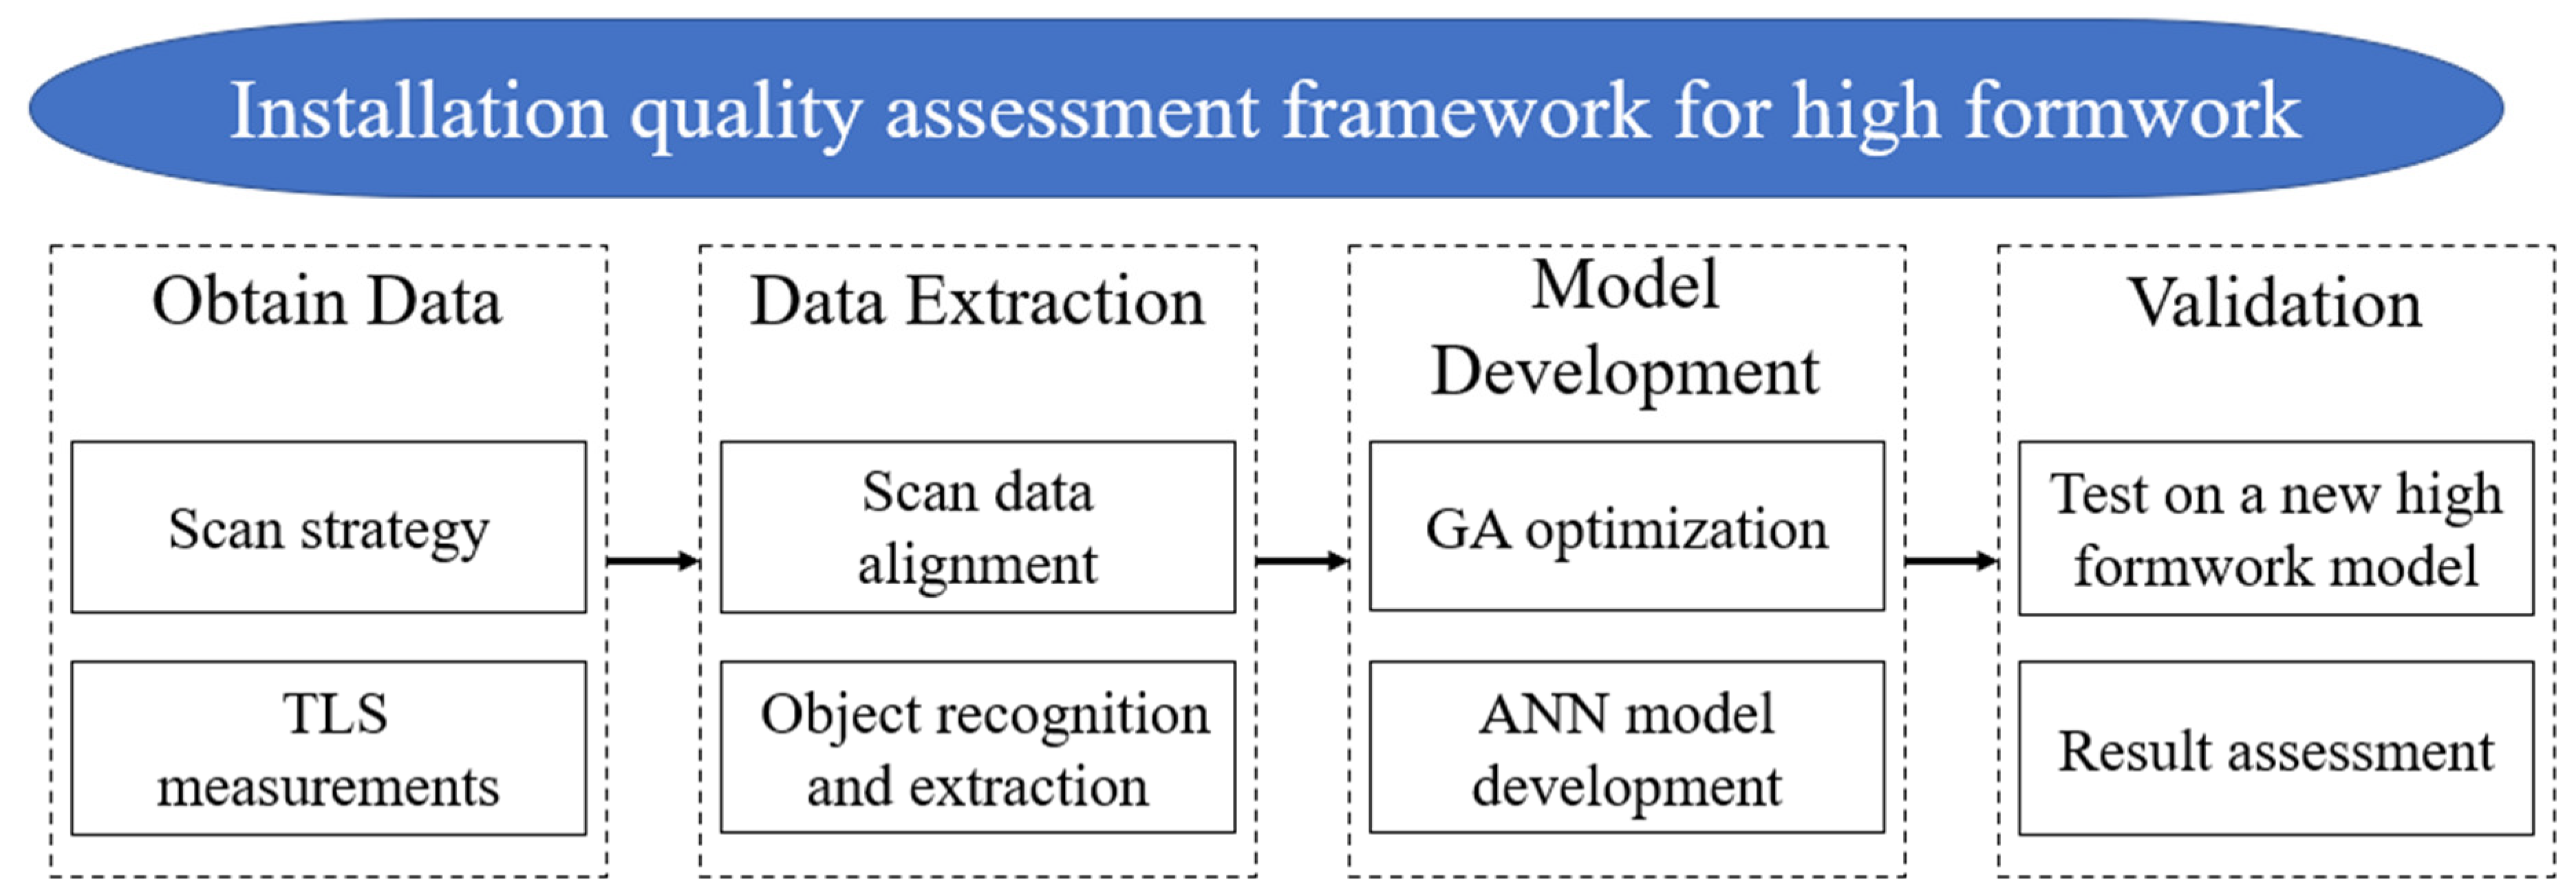
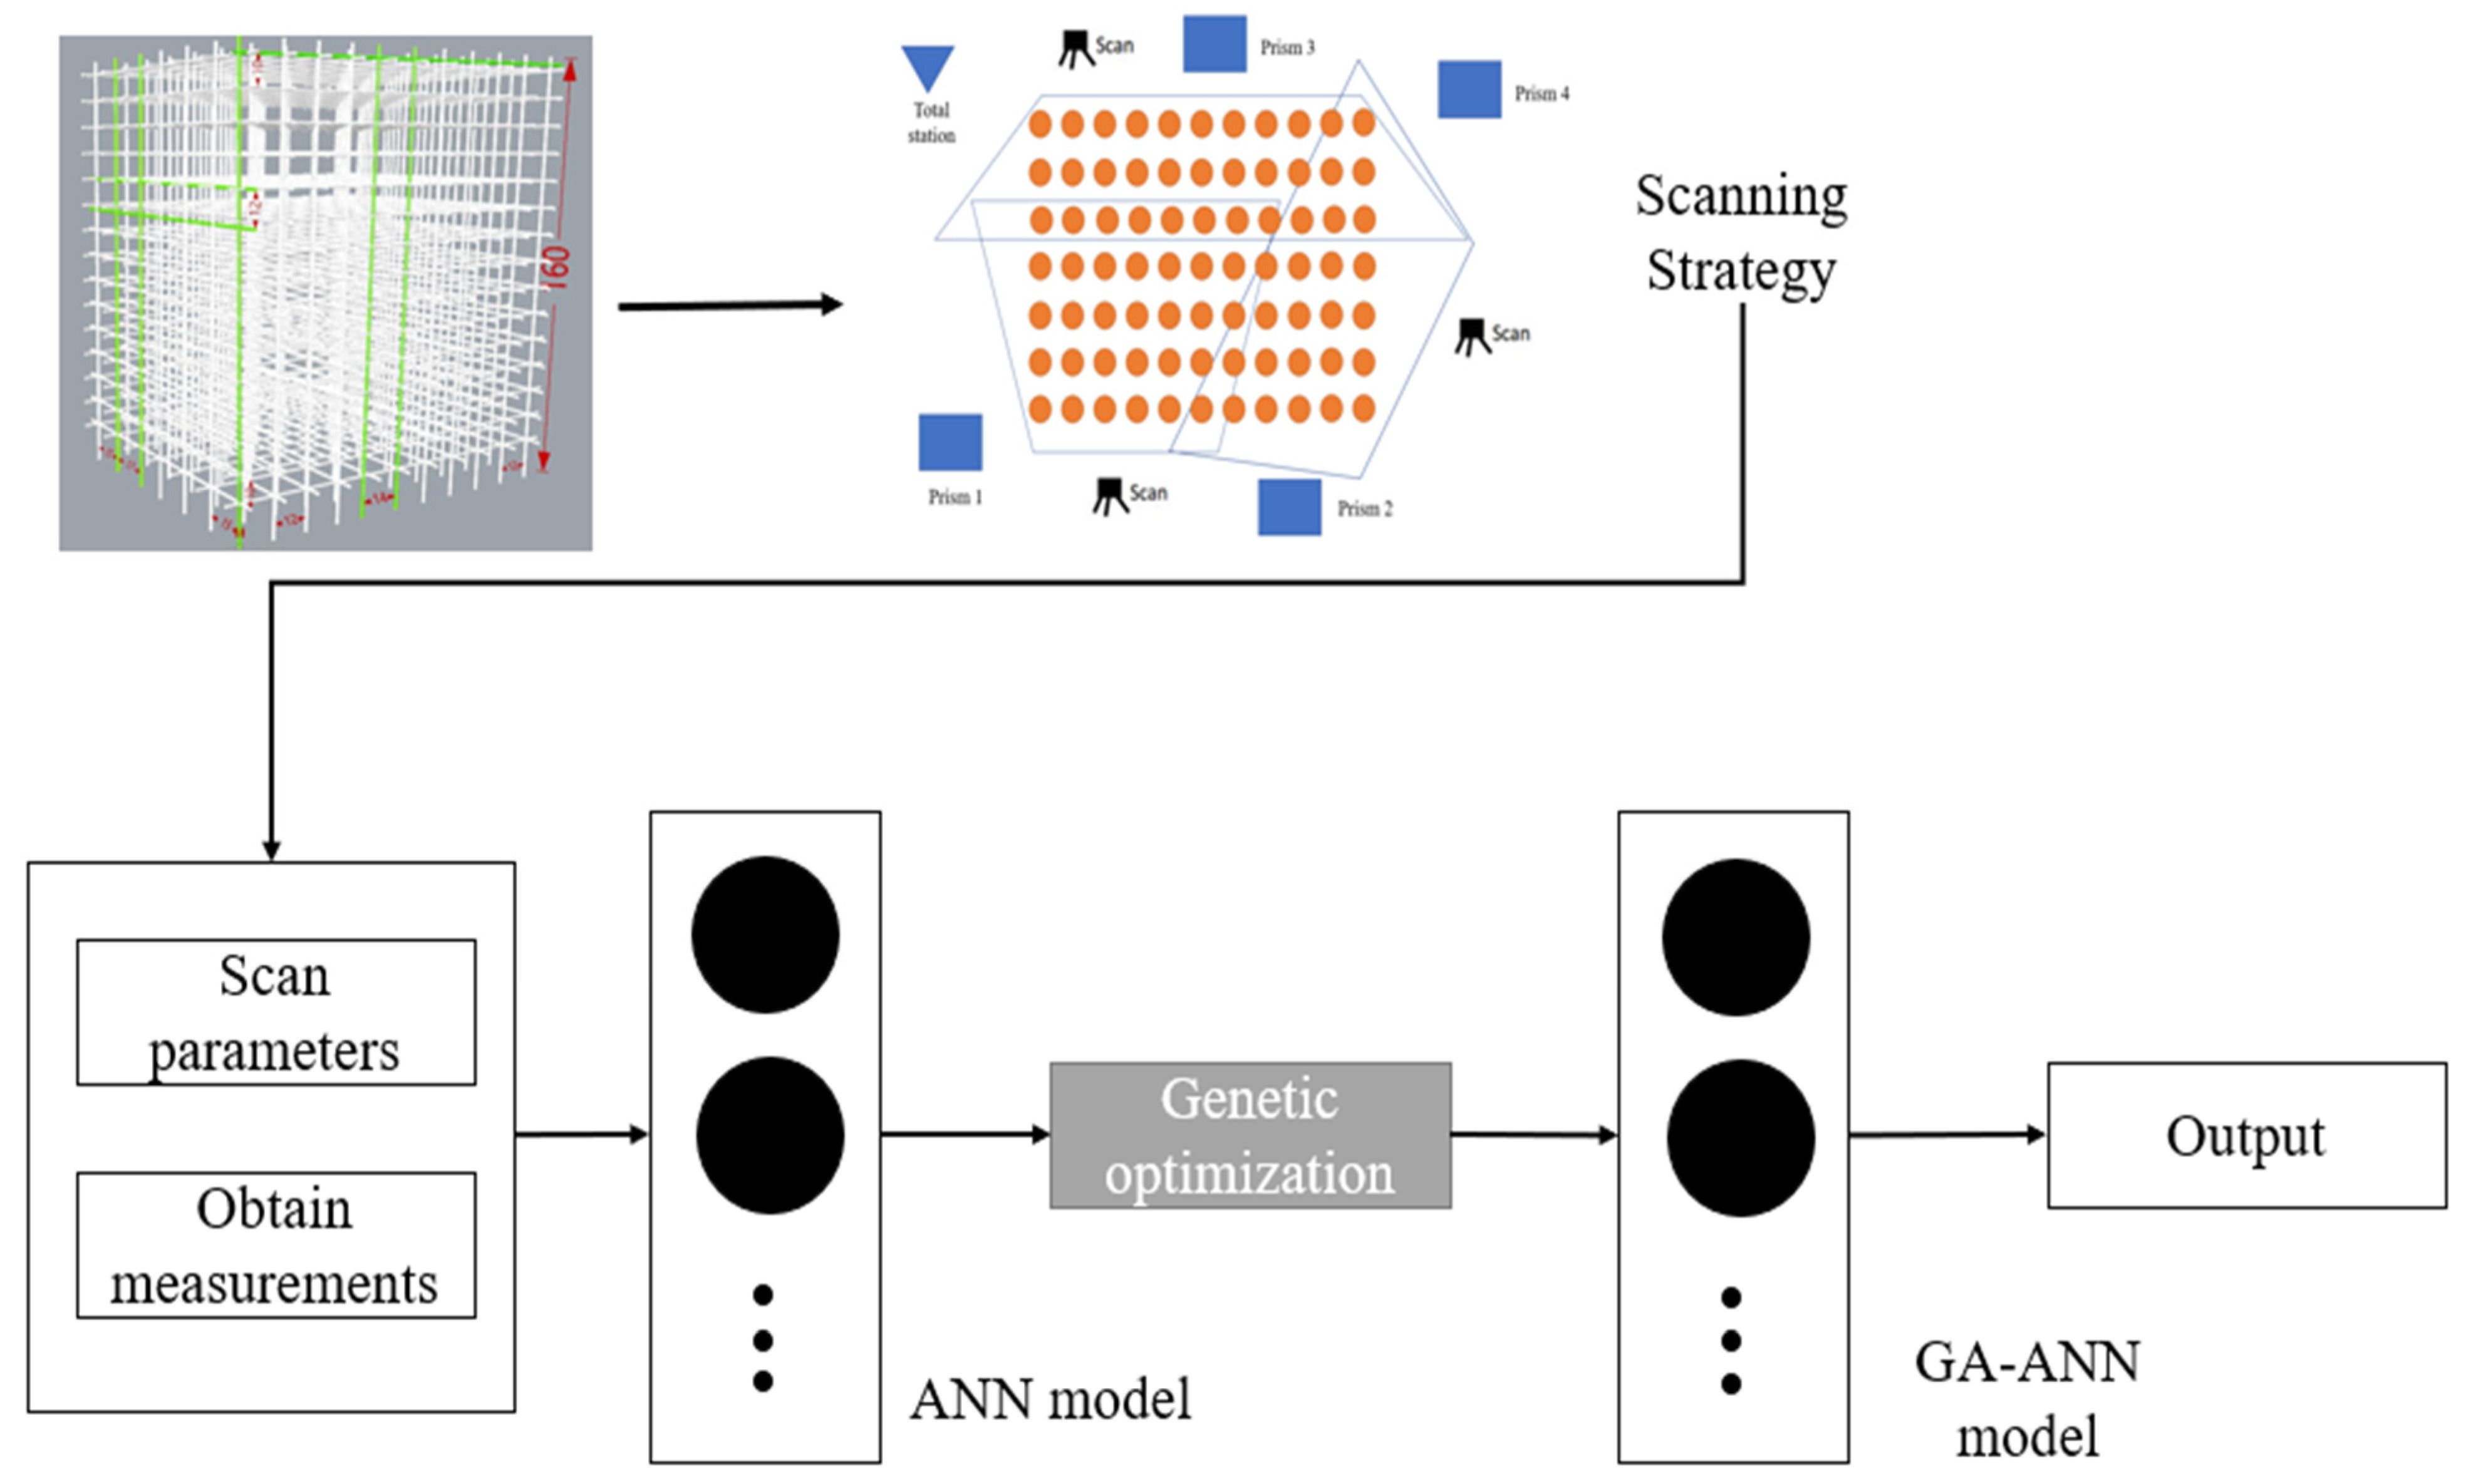
3. The Proposed Method

The proposed method used both TLS data and ANN model for evaluating installation quality for high formwork according to China building codes [8,9,10]. The major clauses of the building codes and regulations for the installation quality of high formwork are illustrated in Table 1. Therefore, the main tasks of the study are to evaluate the positions of the vertical poles, horizontal tubes, and diagonal bracing according to clauses i–iii, assess the longitudinal spacing of vertical pole according to clause iv, inspect the transverse spacing of vertical pole according to clause v, check the space between the two neighbour tubes (the lift height) according to clause vi, and check the position and the height of the bottom reinforcing tube according to clause vii.
The proposed method for installation quality assessment of high formwork is carried out in four steps. First, a small-scale high formwork model set was built in the lab and scanned to collect multi-scan data, which were then registered in a common reference system. Secondly, RGB value, symmetry of the structure and shape fitting algorithm were used to extract the poles and tubes of the model set and all the cross-points of the poles and tubes were generated. After that, the model set was positioned on a moving equipment and moved along the X, Y and Z axes, from 1 mm to 10 mm at interval 1 mm, respectively. The model set was scanned at every movement in order to collect sufficient scan data for developing an ANN model that can help to generate accurate coordinates of the cross points at the millimetre level. Finally, another small-scale high formwork model set was established in the lab to validate the efficiency of the proposed method. The flowchart of the proposed method is described in Figure 1. The details of the four steps are illustrated as follows.

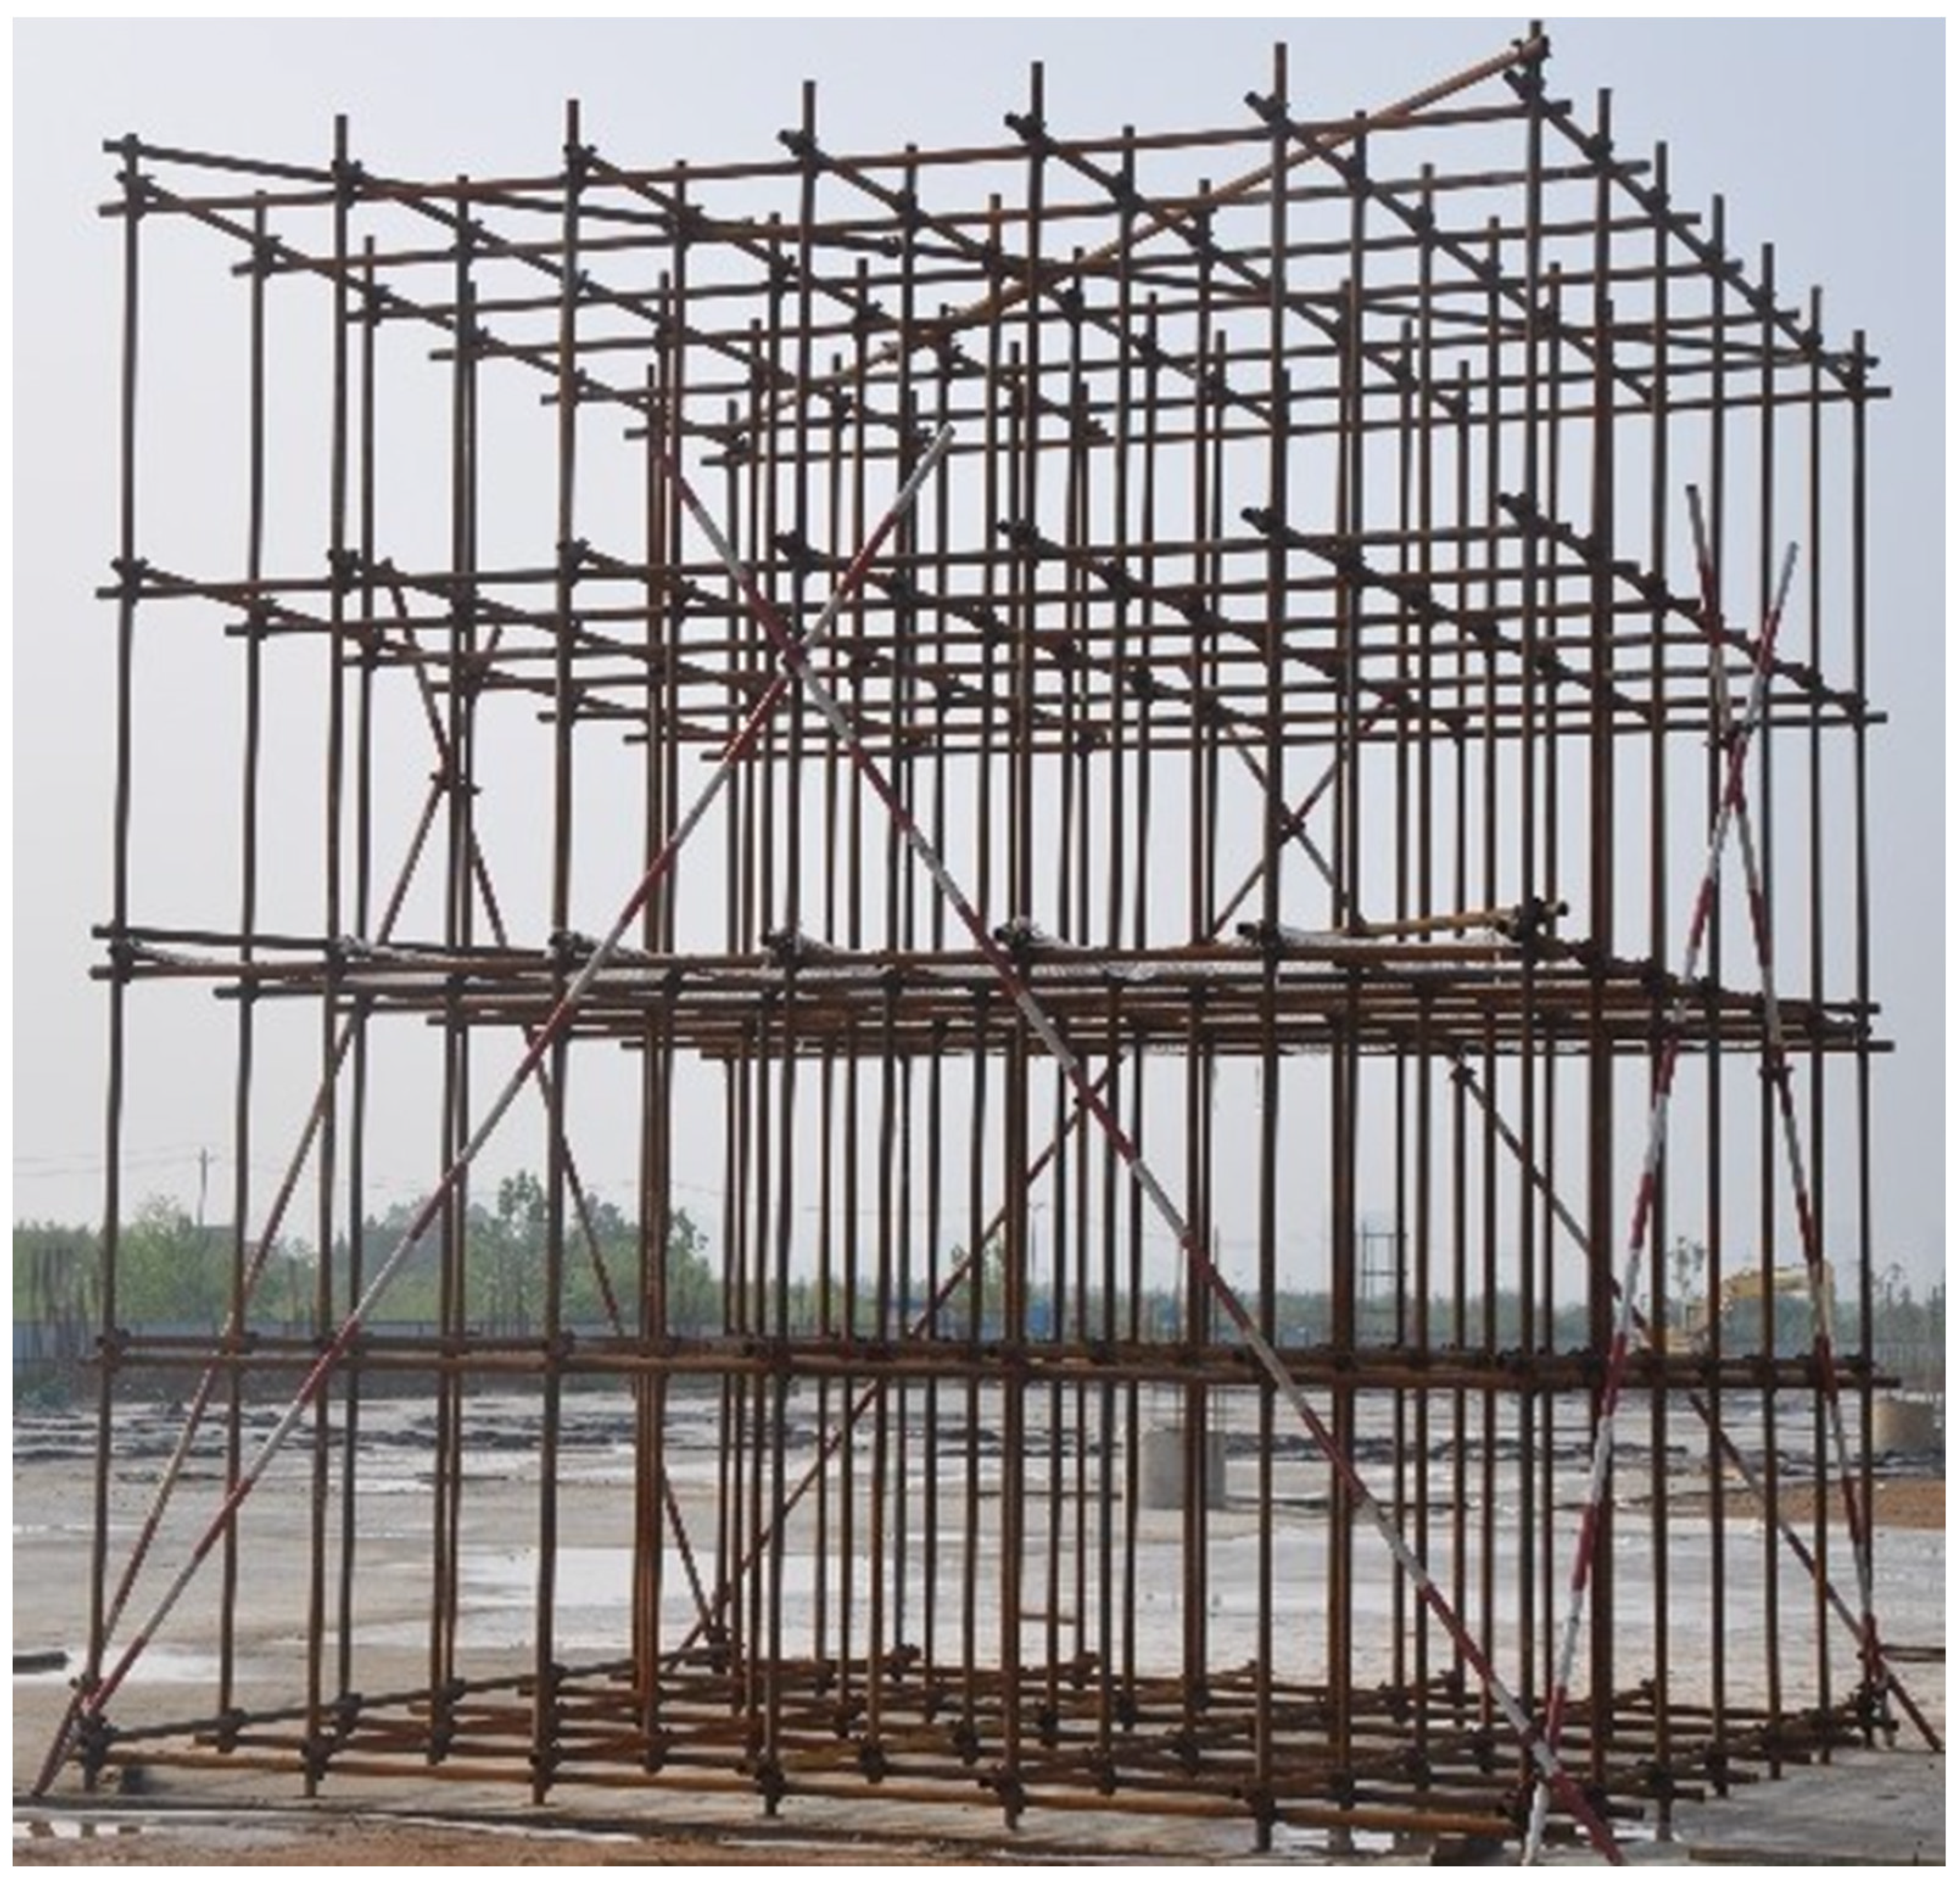
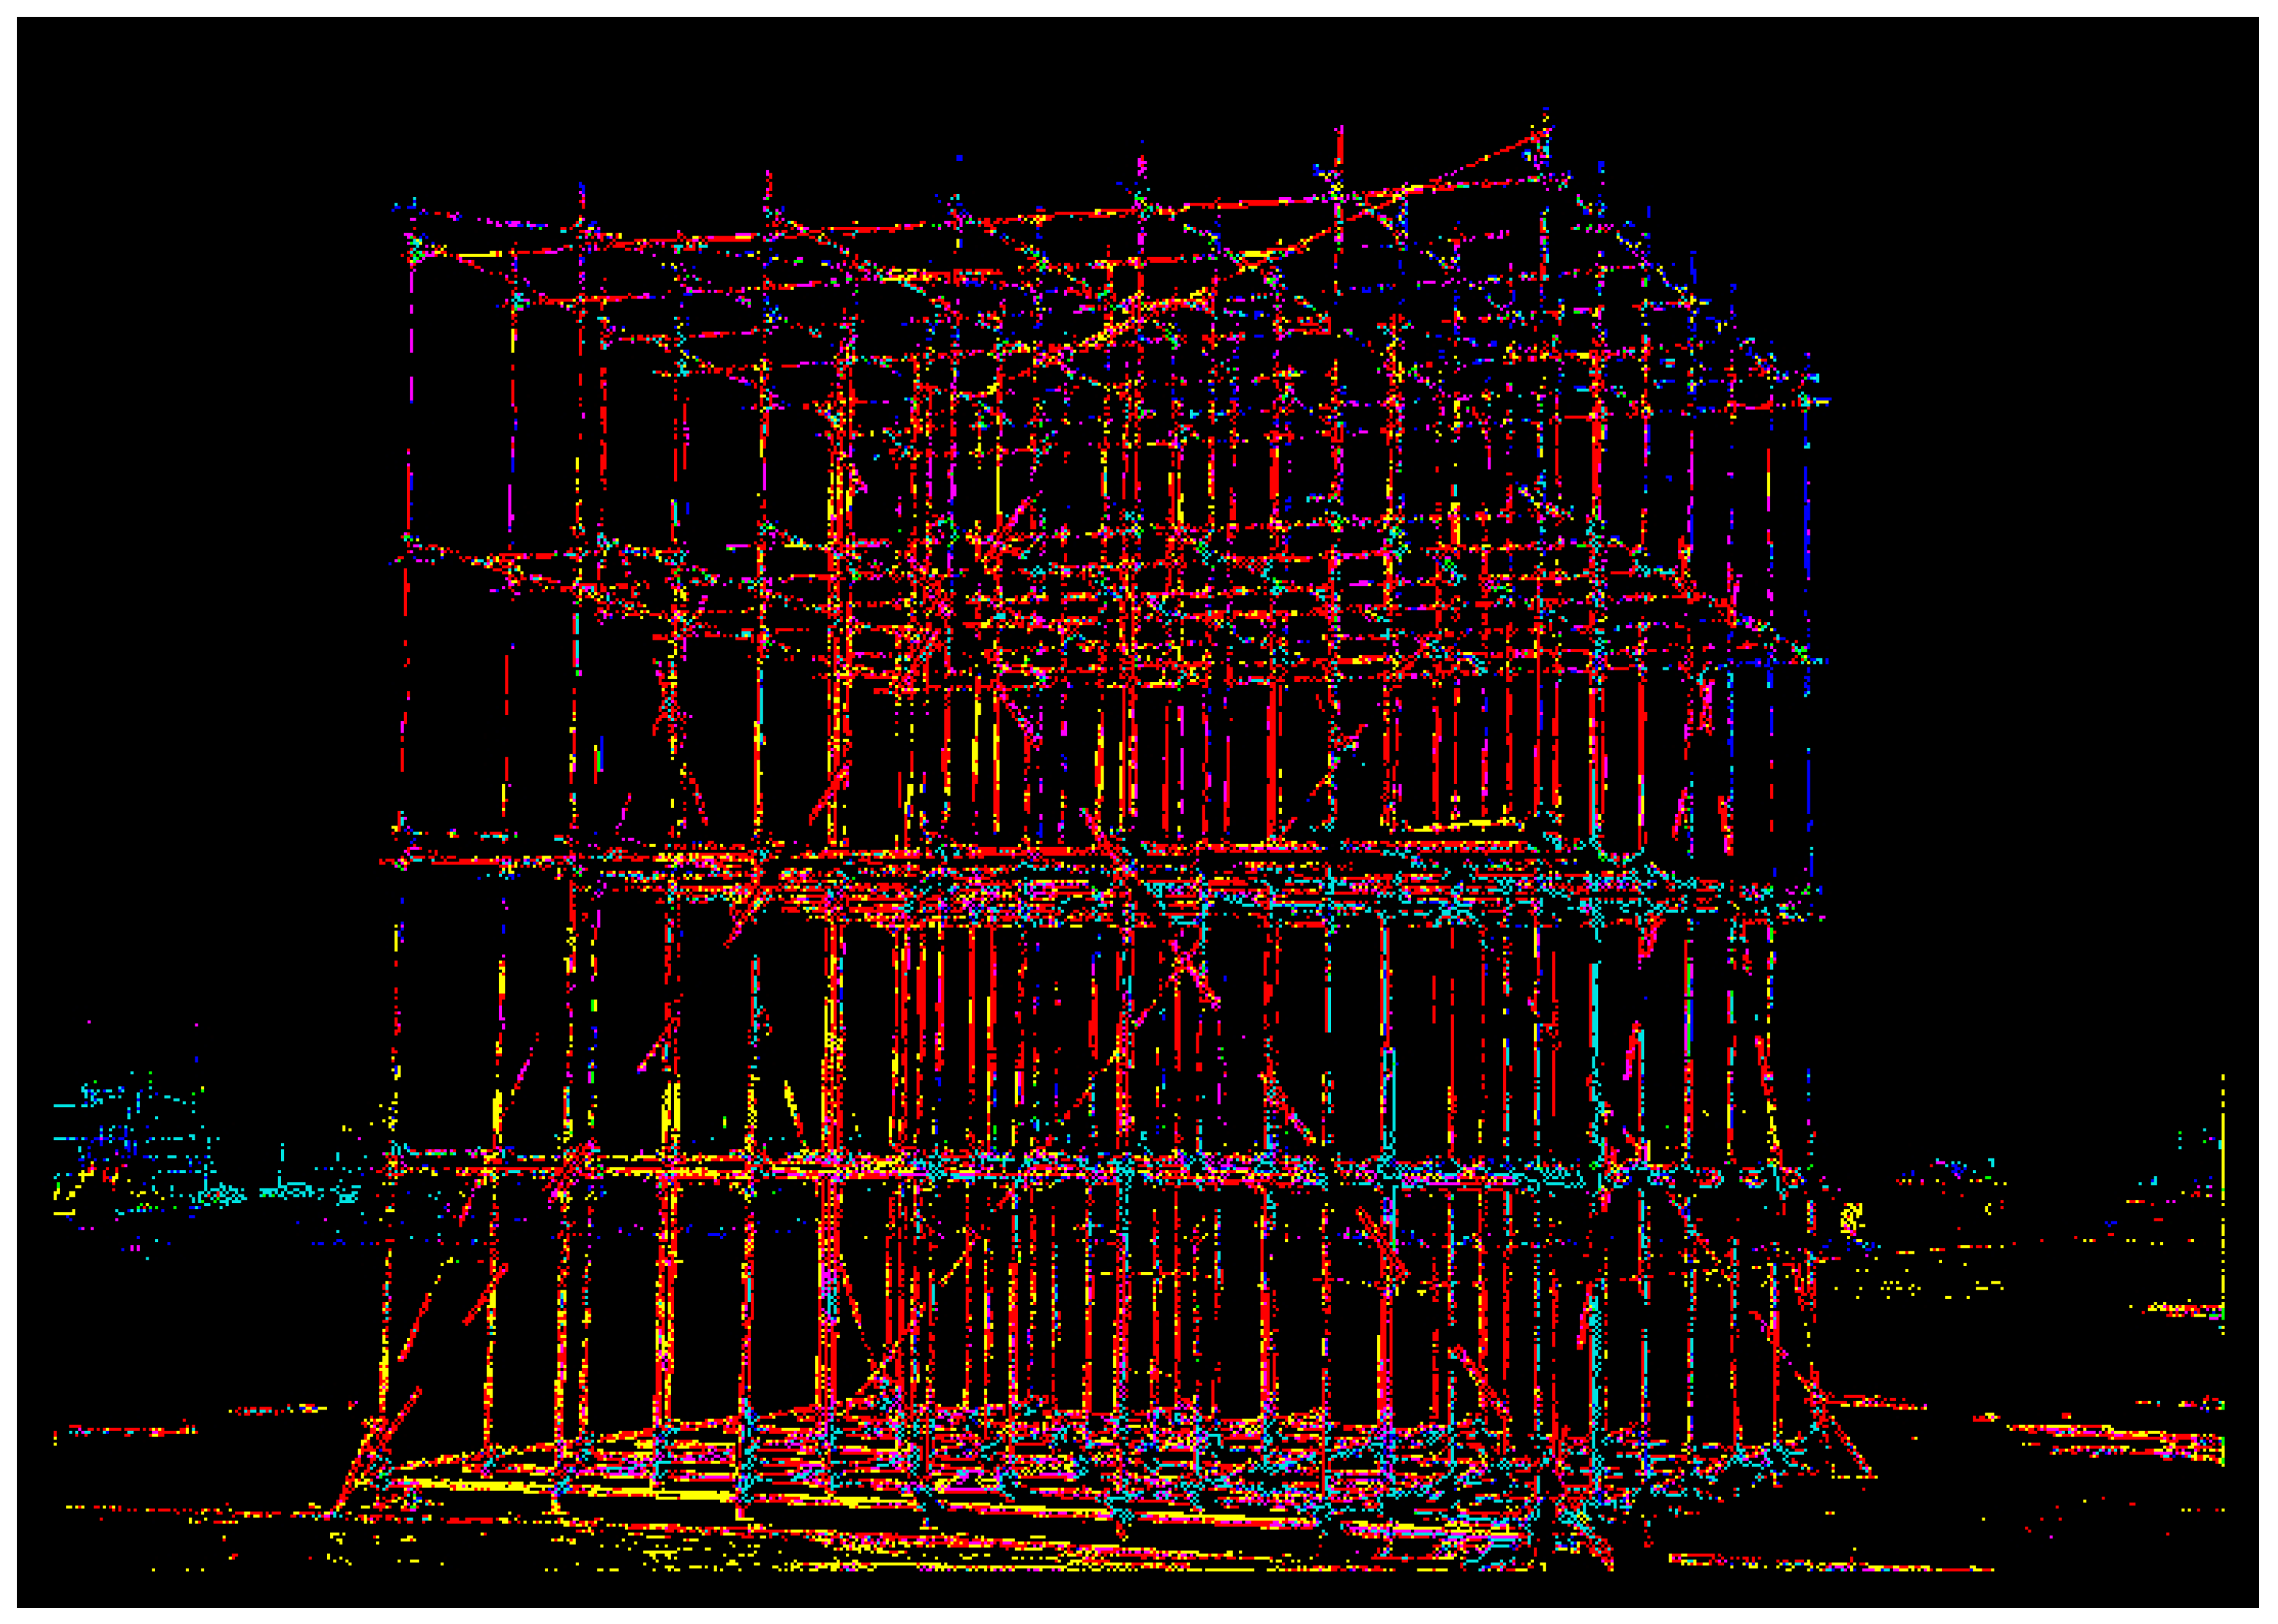
3.1. Scan Data Obtainment

The model set is a length 1.3 m × width 1.0 m × height 1.6 m formwork, consisting of steel vertical poles and horizontal tubes. The model set contains 77 standard poles and 270 tubes. The steel bars are connected via couplers, the longitudinal spacing of vertical pole is set as 12 cm, the transverse spacing of pole is 15 cm, and the lift height (the distance between two neighbouring tubes) is 10 cm. The simulated defects were purposefully set including: the leftmost longitudinal pole is not vertical to the ground but inclined 1 degree; the first top longitudinal tube is not parallel to the ground and is inclined 1 degree; the distance between the 5th and 6th longitudinal poles on the front side is 14 cm; the distance between the 5th and 6th transverse poles on the leftmost side is 17 cm; and the space between the 10th and 11th transverse tubes on the leftmost side is 12 cm. The details of the formwork dimensions are shown in Figure 2.

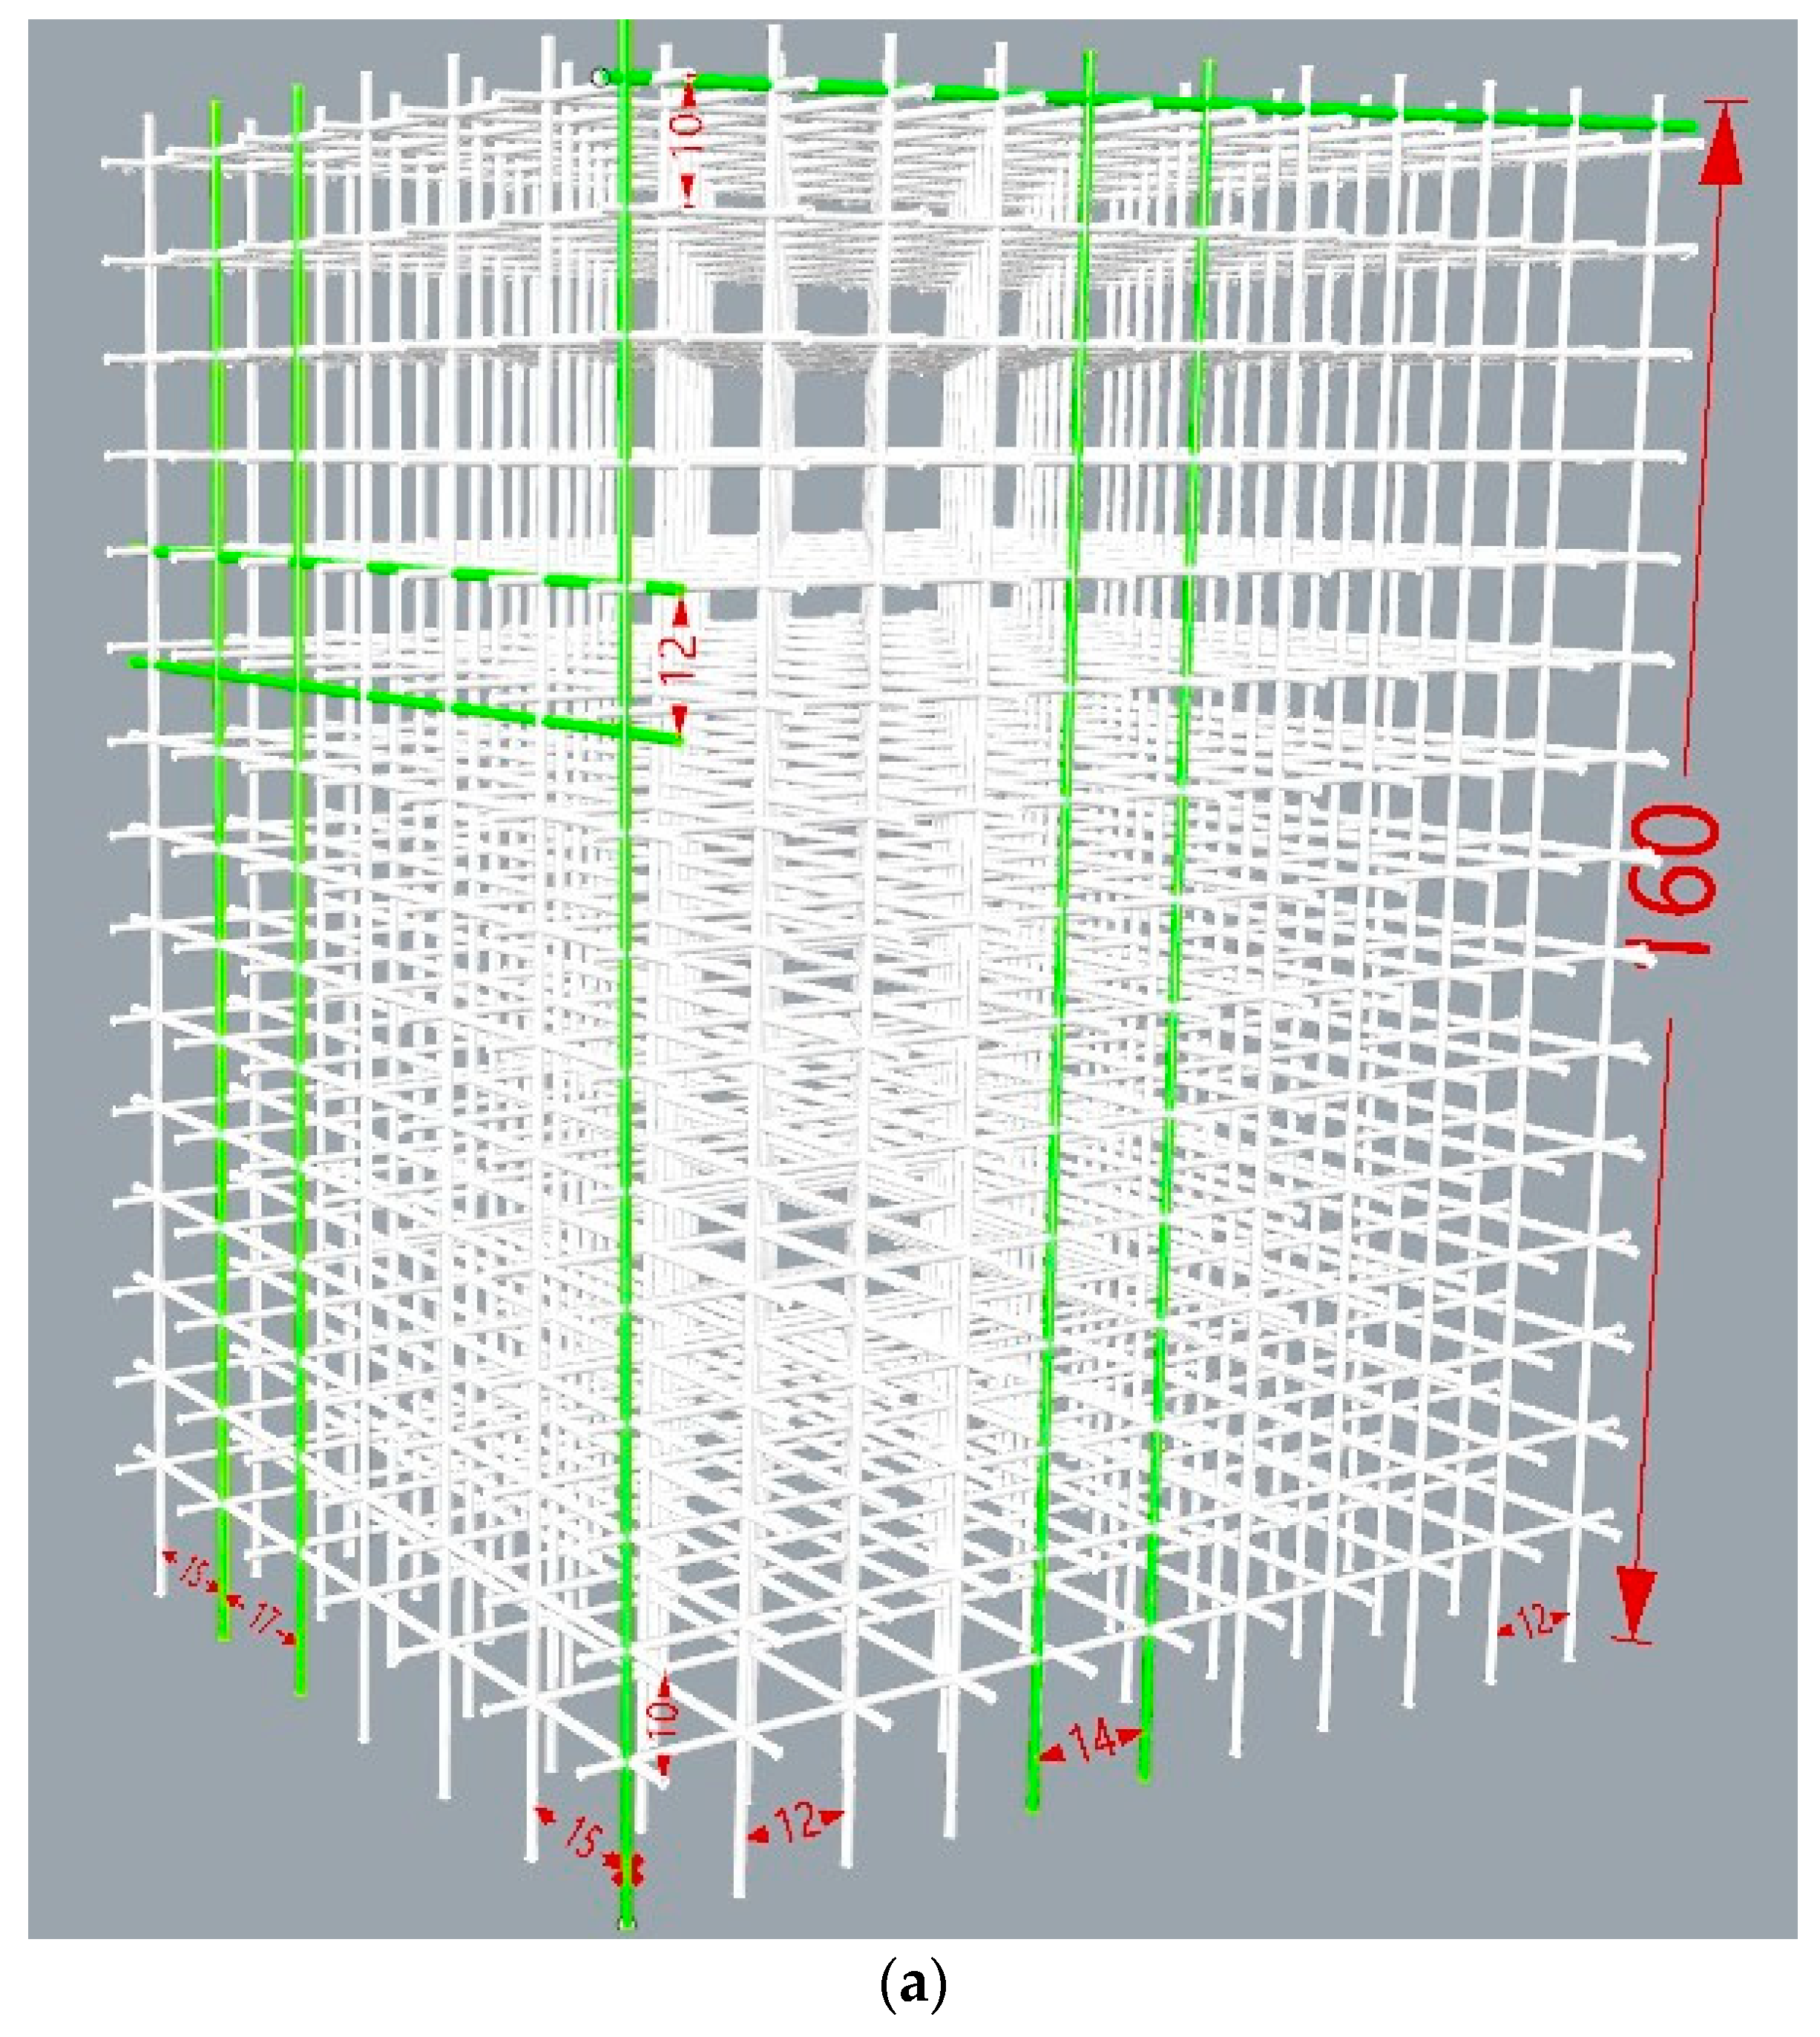
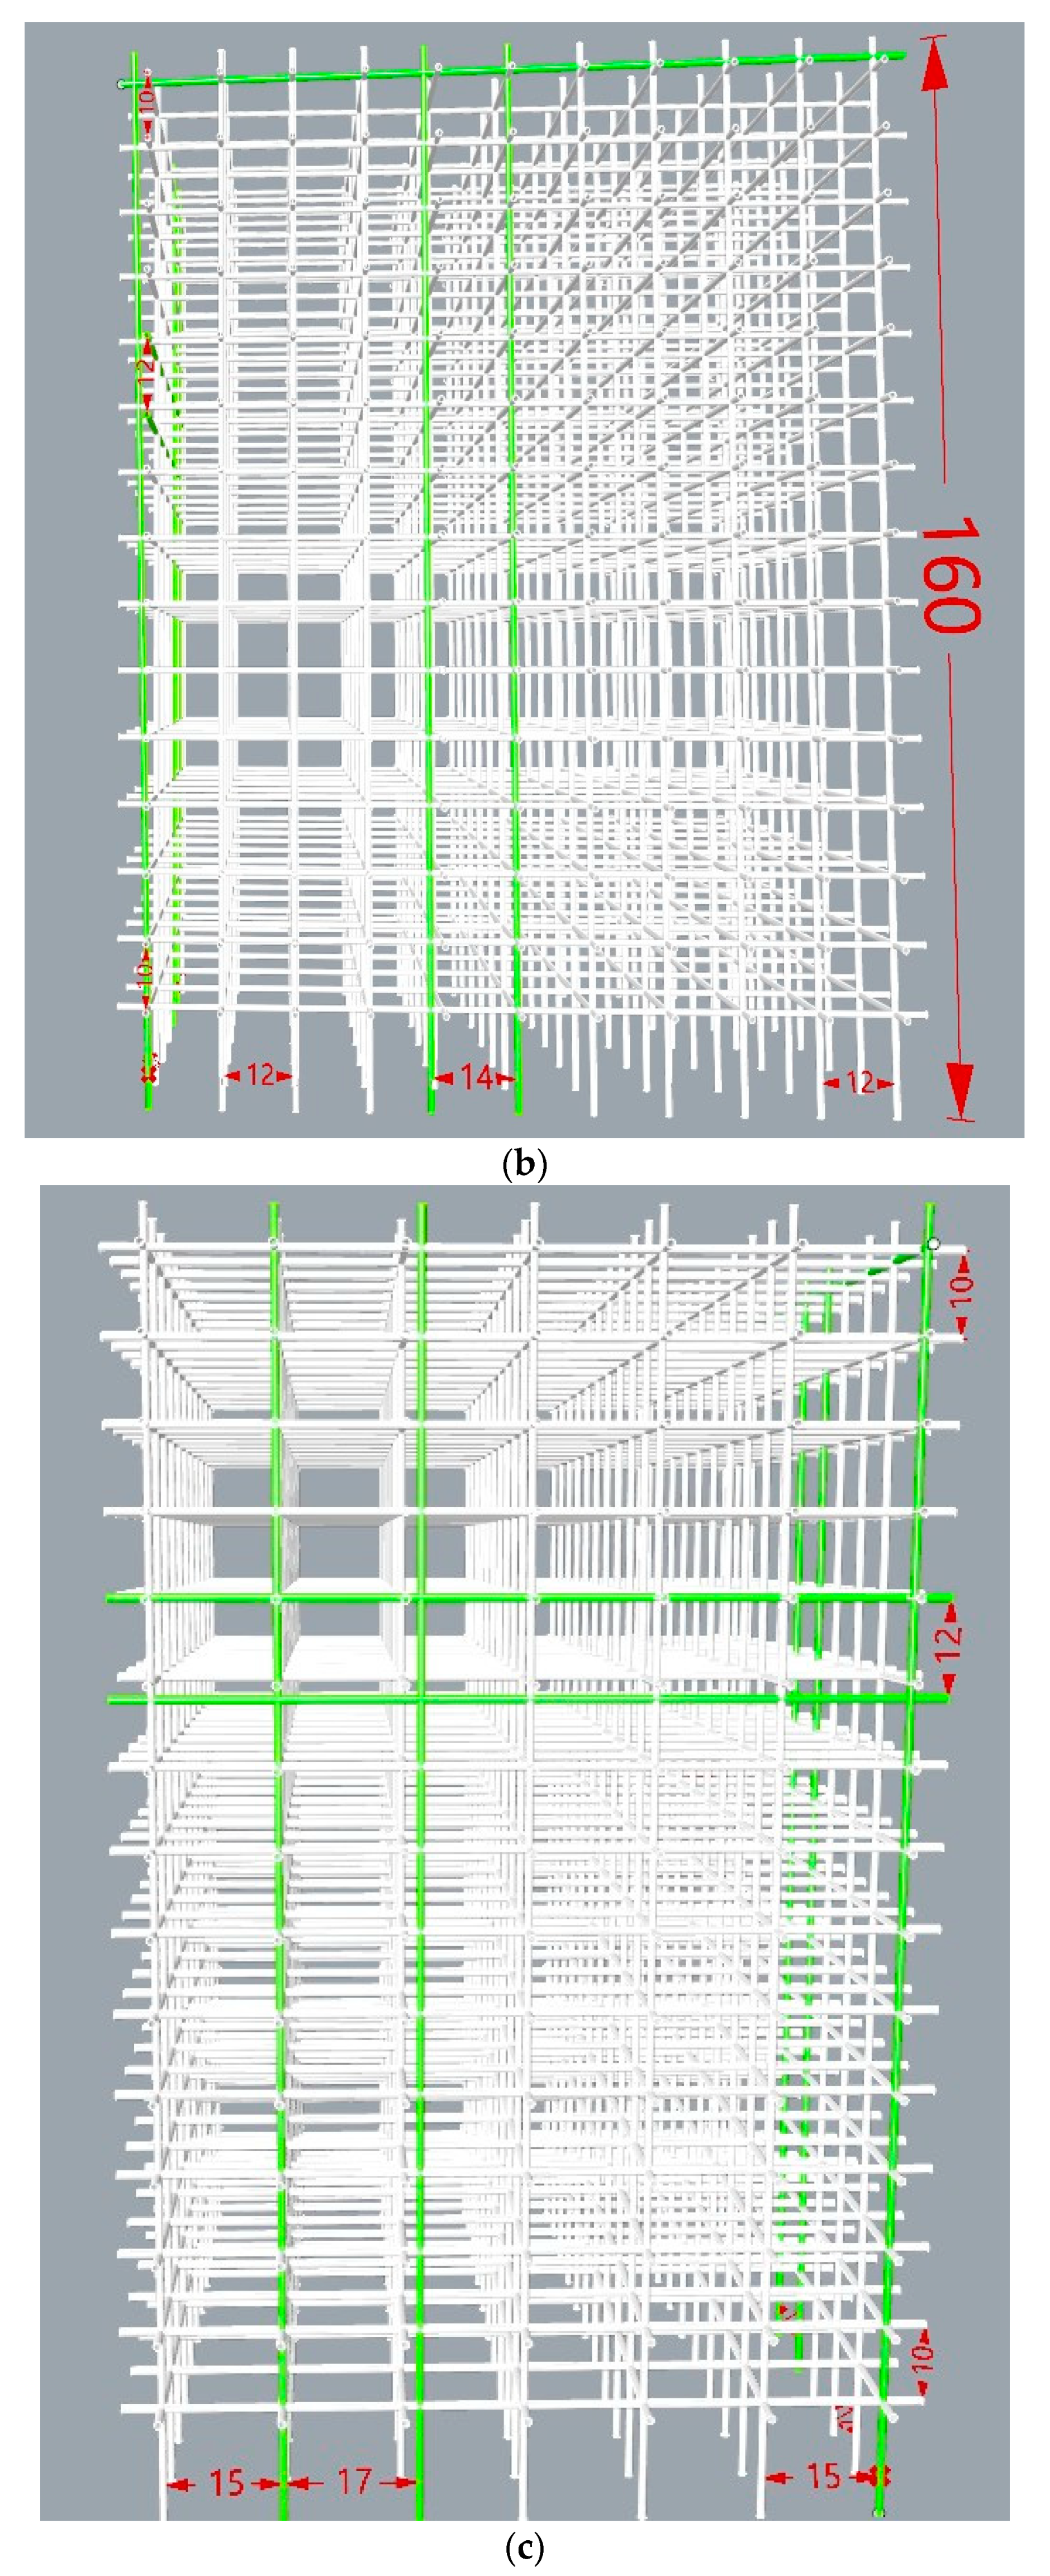
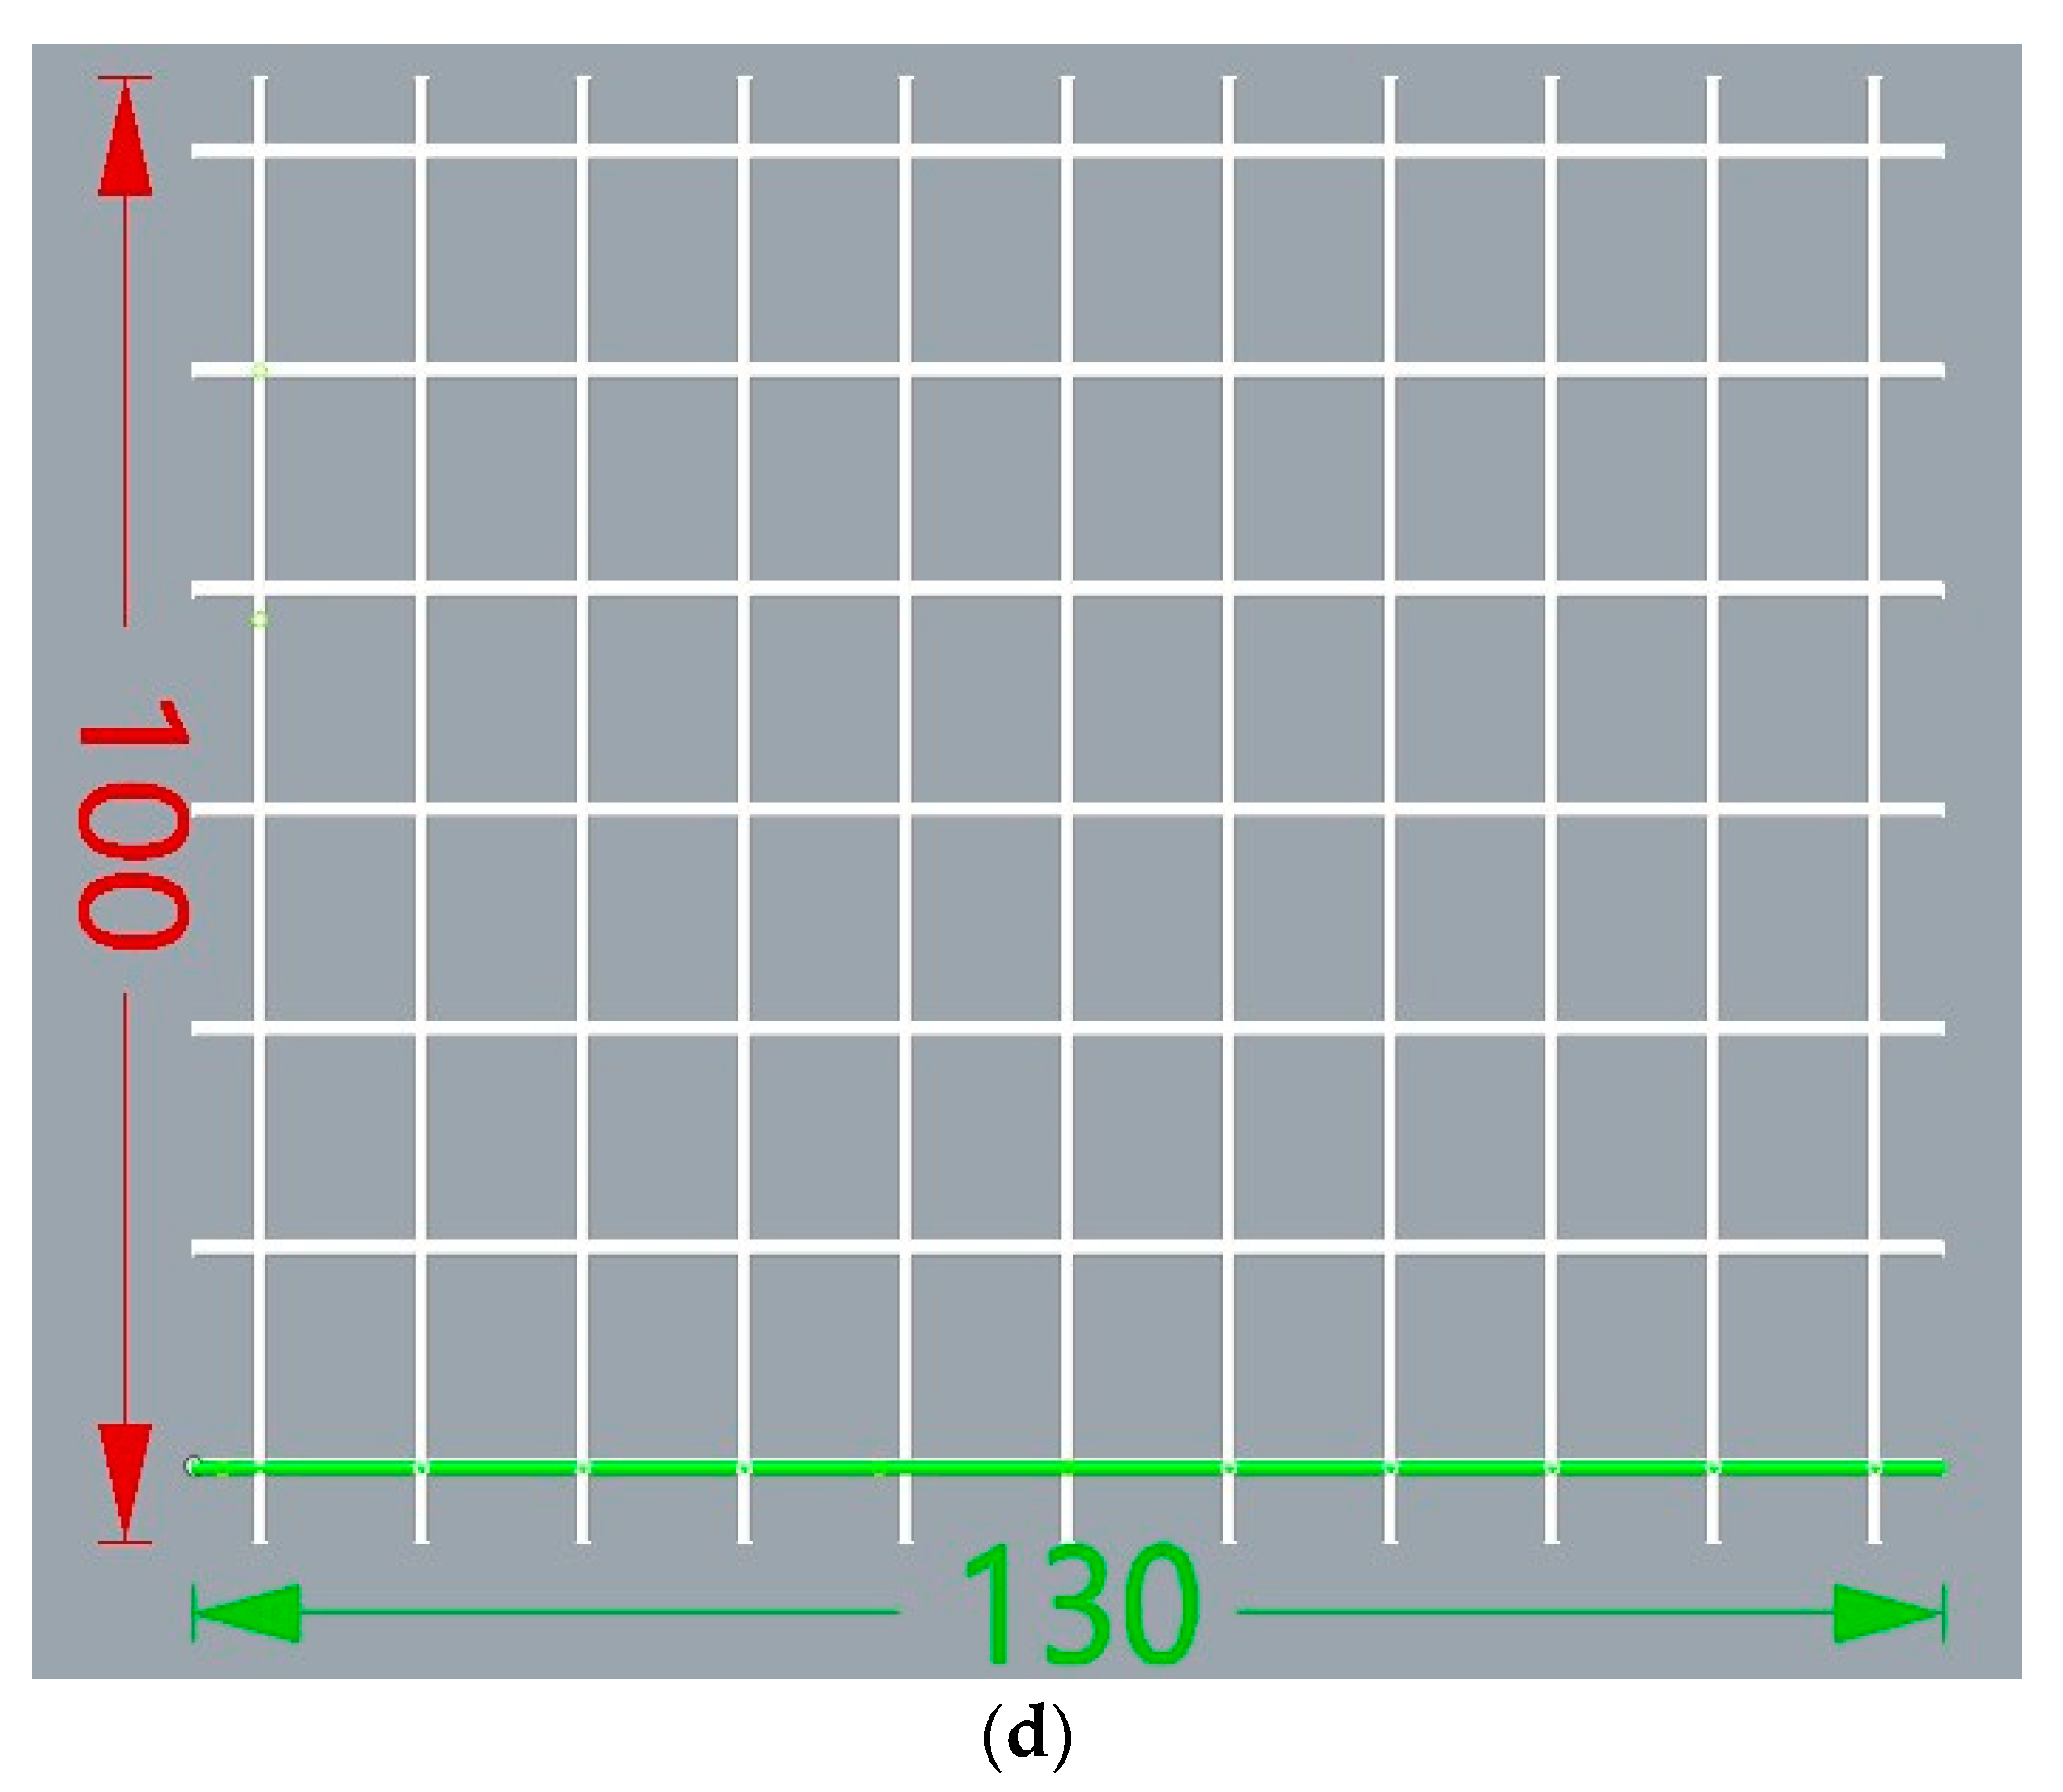
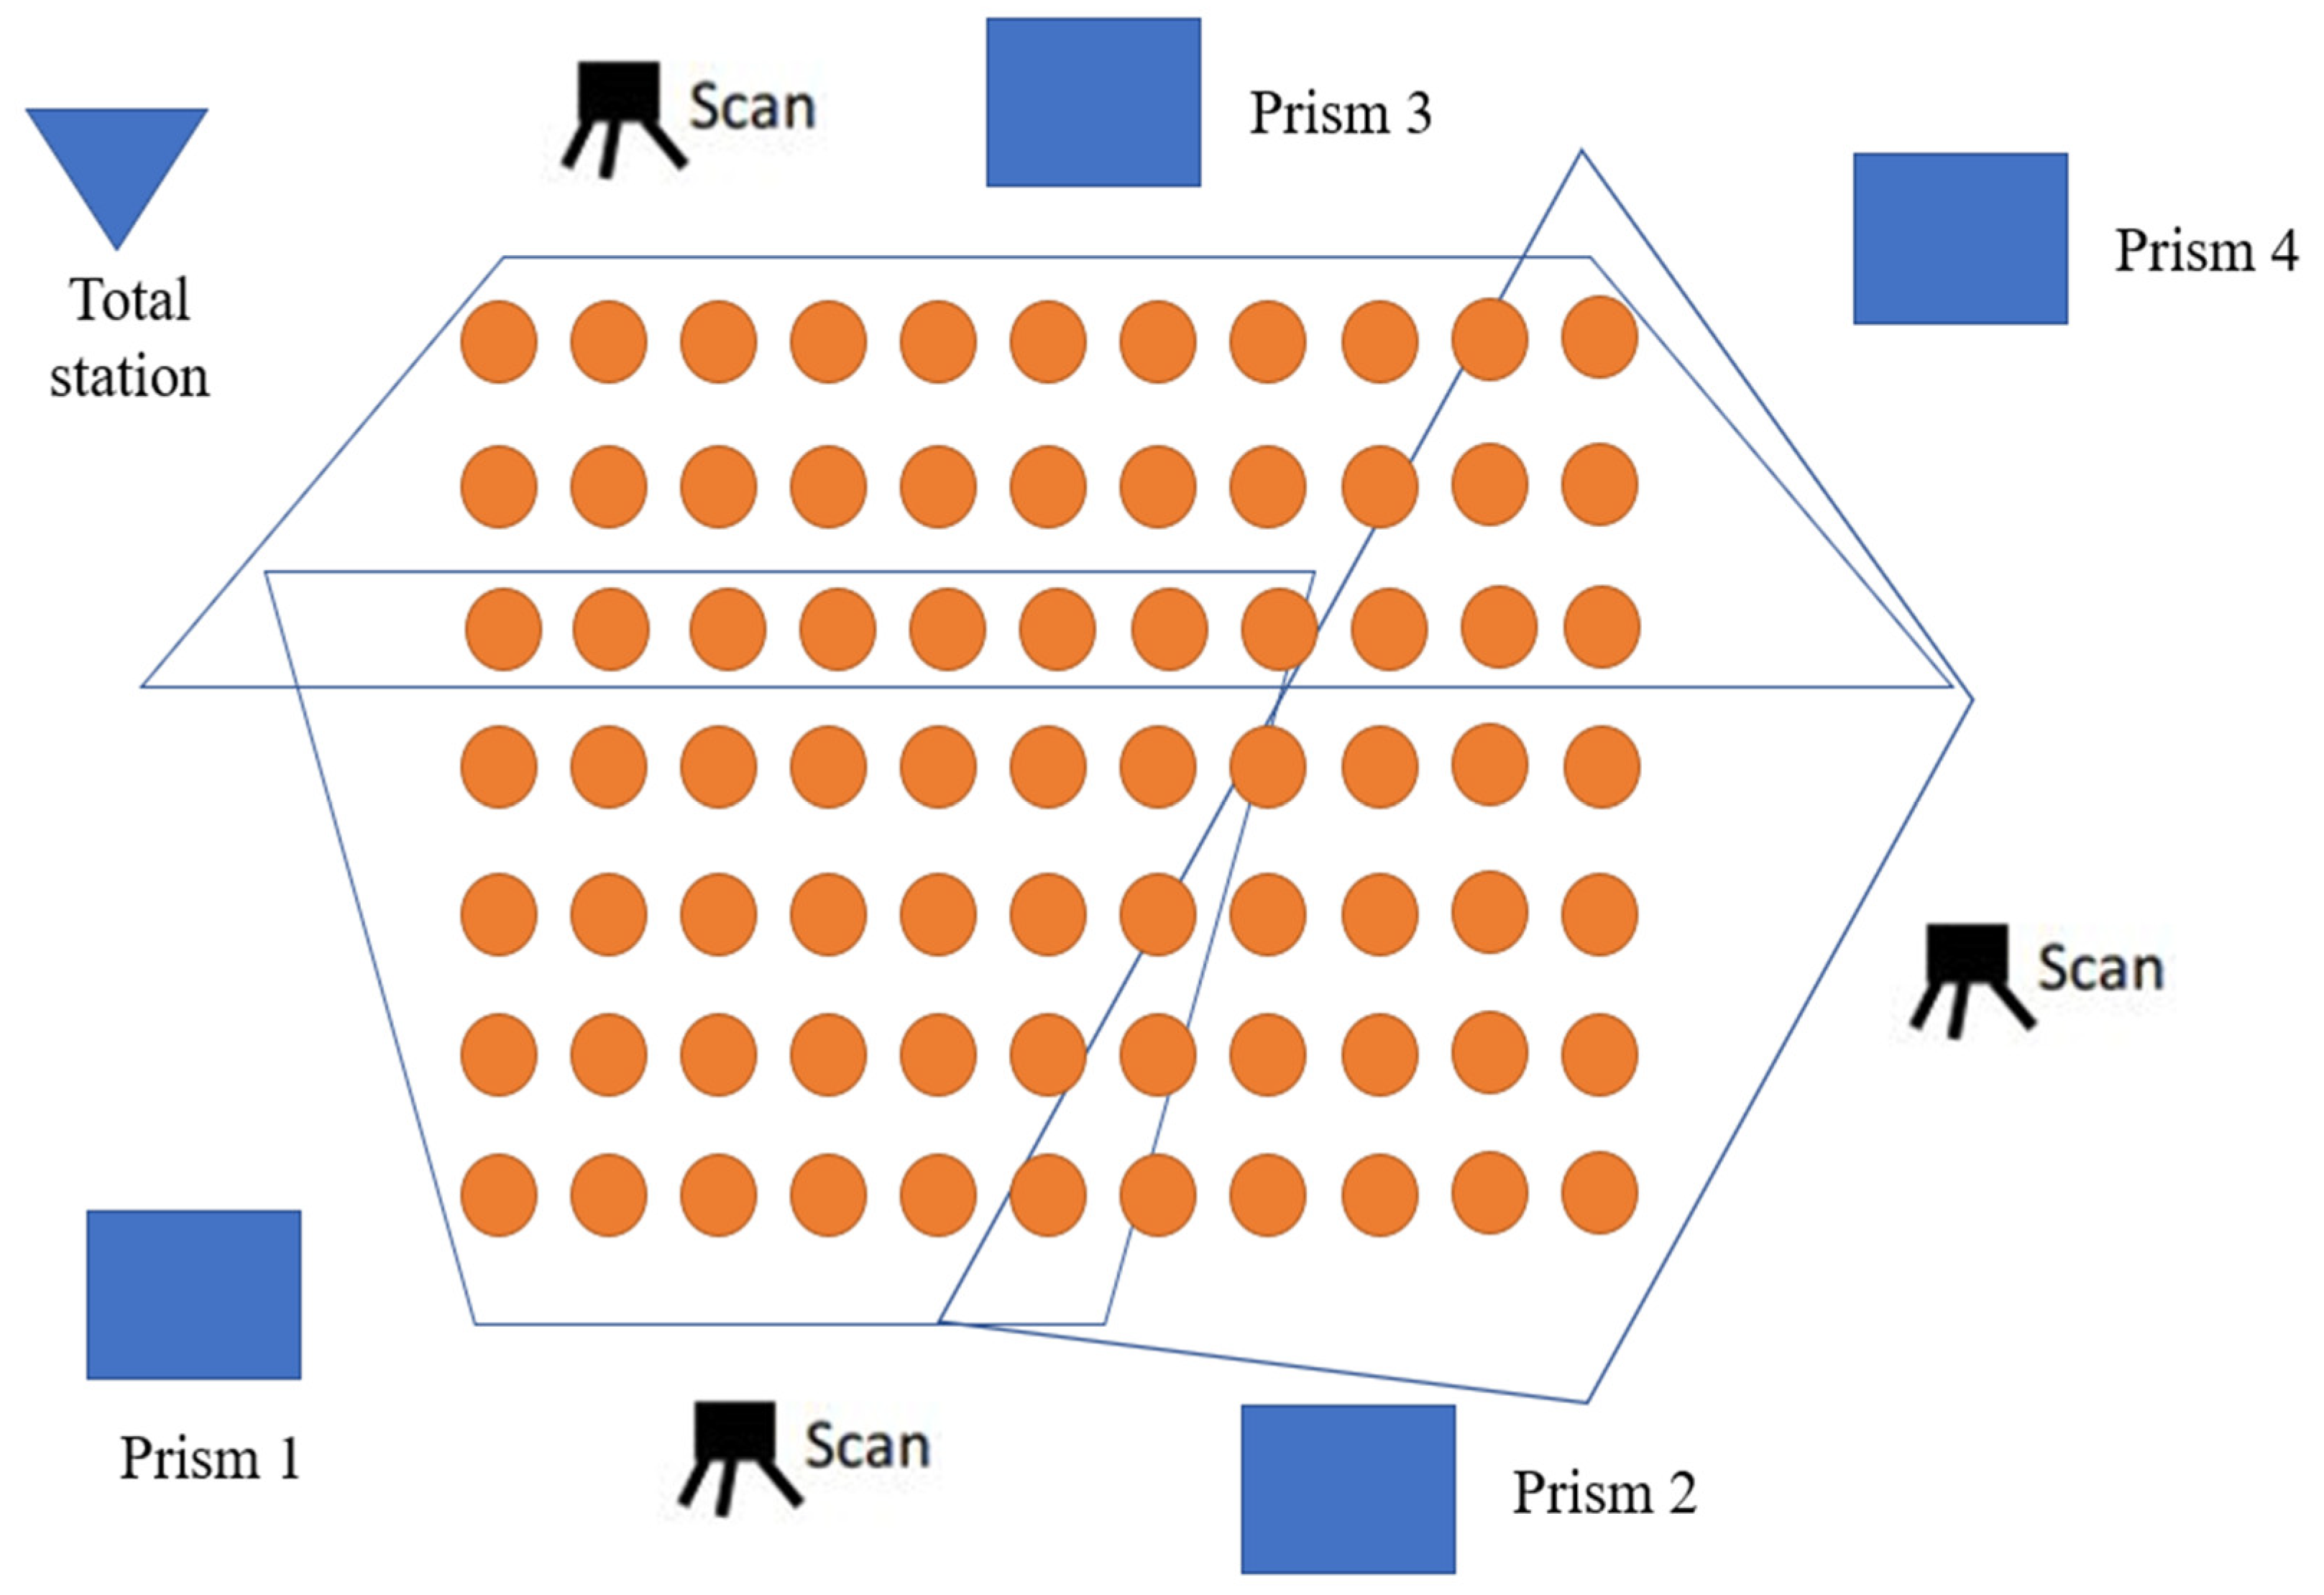
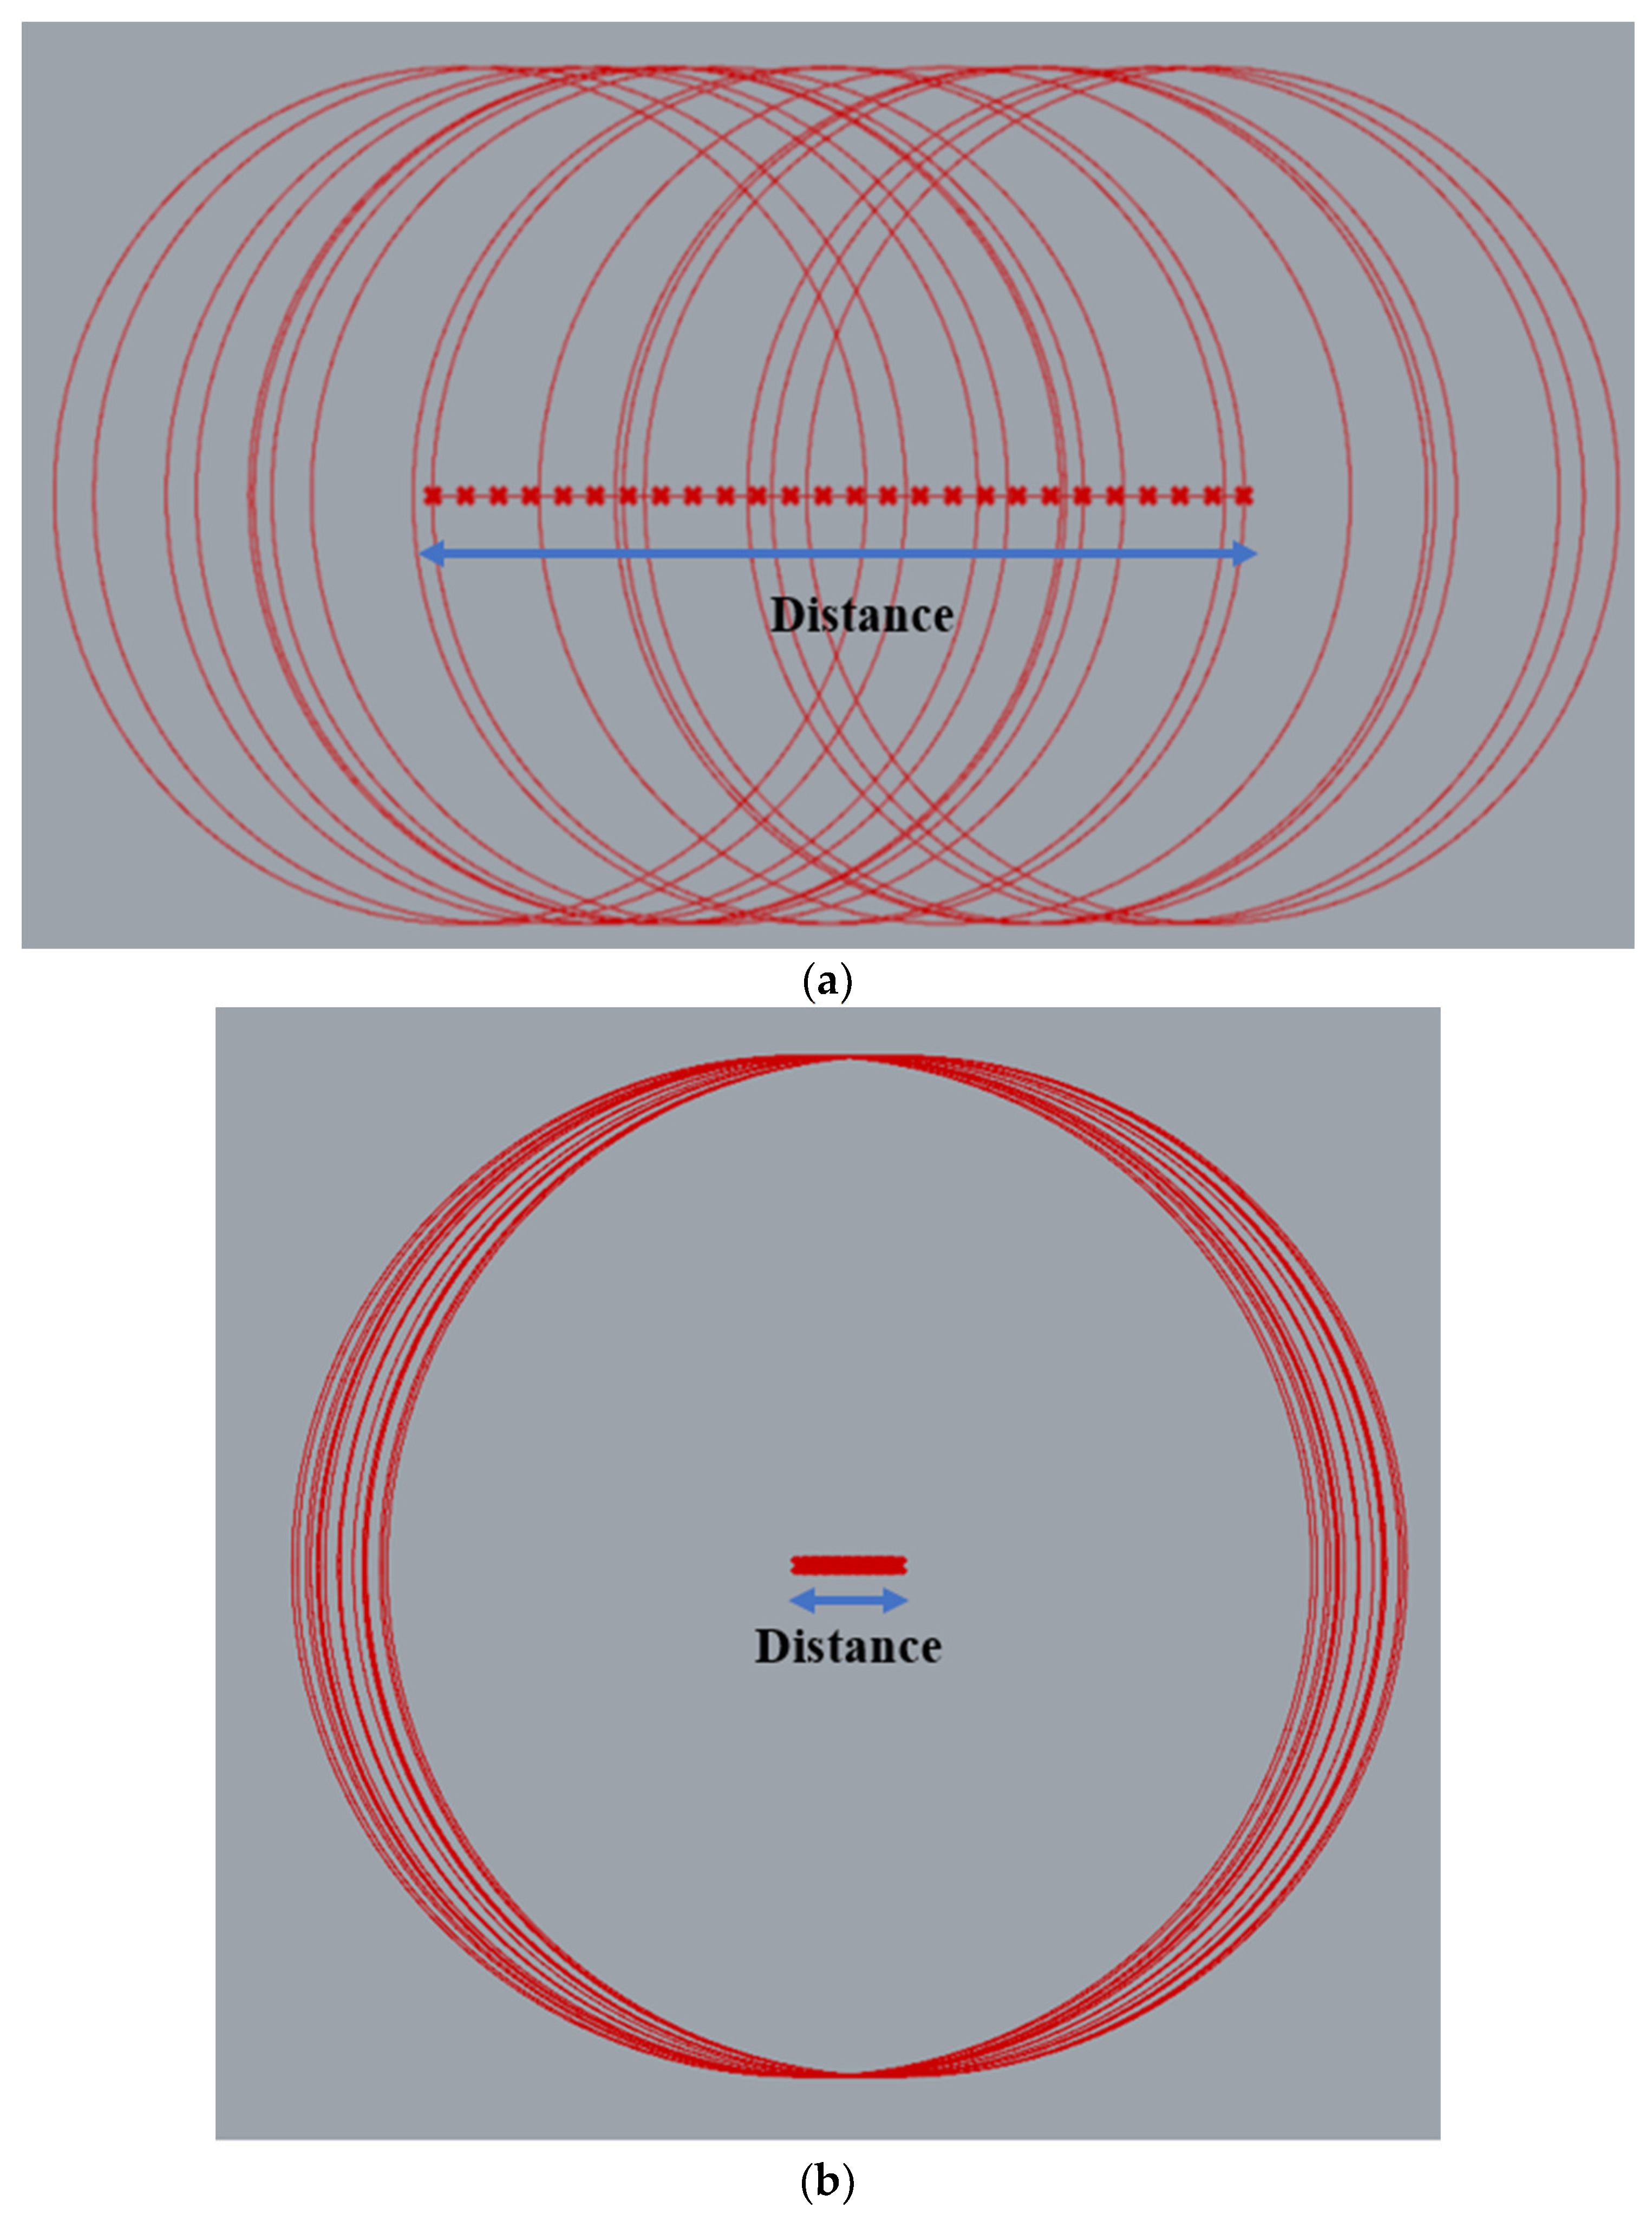
3.1.1. Scan Strategy

The small-scale high formwork model set located on a moving equipment, the scanning position, and the control points for the laboratory trial are shown in Figure 3. The moving equipment can move freely along X, Y, and Z direction at submillimetre level. Targets were used for post-processing data registration in a common reference frame. A Trimble total station was used to survey control points and targets in order to build a control network. The observations were adjusted to minimize the errors. The resulting coordinates were corrected to within 1 mm. The Trimble TX5 3D laser scanner was used to carry out the scans and collect point cloud data. The small-scale model located on the moving equipment move from 1 mm to 10 mm at interval 1 mm along X, Y, and Z directions, respectively. In every 1 mm movement, the model was scanned once, and thus, the model was scanned 30 times in total.

3.1.2. Data Registration and Noise Removal

After the completion of the scan of the small-scale high formwork model set, it was necessary to conduct post processing of the raw point cloud data. Co-registration of multiple point clouds in a unit reference frame is important for further data processing. Two methods are usually adopted: homologous points identification and surface matching [54]. Homologous points identification needs several points indicated a same object that can be identified without spatial ambiguity in subsequent point clouds. Hence, targets-based registration was used in this study. A control network with more stable points should be established in order to periodically observe the targets and verify their stability. In this study, four stable locations were identified as TLS targets in such a way that they were geometrically well distributed.
The scans were registered using the targets and Iterative Closet Point (ICP) adjustment. The details of the ICP algorithm can be found in the study of Besl and McKay [55] and in the study of Sgrenzaroli and Wolfart [56]. The data processing was conducted using algorithms implemented in the scanner combined software JRC 3D Reconstructor. The combined software not only registers the multiple scans data but can also remove the noise data and reduce the data density to facilitate further data processing. Alternatively, point clouds data can be exported in many formats like ASCII for post processing in MATLAB.

3.2. Data Extraction

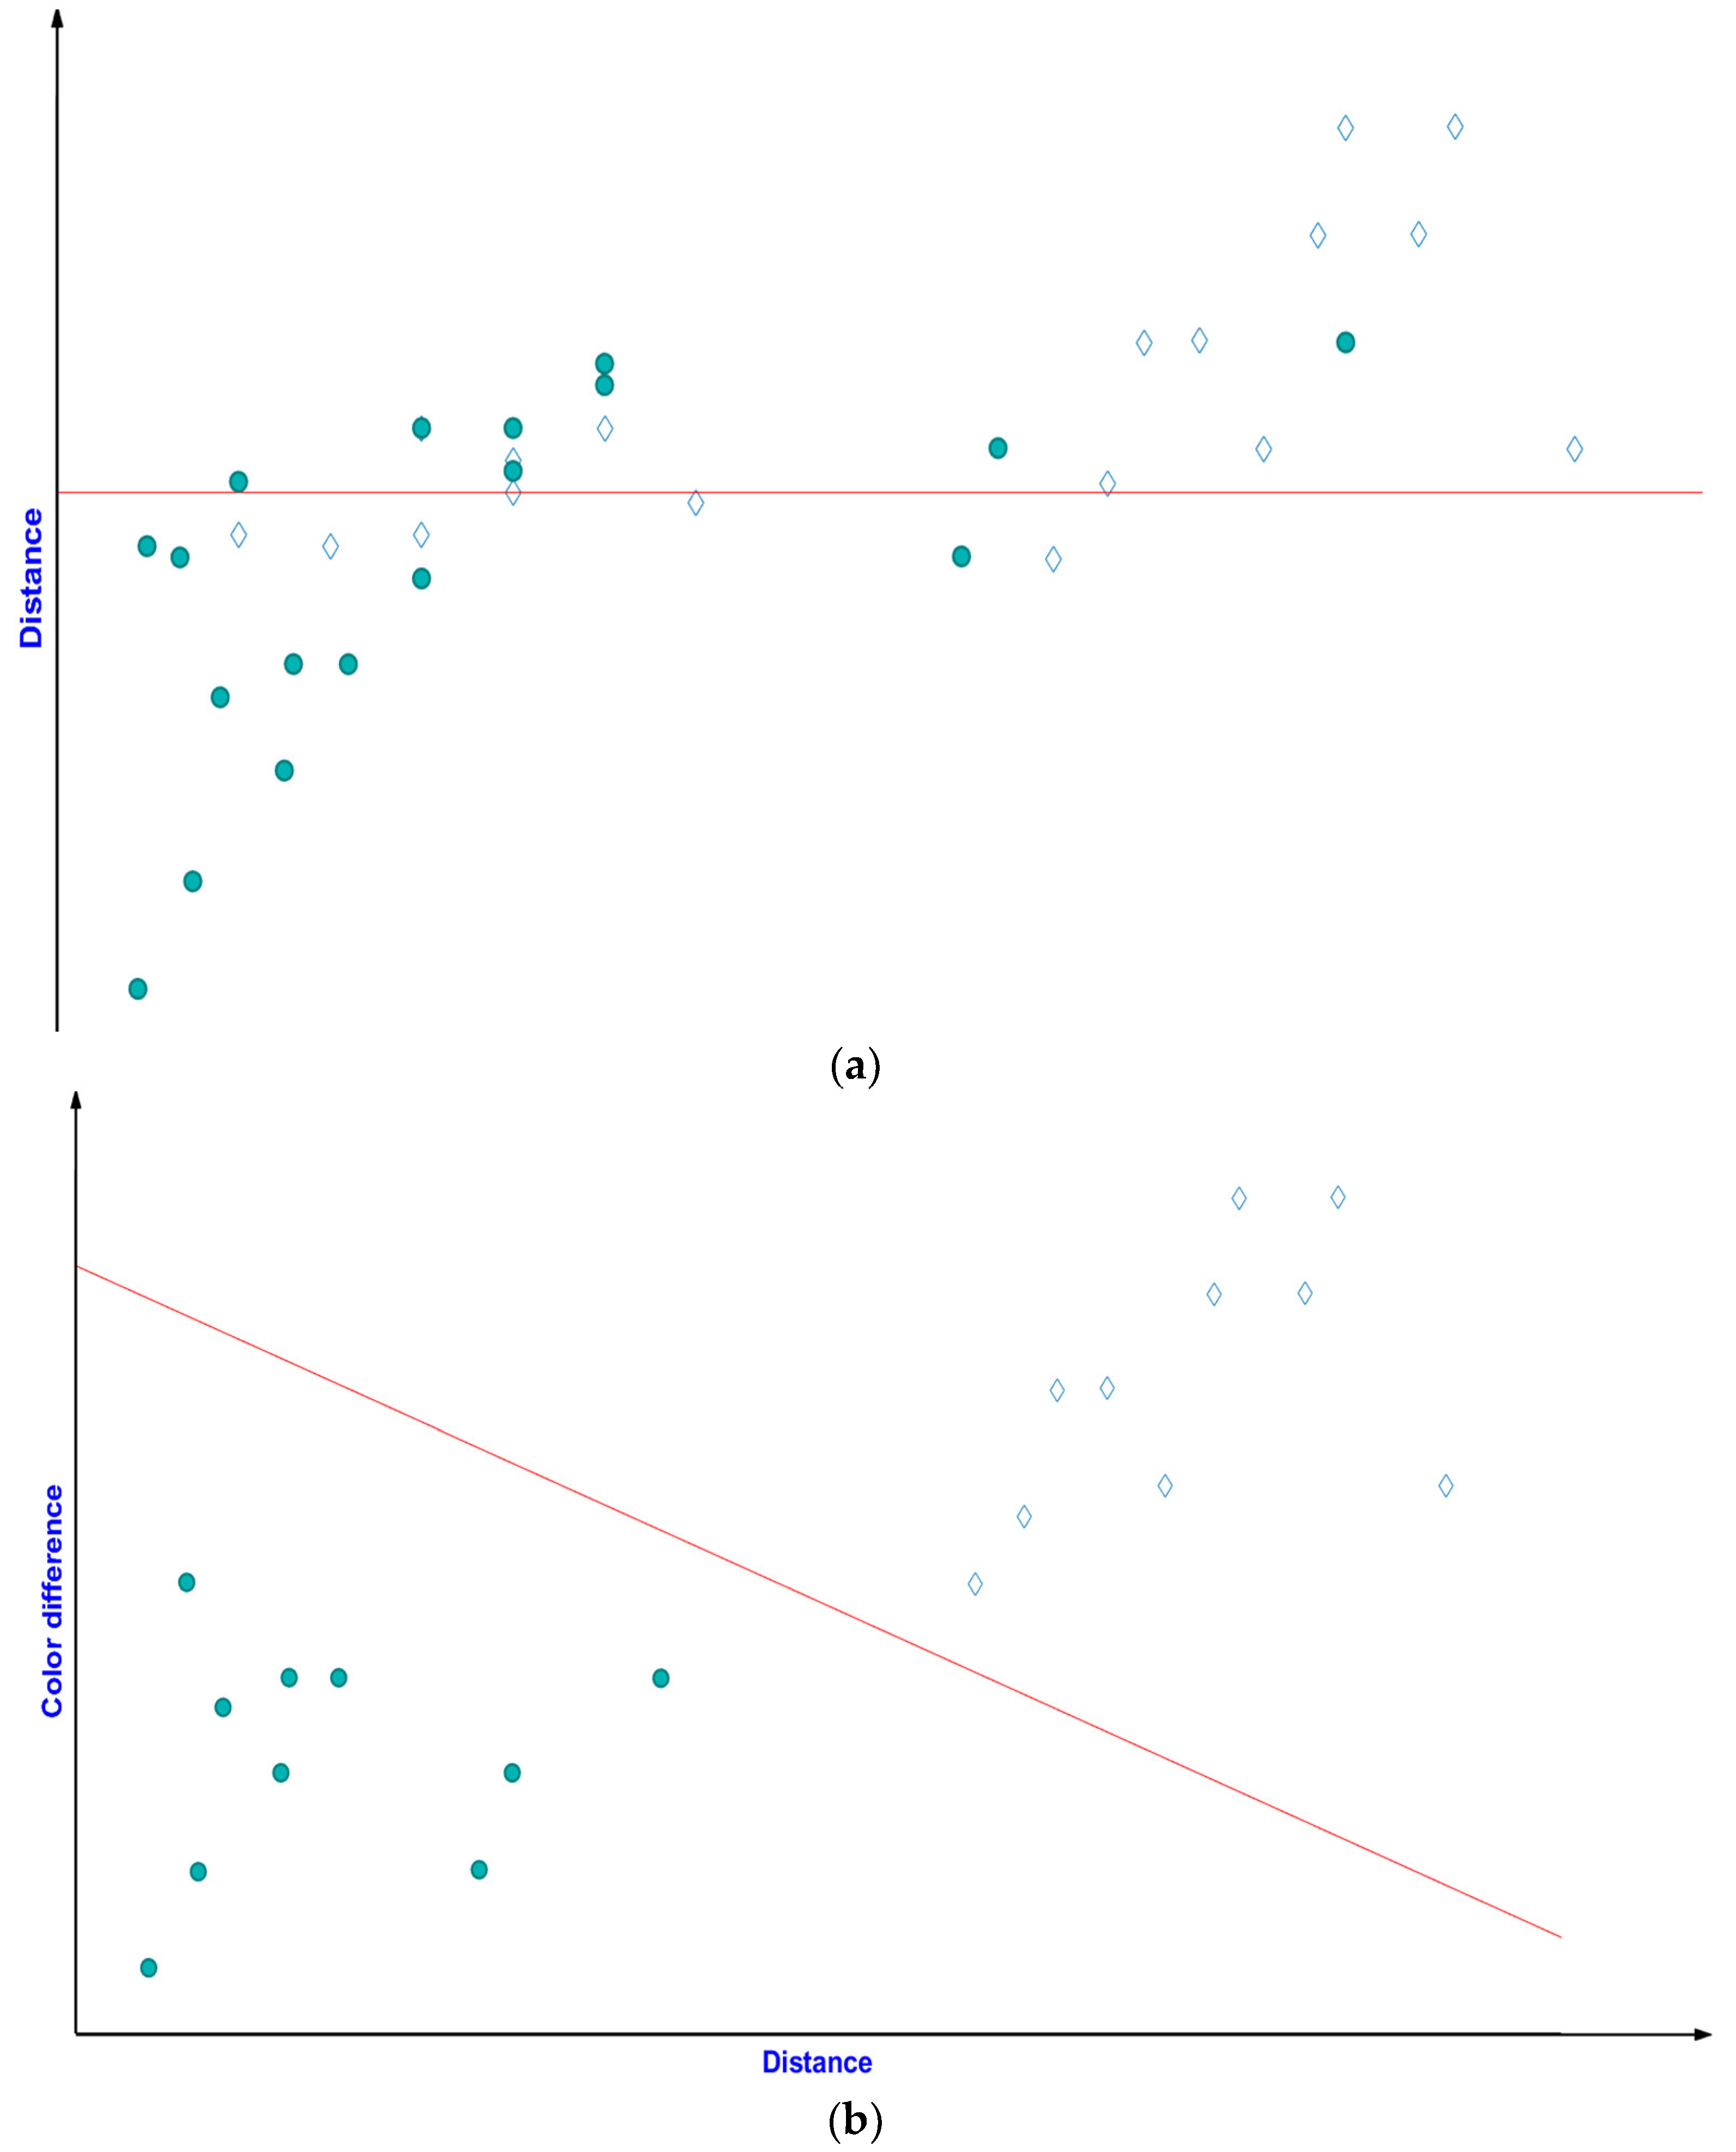
3.2.1. Removal of Mixed Pixels

The scan data of a high formwork usually include multiple objects such as vertical poles, horizontal tubes, couplers, braces, bolts, ground, timber formwork, and so on. Construction sites include other unexpected noise, including construction equipment, workers, and etc. In order to retain useful data relating to poles and tubes, the others must be removed. Unfortunately, mixed pixels that are a type of false measurement are always included in the laser scan data [49]. It occurs when a laser beam is split into two parts and falls on two different objects. Hence, the laser scanner obtains two reflective signals that are from two different objects, and then generates the mixed pixel measurements that cannot represent either of the two objects [57,58,59,60].
As mixed pixels adversely influence the recognition of the poles and tubes, it is necessary to remove the mixed pixels before further processing of the point data. Since mixed pixels are located at greater distances from their neighbours [57], an algorithm based on the average distance from one point to its k-nearest neighbours was employed in this study. If the average distance is bigger than a threshold value, the point is considered to be a mixed pixel. Moreover, in this study, colour information of the point data was used to filter out the mixed pixels. Steel poles and ledgers usually have substantially different colours so that pixels will experience large colour changes. The proposed method regards both the distance value and the average colour difference dRGB between one point and its surrounding k neighbours. The colour difference can be calculated in Equation (1).
d R G B = i = 1 k ( R i R 0 ) 2 + ( G i G 0 ) 2 + ( B i B 0 ) 2 k ,
where (x0, y0, z0) and (R0, G0, B0) are the coordinates and RGB values of this point, respectively, and (xi, yi, zi) and (Ri, Gi, Bi) are the coordinates and RGB values of the ith neighbor, respectively.
Based on distance value and colour difference, a discriminant analysis can be conducted to classify the valid data and mixed pixels clearly, as shown in Figure 4. The irrelevant data can be removed from the scan data. This step aims to retain data associated with standard poles and ledgers and remove other scan data as outliers. The proposed method is expected to generate more reliable results than conventional methods.

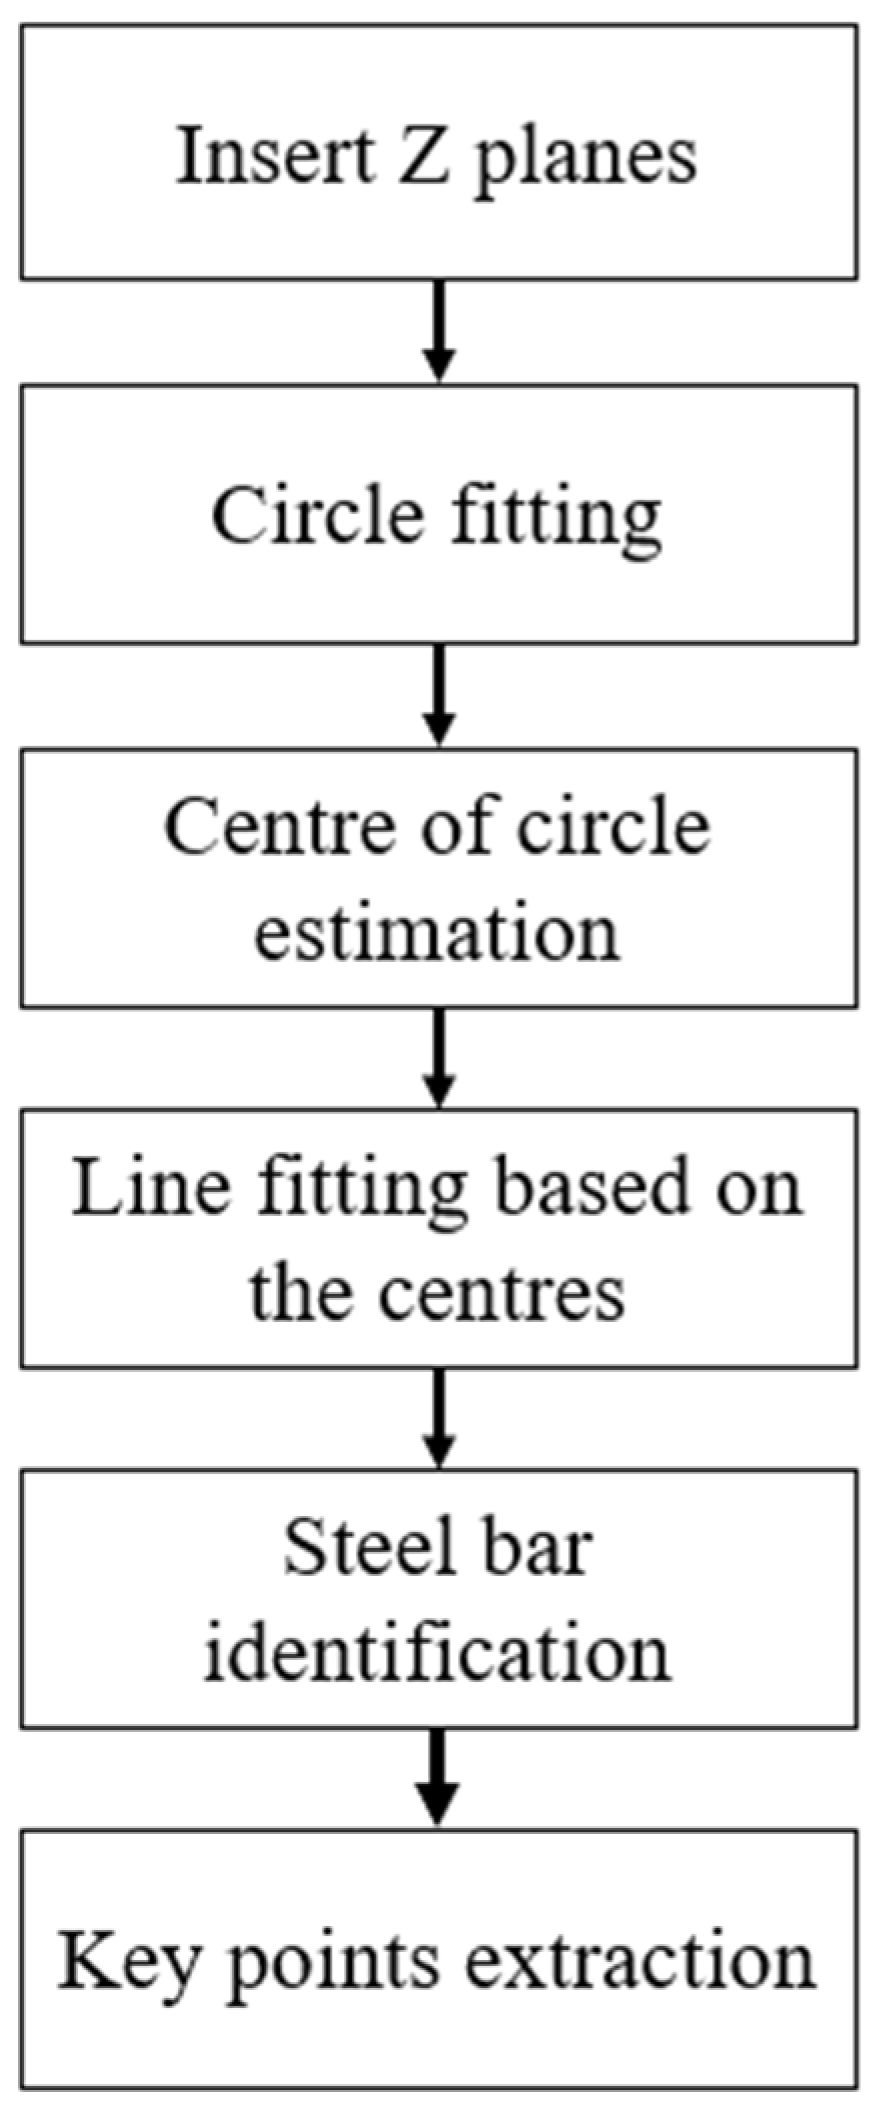
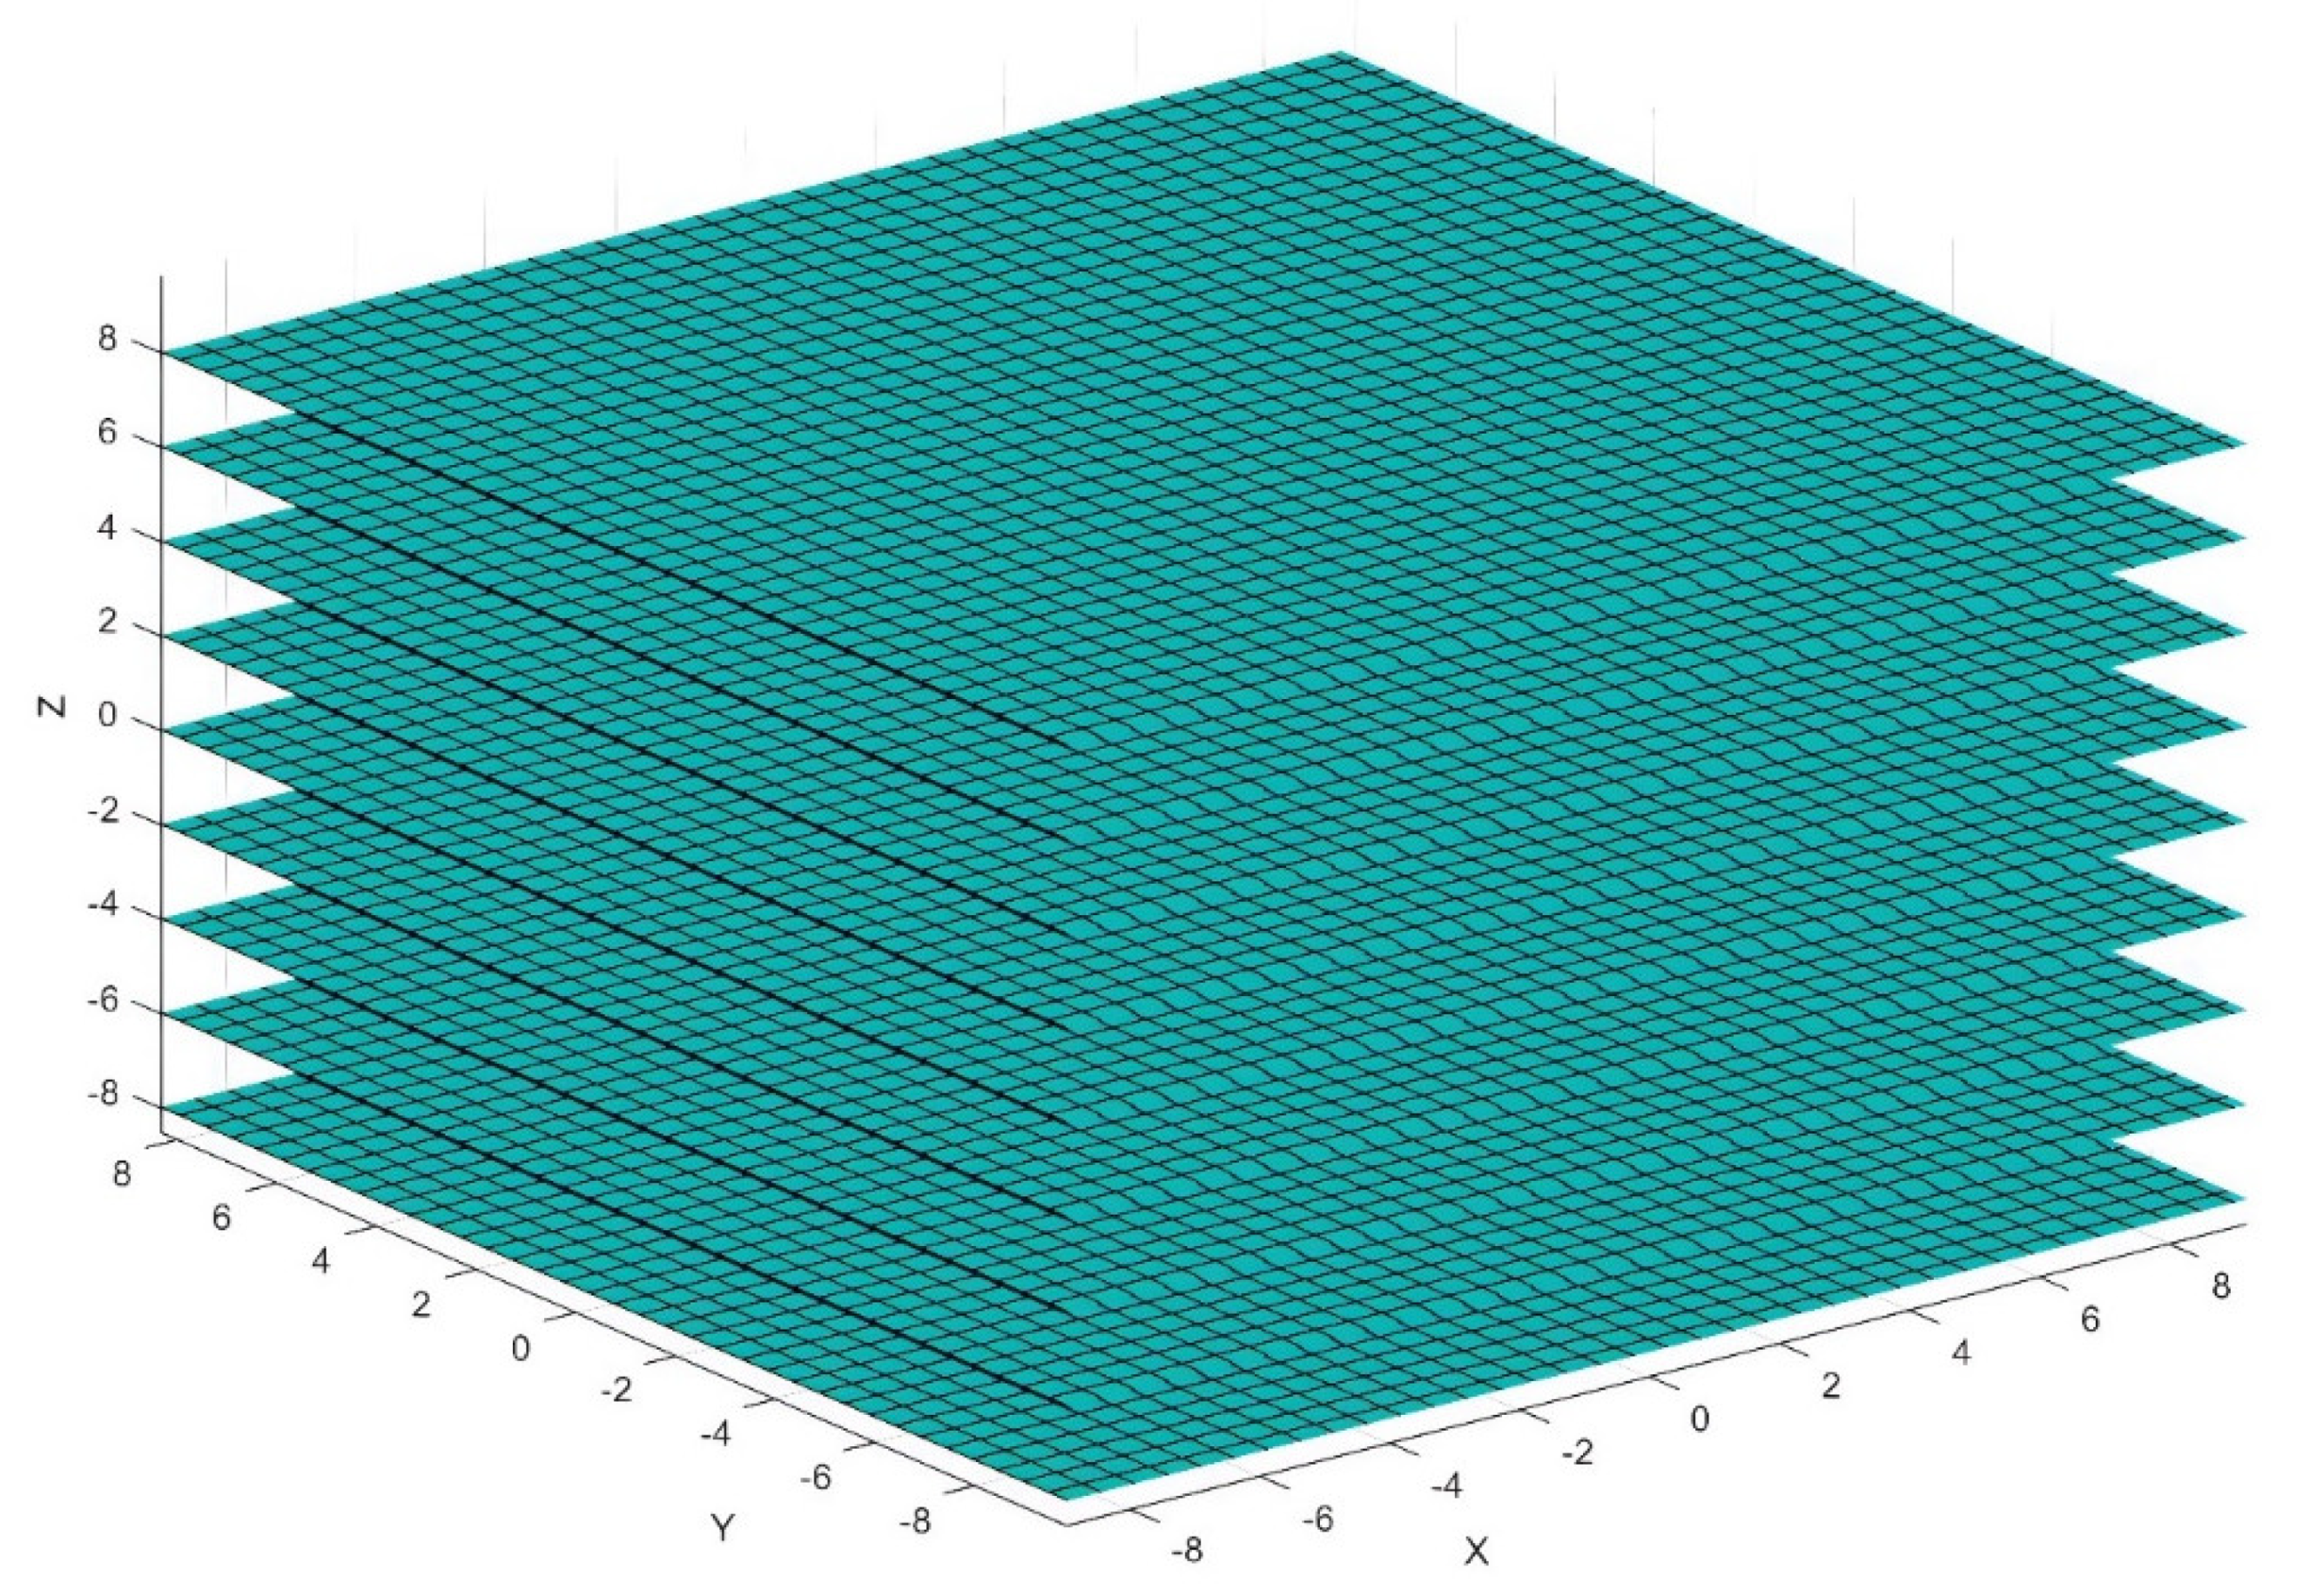
3.2.2. Extraction of Scan Data Associated with Poles and Tubes

As the high formwork mainly composed of vertical cylindrical poles and horizontal cylindrical tubes, upright poles and horizontal tubes have distinctive geometries and positions that differ from other objects. Hence, both geometries and positions of the scan points were used for classification. The proposed data extract method consists of six steps, as shown in Figure 5.
An array of Z-planes (Parallel to the XY plane) with a certain interval was inserted to the refined point cloud data and the data was projected onto the Z planes, as shown in Figure 6. For each slice, the point cloud data were projected on to the Z plane, as shown in Figure 7.
Since a vertical pole is circular in section, the data in every Z plane were clustered in a circle. The region growing algorithm [61] was used to add more points to the points clusters within a certain radius (the radius of a pole). The algorithm iteratively explores the point clusters and adds more neighbor points to the clusters in order to form a circular shape with a certain radius until all the points clusters in the array of Z planes have been checked. If a point does not belong to any of the clusters, it can be seen as an outlier to be removed. The remaining data in every Z plane were corrected in MATLAB by fitting a simple circle based on the section formation of a standard pole. Based on the points the boundary of the poles and tubes can be detected. The centre and diameter of a pole are then fitted according to the detected boundary, as shown in Figure 8. As the same pole has the similar XY coordinates, Equation (2) was used to evaluate whether the point belong to the pole or not.
( x x i ) 2 + ( y y i ) 2 p ,
where x , y is the coordinates of the vertical pole; x i , y i is the coordinate of the i point; p is the threshold value.
The centre points of the circles on each Z planes belonging to the same pole can be determined, as shown in Figure 9. A line fitting algorithm in MATLAB was used to fit the centre points in each Z plane to obtain the vertical pole, as shown in Figure 10. Every vertical pole can be extracted. If the model set is subjected to deformation, data can be fitted with higher order polynomials for accurate representation. The same methods were used to extract every horizontal tube, although in that case an array of X-planes was inserted for the extraction of the longitudinal tubes and an array of Y-planes were inserted for the extraction of the transverse tubes. The thickness and the interval of the inserted planes are highly related to the size and density of the point data.
This method has several potential advantages. First, it can collect sufficient data for individual poles to facilitate the recognition process. Second, the outliers can be removed effectively. Third, the incomplete scanning of standard poles due to the occlusion of line-of-sight by other objects can be corrected using the region growing technique.
The attained lines representing the poles were checked to determine whether they were vertical to the plane XOY. And the lines indicated tubes were checked to determine whether they were perpendicular to the plane YOZ. The projection of an inclined pole on the XOY plane is shown in Figure 11. If the distance between the leftmost and rightmost centroids are larger than a threshold value, it indicates the pole is not vertical to the XOY plane. Then the pole that is not vertical to the planes should be filtered out to check its inclination value. The pole should be considered a defect that is not follow the building code rule. The rule states that all poles should be perpendicular to the ground and all tubes should be parallel to the ground. Hence, the pole or the tube should be re-installed to correct the defect.
In this study, a pole and a tube of the small-scale high formwork model were inclined on purpose to validate the proposed method. The proposed method can identify the pole and the tube that are not properly installed. Next, the cross points of lines that represent poles and tubes were generated. The cross points are disk lock nodes, which are considered important points in this study. The further ANN model was developed to generate accurate coordinates of the key points in order to accurately calculate the spacing of the pole and the lift height. Such data are important for building code requirements.
The longitudinal spacing of pole can be calculated in Equation (3).
d l i = ( x i + 1 x i ) 2 ,
The transverse spacing of pole can be calculated in Equation (4).
d t i = ( y i + 1 y i ) 2 ,
The lift height (space between two neighboring tubes) can be calculated in Equation (5).
s i = ( z i + 1 z i ) 2 ,
where x i , y i , z i indicate the coordinates of the i point.

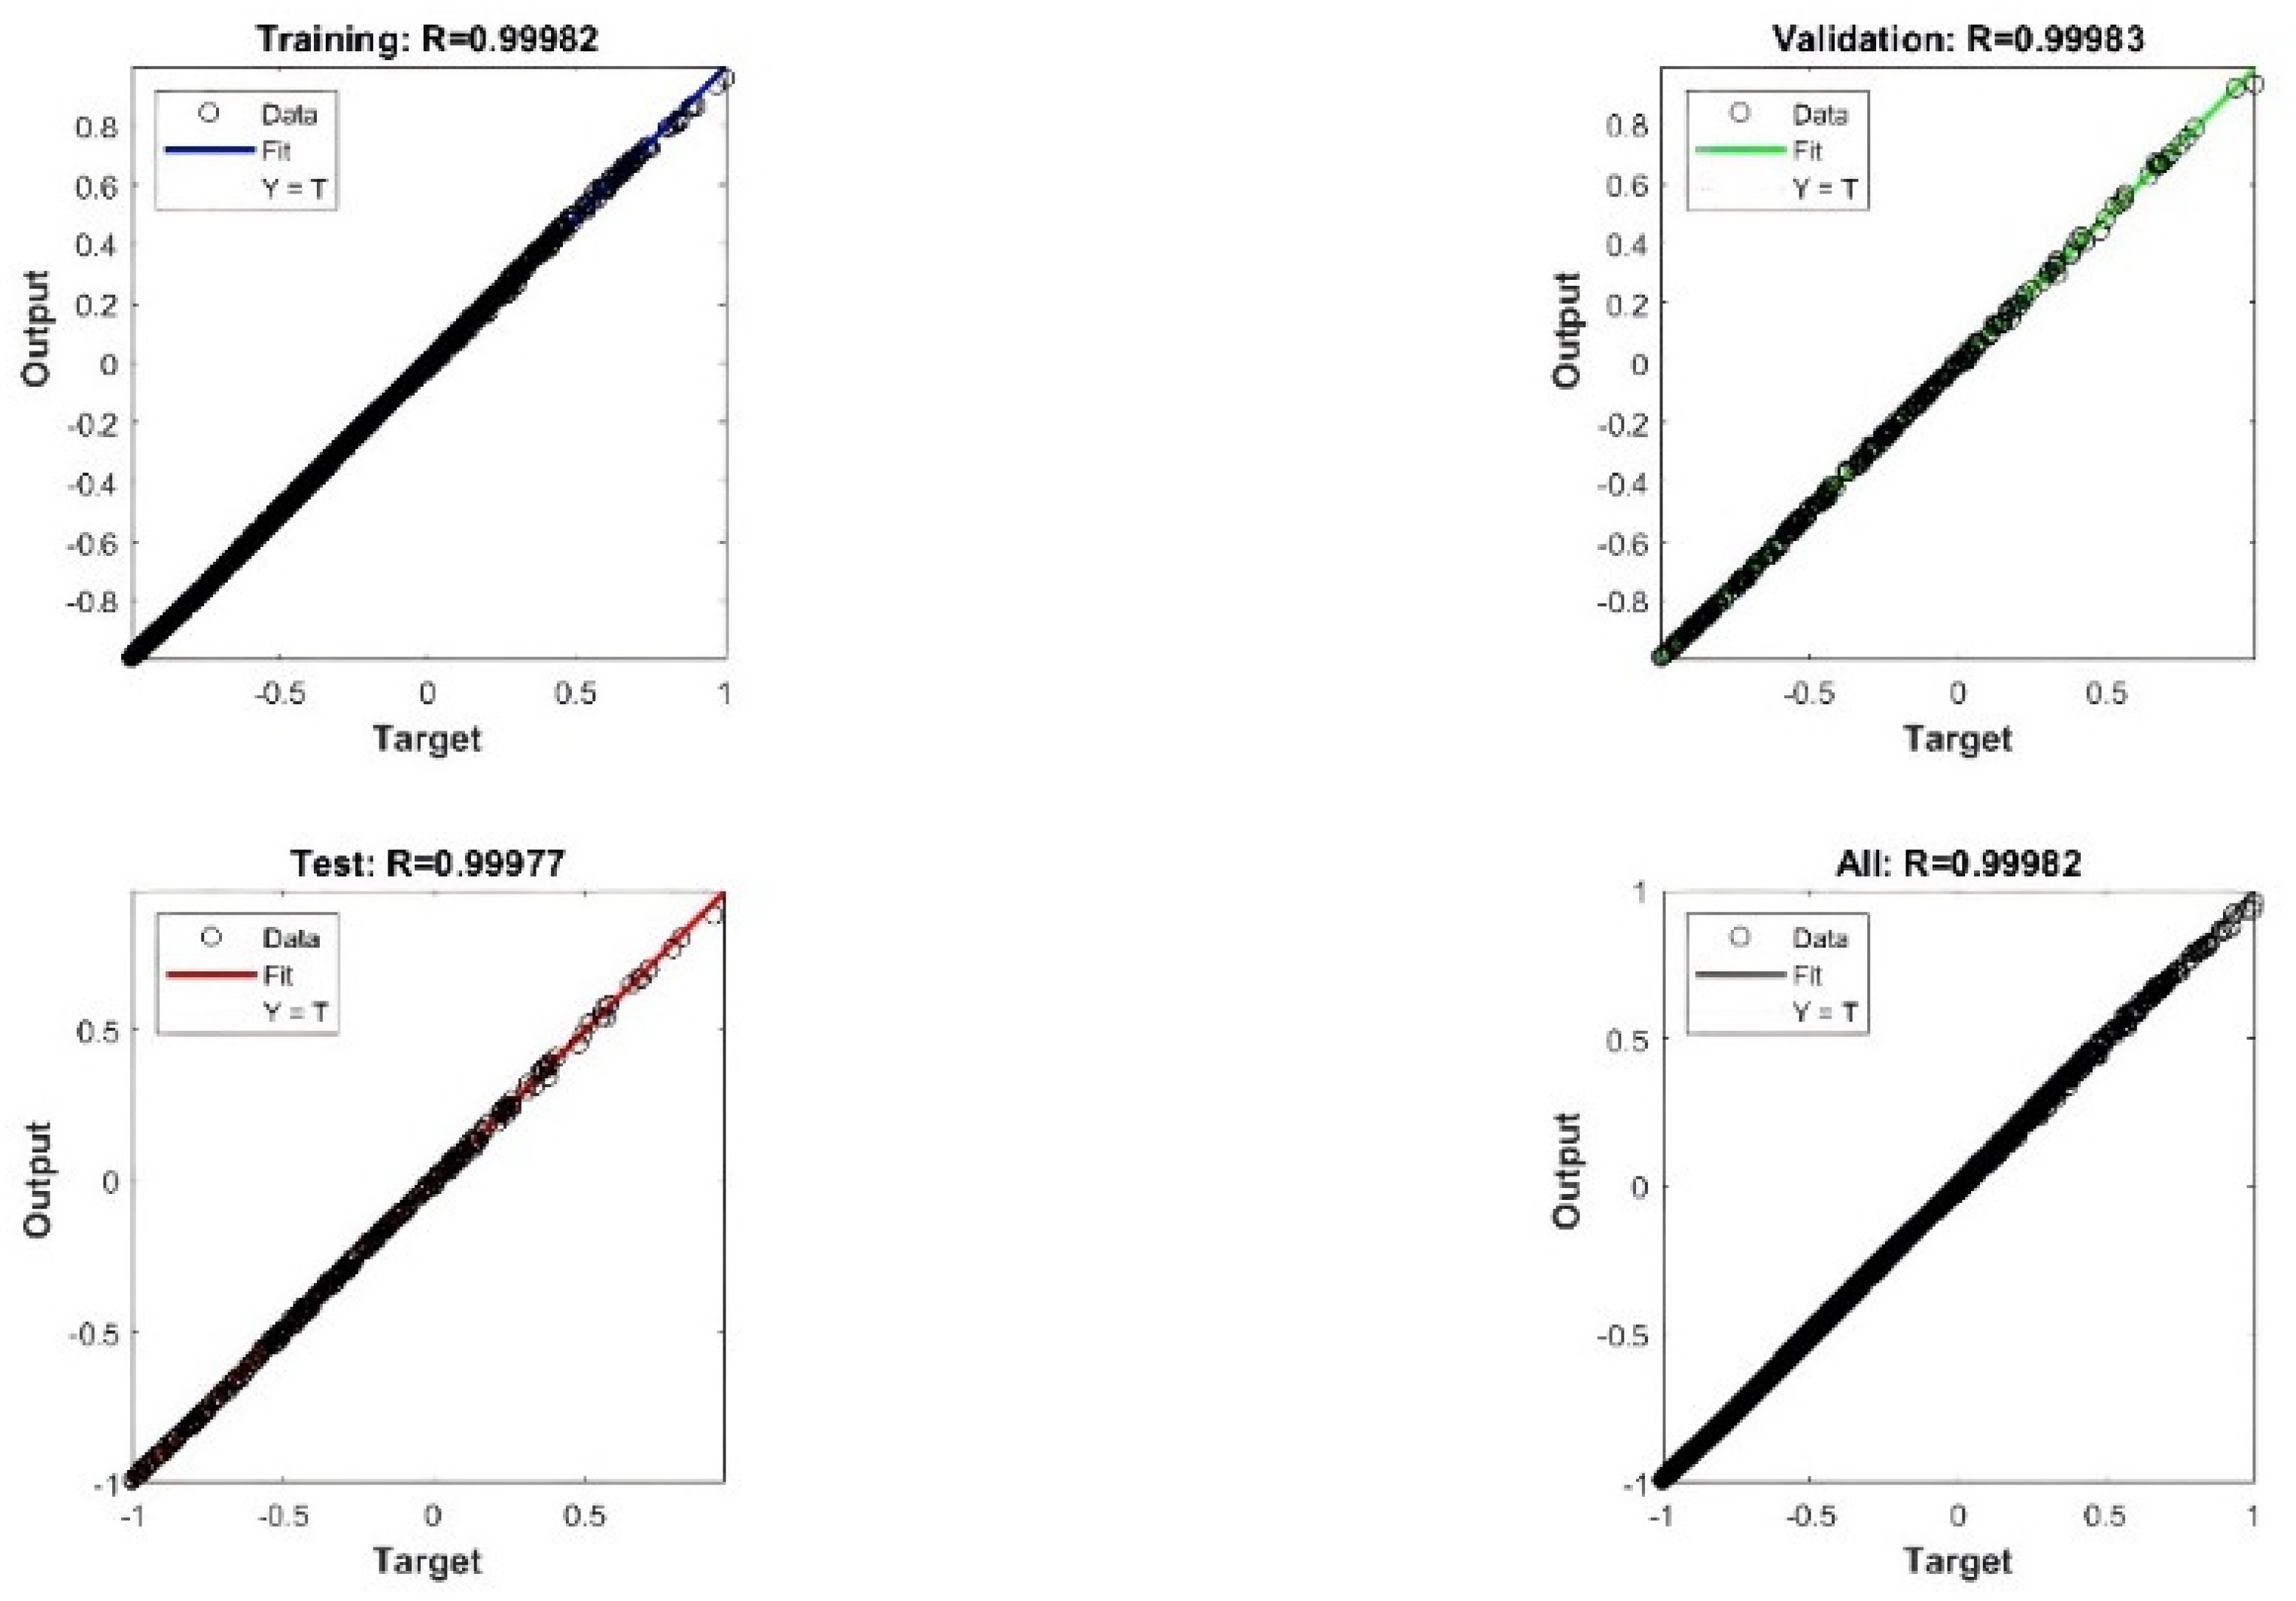
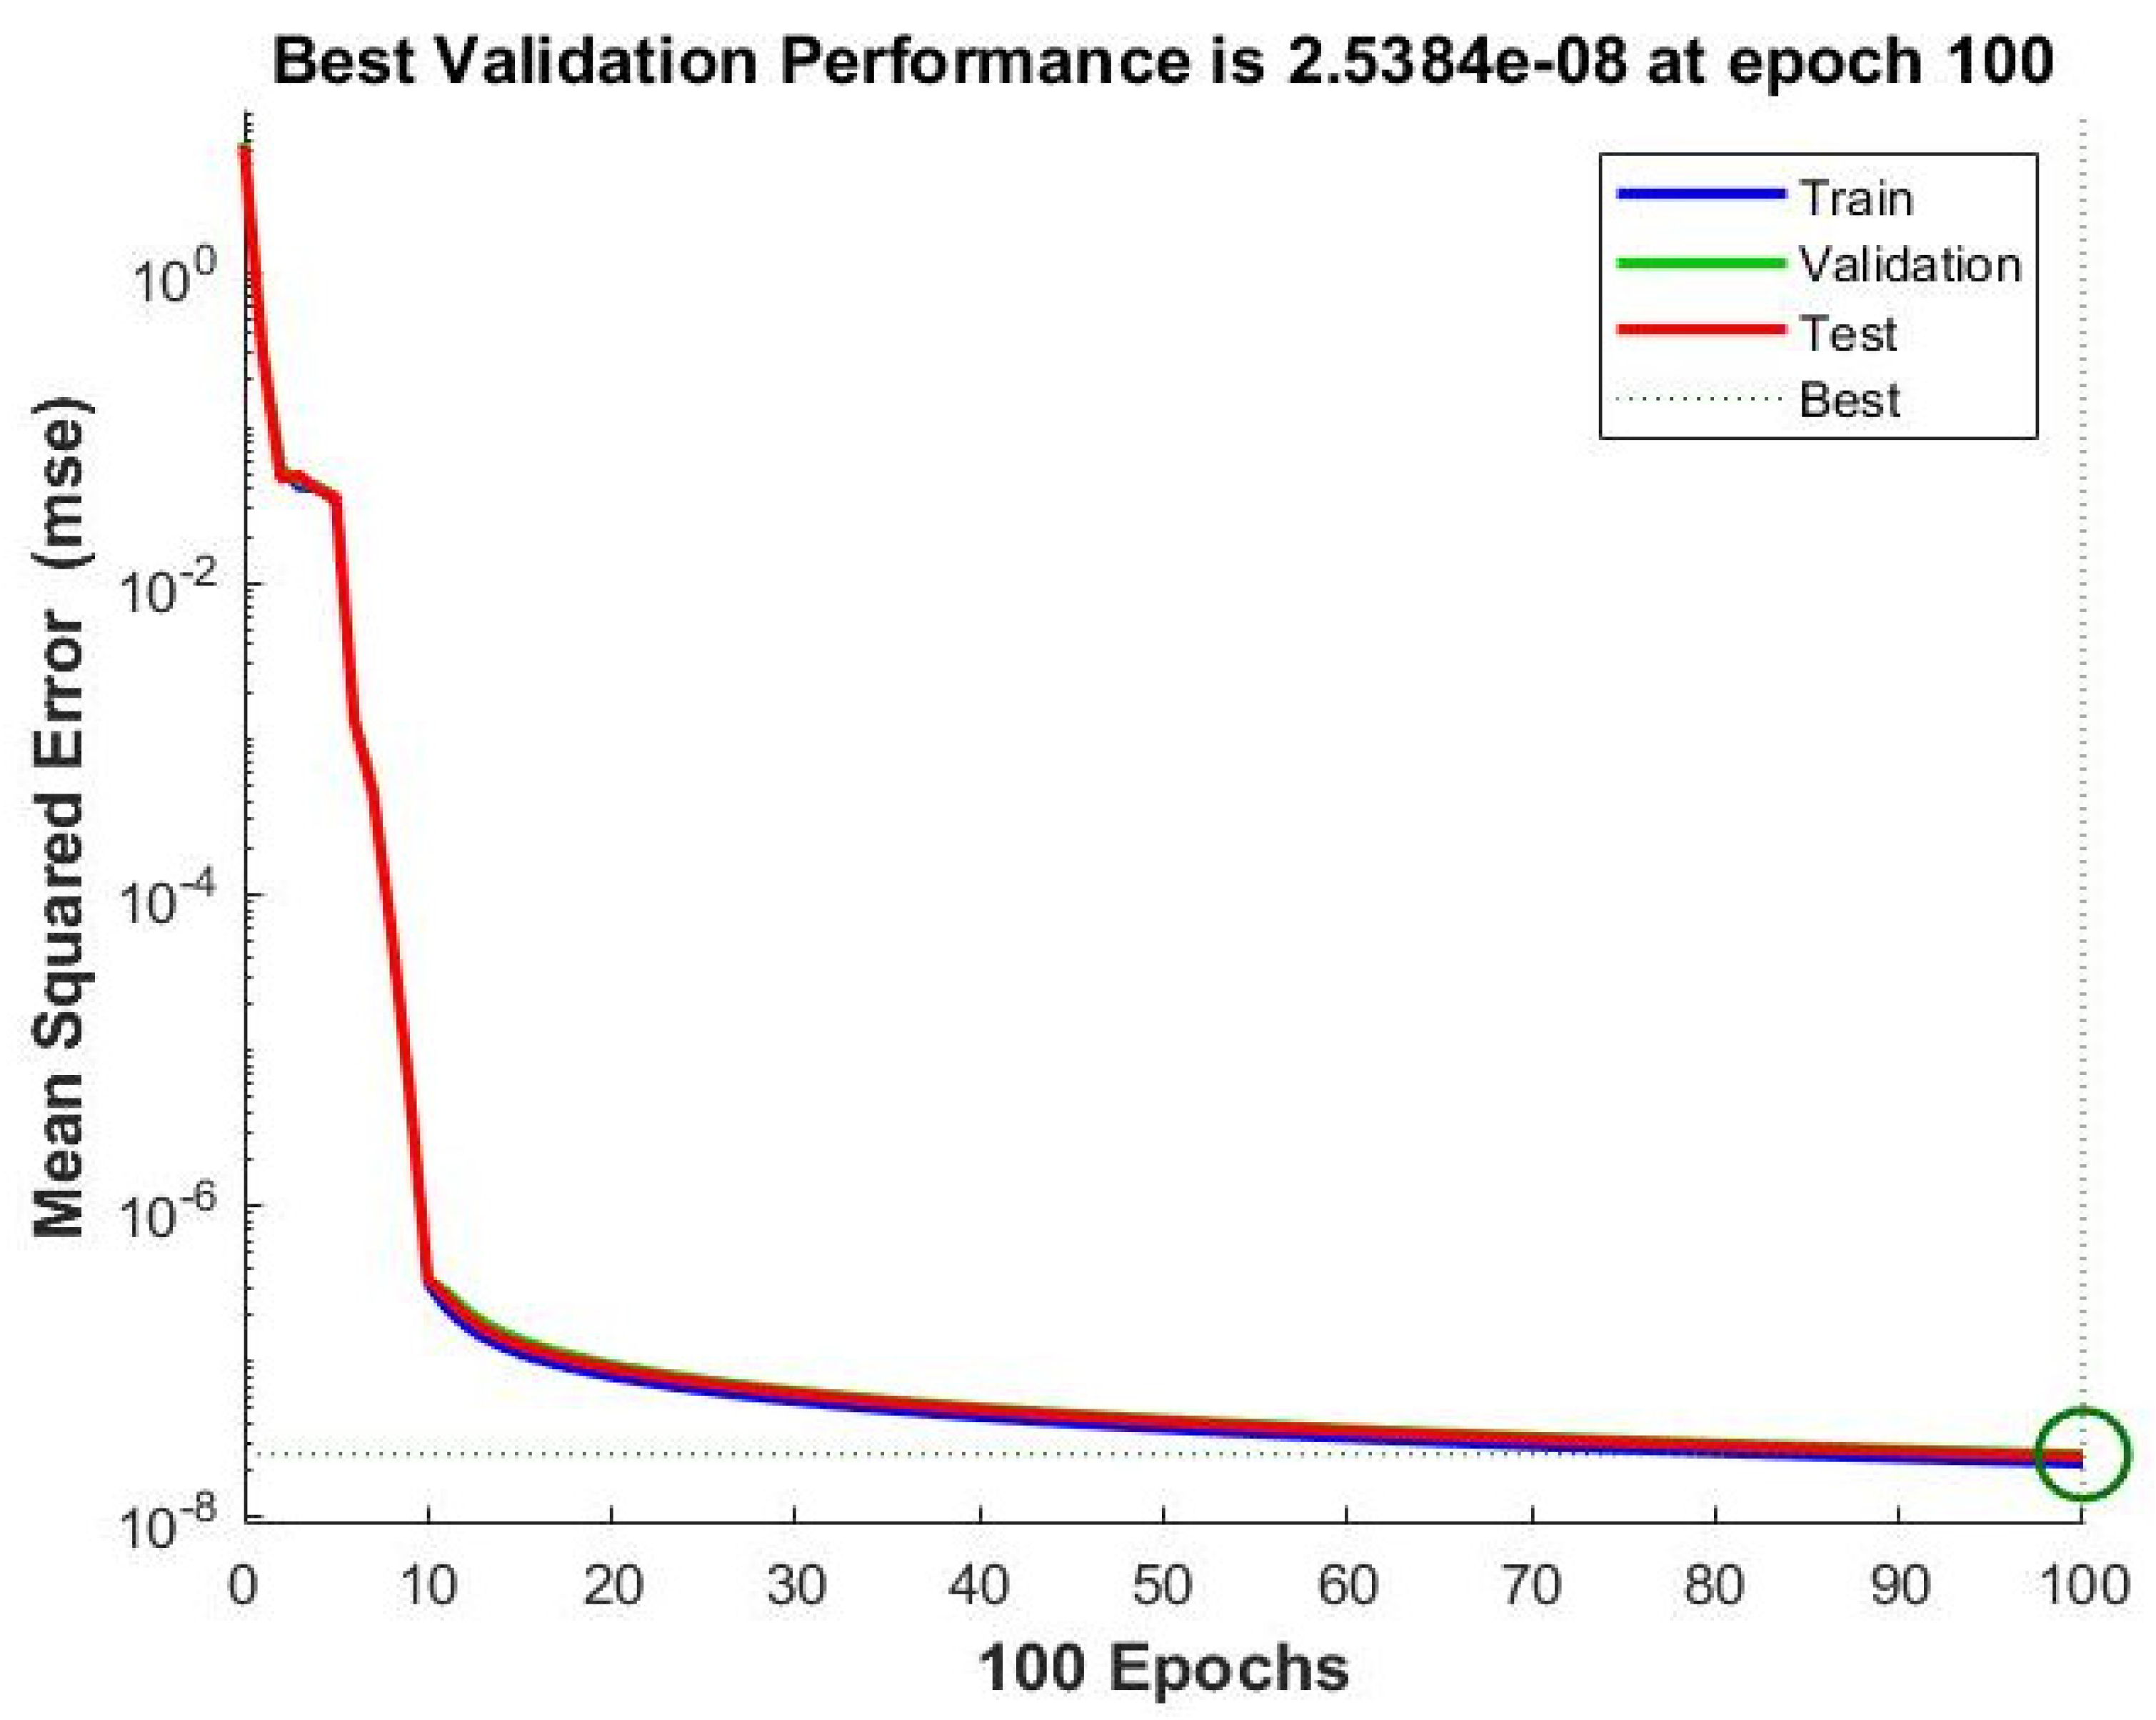
3.3. ANN Structure and Training

The TLS technology was used as a basis for obtaining data for neutral network training. This can generate better predictions with acceptable accuracy. The flowchart of the proposed scheme is displayed in Figure 12.

3.3.1. ANN Training Data Collection
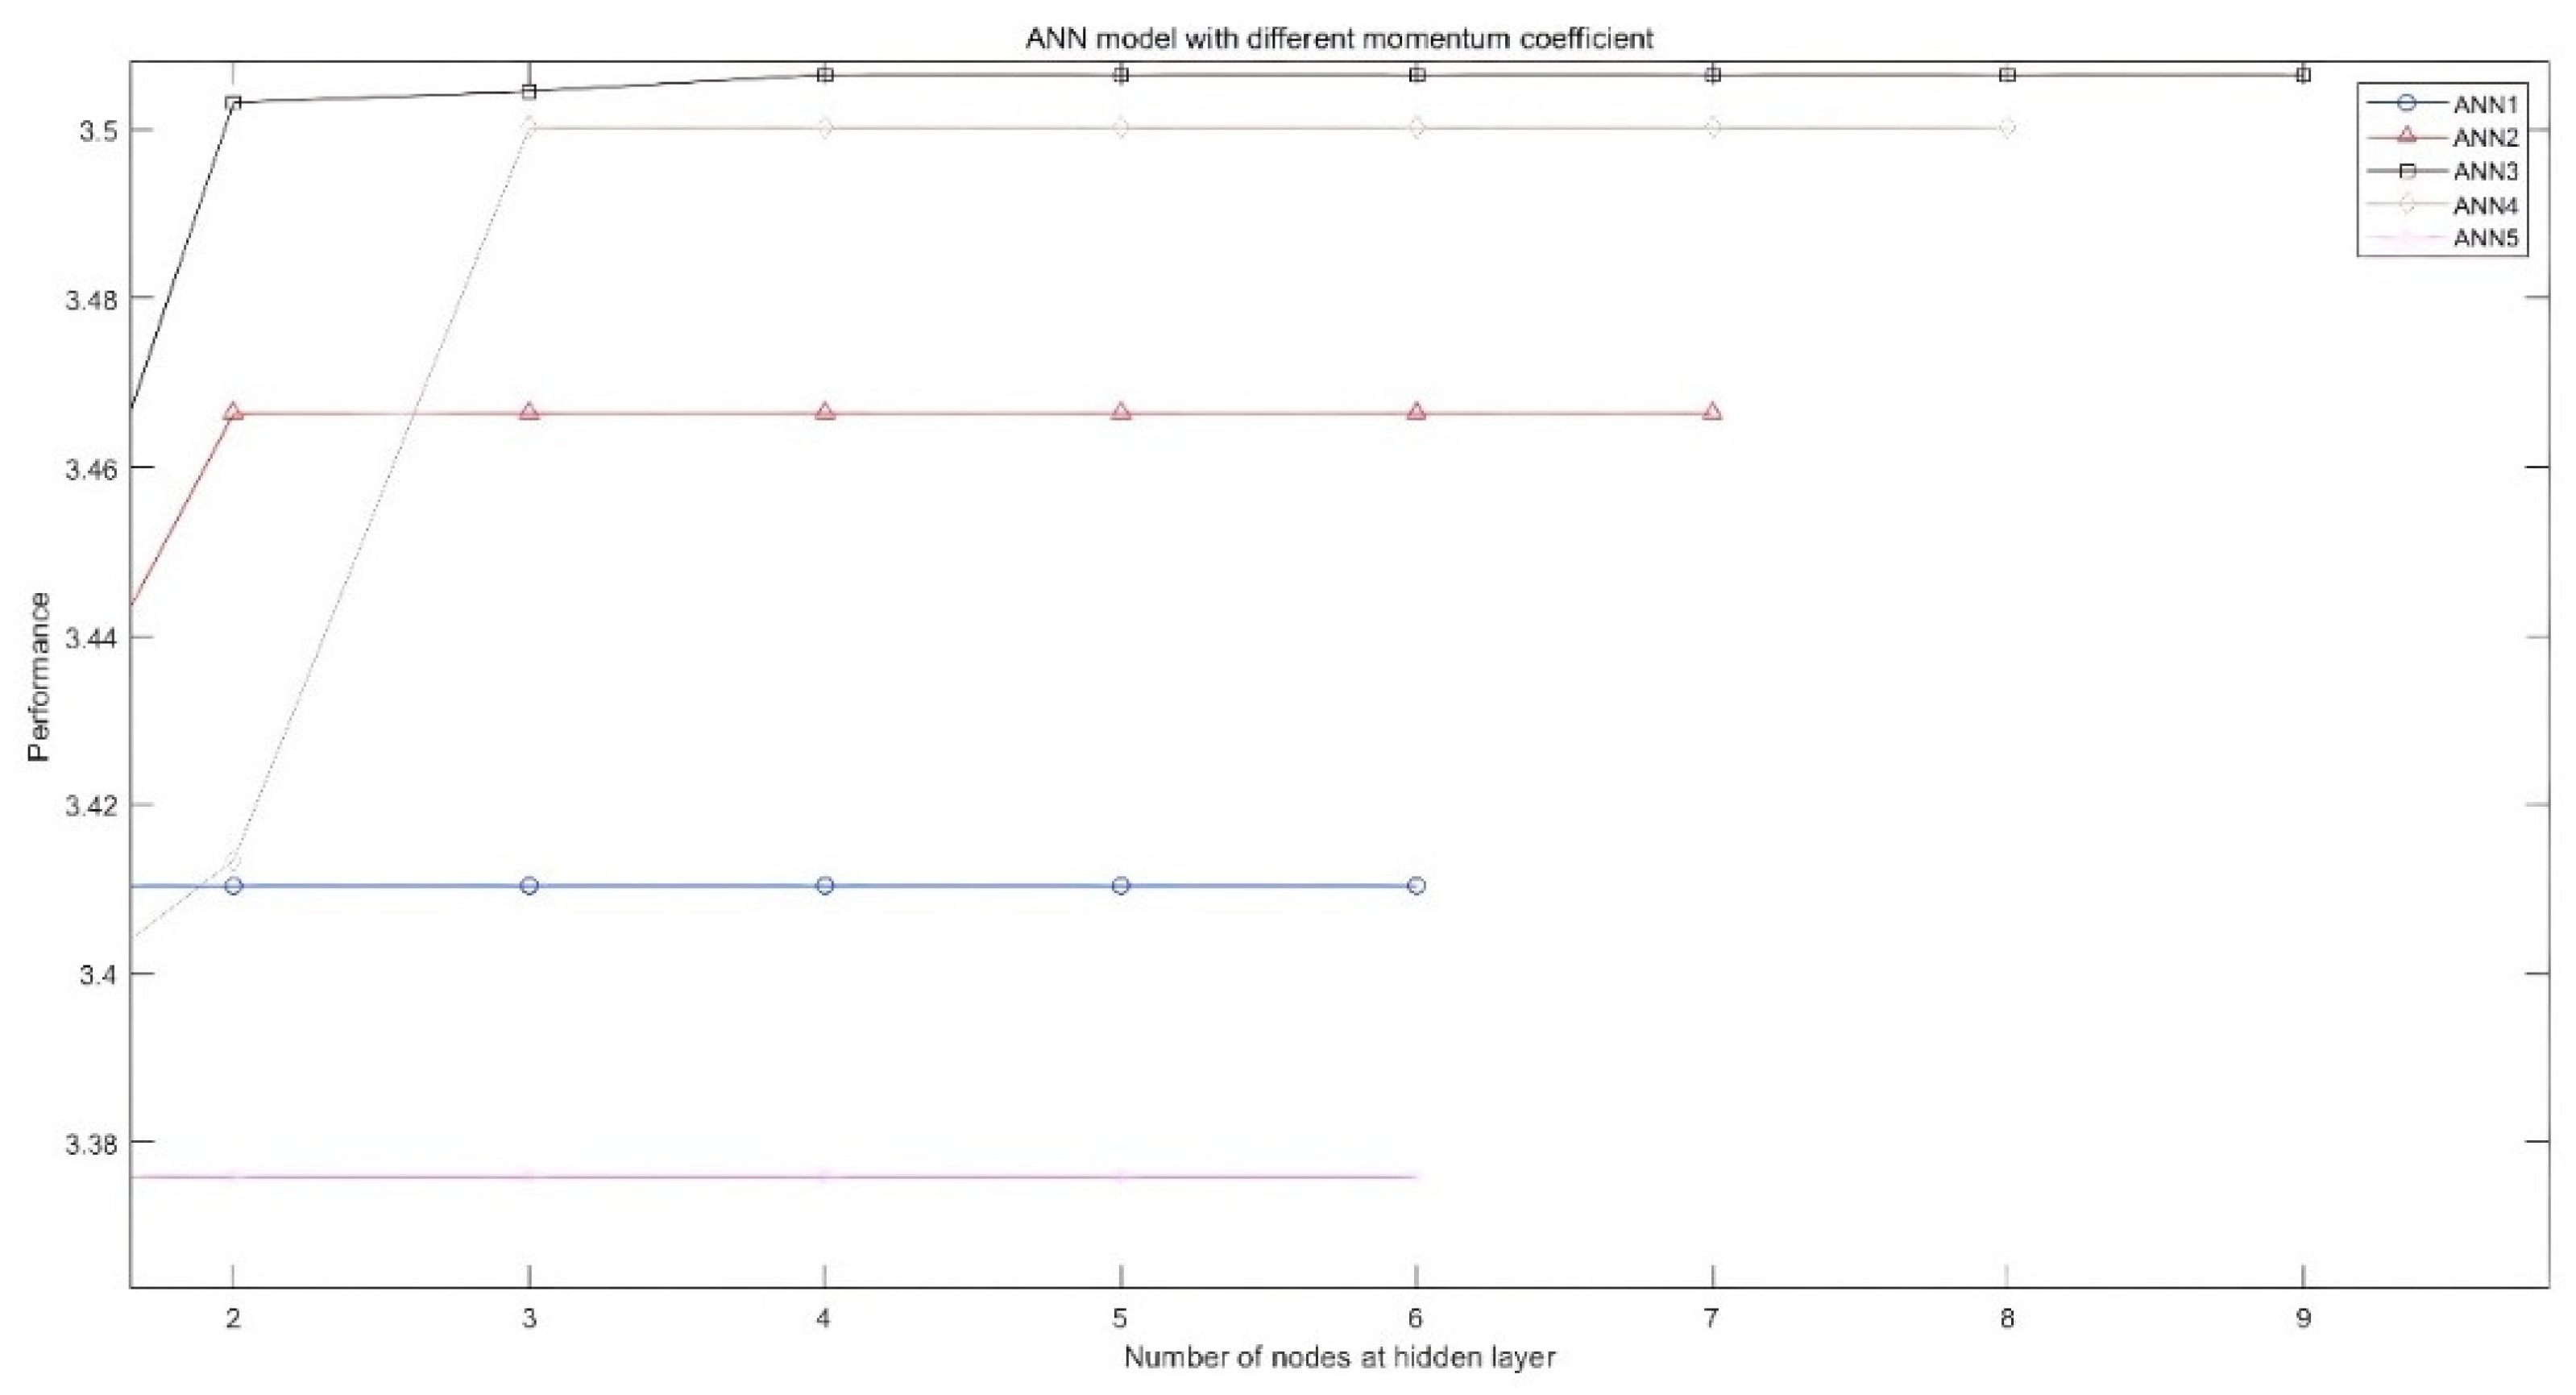
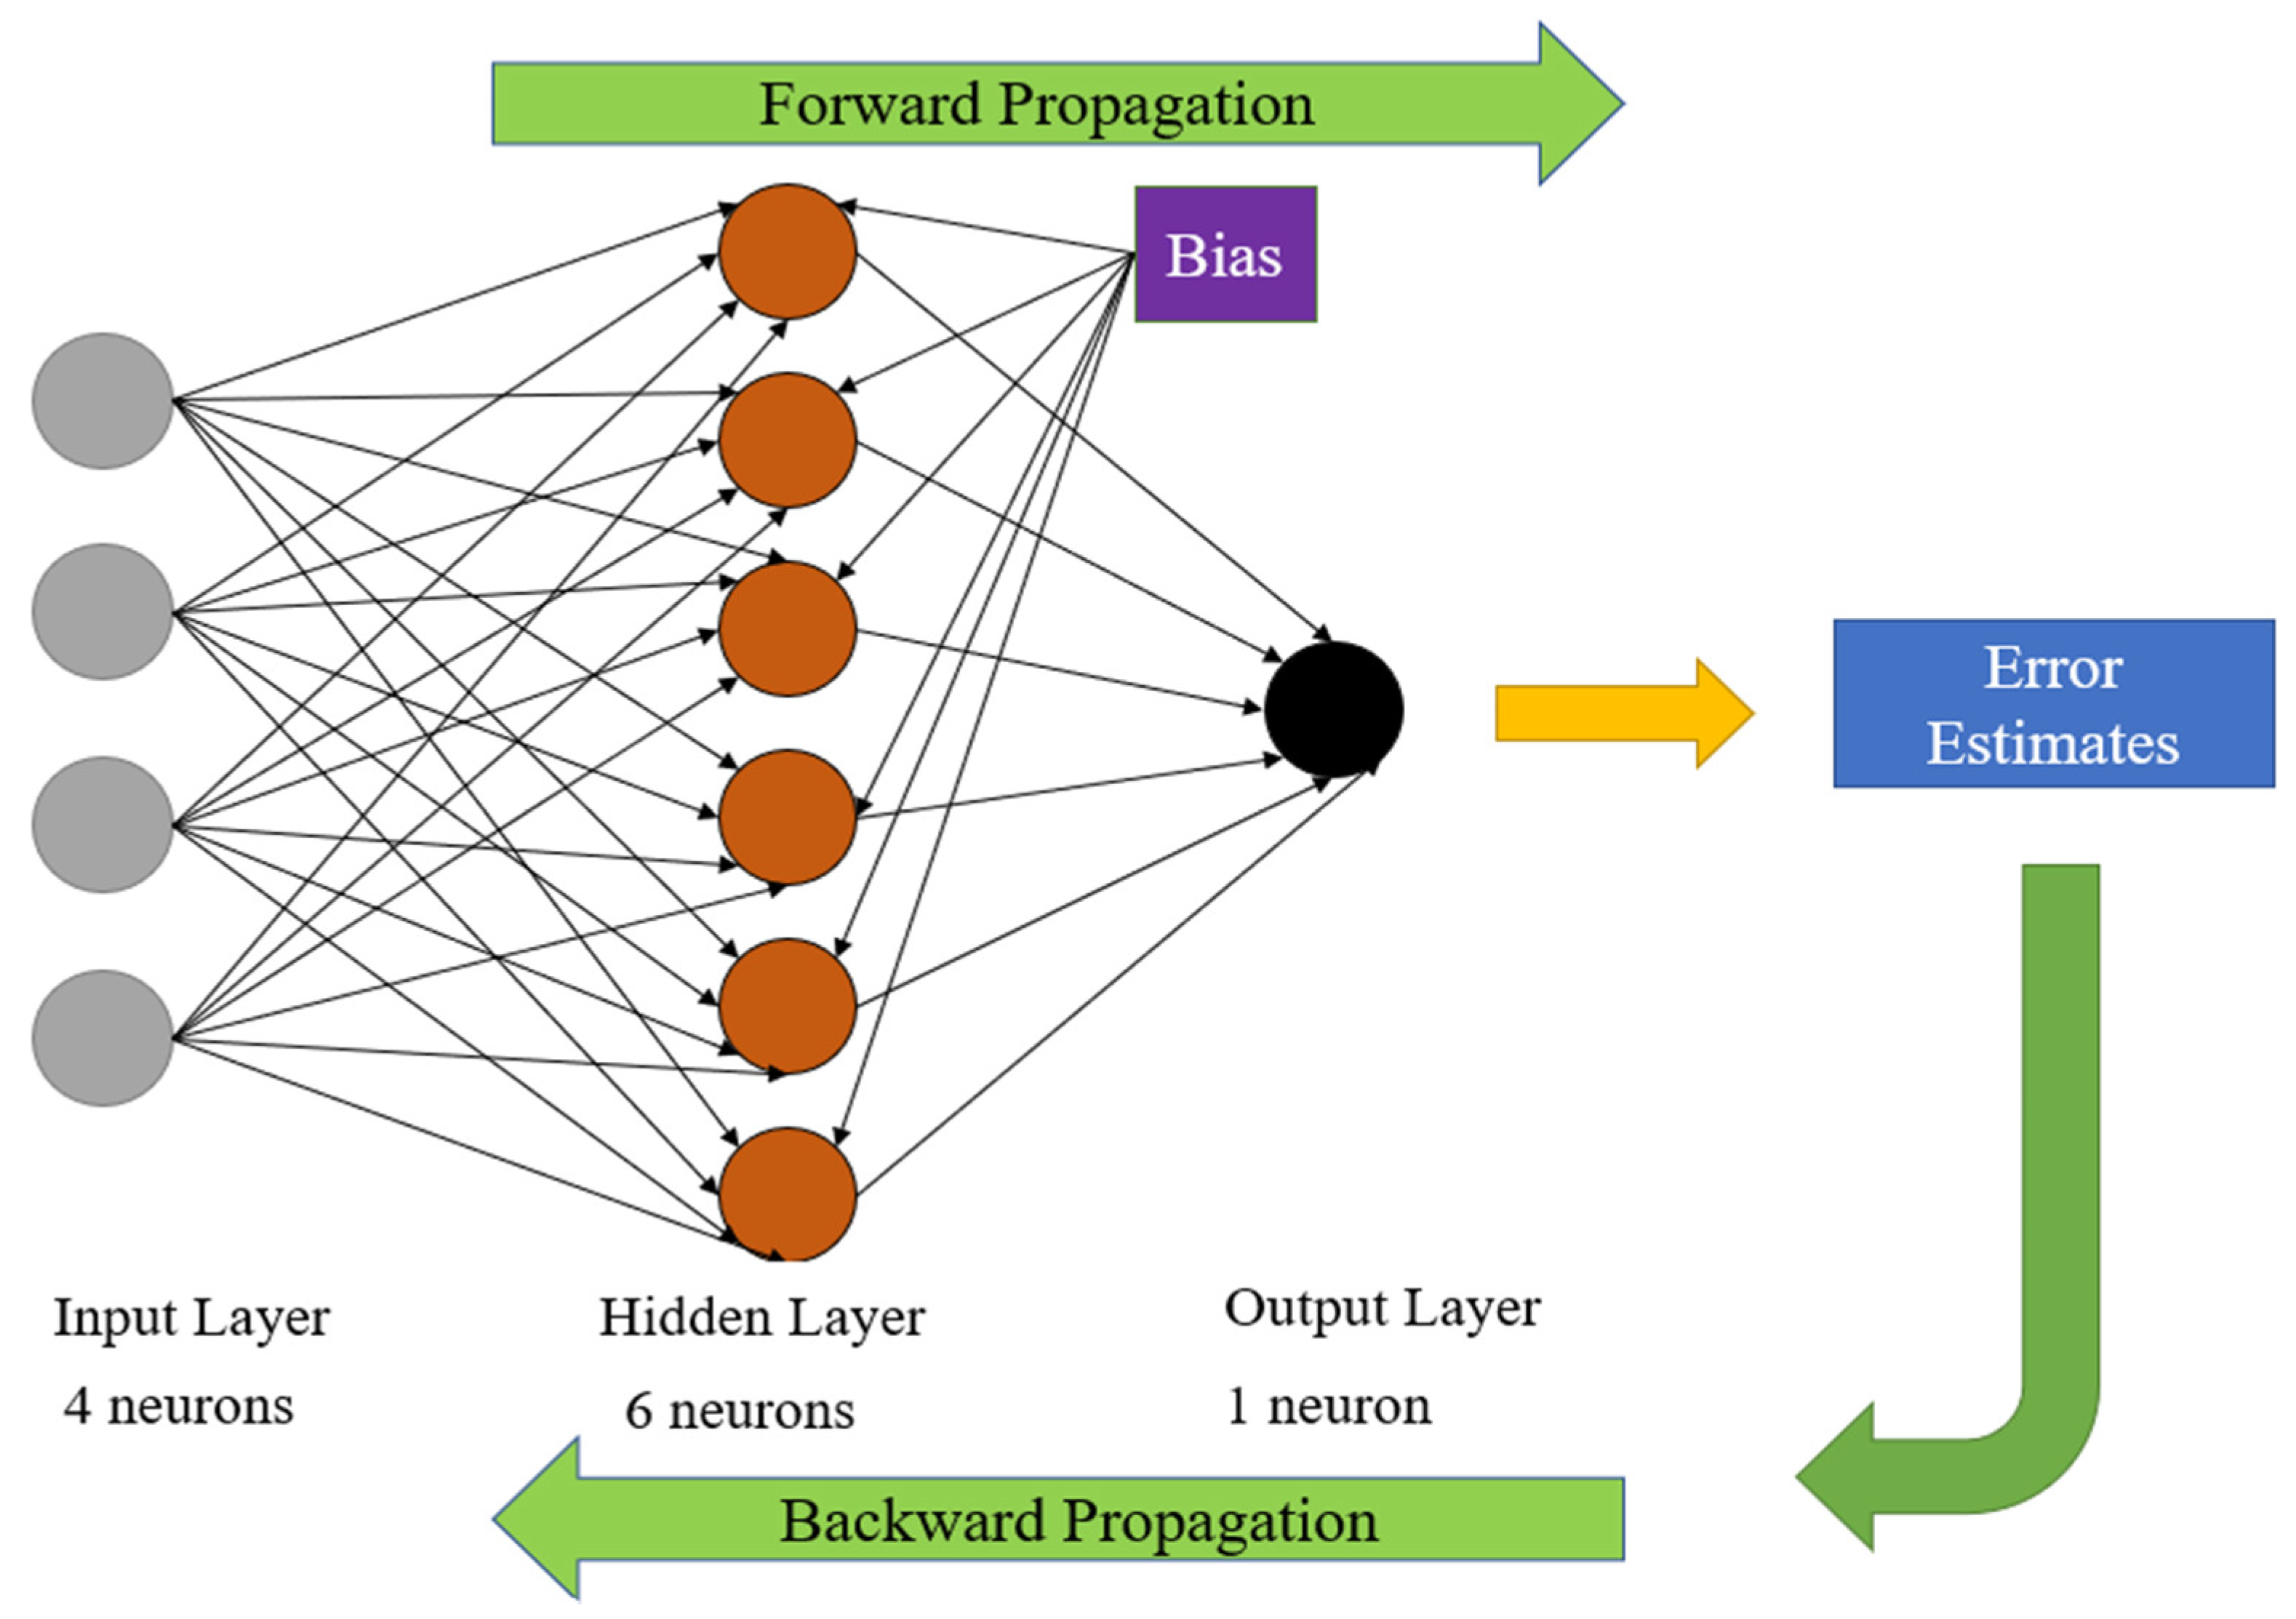
In order to improve the accuracy of the coordinates of the key points, the study needs to collect sufficient data to develop an ANN model. The spacing of the pole and the lift height of the small-scale high formwork model set were specified. The model set first was positioned on a movement equipment and moved along the X direction at interval 1 mm, and then the model set was moved along the Y direction at interval 1 mm from 1 mm-10 mm. Finally, the model set was moved along the Z direction from 1 mm to 10 mm at interval 1 mm. Every movement was scanned. Thus, the model set was scanned 30 times, and the collected 30 datasets were used to develop an ANN model to predict the coordinates of the cross points of the poles and tubes. The moving distance is specified as 1 mm, so that the coordinates of the key points at t moment can be calculated based on the coordinates at t − 1 moment, as shown in Equation (6). The initial coordinates of the key points were generated from total station measurement.
P i t ( x i t y i t z i t ) = P i t 1 ( x i t 1 + 1   mm ( X ) y i t 1 + 1   mm ( Y ) z i t 1 + 1   mm ( Z ) )  
where P i t ( x i t y i t z i t ) indicates the coordinate of the i point at t moment; x i t 1 + 1   mm ( X ) indicates the model move along the X axis at specified value 1 mm, so the x coordinate of the i point at t moment equal to the x coordinate of the point at t − 1 moment add 1 mm, but the y and z coordinates of the i point at t moment are the same as that at t − 1 moment.

3.3.2. ANN

The ANN model was used to solve the non-linear problem. The strong self-learning ability of the ANN can generate accurate predictions with high computational speed. Many kinds of neutral networks have been established, and multilayer feed forward is one of the most popular. Back propagation (BP) is one of commonly used algorithm, which can minimize ANN error properly [62]. Hence, the back propagation (BP) neutral network was adopted in this study.
Although ANN has been widely and successfully used in many studies, it has several disadvantages. For example, it is tedious to choose the number of hidden layers and the number of nodes at the hidden layer; the learning rate of ANN is usually decided randomly; and it is more likely to achieve local minima rather than global minima [63,64,65]. Moreover, the proper selection of parameters such as learning rate and momentum coefficient are important for model convergence progress. Hence, in this study, genetic algorithm (GA) was utilized to designate the parameters of the ANN model including the number of hidden layers, the number of nodes at the hidden layer, learning rate, and the momentum coefficient.

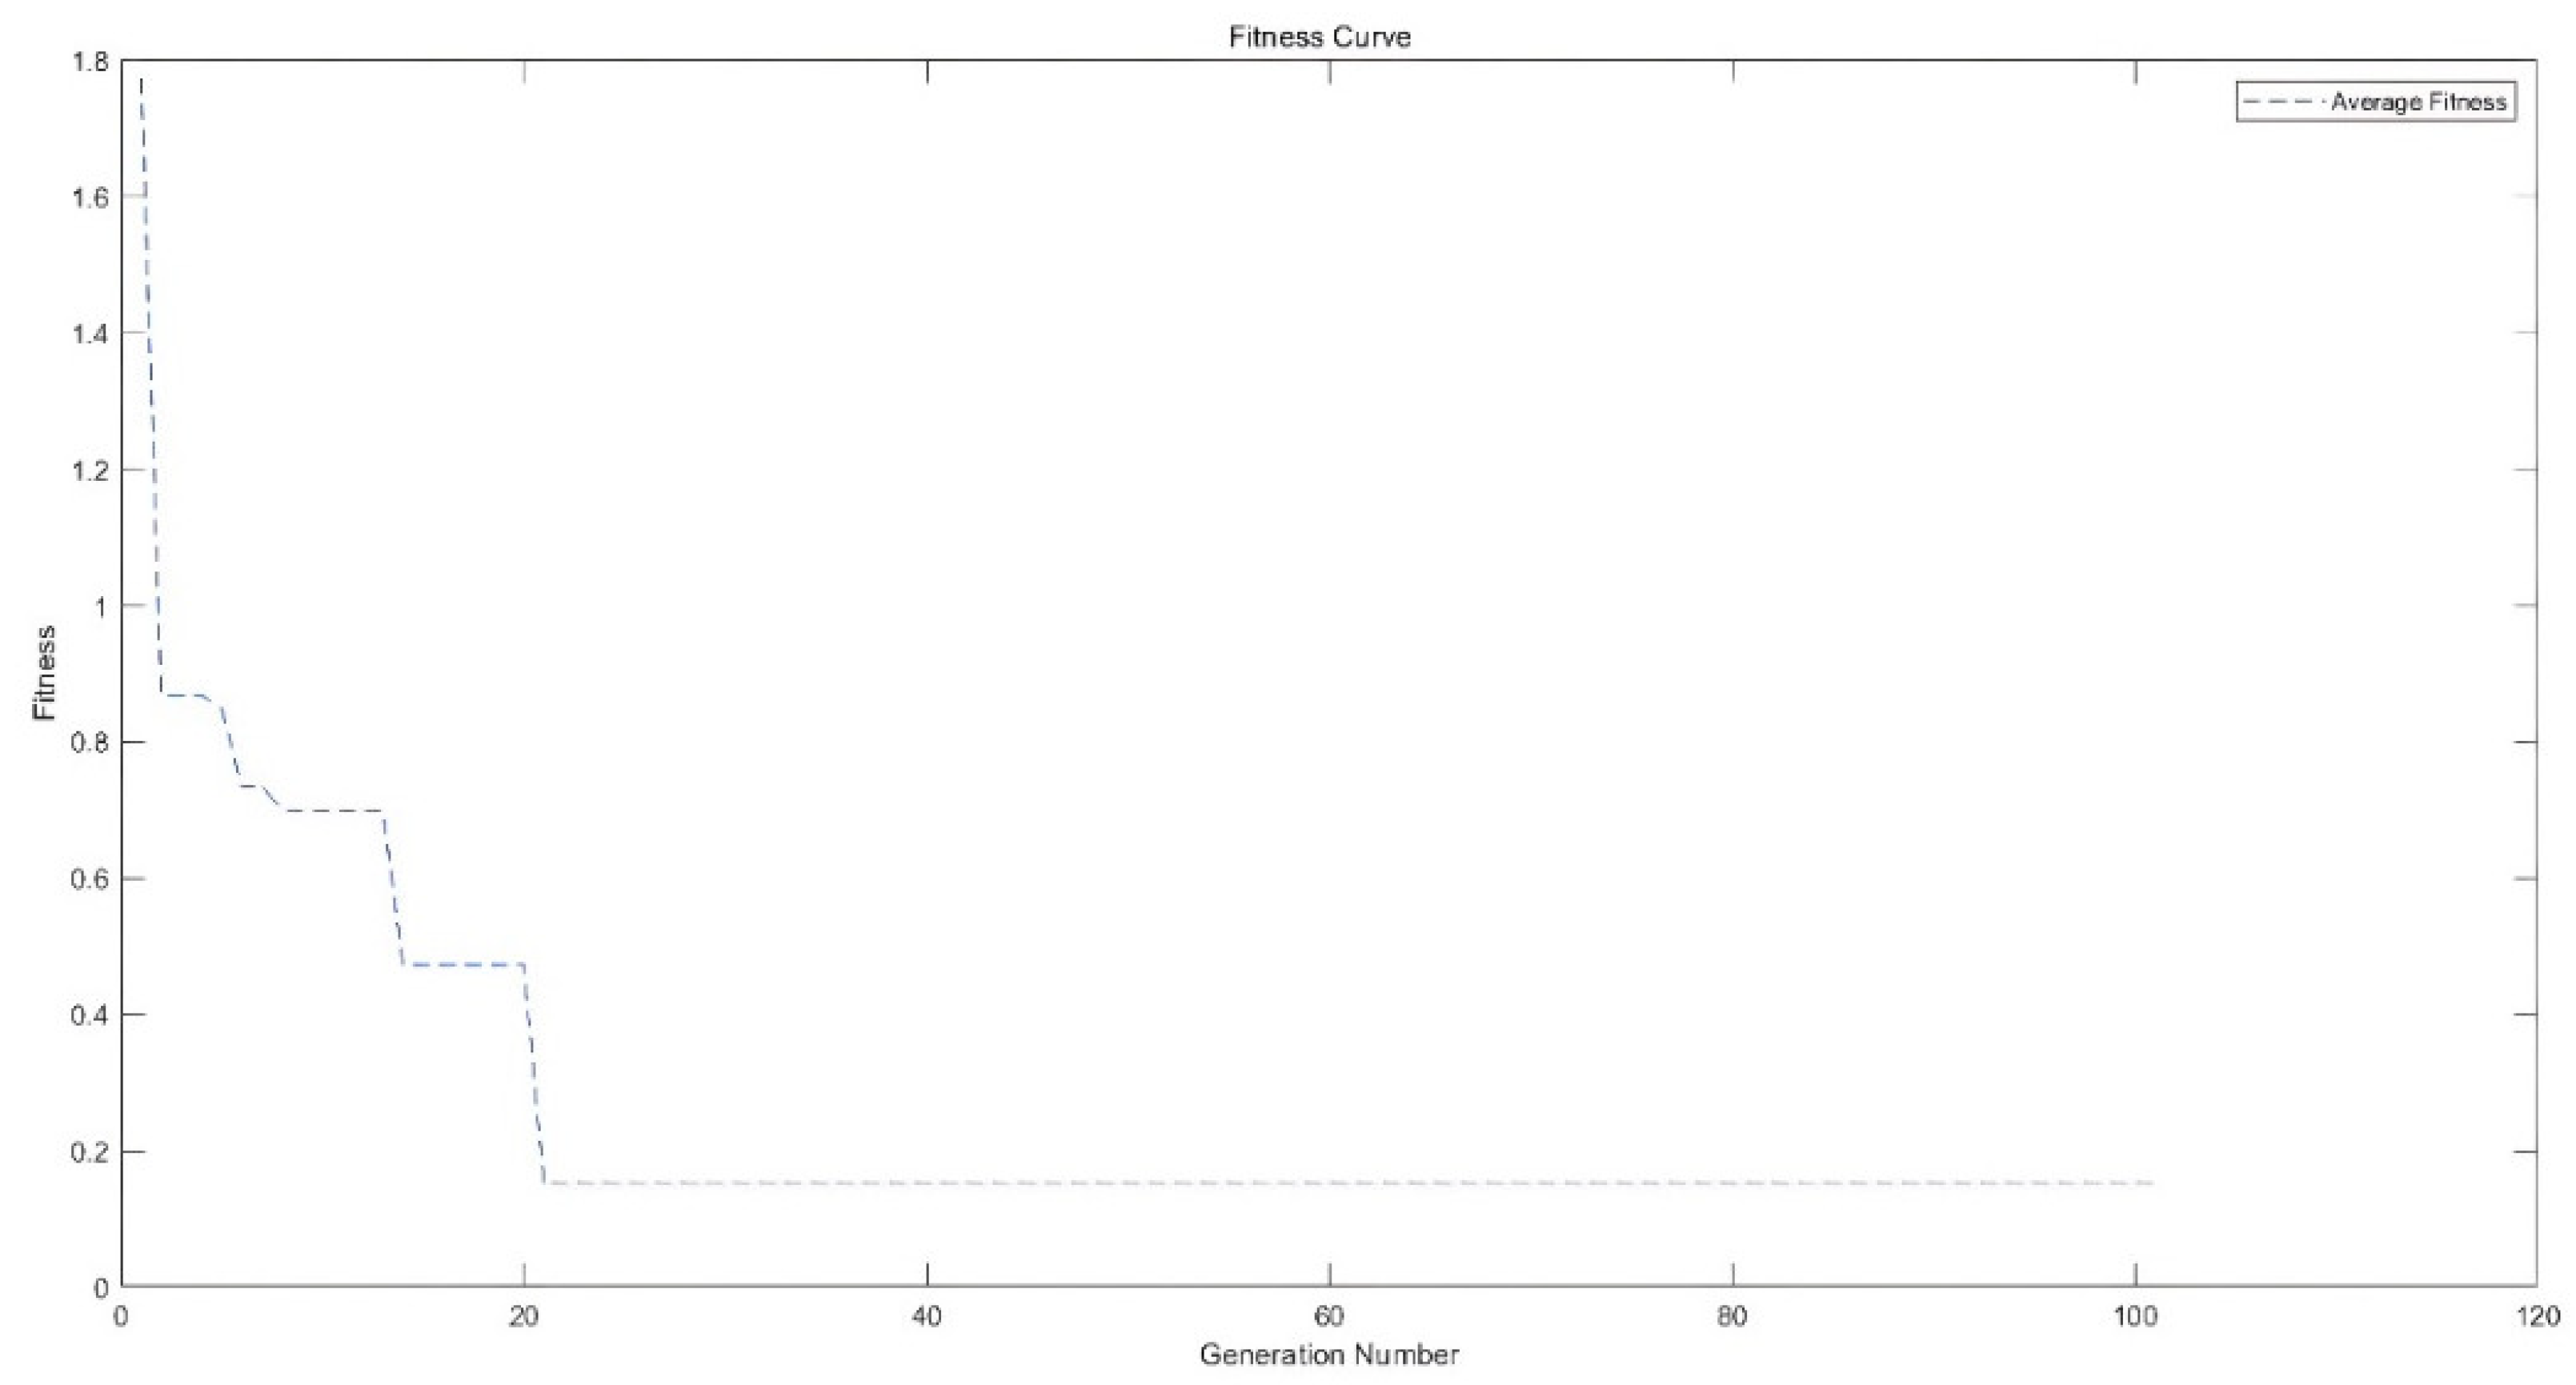
3.3.3. ANN Optimization by Genetic Algorithm
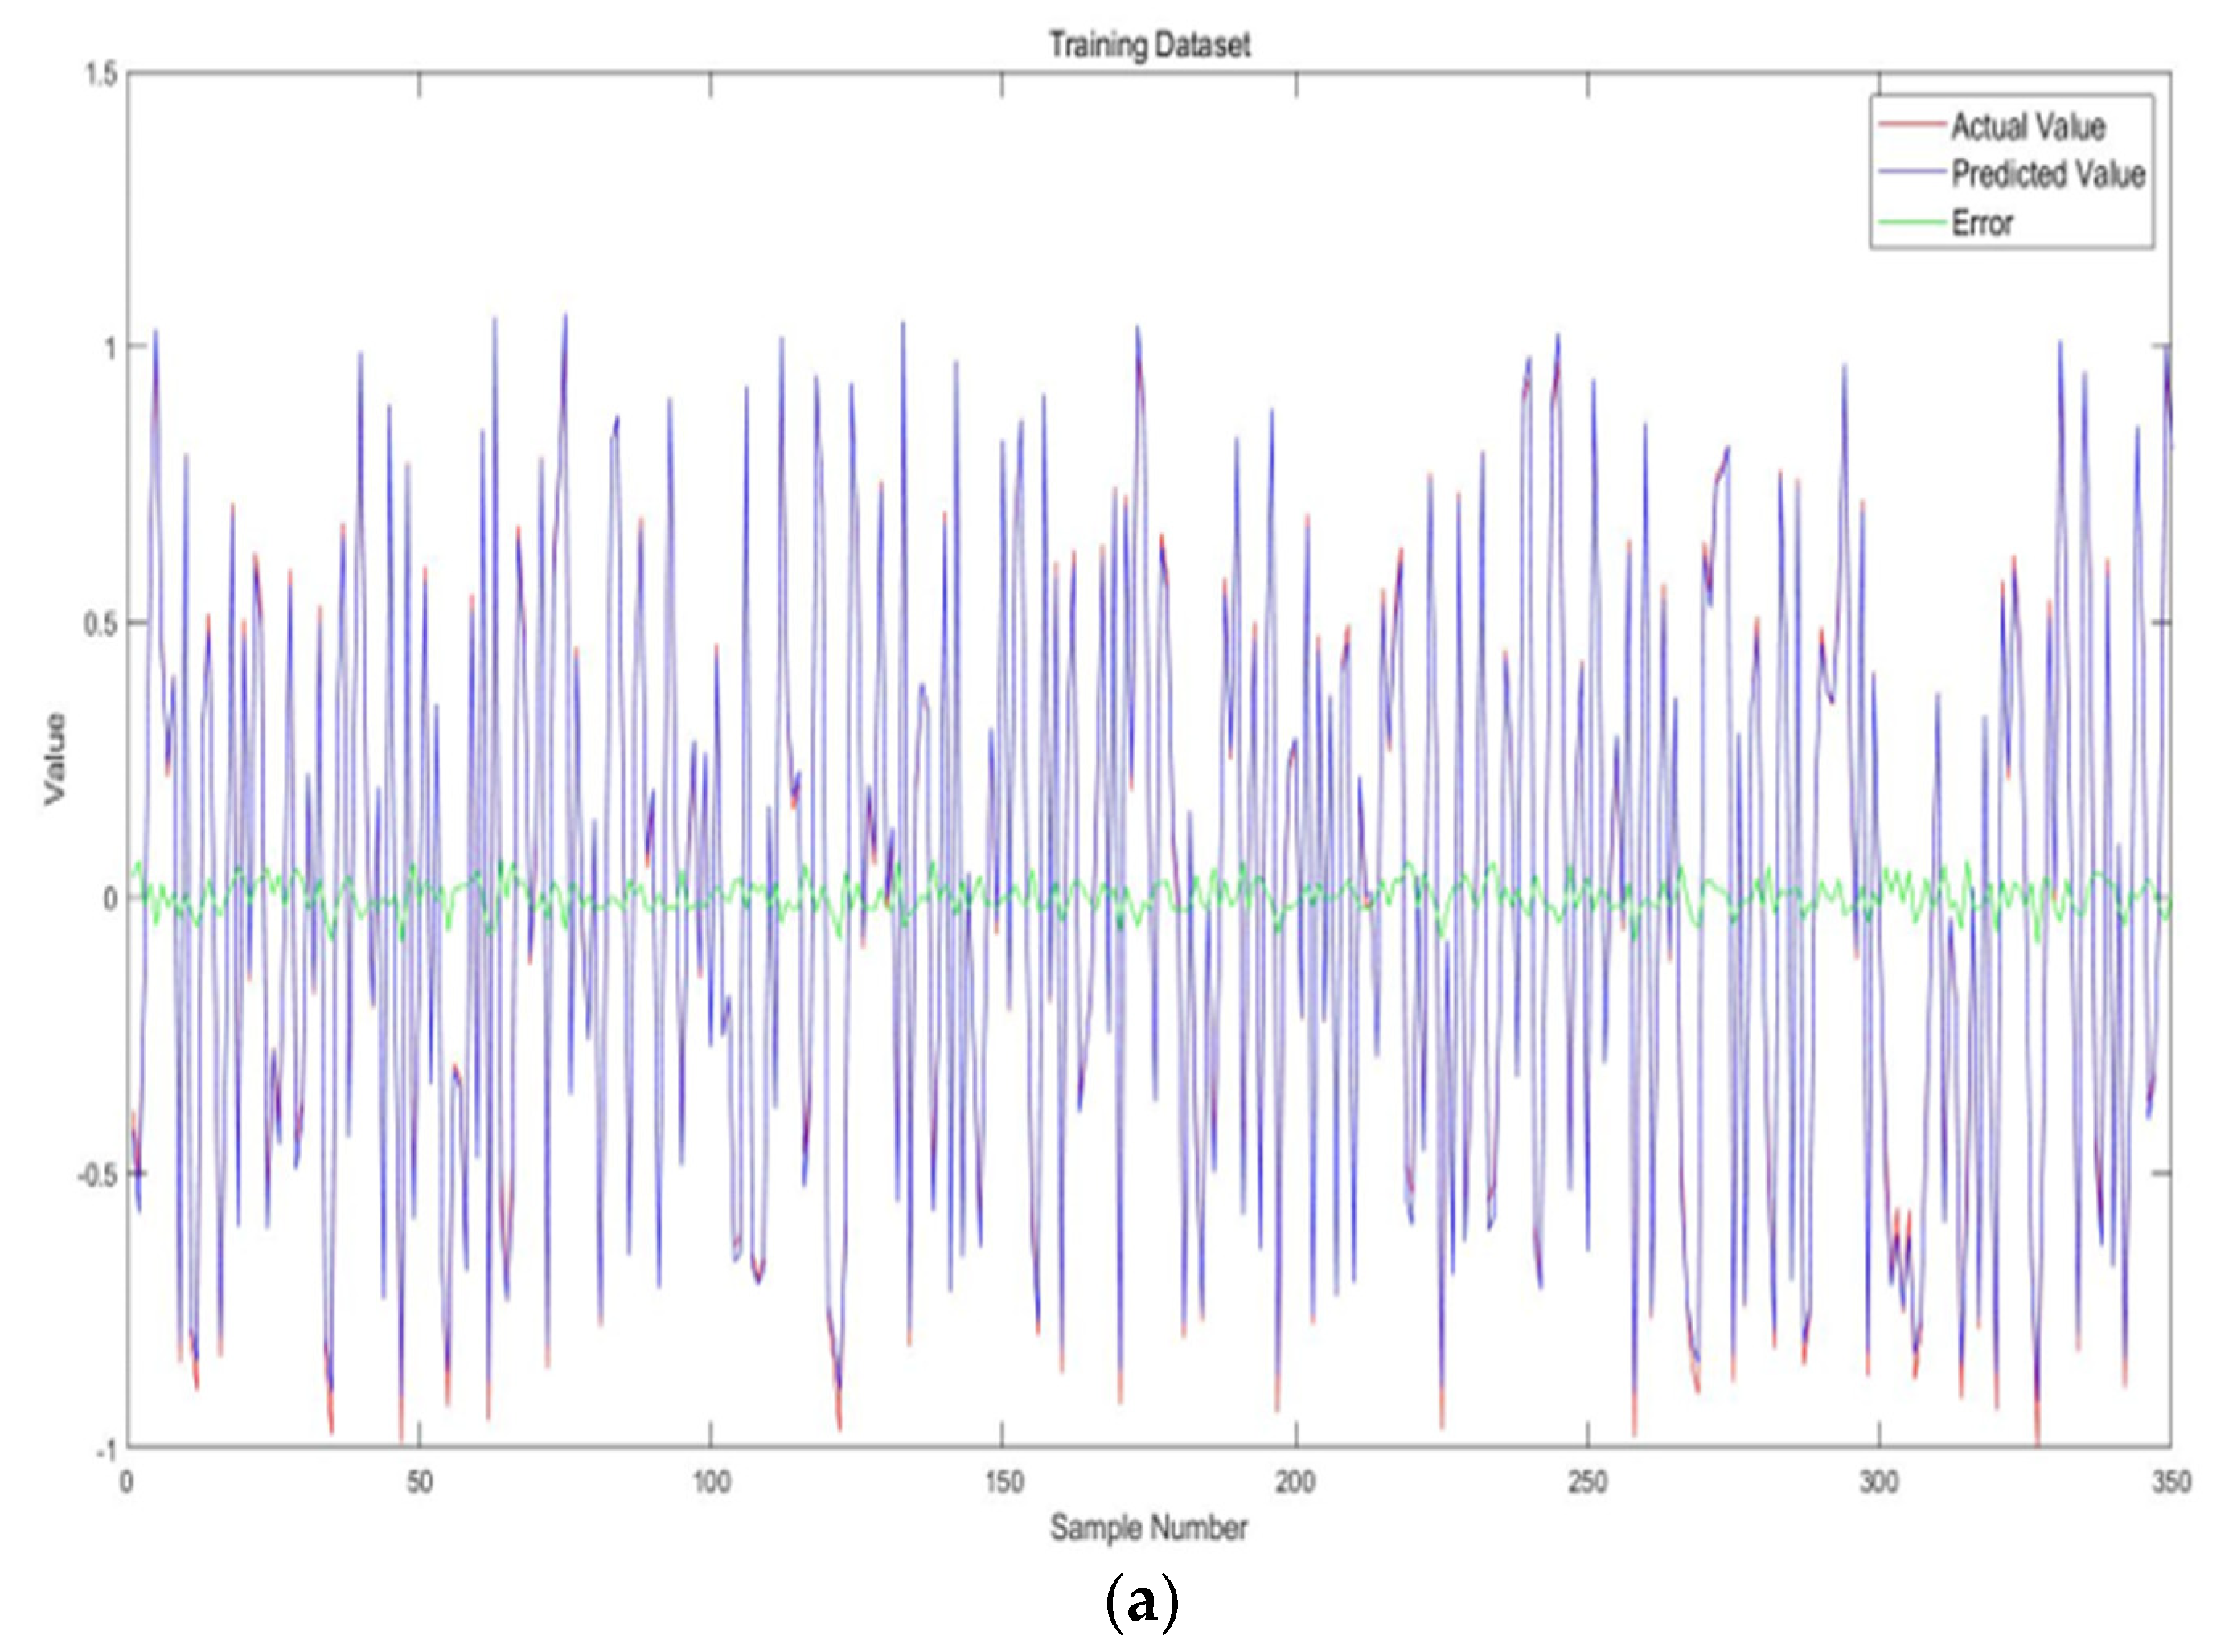
GA is a meta-heuristic, population-based searching algorithm based on natural selection [66,67]. In this method, each individual in the population can generate a solution by reproducing the individuals, and the solution should converge on the best one. In this study, an individual includes four genes such as the number of the hidden layer, the number of nodes at the hidden layer, learning rate and momentum coefficient, formed as shown in Equation (7).
i = ( c 1 ,   c 2 ,   c 3 ,   c 4 ) ,
where i represents an individual chromosome and c1 to c4 are binary codes for the four genes. A population is composed of a number of individual chromosomes, which can be expressed as I = (i1, i2, i3,… in), n denotes the number of individual chromosomes.
GA uses three operators like selection, crossover and mutation to produce next generation chromosomes with better fit. The selection operator chooses the chromosomes with better fit based on the selection criteria defined in the algorithm. In the crossover operator the two selected parent chromosomes were merged from a new solution, which makes the probability of the best fit higher in the next generation. Different crossover rules can be used. In this study, a random crossover from two parents was employed. The mutation operator can make random changes to the chromosome features to avoid the local optimum. The details of the GA can be found in other studies [68,69]. The main parameters were used in Genetic Algorithm are shown in Table 2.

3.3.4. GA-ANN

The number of nodes at the input and output layers is equal to the input and output variables, respectively. The number of the hidden layer and the number of nodes at the hidden layer were determined by GA. The important parameters for an ANN model consist of Nh, Nnh, Lr, and Mc, and the four genes in the binary form were considered for each chromosome. The number of the hidden layer (Nh) was limited 1 to 2, the number of the node at each hidden layer (Nnh) is selected from 1 to 10, and the learning rate (Lr) and momentum coefficient (Mc) ranged from 0 and 1.
The TLS measuring coordinates were seen as inputs, the real value of the coordinates was regarded as output, and then the transfer model was estimated. The ANN models with different momentum coefficients are shown in Figure 13. The ANN3 with the momentum coefficient Mc = 0.876 perform the best compared with other ANN models. As shown in Figure 13, the momentum coefficient cand strongly influence the model performance.
According to the results of the study [70], the position of the laser scanners has significant influence on data scanning accuracy. Hence, the study used the positions of the TLS as the ANN model inputs. In this study, the inputs of the ANN model were the coordinates of the key points, R distance, laser coefficients, and scan conditions. The output of the ANN model was the specified value (specified value of the set distance and space d l i = 12   cm ;   d t i = 15   cm ;   s i = 10   cm ). The value of the cross points can be calculated by using Equations (3)–(5).
Sigmoid function was employed as a transfer function for output and hidden layers of the GA-ANN. The model training process was to adjust the model parameters in order to minimize the error between the output and the target. Mean Squared Error (MSE) was adopted to evaluate the model performance, it can be calculated in Equation (8).
MSE = 1 n i = 1 n ( p i x i ) 2 ,
where n is the number of data samples, pi is the model estimate of the i sample, and xi represents the actual value of the i sample.
During the training process, the number of nodes and layers and functions of the network were changed. MATLAB software was used to train and test the ANN model. The important parameters of the proposed ANN model were first encoded as the genes of the genetic algorithm (GA). Then, the fitness values of each individual chromosome were calculated based on the fitness function. After a series of GA selection, such as the crossover, the mutation and the duplication, the GA can discover the optimal individual chromosome corresponding to the optimal fitness values. The evolution process is shown in Figure 14. It should be noticed that GA can properly coverage the fitness value to the global optimum rather than any other local optimal by random initialization.
According to the GA results, the best number for the hidden layer was found to be one; the best number for the nodes at the hidden layer is six. The structure of the proposed GA-ANN model is shown in Figure 15.
The optimum network results in the lowest MSE. The optimum configuration of the ANN model is shown in Table 3. Moreover, several network configurations with different nodes at hidden layer were developed to evaluate and compare the accuracy of the proposed GA-ANN model in estimating the variables. The MSE function was used to assess the performance of the proposed GA-ANN model. The prediction performance of the models for the data of simulated defects and the coordinates of key points are shown in Table 4. The corresponding rating was provided by averaging each MSE for the models. As shown in Table 4, the proposed GA-ANN model achieves the best results among the other models. To assess the model performance of the prosed GA-ANN model, the study provided model performance value for ANN model and the ANN model optimised by using GA respectively. The model performance of the proposed GA-ANN model and the second-best ANN model compared with the actual value of the measurements are shown in Figure 16.
The obtained estimates from GA-ANN model versus the actual value are described in Figure 17. Obviously, the proposed model can generate reliable predictions as error is nearly zero. The R2 results for the proposed GA-ANN model which are very close to 1 for training and testing dataset, as shown in Figure 18, explored that the proposed GA-ANN can generate high accuracy predictions.
According to [71], the R2 of the ANN model indicates that the inputs provide sufficient information for the model predictions. Based on the results of [72], the Coefficient of Variation-Root Mean Square Error (CV-RMSE) should be <30%, CV-RMSEs of the ANN model is 12.5%, indicating that the developed ANN model meets the standard. Other model performance evaluations, such as Root Mean Square Error (RMSE) and Mean Absolute Error (MAE), also indicate that the model can generate predication with high accuracy.

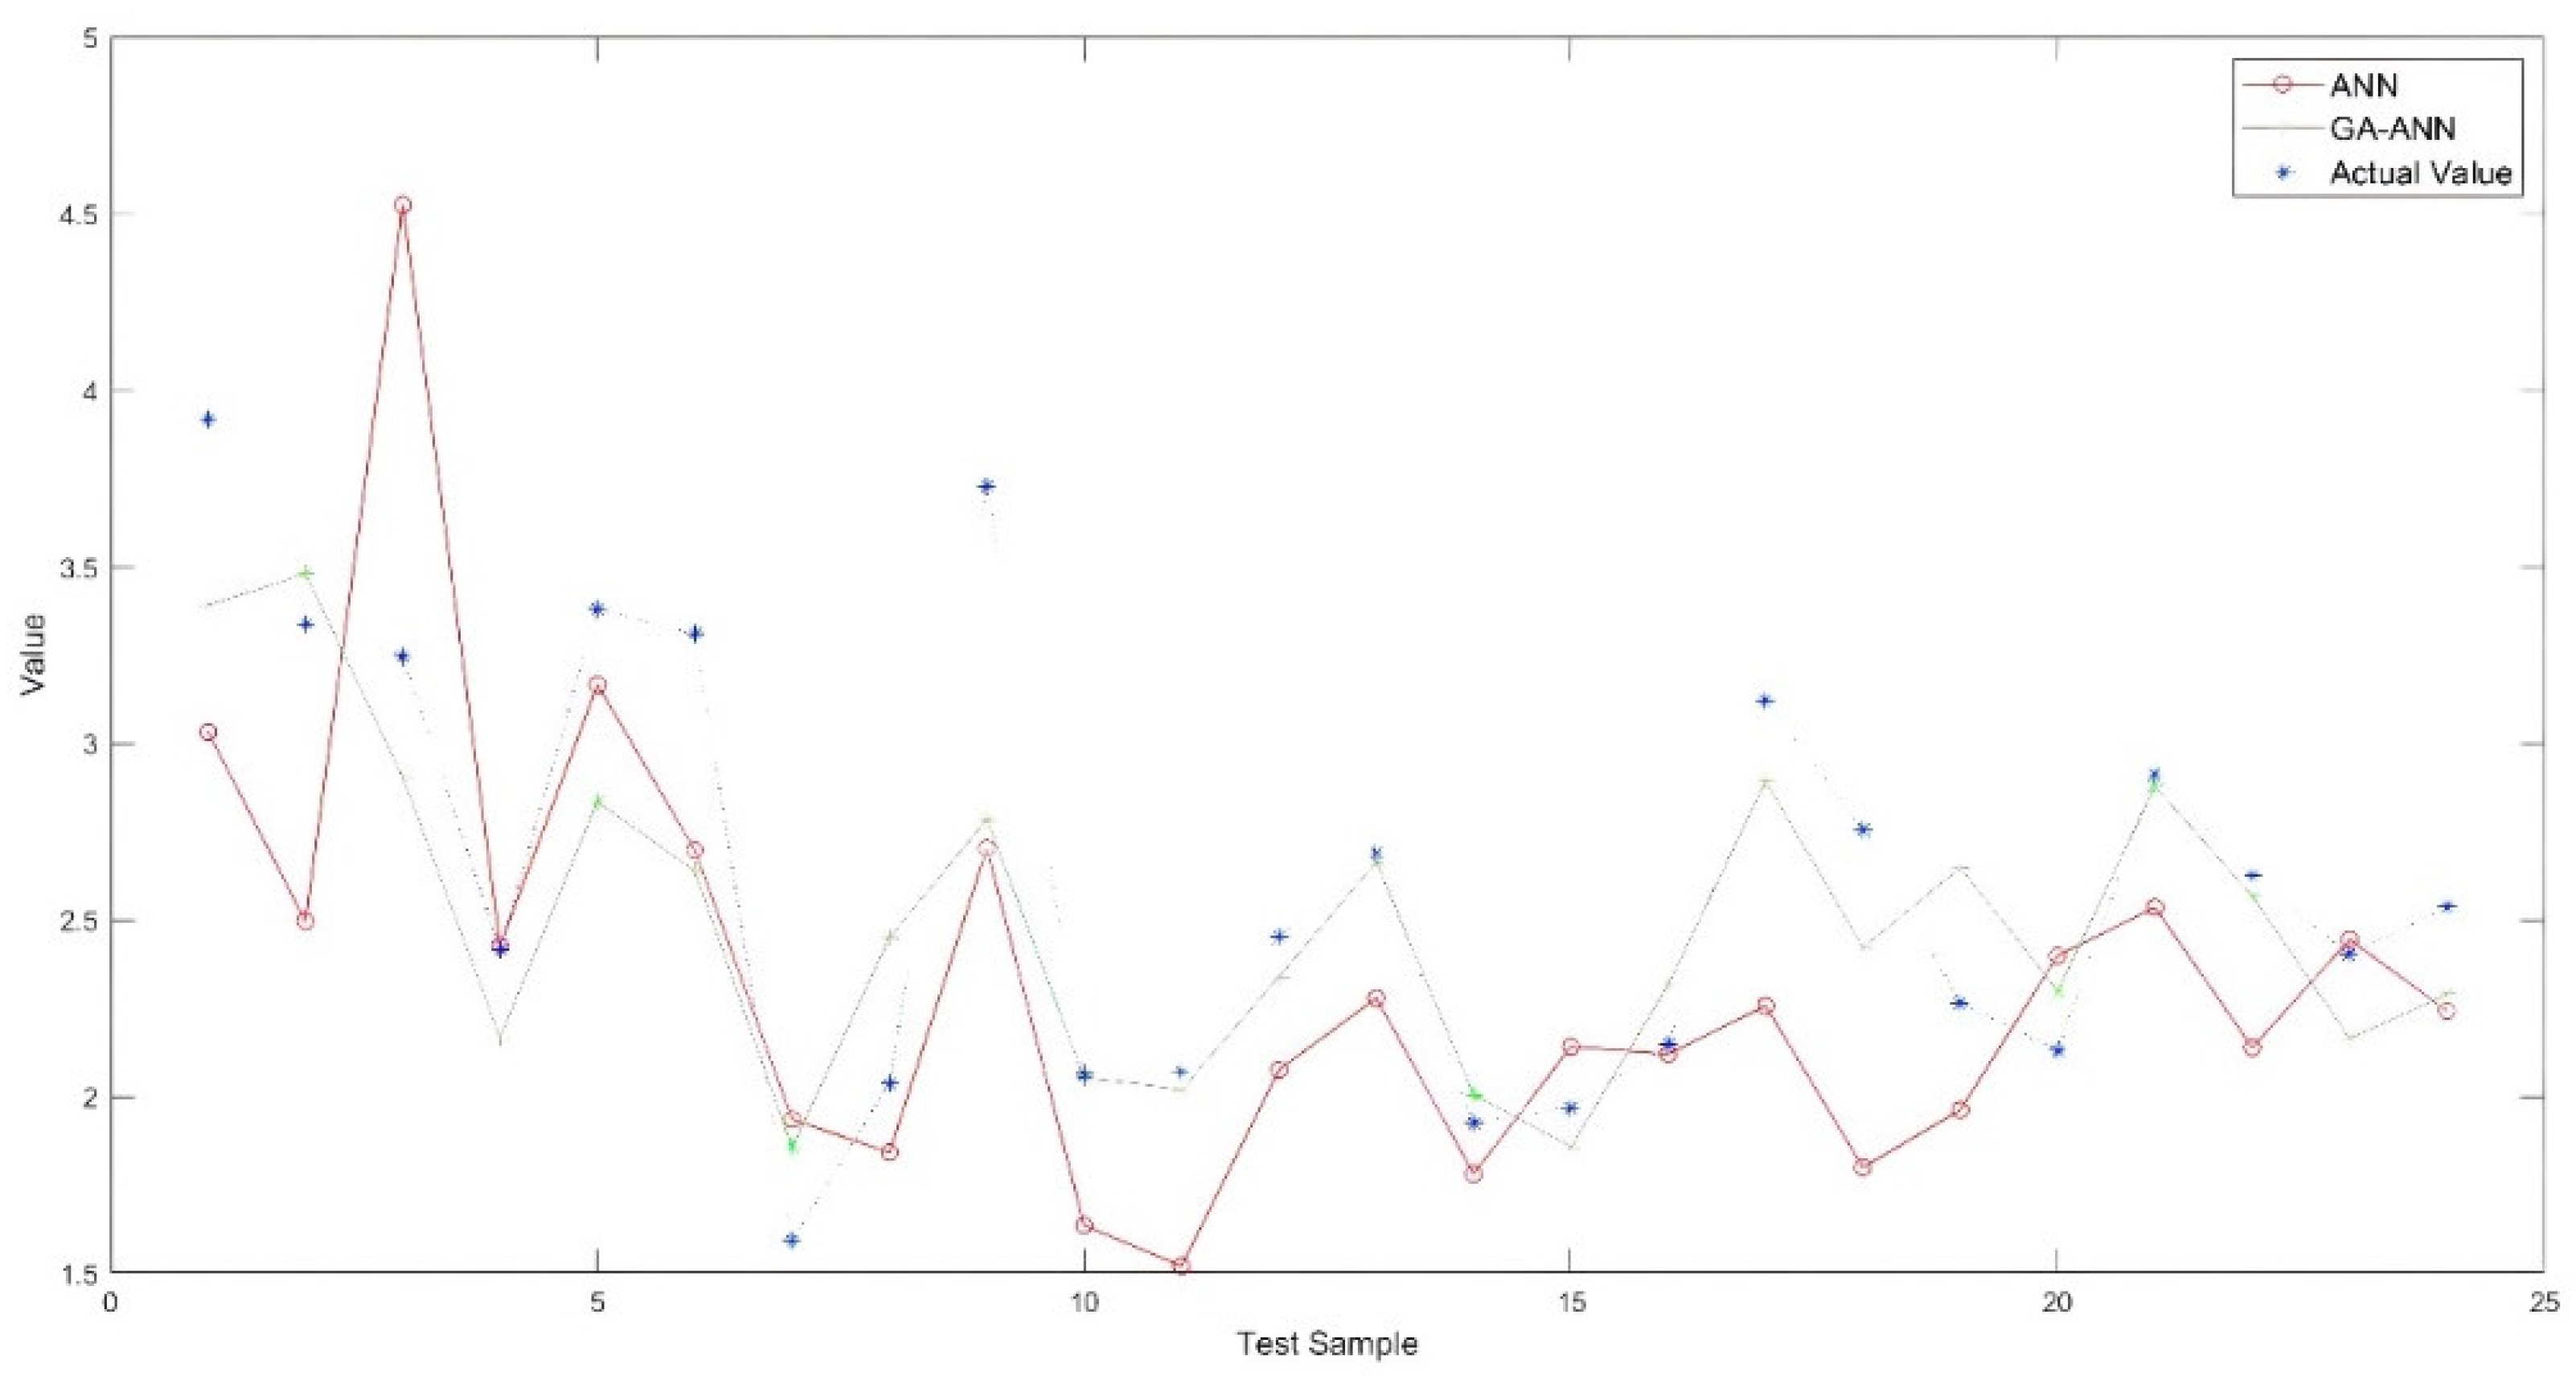
3.3.5. Comparison with Other ML Algorithms
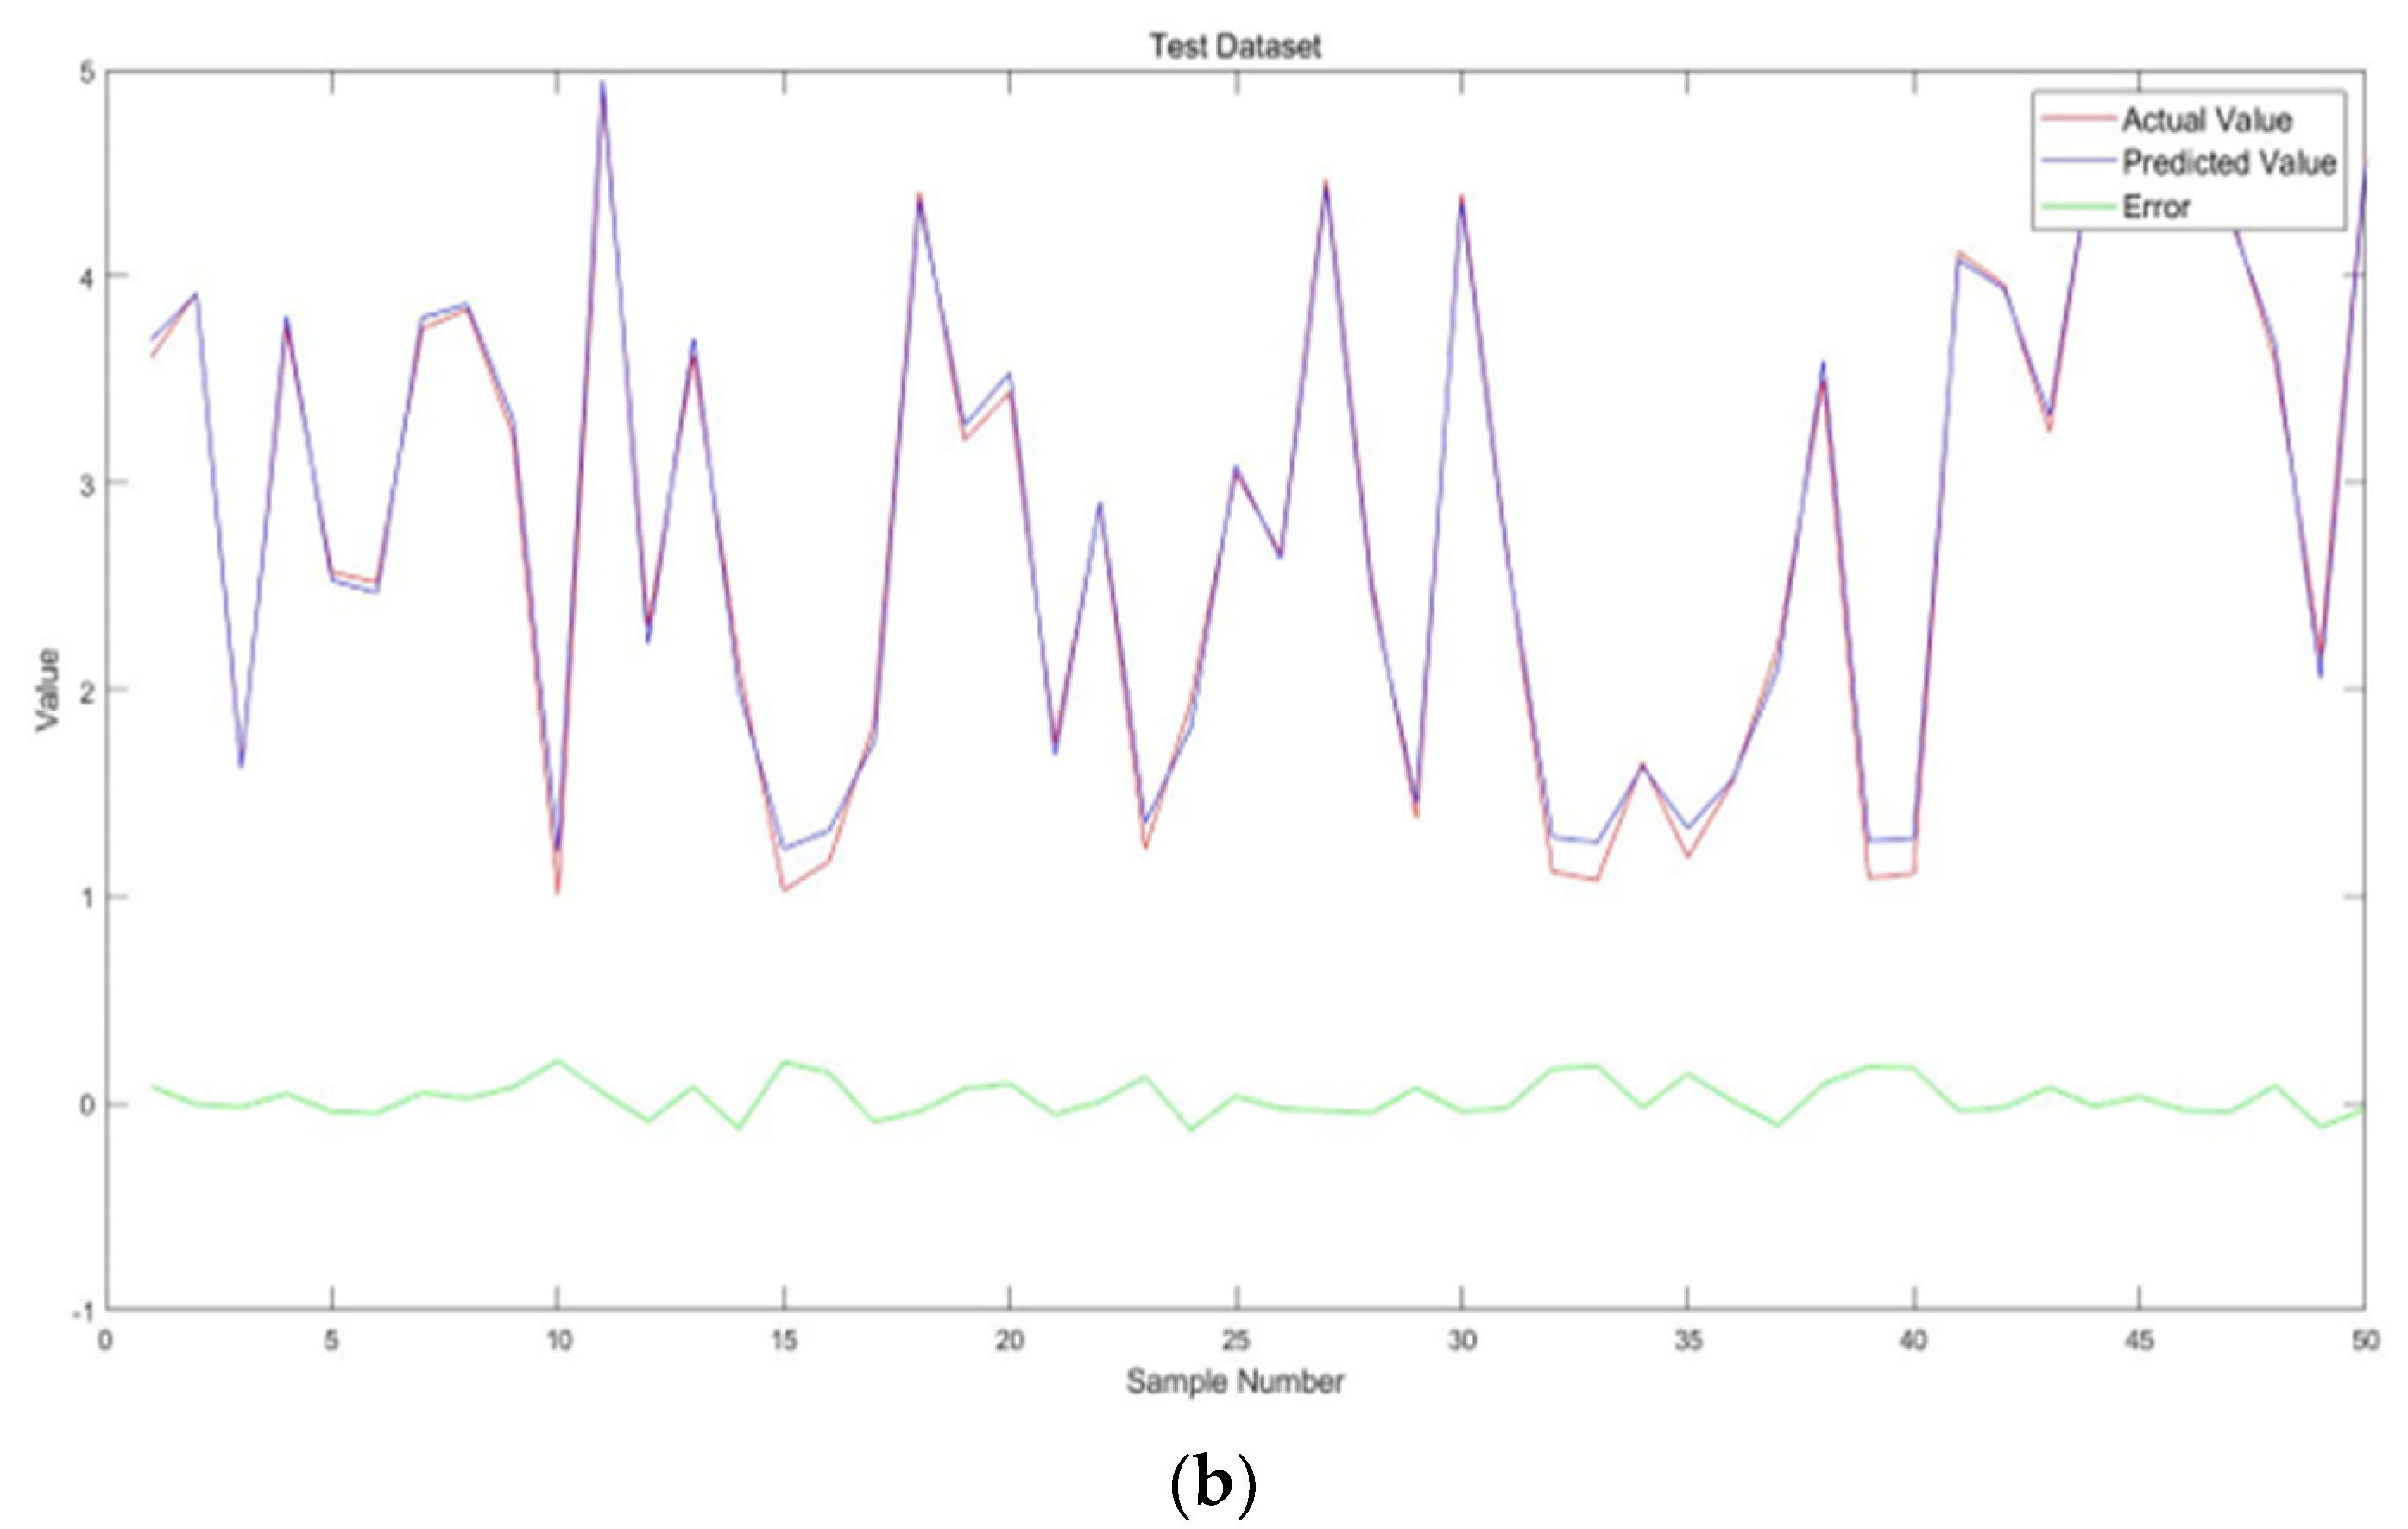
To better demonstrate the GA-ANN learning approach, the common methods (ANN, SVM and RF) that are often used are also applied in this study. Support vector machines (SVMs) are well-known supervised machine learning techniques that were proposed by Cortes and Vapnik [73] to solve classification problems, and then were extended to regression domain by Vapnik et al. [74]. For nonlinear problems, a nonlinear kernel function is utilized. Random forest (RF) is an effective machine learning method proposed in 2001 [75], which can be applied to classification, regression, and feature selection problems. RF is an ensemble learning model with a decision tree as the base classifier, combining bagging and random subspace theory.
To evaluate the performance of the suggested models, three different metrics, Mean square error (MSE), Correlation coefficient (R), and root mean square error equation (RMSE) are introduced. These statistical indicators assess the efficiency, linear relationship, and deviation experienced from the average values. Statistical indices including MSE, R, and RMSE gave an overall view of the precision and error of the model. The performance measurements of the models are shown in Table 5. GA-ANN model was superior, followed by ANN model, RF model and the least was SVM model. This might be indicated that, ANN, SVM, and RF are individual learning algorithms while GA-ANN is an optimized learning algorithm.

3.4. Validation

A different small-scale high formwork model was installed with different values of distance between the poles and tubes and simulated defects in different area, as shown in Table 6. The different value set in the installation was to verify that the model can detect differences to improve the robustness of the training model.
The proposed GA-ANN model was used for predicting the simulated defects and the coordinates of the key points. The convergence process of the proposed GA-ANN model is displayed in Figure 19. The optimal result of the proposed GA-ANN model was obtained after the 100th iteration. In this study, the model was able to detect all the simulated defects and generate accurate coordinates of the key points.

4. Case Study

4.1. Validation on a Real High Formwork

While the prior case studies show the effectiveness of the proposed method, a full in-site test on a real high formwork was carried out to evaluate the effectiveness of the proposed method. The dimensions of the high formwork were 5.5 m × 5.5 m × 6 m, consisting of 49 standard poles and 70 tubes. Both longitudinal and transverse spacing of pole are 0.8 m, while the lift height is 1.5 m. The formation of the high formwork is shown in Figure 20. The object provided an opportunity to validate the approach on a real structure.
As the results may have been influenced by the instrument position error between different point clouds, a control network was adopted to ensure that the horizontal position locates correctly within a millimetre. The error can be absorbed into +2 mm registration errors. Several scans from different viewpoints were collected so that the workflow efficiency could be evaluated in a real situation. Typically, a total of 10–15 min was spent at each position, including setup and scan time. The georeferencing process only took 5 min to complete. The point clouds of the high formwork are shown in Figure 21.

4.2. Discussion of Results

Based on the proposed method, the Z planes were inserted at 5 cm interval from 1 cm to the height of the high formwork. Next, the lines representing the individual poles or tubes were generated. Then, the coordinates of the cross points were input the ANN model. Both longitudinal and transverse spacing of pole and lift height (the distance between two neighbouring ledgers) were checked. Moreover, the perpendicularity of pole and levelness of ledger were inspected. In addition, the angle of the diagonal bracing of the high formwork were checked. The standard error was calculated between real value and estimates. The standard error can be calculated in Equation (9).
SE =   ( Y Y ) 2 N ,
where Y is the real value, Y′ is the estimated value, and N is the number of points to estimate. The overall accuracy is acceptable and the errors fall within the allowable tolerance range. The results are summarized in Table 7. The results indicate that the accuracy of the developed GA-ANN model is satisfied at the millimetre level. It can generate reliable results in real applications.
The purpose of the validation is to examine the performance of the proposed approach dealing with real problems. Moreover, short range (about 10 m), simple scanned area, and scanning from one position can reduce errors. Results of the validation indicate the proposed method can detect and locate defects. Optimistically, it is capable of providing accurate measurements at the magnitude of the millimetre level. Based on the outcomes, the proposed method provides an effective tool for installation quality inspection for high formwork.
Based on the cost and time evaluation, the proposed method can provide an effective tool for quality inspection of a high formwork. The scanning time used for the inspection at every station was only twenty minutes, which suggests the superiority of the adoption of TLS in terms of both cost and time when compared to common methods. For example, a GNSS-based method, which recently was suggested for use in structure monitoring and inspection, has an error at the magnitude of the centimetre level, and requires extensive calculation and processing [76,77]. With such an error budget, it is unacceptable for installation quality inspection for high formwork. Moreover, to improve accuracy, it usually requires the addition of more stations which will significantly increase operation costs. Other methods, like unmanned aerial vehicle (UAV) imagery, are also recommended as an effective tool for installation quality inspection for high formwork. However, based on previous studies [78,79], it has average error of about 15mm. Moreover, it requires sophisticated processing to extract the required information from the raw imagery. In addition, and most importantly, considering factors such as registration errors, missing data or mixed pixels might cause the misidentification of important elements or increase errors in the measuring of the dimensions of high formwork.
Without the use of TLS, to safely conduct quality inspection in a cost- and time-effective manner, and with acceptable accuracy, would prove extremely difficult and labour-intensive. Moreover, the data accuracy of TLS can be improved with the following suggestions: (1) conduct the scan without impacting the line-of-sight; (2) increase scanning resolution; (3) increase the number of scans; (4) scan the high formwork from all faces; (5) widen the range of scan stations.

5. Conclusions

The current study highlighted the advantages of the proposed method using TLS and ANN algorithms for installation quality inspection for a high formwork. When conducting the inspection operation, the non-invasive method, along with full area coverage measurements, are a benefit.
Adoption of the TLS uses less labour when compared to common inspection methods, avoids any labour-related risks, and can access difficult and dangerous areas, which will save significant money and time and greatly improve the performance of the inspection process. The collected point cloud data can be effectively processed using the proposed data extraction approach in this study and can rapidly extract the important elements of the high formwork.
The conventional ANN network was optimized via GA to achieve the optimum parameters of the ANN model including: the number of hidden layers, the number of nodes at the hidden layers, the learning rate and the momentum coefficients. The model performance evaluation parameters and generated result indicate that the proposed GA-ANN model can produce accurate predictions. The generated accurate coordinates of the important points that are the cross points of the poles and ledgers facilitate the spacing calculation between two neighbouring of pole or lift height (the distance between two neighbouring ledgers).
The proposed method can provide accurate results that facilitate quality inspection, safety management and decision making on the construction site. Moreover, the collected measurements can be kept properly, which facilitates further application in safety monitoring for high formwork during concrete cast-in. In addition, the study also provides an indication that measurements with tight tolerances can be achieved not only by using contact methods, but that the proposed methods using TLS outputs can also generate results with the required level of accuracy.
The benefits of the proposed method indicate that TLS can be successfully used in quality inspection and can generate accurate measurements in terms of the quantity and quality of the data points and timing. The measurements based on the proposed method are similar to the set values with acceptable error, and hence confirm the suitability of the proposed method. A successful approach for point cloud data extraction and measurements calculation can be used for other similar structures.
Furthermore, the laser scanning system can be utilized in combination with other techniques like photogrammetry to offer a hybrid method that can provide accurate measurements of the full covering area and the points of interest. TLS measurements can also be combined with BIM to vividly display the structure in real dimensions and state.

Author Contributions

Conceptualization, L.Z. and J.M.; methodology, L.Z.; software, L.Z.; validation, L.Z., J.M. and B.W.; resources, L.Z. and Z.L.; writing—original draft preparation, L.Z.; writing—review and editing, L.Z. and B.W.; visualization, L.Z. and H.Z. All authors have read and agreed to the published version of the manuscript.

Funding

This research was funded by Beijing University of Technology, grant number 314000514121010 and 047000513201. The APC was funded by the two grants.

Institutional Review Board Statement

Not applicable.

Informed Consent Statement

Not applicable.

Data Availability Statement

The data can be provided upon request.

Acknowledgments

The authors would like to thank Beijing University of Technology for its support through the research project. The authors would like to thank China Industry Associations for provide research data. In addition, I would like to thank all practitioners who contributed to this project. The authors really appreciate the reviewers of the paper for their kind advice and encouragement.

Conflicts of Interest

The authors declare no conflict of interest.

Abbreviations

AcronymMeaning
AECArchitecture, Engineering & Construction
ANNArtificial Neutral Network
BPBack Propagation
BIMBuilding Information Modelling
CV-RMSEsCoefficient of Variation-Root Mean Square Error
GAGenetic Algorithm
GA-ANNGenetic Algorithm optimized Artificial Neutral Network
GNSSGlobal Navigation Satellite System
ICPIterative Closet Point
LiDARLight Detection and Ranging
LrLearning rate
MAEMean Absolute Error
MSEMean Squared Error
McMomentum coefficient
NhNumber of hidden layer
NnhNumber of nodes at hidden layer
PCPredicted Coordinates
PSDPredicted Simulated Defects
RFRandom Forest
RMSERoot Mean Square Error
RGBRed, Green & Blue
SEStandard Error
SVMSupport Vector Machine
TLSTerrestrial Laser Scanner
UAVUnmanned Aerial Vehicle

References

  1. Sona, M.; Janakaraj, M. The Impact of Buildability Factors on Formwork in Residential Building Construction. Int. J. Innov. Res. Sci. Eng. Technol. 2019, 8, 1–10. [Google Scholar] [CrossRef]
  2. Sagadevan, R.; Rao, B.N. Experimental and analytical investigation of structural performance of vertical concrete formworks. Asian J. Civ. Eng. 2019, 1–12. [Google Scholar] [CrossRef]
  3. Ramesh Kannan, M.; Helen Santhi, M. Automated constructability rating framework for concrete formwork systems using building information modelling. Asian J. Civ. Eng. 2018, 19, 387–413. [Google Scholar] [CrossRef]
  4. Lee, D.; Lim, H.; Lee, D.; Cho, H.; Kang, K.-I. Assessment of Delay Factors for Structural Frameworks in Free-form Tall Buildings Using the FMEA. Int. J. Concr. Struct. Mater. 2019, 13, 1–11. [Google Scholar] [CrossRef]
  5. Zhao, Z.G. The Support System of the High Formwork Construction Techniques and Quality Management, 1st ed.; China Architecture & Building Press: Beijing, China, 2016. [Google Scholar]
  6. Xie, N. Safety Control for the Support System of High Formwork, 1st ed.; China Architecture & Building Press: Beijing, China, 2012. [Google Scholar]
  7. Cai, X.F.; Zhuang, J.P.; Zhou, J.Z.; Zheng, Y.Q. The Support System of Super High Formwork Investigation and Application; China Architecture & Building Press: Beijing, China, 2012. [Google Scholar]
  8. MoHURD. Cuplok Scaffolding Safety Technical Standard; Ministry of Housing and Urban-Rural Development: Beijing, China, 2009; Volume JGJ166-2008. [Google Scholar]
  9. MoHURD. Steel Tubular Scaffold with Couplers Safety Technical Standard; Ministry of Housing and Urban-Rural Development: Beijing, China, 2011; Volume JGJ 130-2011. [Google Scholar]
  10. MoHURD. Disk Lock Steel Tubular Scaffold Safety Technical Standard; Ministry of Housing and Urban-Rural Development: Beijing, China, 2021; Volume JGJ/T231-2021. [Google Scholar]
  11. Jaafar, H.A.; Meng, X.; Sowter, A.; Bryan, P. New approach for monitoring historic and heritage buildings: Using terrestrial laser scanning and generalised Procrustes analysis. Struct. Control Health Monit. 2017, 24, e1987. [Google Scholar] [CrossRef]
  12. Yang, Y.; Zhang, Y.; Tan, X. Review on Vibration-Based Structural Health Monitoring Techniques and Technical Codes. Symmetry 2021, 13, 1998. [Google Scholar] [CrossRef]
  13. Van Dijk, N.P.; Gamstedt, E.K.; Bjurhager, I. Monitoring archaeological wooden structures: Non-contact measurements systems and interpretation as average strain fields. J. Cult. Herit. 2015, 17, 102–133. [Google Scholar] [CrossRef]
  14. Yang, Y.; Cheng, Q.; Zhu, Y.; Wang, L.; Jin, R. Feasibility Study of Tractor-Test Vehicle Technique for Practical Structural Condition Assessment of Beam-Like Bridge Deck. Remote Sens. 2020, 12, 114. [Google Scholar] [CrossRef] [Green Version]
  15. Yang, Y.; Lu, H.; Tan, X.; Chai, H.K.; Wang, R.; Zhang, Y. Fundamental mode shape estimation and element stiffness evaluation of girder bridges by using passing tractor-trailers. Mech. Syst. Signal Processing 2022, 169, 108746. [Google Scholar] [CrossRef]
  16. Law, D.W.; Silcock, D.; Holden, L. Terrestrial laser scanner assessment of deteriorating concrete structures. Struct. Control Health Monit. 2018, 25, e2156. [Google Scholar] [CrossRef]
  17. Barbarella, M.; Fiani, M.; Lugli, A. Landslide monitoring using multitemporal terrestrial laser scanning for ground displacement analysis. Geomat. Nat. Hazards Risk 2015, 6, 398–418. [Google Scholar] [CrossRef]
  18. Guarnieri, A.; Masiero, A.; Vettore, A.; Pirotti, F. Evaluation of the dynamic processes of a landslide with laser scanners and Bayesian methods. Geomat. Nat. Hazards Risk 2015, 5, 614–634. [Google Scholar] [CrossRef] [Green Version]
  19. Gordon, C.; Akinci, B.; Garrett, J.H. Formalism for construction inspection planning: Requirements and process concept. J. Comput. Civ. Eng. 2007, 21, 29–38. [Google Scholar] [CrossRef]
  20. Akinci, B.; Boukamp, F.; Gordon, C.; Huber, D.; Lyons, C.; Park, K. A formalism for utilization of sensor systems and integrated project models for active construction quality control. Autom. Constr. 2006, 15, 124–138. [Google Scholar] [CrossRef] [Green Version]
  21. Park, H.S.; Lee, H.M.; Adeli, H.; Lee, I. A new approach for health monitoring of structures: Terrestrial laser scanning. Comput. Civ. Infrastruct. Eng. 2007, 22, 19–30. [Google Scholar] [CrossRef]
  22. Nie, Y.; Chen, Q.; Chen, T.; Sun, Z.; Dai, B. Camera and lidar fusion for road intersection detection road intersection detection. In Proceedings of the IEEE Symposium on Electrical & Electronics Engineering (EEESYM), Kuala Lumpur, Malaysia, 24–27 June 2012; pp. 273–276. [Google Scholar]
  23. Volk, R.; Stengel, J.; Schultmann, F. Building information modeling (BIM) for existing buildings—Literature review and future needs. Autom. Constr. 2014, 38, 109–127. [Google Scholar] [CrossRef] [Green Version]
  24. Mosalam, K.M.; Takhirov, S.M.; Park, S. Applications of laser scanning to structures in laboratory tests and field surveys. Struct. Control. Health Monit. 2014, 21, 115–134. [Google Scholar] [CrossRef]
  25. Truong-Hong, L.; Laefer, D.F.; Hinks, T.; Carr, H. Combining an angle criterion with voxelization and the flying voxel method in reconstructing building models from LiDAR data. Comput.-Aided Civ. Infrastruct. Eng. 2013, 28, 112–129. [Google Scholar] [CrossRef] [Green Version]
  26. Al-Neshawy, F.; Piironen, J.; Peltola, S.; Erving, A.; Heiska, N.; Nuikka, M.; Jari, P. Measuring the bowing of marble panels in building facades using terrestrial laser scanning technology. J. Inf. Technol. Constr. (ITcon) 2010, 15, 64–74. [Google Scholar]
  27. Armesto-González, J.; Riveiro-Rodríguez, B.; González-Aguilera, D.; Rivas-Brea, M.T. Terrestrial laser scanning intensity data applied to damage detection for historical buildings. J. Archaeol. Sci. 2010, 37, 3037–3047. [Google Scholar] [CrossRef]
  28. Mukupa, W.; Roberts, G.W.; Hancock, C.M.; Al-Manasir, K. A non-destructive technique for health assessment of fire-damaged concrete elements using terrestrial laser scanning. J. Civ. Struct. Health Monit. 2016, 6, 665–679. [Google Scholar] [CrossRef] [Green Version]
  29. Pătrăucean, V.; Armeni, I.; Nahangi, M.; Yeung, J.; Brilakis, I.; Haas, C. State of research in automatic as-built modelling. Adv. Eng. Inform. 2015, 29, 162–171. [Google Scholar] [CrossRef] [Green Version]
  30. Kim, C.; Son, H.; Kim, C. Fully automated registration of 3D data to a 3D CAD model for project progress monitoring. Autom. Constr. 2013, 35, 587–594. [Google Scholar] [CrossRef]
  31. Rebolj, D.; Pučko, Z.; Babič, N.Č.; Bizjak, M.; Mongus, D. Point cloud quality requirements for Scan-vs-BIM based automated construction progress monitoring. Autom. Constr. 2017, 84, 323–334. [Google Scholar] [CrossRef]
  32. Son, H.; Kim, C.; Kim, C. 3D reconstruction of as-built industrial instrumentation models from laser-scan data and a 3D CAD database based on prior knowledge. Autom. Constr. 2015, 49, 193–200. [Google Scholar] [CrossRef]
  33. Pu, S.; Vosselman, G. Knowledge based reconstruction of building models from terrestrial laser scanning data. ISPRS J. Photogramm. Remote Sens. 2009, 64, 575–584. [Google Scholar] [CrossRef]
  34. Budroni, A.; Boehm, J. Automated 3D reconstruction of interiors from point clouds. Int. J. Archit. Comput. 2010, 8, 55–73. [Google Scholar] [CrossRef]
  35. Ochmann, S.; Vock, R.; Wessel, R.; Klein, R. Automatic reconstruction of parametric building models from indoor point clouds. Comput. Graph. 2016, 54, 94–103. [Google Scholar] [CrossRef] [Green Version]
  36. Anil, E.B.; Tang, P.; Akinci, B.; Huber, D. Deviation analysis method for the assessment of the quality of the as-is Building Information Models generated from point cloud data. Autom. Constr. 2013, 35, 507–516. [Google Scholar] [CrossRef]
  37. Kim, M.K.; Cheng, J.C.; Sohn, H.; Chang, C.C. A framework for dimensional and surface quality assessment of precast concrete elements using BIM and 3D laser scanning. Autom. Constr. 2015, 49, 225–238. [Google Scholar] [CrossRef]
  38. Kim, M.K.; Sohn, H.; Chang, C.C. Automated dimensional quality assessment of precast concrete panels using terrestrial laser scanning. Autom. Constr. 2014, 45, 163–177. [Google Scholar] [CrossRef]
  39. Zeibak-Shini, R.; Sacks, R.; Ma, L.; Filin, S. Towards generation of as-damaged BIM models using laser-scanning and as-built BIM: First estimate of as-damaged locations of reinforced concrete frame members in masonry infill structures. Adv. Eng. Inform. 2016, 30, 312–326. [Google Scholar] [CrossRef]
  40. Riveiro, B.; Lourenço, P.B.; Oliveira, D.V.; González-Jorge, H.; Arias, P. Automatic morphologic analysis of quasi-periodic masonry walls from LiDAR. Comput.-Aided Civ. Infrastruct. Eng. 2016, 31, 305–319. [Google Scholar] [CrossRef]
  41. Brigham, C.A.P.; Crider, J.G. A new metric for morphologic variability using landform shape classification via supervised machine learning. Geomorphology 2021, 399, 108065. [Google Scholar] [CrossRef]
  42. Lee, J.; Son, H.; Kim, C.; Kim, C. Skeleton-based 3D reconstruction of as-built pipelines from laser-scan data. Autom. Constr. 2013, 35, 199–207. [Google Scholar] [CrossRef]
  43. Czerniawski, T.; Nahangi, M.; Haas, C.; Walbridge, S. Pipe spool recognition in cluttered point clouds using a curvature-based shape descriptor. Autom. Constr. 2016, 71, 346–358. [Google Scholar] [CrossRef]
  44. Holgado-Barco, A.; Gonz´ alez-Aguilera, D.; Arias-Sanchez, P.; Martinez-Sanchez, J. Semiautomatic extraction of road horizontal alignment from a mobile LiDAR system. Comput.-Aided Civ. Infrastruct. Eng. 2015, 30, 217–228. [Google Scholar] [CrossRef]
  45. Wojtkowska, M.; Kedzierski, M.; Delis, P. Validation of terrestrial laser scanning and artificial intelligence for measuring deformations of cultural heritage structures. Measurement 2021, 167, 1–18. [Google Scholar] [CrossRef]
  46. Fawzy, H.E.-D. 3D laser scanning and close-range photogrammetry for buildings documentation: A hybrid technique towards a better accuracy. Alex. Eng. J. 2019, 58, 1191–1204. [Google Scholar] [CrossRef]
  47. Kim, M.-K.; Thedjaa, J.P.P.; Wang, Q. Automated dimensional quality assessment for formwork and rebar of reinforced concrete components using 3D point cloud data. Autom. Constr. 2020, 112, 1–14. [Google Scholar] [CrossRef]
  48. Liu, J.; Zhang, Q.; Wu, J.; Zhao, Y. Dimensional accuracy and structural performance assessment of spatial structure components using 3D laser scanning. Autom. Constr. 2018, 96, 324–336. [Google Scholar] [CrossRef]
  49. Wang, Q.; Cheng, J.C.P.; Sohn, H. Automated Estimation of Reinforced Precast Concrete Rebar Positions Using Colored Laser Scan Data. Comput.-Aided Civ. Infrastruct. Eng. 2017, 32, 787–802. [Google Scholar] [CrossRef]
  50. Wang, Q.; Kim, M.K.; Cheng, J.C.; Sohn, H. Automated quality assessment of precast concrete elements with geometry irregularities using terrestrial laser scanning. Autom. Constr. 2016, 68, 170–182. [Google Scholar] [CrossRef]
  51. Bosché, F. Automated recognition of 3D CAD model objects in laser scans and calculation of as-built dimensions for dimensional compliance control in construction. Adv. Eng. Inform. 2010, 24, 107–118. [Google Scholar] [CrossRef]
  52. Lee, K.H.; Park, H.P. Automated inspection planning of free-form shape parts by laser scanning. Robot. Comput.-Integr. Manuf. 2000, 16, 201–210. [Google Scholar] [CrossRef]
  53. Nuttens, T.; Stal, C.; De Backer, H.; Schotte, K.; Van Bogaert, P.; De Wulf, A. Methodology for the ovalization monitoring of newly built circular train tunnels based on laser scanning: Liefkenshoek Rail Link (Belgium). Autom. Constr. 2014, 43, 1–9. [Google Scholar] [CrossRef]
  54. Alba, M.; Scaioni, M. Comparison of techniques for terrestrial laser scanning data georeferencing applied to 3-D modelling of cultural heritage. Int. Arch. Photogramm. Remote Sens. Spat. Inf. Sci. 2007, 7, 1–8. [Google Scholar]
  55. Besl, P.J.; McKay, N.D. A method for registration of 3-D shapes. IEEE Trans. Pattern Anal. Mach. Intell. 1992, 14, 239–256. [Google Scholar] [CrossRef]
  56. Sgrenzaroli, M.; Wolfart, E. Accurate texture-mapped 3D models for documentation, surveying and presentation purposes. In Proceedings of the Scanning For Cultural Heritage Recording, Corfu, Greece, 1–2 September 2002; The ICOMOS/ISPRS Committee for Documentation of Cultural Heritage: Corfu, Greece, 2002. [Google Scholar]
  57. Hebert, M.; Krotkov, E. 3D measurements from imaging laser radars: How good are they? In Proceedings of the IEEE/RSJ International Workshop on Intelligent Robots and Systems 1991, Osaka, Japan, 3–5 November 1991; pp. 359–364. [Google Scholar]
  58. Tuley, J.; Vandapel, N.; Hebert, M. Analysis and removal of artifacts in 3-D LADAR data. In Proceedings of the 2005 IEEE International Conference on Robotics and Automation, Barcelona, Spain, 18–22 April 2005; pp. 2203–2210. [Google Scholar]
  59. Tang, P.; Huber, D.; Akinci, B. A comparative analysis of depth-discontinuity and mixed-pixel detection algorithms. In Proceedings of the Sixth International Conference on 3-D Digital Imaging and Modeling (3DIM 2007), Montreal, QC, Canada, 21–23 August 2007; pp. 29–38. [Google Scholar]
  60. Wang, Q.; Sohn, H.; Cheng, J.C. Development of a mixed pixel filter for improved dimension estimation using AMCW laser scanner. ISPRS J. Photogramm. Remote Sens. 2016, 119, 246–258. [Google Scholar] [CrossRef]
  61. Adams, R.; Bischof, L. Seeded Region Growing. IEEE Trans. Pattern Anal. Mach. Intell. 1994, 16, 641–647. [Google Scholar] [CrossRef] [Green Version]
  62. Simpson, P.K. Artificial Neural Systems: Foundations, Paradigms, Applications, and Implementations, 1st ed.; Pergamon Pr: Oxford, UK, 1990. [Google Scholar]
  63. Joshi, S.; Pande, S. Intelligent process modeling and optimization of die-sinking electric discharge machining. Appl. Soft Comput. 2011, 11, 2743–2755. [Google Scholar] [CrossRef]
  64. Momeni, E.; Nazir, R.; Jahed Armaghani, D.; Maizir, H. Prediction of pile bearing capacity using a hybrid genetic algorithm-based ANN. Measurement 2014, 57, 122–131. [Google Scholar] [CrossRef]
  65. Khandelwal, M.; Marto, A.; Fatemi, S.A.; Ghoroqi, M.; Armaghani, D.J.; Singh, T.N.; Tabrizi, O. Implementing an ANN model optimized by genetic algorithm for estimating cohesion of limestone samples. Eng. Comput. 2017, 34, 307–317. [Google Scholar] [CrossRef]
  66. Adeli, H.; Hung, S.L. Machine Learning: Neural Networks, Genetic Algorithms, and Fuzzy Systems, 1st ed.; John Wiley & Sons, Inc.: Hoboken, NJ, USA, 1994. [Google Scholar]
  67. Sardinas, R.Q.; Santana, M.R.; Brindis, E.A. Genetic algorithm-based multi-objective optimization of cutting parameters in turning processes. Eng. Appl. Artif. Intell. 2006, 19, 127–133. [Google Scholar] [CrossRef]
  68. Stone, R.; Krishnamurthy, K. A neural network thrust force controller to minimize delamination during drilling of graphite-epoxy laminates. Int. J. Mach. Tools Manuf. 1996, 36, 985–1003. [Google Scholar] [CrossRef]
  69. Dhupal, D.; Doloi, B.; Bhattacharyya, B. Optimization of process parameters of Nd: YAG laser microgrooving of Al2TiO5 ceramic material by response surface methodology and artificial neural network algorithm. J. Eng. Manuf. 2007, 221, 1341–1350. [Google Scholar] [CrossRef]
  70. Shen, Z.; Tang, P.; Kannan, O.; Cho, Y.K. As-built error modeling for effective 3d laser scanning on construction sites. In ASCE International Workshop on Computing in Civil Engineering; ASCE: Los Angeles, CA, USA, 2013; pp. 533–540. [Google Scholar]
  71. Chakraborty, D.; Elzarka, H. Performance testing of energy models: Are we using the right statistical metrics? J. Build. Perform. Simul. 2018, 11, 433–448. [Google Scholar] [CrossRef]
  72. Sun, Y.; Wang, S.; Xiao, F.; Gao, D. Peak load shifting control using different cold thermal energy storage facilities in commercial buildings: A review. Energy Convers. Manag. 2013, 71, 101–114. [Google Scholar] [CrossRef]
  73. Cortes, C.; Vapnik, V. Support-vector networks. Mach. Learn. 1995, 20, 273–297. [Google Scholar] [CrossRef]
  74. Vapnik, V.; Golowich, S.E.; Smola, A.J. Support vector method for function approximation, regression estimation and signal processing. Adv. Neural Inf. Processing Syst. 1997, 9, 281–287. [Google Scholar]
  75. Breiman, L. Random forests. Mach. Learn. 2001, 45, 5–32. [Google Scholar] [CrossRef] [Green Version]
  76. Oku Topal, G.; Akpinar, B. High rate GNSS kinematic PPP method performance for monitoring the engineering structures: Shake table tests under different satellite configurations. Measurement 2021, 189, 110451. [Google Scholar] [CrossRef]
  77. Shen, N.; Chen, L.; Chen, R. Displacement detection based on Bayesian inference from GNSS kinematic positioning for deformation monitoring. Mech. Syst. Signal Processing 2022, 167, 108570. [Google Scholar] [CrossRef]
  78. Palmer, L.; Franke, K.; Abraham Martin, R.; Sines, B.; Rollins, K.; Hedengren, J. Application and Accuracy of Structure from Motion Computer Vision Models with Full-Scale Geotechnical Field Tests. In Proceedings of the International Foundations Congress and Equipment Expo 2015 (IFCEE 2015), San Antonio, TX, USA, 17–21 March 2015; pp. 2432–2441. [Google Scholar]
  79. Laefer, D.F.; Truong-Hong, L. Toward automatic generation of 3D steel structures for building information modelling. Autom. Constr. 2017, 74, 66–77. [Google Scholar] [CrossRef]
Figure 1. Flowchart of the installation quality assessment framework for a high formwork.
Symmetry 14 00377 g001
Figure 2. The high formwork model with simulated defects (a) The high formwork model, (b) The front side of the high formwork model, (c) The leftmost side of the high formwork model, (d) The plan view of the high formwork model.
Symmetry 14 00377 g002aSymmetry 14 00377 g002bSymmetry 14 00377 g002c
Figure 3. The layout of the TLS measurement.
Symmetry 14 00377 g003
Figure 4. Remove mixed pixels (a) using distance value, (b) using both distance and color difference value.
Symmetry 14 00377 g004
Figure 5. Data extraction method.
Symmetry 14 00377 g005
Figure 6. Horizontal slices with a certain interval.
Symmetry 14 00377 g006
Figure 7. X-Y projection of point cloud data of a pole on a slice.
Symmetry 14 00377 g007
Figure 8. Boundary detection (a) rough boundary, (b) fine boundary.
Symmetry 14 00377 g008
Figure 9. The centroid of fitted circles.
Symmetry 14 00377 g009
Figure 10. Identification of a vertical stand pole (a) potential line representing a vertical pole, (b) 3D line fitting.
Symmetry 14 00377 g010
Figure 11. Intersections of a pole projected on XOY plane (a) inclined pole, (b) upright pole.
Symmetry 14 00377 g011
Figure 12. The flowchart of the TLS measurements optimized by using GA-ANN model.
Symmetry 14 00377 g012
Figure 13. The model performance for ANN models with different momentum coefficients.
Symmetry 14 00377 g013
Figure 14. The evaluation process of GA.
Symmetry 14 00377 g014
Figure 15. The structure of the proposed GA-ANN model.
Symmetry 14 00377 g015
Figure 16. Model performance of the GA-ANN versus the ANN model and the actual value.
Symmetry 14 00377 g016
Figure 17. Actual versus predicted values of the measurements from GA-ANN model (a) training dataset (b) test dataset.
Symmetry 14 00377 g017aSymmetry 14 00377 g017b
Figure 18. The R2 of the proposed GA-ANN model.
Symmetry 14 00377 g018
Figure 19. The converge process of the proposed GA-ANN model.
Symmetry 14 00377 g019
Figure 20. The photography of the high formwork.
Symmetry 14 00377 g020
Figure 21. Real point clouds of the high formwork.
Symmetry 14 00377 g021
Table 1. Classification of inspection terms.
ClauseInspection TermRequirements by China Building CodesAcceptable Error
iStanding poleEvery pole should be vertical to the ground;
Δ ≤ 1/500 H and horizontal
deviation Δ ≤ ±50 mm
5 mm
Description diagram Symmetry 14 00377 i001
iiHorizontal tubeEvery tube should parallel to the ground5 mm
Description diagram Symmetry 14 00377 i002
iiiDiagonal bracingThe angle of the vertical diagonal bracing and
the ground should set between 45°–60°
The angle of the horizontal diagonal bracing and
the horizontal tube should set between 45°–60°
ivLongitudinal spacing of standing poleThe distance should
less than 1.2 m
≤30 mm
vTransverse spacing of standing poleThe distance should
less than 1.2 m
≤30 mm
viDistance between two neighbouring tube (Lift height)The space should
less than 1.5 m
≤20 mm
viiThe bottom reinforcing tubeThe height of the bottom tubes should equal to 350 mm; the transverse tubes should locate on the top of the longitudinal tubes.
Table 2. Main parameters of GA algorithm used for optimizing ANN.
ParameterDesignationValue
Population sizeNpop50
Generation numberNgen100
Number of binary digits 10
Number of iterations 1000
Cross-over probabilityPc0.95
Mutation probabilityPm0.01
Fitness value 1
Table 3. Optimum configuration of the ANN obtained from GA.
GeneDesignationValue
Number of hidden layer (c1)Nh1
Number of hidden layer neurons (c2)Nnh6
Learning rate (c3)Lr0.125
Momentum coefficient (c4)Mc0.876
Table 4. Prediction performance of the proposed GA-ANN model versus ANN model.
ModelNnhPredicted Simulated Defects (MSE)Predicted Coordinates (MSE)Rank
12345XYZ
ANN20.7130.5290.8710.4050.6790.8620.8370.8937
30.0640.0570.0700.0610.0660.0730.0490.0694
40.0210.0110.0180.0230.0160.0190.0120.0142
50.0280.0300.0150.0220.0140.0180.0170.0213
70.1430.1350.1640.1450.1050.1790.1010.1415
90.4370.2190.2040.5910.1400.7590.2170.6116
GA-ANN60.0050.0040.0040.0030.0040.0020.0030.0021
Table 5. The performance evaluation of the suggest models.
ModelRRMSEMSE
PSDPCPSDPCPSDPC
GA-ANN0.9870.9850.0080.0050.0040.0035
ANN0.9180.8730.0230.0450.0180.015
SVM0.8800.7980.1870.2150.1570.173
RF0.8810.8530.0340.0480.0110.035
PSD = predicted simulated defects; PC = predicted coordinates.
Table 6. The detail of the second high formwork model set.
TermDescription
Length60 cm
Width70 cm
Height100 cm
The distance between two neighboring
horizontal ledgers (Lift height)
15 cm
The longitudinal spacing of vertical pole8 cm
The transverse spacing of vertical pole10 cm
The height of the bottom reinforcing ledger5 cm
The angle of the diagonal brace45°
The number of vertical poles49
The number of horizontal ledgers98
Simulated defects
The distance between the 3rd and 4th horizontal
ledgers on the longitudinal middle frame
18 cm
The longitudinal spacing of the 4th and 5th vertical
pole on the longitudinal middle frame
10 cm
The transverse spacing of the 3rd and 4th vertical
pole on the transvers middle frame
12 cm
Table 7. Summary of the predicted error by using the proposed method.
Inspection TermSpecified ValueError from the Proposed Method
MaxMinAverageStandard ErrorPercent of Pass
dli80015354.795%
dti8001365.5594.3%
si150016576.892%
Am60°30′10′18′15′98%
Note: Am indicates the angle of diagonal bracing.
Publisher’s Note: MDPI stays neutral with regard to jurisdictional claims in published maps and institutional affiliations.

