Article

Modulation of Asymmetry in Auditory Perception through a Bilateral Auditory Intervention

by
Beatriz Estalayo-Gutiérrez
1,*,
María José Álvarez-Pasquín
2 and
Francisco Germain
3,*
1
Servicio Madrileño de Salud, José María Llanos Health Centre, 28053 Madrid, Spain
2
Department of Medicine, Autónoma de Madrid University, 28049 Madrid, Spain
3
Department of Systems Biology, Alcalá de Henares University, 28871 Madrid, Spain
*
Authors to whom correspondence should be addressed.
Symmetry 2022, 14(12), 2490; https://doi.org/10.3390/sym14122490
Submission received: 19 October 2022 / Revised: 15 November 2022 / Accepted: 18 November 2022 / Published: 24 November 2022
(This article belongs to the Special Issue Neuroscience, Neurophysiology and Asymmetry)

Abstract

:
The objective of this work was to analyze the modulating effect of an auditory intervention (AI) on the threshold and symmetry of auditory perception in people with different emotional states. The effects of AI were compared 3 months after using threshold audiometry (air conduction). The studied groups were emotional well-being (EWB) (n = 50, 14 with AI, 36 without AI); anxiety (ANX) (n = 31, 10 with AI, 21 without AI); and mixed group (MIX) (n = 45, 19 with AI, 26 without AI). The EWB group with AI lost the advantage of the left ear due to the hearing gain of the right ear, whereas in EWB without AI, no changes were observed. The ANX group with AI showed a non-significant improvement in both ears, maintaining the left interaural advantage. Interestingly, in the group without AI, the interaural difference was lost. The MIX group did not show interaural differences either with or without AI. However, the AI group showed a lower left ear threshold than that of the right ear, in contrast to the non-AI group. In conclusion, the application of this AI manages to decrease the prioritization of high frequencies, in addition to balance hearing between ears, which could decrease activation in states of anxiety.

1. Introduction

The scientific foundations of asymmetry in the cerebral hemispheres date back to the work of Paul Broca in 1861 [1]. However, it took a long time before there was evidence of other asymmetries, such as the planum temporale [2] or the Sylvian fissure [3]. Because the discovery of cerebral hemispheric asymmetry was related to language, it was thought to be unique to humans. However, it is one of the building blocks of the general organization of the nervous system in many species [4] and encompasses multiple tasks of sensory perception, such as visual, auditory, and cognitive, as well as behaviors such as preference in the use of one hand or another [5,6].
Because the areas for the interpretation of linguistic sounds are located in the left hemisphere, the perception of these sounds has a clear advantage in the right ear when several sounds are presented simultaneously in both ears; this is the Right Ear Advantage (REA) effect [7]. This advantage has been confirmed by neuroimaging techniques [8], which have been found to be useful even for indicating language alterations [9] and mental disorders [9,10]. However, when the sounds are nonverbal, several studies point to an advantage for the left ear [11,12]. In addition, in different emotional situations, changes can occur in the advantage of one hemisphere over the other. Currently, it is thought that the different specialization of the hemispheres is related to the processing of different aspects; thus the right hemisphere specializes in differentiating intensity variations [13] and sound frequency [11,14,15], whereas the left hemisphere does so for variations in their duration [14,15,16].
Another widely studied aspect of hemispheric laterality is that of emotional processing, the neurological foundations of which are not fully understood. The two theories with the most scientific evidence in this field are the Right Hemisphere Hypothesis [17,18] and the Valence Hypothesis [19,20]. The first postulates that the right hemisphere is specialized in processing all kinds of emotions. The second suggests that positive/negative emotions are specifically processed in the left/right hemisphere, respectively. Currently, both theories coexist, with the right hemisphere being superior for all emotional processing, especially when the left hemisphere receives a positive emotional stimulus or the right hemisphere a negative one [21,22].
In addition, an association has been observed between ear pathology and mental disorders such as anxiety and stress [23,24]. Similarly, in vestibular pathology such as Ménière’s disease, a correlation has been reported between hearing loss and severity of psychopathological disorders [25,26]. Moreover, a constant noise is capable of inducing an anxious-depressive state that alters the tolerance threshold [27]. Anxiety and depression are two types of disorders that frequently occur together and that affect a high percentage of the population [28]. Anatomical and functional studies have shown hemispheric asymmetries in both nosological entities [29,30,31,32]. Anxiety disorders present a greater right parietotemporal activity with respect to the left hemisphere, and a smaller left hemisphere advantage when analyzed through the syllable test, compared to those without an anxiety disorder [31,33]. Major depression has been associated with a loss in the thickness of the right superior temporal cortex [29] and with a hypofunction of both cerebral hemispheres [30,31]. However, both major depression and anxiety disorders present an apparent functional dominance of the right hemisphere [31,32,33] resulting from a different modulation of the cerebral hemispheres. Regarding the coexistence of anxiety and depression, there is less knowledge about how it affects hemispheric functions. At the moment, a greater connectivity of the amygdala has been confirmed with the right superior temporal gyrus when compared with healthy subjects [34,35].
We previously reported interaural differences in people with emotional well-being [12]. Similarly, it was observed that these differences increased in the groups of people with anxiety and/or depressive symptoms, located specifically in the frequencies of 1000 and 2000 Hz in the anxiety group and in those of 3000 and 4000 Hz in the mixed group. In any case, all these groups showed significant differences when comparing their interaural difference curves with those of the well-being group, but without showing significant differences between the anxiety and mixed groups. Regarding the emotional well-being group, the mixed group showed hearing loss in the right ear (RE), with the loss being in the major depression group, and affecting both ears. The comparison of the auditory patterns showed significant differences in the left ear (LE) between emotional well-being and anxiety for the minor peaks (when the difference with the measurement before and after the peak is 5 dB less) at the frequency of 4000 Hz. Similarly, and in relation to anxiety, the appearance of the 4:8 pattern was observed in the right ear when the person had suffered acute stress in the 2 days prior to the audiometry, and in both if they had suffered it in the 3–30 days prior to audiometry. In other words, the left ear’s advantage in auditory perception increased with these disorders, showing peaks of left hyperhearing in anxiety and right hearing loss in mixed symptoms.
Different interventions have been tested with the intention of treating mental disorders through a possible action through sound stimulation [36,37,38,39,40]. However, the results of its application are very varied and not fully accepted.
In the last two decades, neuroscience has investigated how sound stimulation can influence complex neurobiological processes in the brain: listening to music improves brain connectivity in specific brain areas of healthy participants [36,37,38,39] and musical activities, such as playing an instrument, promote neuronal plasticity and induce gray and white matter changes in numerous brain areas, especially frontotemporal areas [40,41,42]. Subcortical areas (the amygdala, the parahippocampal gyrus, and the nucleus accumbens) and cortical areas (the orbitofrontal cortex, the superior temporal cortex, and the anterior cingulate) are involved in emotional processing from music. The amygdala and the orbitofrontal cortex have reciprocal connections and, in turn, are connected to cortical representations of all sensory modalities, thus integrating sensory information [43,44,45,46,47,48,49,50,51]. Furthermore, the psychological effects and neurobiological mechanisms underlying the effects of music interventions appear to share neural systems for reward, arousal, emotional regulation [52,53,54,55,56], learning, and functional neuroplasticity [40,41,57,58,59].
The Bérard method is a protocol whose objective is to correct the hearing quality of depressed people. Through an air conduction audiogram, asymmetries are detected in the frequency thresholds, specifically hyperhearing peaks in high frequencies. Auditory intervention aims to achieve auditory reeducation through attentive listening to symphonic music filtered by a frequency modulator. The filters intend to eliminate the stimulation of the hyperhearing peaks while the rest of the frequencies are dynamized [60].
The objective of this work was to analyze the potential effect of this intervention on auditory perception in and between both ears. For this, we compared the auditory perception thresholds between both ears before and 3 months after the auditory intervention in well-being, anxiety, and mixed groups. Similarly, we evaluated if there were changes that bring their characteristics closer to those of the emotional well-being group.

2. Materials and Methods

2.1. Study Type

A controlled and randomized clinical trial, not masked, was carried out to compare the effects on threshold pure tone audiometry (air conduction) of an auditory intervention (Bérard method) versus the absence of musical intervention in people with and without significant levels of anxiety and/or depression; clinical trial registration number NCT05441891.
All subjects gave their informed consent for inclusion before they participated in the study. The study was conducted in accordance with the Declaration of Helsinki, the protocol was approved by the Ethics Committee of Hospital la Princesa, Madrid (Project identification code: 05/11), and later by the Southeast Local Research Commission of Madrid.

2.2. Subjects

For this study, 327 people who sought care at the Health Centre Mejorada del Campo (Madrid, Spain) were selected by systematic sampling (1 in 5) from the lists of people with on-demand appointment at 6 family medicine consultations (3 in the morning and 3 in the afternoon). All the subjects who agreed to participate were informed about the study and what it involved. Subjects were then asked to sign the informed consent form and complete an initial questionnaire. Those subjects with significant hearing loss, acute otological process, psychotic disease, epilepsy, serious illness, pregnancy, or alcohol or drug use were excluded. From 327 subjects, 58 refused informed consent and 36 presented some exclusion criteria, so that 233 participants were finally included in the study.
Included participants underwent an ear examination and any earwax blockages were removed. Pure-tone audiometry (air conduction) was then carried out in a room where silence was guaranteed due to its location away from other rooms or passageways. A soundproof room was not used as the aim was to measure airway hearing in conditions closer to reality. Later participants underwent screening for anxiety and depression (Goldberg Anxiety and Depression Scale—GADS), followed by a questionnaire concerning sociodemographic data and their medical history. Participants without significant scores for anxiety and depression on the GADS were included in the “Emotional Well-being” group, whereas participants with significant scores for anxiety and/or depression were then asked to take the Hamilton Rating Scale questionnaires. Participants were included in the Anxiety, Depression, or Mixed group, depending on whether their scores were significant for anxious symptoms, depressive symptoms, or both.

2.3. Intervention

Subjects included in the Emotional Well-Being, Anxiety, Depression, or Mixed Groups were assigned to receive or not receive an auditory intervention (Bérard method) by stratified, block randomization.

2.4. Auditory Intervention (Modified Bérard Method)

The auditory or hearing intervention consisted of listening to classical music modulated by an equalizer for 30 min, 2 sessions a day separated by at least 3 h, for 5 days (Monday to Friday). The musical intervention was always performed with the same songs and in the same order (see supplementary document S1) using original CDs. It was heard through Beyerdynamic brand headphones model DT 250/80 ohm distributed by GMBH & Co. KG, Theresienstr. 8 D-74072 Heilbronn (Germany); the music was played with a Panasonic MASH sound system model No. SA-PM24 (Hamburg, Germany); finally, the music was filtered through a device called an Earducator, distributed by Hollagen Designs, PÍO. Box 43 7864 Bergvliet W. Cape, South Africa. This device is an equalizer that consists of several frequency and volume filters to personalize the treatment.
The Earducator modulates music by alternating low and high tones with an unpredictable cadence, preventing habituation. It also allows very narrow band complementary filters to attenuate (by about 40 dB) abnormally perceived frequencies (hyperhearing peaks): filters at 1 kHz–1.5 kHz–2 kHz–3 kHz–4 kHz–8 kHz. No more than 2 spikes were filtered. If a spike appeared in the audiogram at 8 kHz and another spike at 2 kHz–1.5 kHz–3 kHz–1 kHz or 4 kHz, those two were filtered. If there were two (none corresponding to 8 kHz) or three spikes, they were filtered with the following priority order: 2 kHz–1.5 kHz–3 kHz–1 kHz and 4 kHz. If four or more different and significant spikes appeared in one ear or both ears, no spike was filtered. Music volume was the loudest the patient tolerated up to a maximum level of 80 dB. Tolerance increased throughout the sessions. During the same session, the volume was only modified if the patient was upset. During auditory reeducation, the patient did not perform any other activity such as reading, writing, speaking, or sleeping. Through this auditory intervention, the aim was to balance all the frequencies of the audiogram, eliminating the points of hyperhearing.

2.5. Absence of Auditory Intervention

The subjects who were assigned to receive no Intervention followed the entire evaluation and data collection process.

2.6. Study Variables

The study variables were collected at the beginning of the study and at 3 months.

2.7. Pure-Tone Audiometry (Air Conduction)

The instrument used was a basic Maico MA40 clinical audiometer with a CE-0124 calibration certificate in accordance with the ANSI S3.1996 calibration standard, made in Eden Prairie (Maico, MN, USA). Signals were frequency-modulated, pulsed pure tones. Frequency accuracy was ±1% for each frequency.
The lower threshold for air-conduction pure tones was measured for the following frequencies in each ear: 125, 250, 500, 750, 1000, 1500, 2000, 3000, 4000, 6000, and 8000 Hz. Each threshold was collected following the modified Hughson–Westlake procedure.

2.8. Goldberg Anxiety and Depression Scale (GADS)

This scale was developed by Goldberg [61] in 1988 from a modified version of the Psychiatric Assessment Schedule. It is a screening tool. In the present work a validated Spanish version was used [62]. The physician asked the patient questions about the symptoms contained in the scales and occurring in the last 15 days, ignoring any symptoms that were no longer present or present only in mild degree. In addition to supporting a diagnosis of anxiety or depression (or both, in mixed cases), the GADS discriminates between the two. Cut-off points were >4 for the anxiety subscale (detection of 73% of all anxiety cases) and >3 for the depression subscale (detection of 82% of all depression cases).

2.9. Hamilton Anxiety Rating Scale (HAM-A)

The Hamilton Anxiety Rating Scale used was the abridged 14-item version in its validated Spanish-language version [63]. It is a clinician-administered scale on which each item is rated from 0 to 4. Patients are asked about how they felt in the past 3 weeks. It yields a score in the range of 0 to 56. The following cut-off points were used: 0–5 points (No anxiety), >5 points (Anxiety).

2.10. Hamilton Depression Rating Scale (HAM-D)

The Hamilton Depression Rating Scale is a clinician-administered scale that aims to evaluate symptom severity from a quantitative perspective. For this assessment, the validated Spanish version was used [64]. Each item receives a score from 0 to 2 or 0 to 4, obtaining a total score between 0 and 52. Depression was defined when the score was >7.

2.11. Sociodemographic Variables

Information was collected on gender, age, nationality, academic training, employment status, noise exposure, and chronic drug use.
The data were collected in a database (see Supplementary Document S1).

2.12. Statistical Analysis

Data analysis was carried out on the per-protocol population, including only those subjects who had correctly completed all follow-up and intervention. After verifying that data series followed a normal distribution, the pairs of groups were statistically compared by two-way ANOVA and Tukey post hoc test. Statistical significance was considered as p < 0.05.
Finally, there were three study groups: Emotional Well-Being, Anxiety, and Mixed group. It was not possible to analyze the Depression group due to an insufficient sample.

2.13. Sample Characteristics

A descriptive analysis of the sample was carried out to determine the characteristics of the members of the sample.

2.14. Audiogram Analysis

Right- and left-ear audiograms were first compared in each group (Emotional Well-being, Anxiety, and Mixed). By means of the Kolmogorov–Smirnoff test, it was shown that the values of the hearing thresholds did not conform to a normal distribution, so a logarithmic transformation was applied. The parametric data obtained were subsequently analyzed through a two-factor ANOVA: Ear (2 levels; right and left) and Frequency (11 levels; 0.125, 0.25, 0.5, 0.75, 1, 1.5, 2, 3, 4, 6, and 8 kHz). When significant effects were obtained that allowed further comparisons, the Bonferroni multiple comparison test was applied.
The different groups are indicated with their acronyms, for the Emotional Well-Being (EWB), Anxiety (ANX), and Mixed (MIX) groups.
The magnitude of the interaural difference was compared by pairs of groups using a two-factor ANOVA: Group (2 levels; EWB-ANX/EWB-MIX/ANX-MIX) and Frequency (11 levels; 0.125, 0.25, 0.5, 0.75, 1, 1.5, 2, 3, 4, 6 and 8 kHz). When significant effects allowed further comparisons, the Bonferroni multiple comparison test was applied.
Subsequently, the hearing thresholds of both ears were compared between the different groups. The comparison was quantitative (mean and standard deviation of the hearing thresholds) and qualitative (relative frequencies of 6 auditory patterns) for each frequency of the audiogram. To compare pairs of groups, a two-way ANOVA for each Ear (Frequency as intra-subject factor and Group as inter-subject factor) was applied.
For a global analysis between groups, a three-factor ANOVA (Frequency and Ear as intra-subject factors and Group as inter-subject factor) was carried out. The significant effects allowed a later post hoc comparison by means of Tukey’s correction. For the qualitative assessment, the different auditory patterns (Major Peak, Minor Peak, Major Valley, Minor Valley, Major Plateau, and Minor Plateau) were coded from 0 to 6. The frequency of appearance of these auditory patterns at each frequency of the audiogram was compared between groups by creating contingency tables and applying Pearson’s chi-square analysis for frequency comparison.
Statistical analyses were performed for an initial time and at 3 months, subsequently comparing both time points.
The chosen significance level was 0.05. Data analysis was carried out using version 9.0.0. of the GraphPad Prism software for Windows (GraphPad Software, San Diego, CA, USA).

3. Results

The flow of participants throughout the study is shown in Figure 1.
The characteristics of the members of the sample are collected in a previous article [12].

3.1. Evaluation of Auditory Intervention on Hearing in Different Groups

3.1.1. Emotional Well-Being Group

Analysis of Hearing Thresholds in the Emotional Well-Being Group

Comparison of hearing thresholds between the two ears at 3 months (T3) from the start of the study showed that the normal interaural difference disappeared in the AI group (Figure 2A). Meanwhile, in the non-AI group this difference remained, and the shape of the curve was similar to that at initial time (T0) (Figure 2D).
Comparison of hearing thresholds between T0 and T3 in each ear showed that, in the AI group, the right ear showed a significant hearing threshold difference (Figure 2B), while the left did not (Figure 2C). However, in the non-AI group, the results were just the opposite: the right ear showed no difference in hearing threshold (Figure 2E), while the difference in the left ear was significant (Figure 2F).
Comparing the curves between T0 and T3 in the right and left ears, it is observed that when applying AI, the RE (Figure 2B) proportionally increases its hearing more than the left (Figure 2C). Therefore, it can be said that the AI exerts a clear effect on the EWB group, canceling the differences between both ears. In contrast, if we do not apply AI, the difference in favor of the LE persists.
The analysis by zones shows that the AI causes the advantage of the left to be accentuated in low frequencies, the advantage of the left to be accentuated in the central frequencies, and the advantage of the right to be accentuated in the high frequencies (Figure 2A).

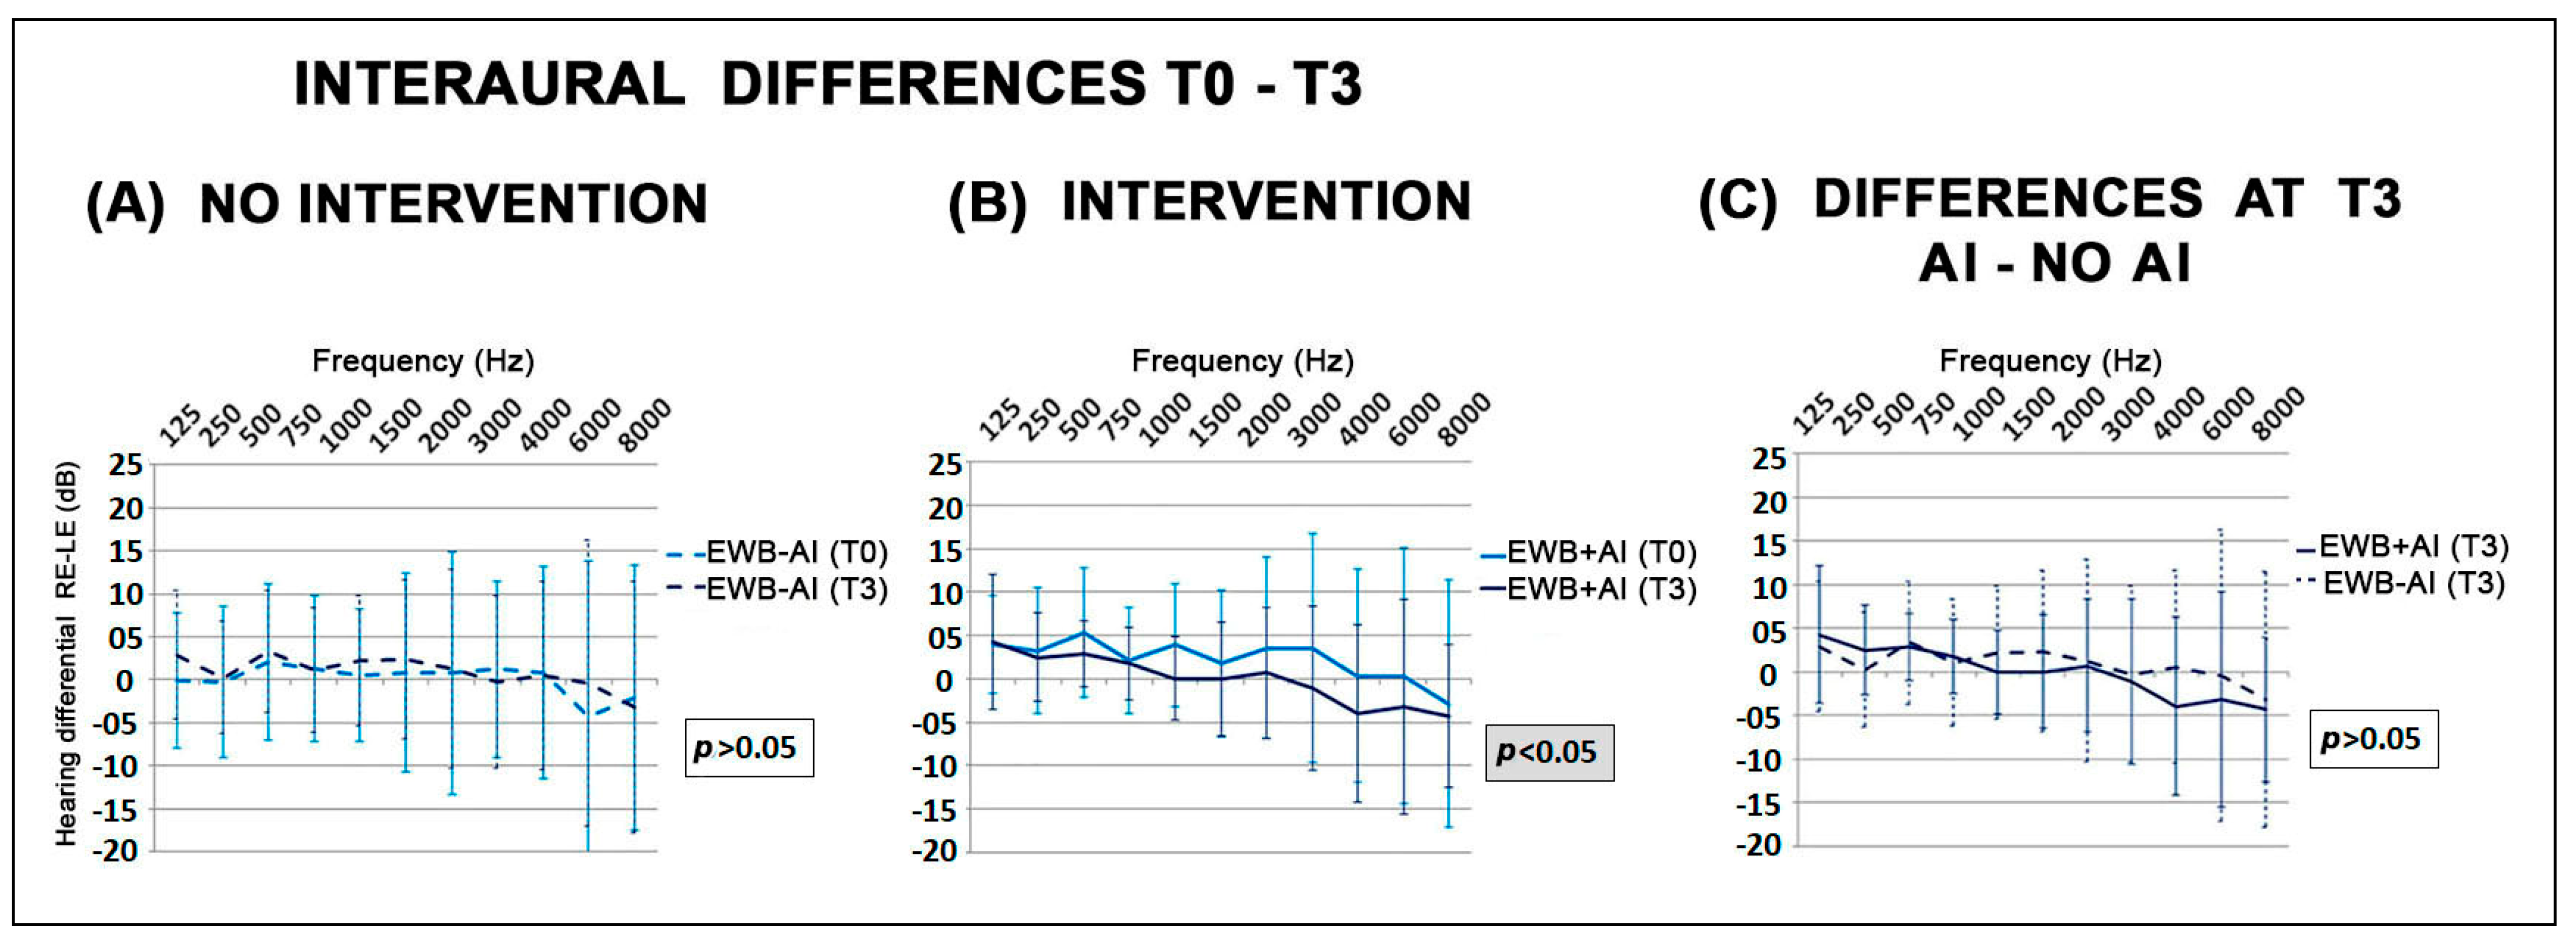
Comparison of Interaural Differences in the Emotional Well-Being Group

The evolutionary comparison (between T0 and T3) in the group without AI showed non-significant differences (Figure 3A), while in the AI group the differences were significant (Figure 3B). However, these differences were not large enough to be significant between the AI and non-AI groups at T3 (Figure 3C).

3.1.2. Anxiety Group

Analysis of Hearing Thresholds in the Anxiety Group

The comparison of hearing thresholds between the two ears at 3 months (T3) from the beginning of the study showed that, in the AI group, the interaural difference (Figure 4A) remained in favor of the left ear, previously observed at T0. Meanwhile, in the non-AI group, this difference disappeared, and the shape of the curve was similar between both ears (Figure 4D).
Comparison of hearing thresholds between T0 and T3 in each ear showed that none of the AI group ears, alone, showed a significant difference (two-way ANOVA) in hearing threshold, although there was an improvement in hearing of both ears after hearing intervention (Figure 4B,C). In relation to this improvement, the global analysis (three-way ANOVA) showed a significant difference (p < 0.05). This difference corresponded to that observed at T3 between both ears (Figure 4A).
In the non-AI group, none of the ears showed significant differences in hearing threshold between T0 and T3 (Figure 4E,F). However, the small improvement observed in right ear hearing was sufficient to eliminate the interaural difference in the Anxiety group (Figure 4D). In this way, the group with no hearing intervention lost the interaural difference of the Anxiety group.
The non-application of AI equalizes the curve of the audiograms of both ears, which suggests that there is an evolution in the perception of both ears during the development of anxiety.

Comparison of Interaural Differences in the Anxiety Group

The evolutionary comparison (between T0 and T3) in the group without AI showed significant differences (Figure 5A), while in the group with AI the differences were not significant (Figure 5B). These differences were large enough for the groups with AI and without AI to be considered different at T3 (Figure 5C).

3.1.3. Mixed Group

Analysis of Hearing Thresholds in the Mixed Group

Regarding time 0 at which hearing differences were seen between the two ears, at T-3 these differences disappeared both in the auditory intervention group (Figure 6A) and in the non-intervention group (Figure 6D). In the AI group at 3 months, although the differences between the ears disappeared, the threshold of auditory perception in the left ear remained below the threshold of the right ear. However, in the group with no hearing intervention, there was an inversion in the mean of these thresholds, which was slightly lower in the right ear (that is, the left ear heard worse). Statistical comparison of the curves generated in the left ear in the intervention and non-auditory intervention groups at 3 months showed a trend, which did not reach significance (p = 0.06).
The observation of the evolution of the auditory thresholds from T0 to T3 showed that, in the left ear after the auditory intervention, they practically remained the same, while the right ear showed a slight non-statistically significant improvement (two-way ANOVA) (Figure 6B,C). In the group without auditory intervention, the differences were also not significant (Figure 6F).
Therefore, with or without auditory intervention, there is a loss of the interaural difference that exists in the Mixed group. However, it is true that there is a non-significant tendency that, with the auditory intervention, the perception in the left ear is somewhat better.

Comparison of Interaural Differences in the Mixed Group

The comparison of the interaural differences in the Mixed group at T3 with respect to T0 showed significant differences, both without auditory intervention and with it (Figure 7A,B). The comparison in the interaural differences between the group with intervention and without hearing intervention did not show significant differences (Figure 7C).

3.2. Effect of Auditory Intervention in Each Ear and in Each Group

The auditory intervention statistically significantly increased the threshold of each ear in the Emotional Well-Being group, more clearly in the high frequencies (Figure 8A). In contrast, in the Anxiety group, the threshold in the left ear decreased statistically significantly and it did not change in the right ear (Figure 8B). In the Mixed group, the auditory intervention showed a non-significant tendency to lower the threshold in the left ear (Figure 8C).
In the Emotional Well-being group, the threshold in the bass was decreased and the threshold in the treble was increased significantly in both ears.
In the Anxiety group, in the right ear, the intervention did nothing, but in the left it lowered the threshold significantly in high and low frequencies, but not in central frequencies.
In the Mixed group, in the right ear the intervention did not cause any changes, but the left showed an almost significant trend at almost all frequencies except 6000 Hz.
In general, AI tended to improve hearing at all frequencies in both ears, but its result at 3 months depended on the starting hearing situation:
In EWB, the starting point is a left auditory advantage without prioritizing specific frequencies. AI manages to dynamize, i.e., improve hearing in both ears, balancing interaural hearing.
In ANX, the starting point is a prioritization of the frequencies 1 and 2 kHz of the LE. AI improved hearing in the left ear on frequencies adjacent to 1 and 2 kHz (bass and treble).
In MIX, the starting point is a prioritization of the frequencies 3 and 4 kHz of the LE. The AI showed a tendency to improve the hearing of the left ear, in all frequencies except those higher than 4 kHz.

3.3. Comparison of Hearing Thresholds in Both Ears between the Emotional Well-Being Group without Auditory Intervention and the Anxiety and Mixed Groups with Auditory Intervention

The comparison of hearing thresholds between the initial Emotional Well-Being groups and the Anxiety and Mixed groups after the auditory intervention, to check if the intervention was capable of bringing the levels of the groups with disorder closer to those of the Well-Being group, showed a change in both the Anxiety and the Mixed groups. After the intervention, differences appeared between the Well-Being group and the Anxiety group. By comparison, the initial differences observed between the Well-Being and the Mixed groups were nullified (Figure 9). In other words, for all groups, the auditory intervention changed the level of auditory perception and the way of managing the interaural difference. Moreover, the pairwise comparisons among the three groups investigated showed that, after the auditory intervention, all of them were different in a statistically significant way (two-way ANOVA).

3.4. Analysis of Auditory Patterns after Auditory Intervention

When auditory patterns (appearance of peaks, valleys, and plateaus, lower or higher) were compared between groups (EWB, ANX, and MIX), certain differences were observed between them [12]. After the AI, these differences disappeared, confirming that said AI promotes a homogenization of the auditory patterns.
Regarding the variation between T0 and T3, the difference between before and after applying the AI, it was observed that in EWB there were no changes. However, in ANX the valley patterns decreased significantly, while in the MIX group a non-significant decrease in peak and valley patterns was observed.
The qualitative analysis of the audiogram (auditory patterns) at 3 months among the groups that received AI showed that the differences between EWB and ANX disappeared before the intervention for the frequency of 4000 Hz (p > 0.05); between EWB–MIX and ANX–MIX, no differences were also observed (p > 0.05).

4. Discussion

The existing auditory perception asymmetry between both ears can be dynamically modulated as shown in this work. In this way, the auditory intervention carried out induces a series of changes in auditory perception that vary according to the emotional group on which it is applied. Prior to the intervention, we started from a situation in which the interaural difference in all groups showed a lower hearing threshold in the left ear. This difference was greater in the Anxiety and Mixed groups (anxiety and depressive symptoms) than in the Emotional Well-Being group.
Comparing the hearing thresholds in each ear, no differences were observed between the EWB group and the ANX group, but differences were observed when comparing them with the MIX group, especially at the expense of the right ear. Similarly, differences were observed between the ANX group and the EWB group in the appearance of minor peak patterns in the left ear at the 4000 Hz frequency. Taken together, the data suggest that anxiety would increase the interaural difference due to hyperhearing in the left ear (dominance of the right hemisphere) [33,34], while hypohearing in the right ear would also participate in concomitant depressive symptoms [30,31].
This situation has a general explanation. The right hemisphere is superior in the discrimination of the intensity of the tones [13], and is more influenced by the degree of emotional activation of the person [21,65]. Some current results suggest that the right hemisphere is superior in emotional processing, which is more evident when a positive emotional stimulus is presented to the left hemisphere or a negative one to the right hemisphere [21,22].
The association of depressive symptoms worsens the hearing of the right ear, while pure depressive symptoms worsens that in both ears, maintaining in all cases a relative advantage of the left ear, at the expense of a greater loss in the right ear [12].
Hyperfunction of the right hemisphere has been seen in anxiety disorders [33,34]. This hyperfunction allows the medium and high frequencies (1000 and 2000 Hz) to be heard better in pure anxiety, and this hyper-hearing is displaced towards 3000 and 4000 Hz if it is mixed (association of symptoms of anxiety and depression). In this way, a prolongation of anxiety prioritizes the perception of higher frequencies in the left ear. These higher frequencies usually correspond to those that announce threats, and possibly this is carried out in the descending pathway of the auditory corticofugal system (ACFS) [66,67] through inhibitions of different intensity in the right and left cochlea. In the case of depressive symptoms, instead of alertness and activation, there is a depletion that does not activate the pathway in the same way and leads to hearing loss in both ears, although this is more pronounced in the right ear.
The stimulation–inhibition system is mediated by a series of neurotransmitters in the auditory system, such as serotonin, which increases neuronal excitability in the dorsal cochlear nucleus, which is sensitive to high frequencies, while it is inhibitory in other areas of the auditory pathway [68,69]. Acetylcholine, the main neurotransmitter in the olivocochlear efferent system, inhibits hair cells and sensory neurons through feedback [70,71]. This inhibition is also asymmetric, being greater on the right side [72,73]. Other neurotransmitters known to be involved include norepinephrine, dopamine, and histamine along the auditory pathway [74,75,76]. In summary, the greater perception of the left ear in anxiety is due to serotonergic and noradrenergic dominance, with a gradual increase in serotonin turnover in intermediate states [77]. When anxiety persists, noradrenergic function decreases and cholinergic function increases, leading to depressive symptoms [78].
Although in all cases a relative hyperhearing of the left ear with respect to the right is maintained, a prioritization of different frequencies is observed; for EWB, this advantage tends to be concentrated in the central frequencies, whereas in ANX it affects the central frequencies and the first high frequencies; in MIX the central and second high frequencies are affected. Similarly, it was seen that in DEP there was a tendency to prioritize low frequencies [12]. This fact can be explained by the different activations of monoamines, with the highest frequencies being the most influenced.
The results obtained in this study suggest that AI improves hearing in both ears by a tuning of the auditory pathways after intense auditory training. This is a functional gain, although with different results depending on the initial emotional state. In the EWB group there is a certain interaural advantage of the LE, although without frequency prioritization. AI stimulates hearing in both ears with a greater effect on the right ear, since this is where the greatest potential for improvement exists. In ANX and MIX groups, the interaural advantage of the LE is greater than that observed in EWB, specifically for the 6 kHz frequency. In addition, the ANX group hears frequencies 1 and 2 kHz better through the left ear than the right, whereas the MIX group does so for frequencies 3 and 4 kHz in the left ear. In the ANX group, AI improves the hearing of the LE, specifically in the frequencies adjacent to those already prioritized (1 and 2 kHz). In the MIX group, the AI acts in the same direction, but for frequencies 3 and 4 kHz. All this suggests that, although the AI boosts all the frequencies of both ears, the hearing gain is more visible in those frequencies adjacent to those already prioritized from the start. This is probably due to the fact that the mechanisms that manage to prioritize certain frequencies do so by inhibiting their neighbors. The AI acts by reversing these mechanisms.
If we look at the evolution at 3 months of the groups with and without AI, it was observed that in EWB the AI decreases the hearing of high frequencies in both ears, whereas in ANX and MIX it improves the hearing of the LE, specifically of those frequencies that were not prioritized at baseline. This fact suggests that the AI acts by “anesthetizing” the prioritization of high frequencies and its alert function in the face of threatening sounds.
By comparison, AI makes the auditory patterns that differentiated EWB and ANX groups disappear while decreasing the frequency of peaks and valleys in ANX and MIX groups. This fact is justified by the tendency of the AI to balance the hearing thresholds of adjacent frequencies.
The results of the AI on the hearing of the different groups could be explained as a modulation of the auditory corticofugal system (ACFS) and of the different neurotransmitters of the auditory pathway. In this way, both serotonin [68,69] and ACFS [70,71] (through acetylcholine) favor the perception of high frequencies in both ears. The ACFS also inhibits hearing in a generalized way, with this inhibition being more powerful in the right ear [71,72]. As anxiety symptoms increase and are associated with depressive symptoms, the ACFS increasingly affects the LE. In this way, AI may reverse the effect of ACFS on the cochlea to a greater or lesser extent. Thus, the EWB group starts with a certain activation of the ACFS that fundamentally affects the RE. Its inhibition through AI leads to an auditory gain of the RE and a bilateral drop of treble. The ANX group, however, starts from a greater activation of ACFS, affecting LE more intensely than it activates it in EWB. AI is able to fundamentally reverse the action of ACFS on the LE, compared to the RE, which translates into a generalized hearing gain with loss of treble prioritization in the LE. The MIX group, by comparison, starts from an even greater activation of the ACFS, with a significant impact on the LE. The AI basically manages to partially neutralize the effect of ACFS on the LE, which translates into less general hearing gain for this ear, but maintains its prioritization of high frequencies.
Based on the effect observed in the EWB group, AI enhances interaural auditory balance and down-regulates the auditory alert systems to threatening (high-pitched) sounds. This may prevent the appearance of auditory patterns associated with anxiety. In this way, it would be interesting to check if such a decrease in the auditory patterns of anxiety can act on the mental state caused by the same anxiety, as occurs with other modulations of emotions through techniques aimed at regulating expression (e.g., meditation or yoga). In circumstances of anxiety, AI would not achieve interaural balance, but would reduce the high-frequency alert circuit. This may translate into a lower level of activation anxiety. However, when anxiety is associated with depressive symptoms, the effect of AI is less, with the prioritization of acute frequencies persisting in the LE.
Those groups that did not receive AI evolved differently after 3 months compared to those that did receive it. The EWB group without AI maintained the LE advantage at the expense of hearing gain for this ear, which is an inverted image compared to that observed in EWB with AI. This is likely due to a greater activation of the right hemisphere, so it would be expected that their levels of alertness anxiety would have increased. The ANX group without AI lost the auditory advantage of the LE without being able to define a specific ear as being responsible, in contrast to the group with AI, where the interaural difference was maintained in favor of the LE due to an auditory gain of the latter. Being a pathological group, the emotional evolution of its members is much more random and, therefore, greater instability in their right hemisphere and their audiograms could be expected. In the MIX group, both those who did not receive AI and those who did lost the interaural advantage of the LE. As it is a more heterogeneous pathological group in terms of intensity and chronicity of symptoms, the emotional evolution of its members is expected to be more disparate. The greater or lesser activation of the right hemisphere and the evolution of the audiogram is less predictable.
It would be desirable to study whether the changes in the audiogram correspond to changes in the emotional state because, if so, the AI (Bérard method) may be used as an effective, brief, and harmless therapeutic tool to prevent and address anxiety symptoms.

5. Conclusions

From these results, it can be concluded that the application of this auditory intervention (or modified Bérard method) makes hearing evolve at 3 months in a different, and sometimes opposite, way to that expected by natural evolution, according to the starting emotional state. Its effect tends to balance the hearing thresholds of all frequencies in both ears, losing the physiological interaural advantage of the left ear in addition to the prioritization of high alert frequencies.

Supplementary Materials

The following supporting information can be downloaded at: https://www.mdpi.com/article/10.3390/sym14122490/s1, Document S1: Song list (modified Bérard Method); Table S1: Original Data.

Author Contributions

Conceptualization, B.E.-G., M.J.Á.-P. and F.G.; Data curation, B.E.-G. and F.G.; Formal analysis, B.E.-G. and F.G.; Investigation, B.E.-G.; Methodology, B.E.-G., M.J.Á.-P. and F.G.; Project administration, B.E.-G.; Resources, B.E.-G.; Software, B.E.-G.; Supervision, F.G.; Validation, M.J.Á.-P. and F.G.; Visualization, B.E.-G., M.J.Á.-P. and F.G.; Writing—original draft, B.E.-G. and F.G.; Writing—review and editing, M.J.Á.-P. and F.G. All authors have read and agreed to the published version of the manuscript.

Funding

This research received no external funding.

Institutional Review Board Statement

The study was conducted in accordance with the Declaration of Helsinki, and approved by the Ethics Committee of Hospital la Princesa, Madrid (Protocol code: 05/11; 8 March 2012).

Informed Consent Statement

Informed consent was obtained from all subjects involved in the study.

Data Availability Statement

Data are available in Supplementary Materials.

Conflicts of Interest

The authors declare no conflict of interest.

References

  1. Broca, P. Remarques sur le siège de la faculté du langage articulé, suivies d’une observation d’aphémie (perte de la parole). Bull. Mem. Soc. Anat. Paris 1861, 6, 330–357. [Google Scholar]
  2. Geschwind, N.; Levitsky, W. Human brain: Left-right asymmetries in temporal speech region. Science 1968, 161, 186–187. [Google Scholar] [CrossRef] [PubMed]
  3. Eberstaller, O. Das Stirnhirn; ein Beitrag zur Anatomie der Oberfläche des Grosshirns; Urban & Schwarzenberg: Munich, Germany, 1890. [Google Scholar]
  4. Ocklenburg, S.; Güntürkün, O. Hemispheric asymmetries: The comparative view. Front. Psychol. 2012, 3, 5. [Google Scholar] [CrossRef] [PubMed] [Green Version]
  5. Goldberg, E.; Roediger, D.; Kucukboyaci, N.E.; Carlson, C.; Devinsky, O.; Kuzniecky, R.; Halgren, E.; Thesen, T. Hemispheric asymmetries of cortical volume in the human brain. Cortex 2013, 49, 200–210. [Google Scholar] [CrossRef] [PubMed]
  6. Frässle, S.; Paulus, F.M.; Krach, S.; Schweinberger, S.R.; Stephan, K.E.; Jansen, A. Mechanisms of hemispheric lateralization: Asymmetric interhemispheric recruitment in the face perception network. NeuroImage 2016, 124, 977–988. [Google Scholar] [CrossRef] [PubMed]
  7. Kimura, D. Functional Asymmetry of the Brain in Dichotic Listening. Cortex 1967, 3, 163–178. [Google Scholar] [CrossRef]
  8. Hirnstein, M.; Westerhausen, R.; Korsnes, M.S.; Hugdahl, K. Sex differences in language asymmetry are age-dependent and small: A large-scale, consonant-vowel dichotic listening study with behavioral and fMRI data. Cortex 2013, 49, 1910–1921. [Google Scholar] [CrossRef]
  9. Hugdahl, K.; Løberg, E.-M.; Jørgensen, H.A.; Lundervold, A.; Lund, A.; Green, M.F.; Rund, B. Left hemisphere lateralisation of auditory hallucinations in schizophrenia: A dichotic listening study. Cogn. Neuropsychiatry 2008, 13, 166–179. [Google Scholar] [CrossRef]
  10. Prete, G.; D’Anselmo, A.; Brancucci, A.; Tommasi, L. Evidence of a Right Ear Advantage in the absence of auditory targets. Sci. Rep. 2018, 8, 15569. [Google Scholar] [CrossRef] [PubMed] [Green Version]
  11. Sininger, Y.S.; Bhatara, A. Laterality of basic auditory perception. Laterality 2012, 17, 129–149. [Google Scholar] [CrossRef] [Green Version]
  12. Estalayo-Gutiérrez, B.; Álvarez-Pasquín, M.J.; Germain, F. Modulation of Auditory Perception Laterality under Anxiety and Depression Conditions. Symmetry 2022, 14, 24. [Google Scholar] [CrossRef]
  13. Brancucci, A.; Babiloni, C.; Rossini, P.M.; Romani, G.L. Right hemisphere specialization for intensity discrimination of musical and speech sounds. Neuropsychologia 2005, 43, 1916–1923. [Google Scholar] [CrossRef] [PubMed]
  14. Okamoto, H.; Stracke, H.; Draganova, R.; Pantev, C. Hemispheric asymmetry of auditory evoked fields elicited by spectral versus temporal stimulus change. Cereb. Cortex 2009, 19, 2290–2297. [Google Scholar] [CrossRef] [Green Version]
  15. Okamoto, H.; Kakigi, R. Hemispheric asymmetry of auditory mismatch negativity elicited by spectral and temporal deviants: A magnetoencephalographic study. Brain Topogr. 2015, 28, 471–478. [Google Scholar] [CrossRef] [Green Version]
  16. Brancucci, A.; D’Anselmo, A.; Martello, F.; Tommasi, L. Left hemisphere specialization for duration discrimination of musical and speech sounds. Neuropsychologia 2008, 46, 2013–2019. [Google Scholar] [CrossRef]
  17. Gainotti, G. Emotional behavior and hemispheric side of the lesion. Cortex 1972, 8, 41–55. [Google Scholar] [CrossRef]
  18. Gainotti, G. Unconscious processing of emotions and the right hemisphere. Neuropsychologia 2012, 50, 205–218. [Google Scholar] [CrossRef] [PubMed]
  19. Davidson, R.J.; Mednick, D.; Moss, E.; Saron, C.; Schaffer, C.E. Ratings of emotion in faces are influenced by the visual field to which stimuli are presented. Brain Cogn. 1987, 6, 403–411. [Google Scholar] [CrossRef]
  20. Baijal, S.; Srinivasan, N. Emotional and hemispheric asymmetries in shifts of attention: An ERP study. Cogn. Emot. 2011, 25, 280–294. [Google Scholar] [CrossRef]
  21. Wyczesany, M.; Capotosto, P.; Zappasodi, F.; Prete, G. Hemispheric asymmetries and emotions: Evidence from effective connectivity. Neuropsychologia 2018, 121, 98–105. [Google Scholar] [CrossRef]
  22. Gainotti, G. Emotions and the Right Hemisphere: Can New Data Clarify Old Models? Neurosci. Rev. J. Bringing Neurobiol. Neurol. Psychiatry 2019, 25, 258–270. [Google Scholar] [CrossRef]
  23. Contrera, K.J.; Betz, J.; Deal, J.A.; Choi, J.S.; Ayonayon, H.N.; Harris, T.; Helzner, E.; Martin, K.R.; Mehta, K.; Pratt, S.; et al. Association of Hearing Impairment and Emotional Vitality in Older Adults. J. Gerontol. Ser. B Psychol. Sci. Soc. Sci. 2016, 71, 400–404. [Google Scholar] [CrossRef] [PubMed] [Green Version]
  24. Sakagami, M.; Kitahara, T.; Okayasu, T.; Yamashita, A.; Hasukawa, A.; Ota, I.; Yamanaka, T. Negative prognostic factors for psychological conditions in patients with audiovestibular diseases. Auris Nasus Larynx 2016, 43, 632–636. [Google Scholar] [CrossRef] [PubMed]
  25. Zhai, F.; Wang, J.; Zhang, Y.; Dai, C.-F. Quantitative Analysis of Psychiatric Disorders in Intractable Peripheral Vertiginous Patients: A Prospective Study. Otol. Neurotol. Off. Publ. Am. Otol. Soc. Am. Neurotol. Soc. Eur. Acad. Otol. Neurotol. 2016, 37, 539–544. [Google Scholar] [CrossRef]
  26. Mohamed, S.; Khan, I.; Iliodromiti, S.; Gaggini, M.; Kontorinis, G. Ménière’s Disease and Underlying Medical and Mental Conditions: Towards Factors Contributing to the Disease. ORL J. Oto-Rhino-Laryngol. Its Relat. Spec. 2016, 78, 144–150. [Google Scholar] [CrossRef]
  27. Kim, S.Y.; Jeon, Y.J.; Lee, J.-Y.; Kim, Y.H. Characteristics of tinnitus in adolescents and association with psychoemotional factors. Laryngoscope 2017, 127, 2113–2119. [Google Scholar] [CrossRef]
  28. Wiegner, L.; Hange, D.; Björkelund, C.; Ahlborg, G. Prevalence of perceived stress and associations to symptoms of exhaustion, depression and anxiety in a working age population seeking primary care--an observational study. BMC Fam. Pract. 2015, 16, 38. [Google Scholar] [CrossRef] [PubMed] [Green Version]
  29. de Kovel, C.G.F.; Aftanas, L.; Aleman, A.; Alexander-Bloch, A.F.; Baune, B.T.; Brack, I.; Bülow, R.; Busatto Filho, G.; Carballedo, A.; Connolly, C.G.; et al. No Alterations of Brain Structural Asymmetry in Major Depressive Disorder: An ENIGMA Consortium Analysis. Am. J. Psychiatry 2019, 176, 1039–1049. [Google Scholar] [CrossRef] [PubMed]
  30. Hirakawa, N.; Hirano, Y.; Nakamura, I.; Hirano, S.; Sato, J.; Oribe, N.; Ueno, T.; Kanba, S.; Onitsuka, T. Right hemisphere pitch-mismatch negativity reduction in patients with major depression: An MEG study. J. Affect. Disord. 2017, 215, 225–229. [Google Scholar] [CrossRef]
  31. Bruder, G.E.; Stewart, J.W.; McGrath, P.J. Right brain, left brain in depressive disorders: Clinical and theoretical implications of behavioral, electrophysiological and neuroimaging findings. Neurosci. Biobehav. Rev. 2017, 78, 178–191. [Google Scholar] [CrossRef] [PubMed]
  32. Li, M.; Xu, H.; Lu, S. Neural Basis of Depression Related to a Dominant Right Hemisphere: A Resting-State fMRI Study. Behav. Neurol. 2018, 2018, 5024520. [Google Scholar] [CrossRef]
  33. Bruder, G.E.; Alvarenga, J.; Abraham, K.; Skipper, J.; Warner, V.; Voyer, D.; Peterson, B.S.; Weissman, M.M. Brain laterality, depression and anxiety disorders: New findings for emotional and verbal dichotic listening in individuals at risk for depression. Laterality 2016, 21, 525–548. [Google Scholar] [CrossRef]
  34. Jung, Y.-H.; Shin, J.E.; Lee, Y.I.; Jang, J.H.; Jo, H.J.; Choi, S.-H. Altered Amygdala Resting-State Functional Connectivity and Hemispheric Asymmetry in Patients With Social Anxiety Disorder. Front. Psychiatry 2018, 9, 164. [Google Scholar] [CrossRef]
  35. Peng, X.; Lau, W.K.W.; Wang, C.; Ning, L.; Zhang, R. Impaired left amygdala resting state functional connectivity in subthreshold depression individuals. Sci. Rep. 2020, 10, 17207. [Google Scholar] [CrossRef] [PubMed]
  36. Zatorre, R.J.; Chen, J.L.; Penhune, V.B. When the brain plays music: Auditory-motor interactions in music perception and production. Nat. Rev. Neurosci. 2007, 8, 547–558. [Google Scholar] [CrossRef]
  37. Koelsch, S. Brain correlates of music-evoked emotions. Nat. Rev. Neurosci. 2014, 15, 170–180. [Google Scholar] [CrossRef]
  38. Särkämö, T.; Tervaniemi, M.; Huotilainen, M. Music perception and cognition: Development, neural basis, and rehabilitative use of music. Wiley Interdiscip. Rev. Cogn. Sci. 2013, 4, 441–451. [Google Scholar] [CrossRef]
  39. Alluri, V.; Toiviainen, P.; Jääskeläinen, I.P.; Glerean, E.; Sams, M.; Brattico, E. Large-scale brain networks emerge from dynamic processing of musical timbre, key and rhythm. NeuroImage 2012, 59, 3677–3689. [Google Scholar] [CrossRef] [PubMed]
  40. Wan, C.Y.; Schlaug, G. Music making as a tool for promoting brain plasticity across the life span. Neurosci. Rev. J. Bringing Neurobiol. Neurol. Psychiatry 2010, 16, 566–577. [Google Scholar] [CrossRef] [Green Version]
  41. Schlaug, G. Musicians and music making as a model for the study of brain plasticity. Prog. Brain Res. 2015, 217, 37–55. [Google Scholar] [CrossRef] [PubMed] [Green Version]
  42. Vaquero, L.; Hartmann, K.; Ripollés, P.; Rojo, N.; Sierpowska, J.; François, C.; Càmara, E.; van Vugt, F.T.; Mohammadi, B.; Samii, A.; et al. Structural neuroplasticity in expert pianists depends on the age of musical training onset. NeuroImage 2016, 126, 106–119. [Google Scholar] [CrossRef] [PubMed]
  43. Soria-Urios, G.; Duque, P.; García-Moreno, J.M. Música y cerebro: Fundamentos neurocientíficos y trastornos musicales. Rev. Neurol. 2011, 52, 45–55. [Google Scholar] [CrossRef] [PubMed] [Green Version]
  44. Zhang, G.-Y.; Yang, M.; Liu, B.; Huang, Z.-C.; Li, J.; Chen, J.-Y.; Chen, H.; Zhang, P.P.; Liu, L.J.; Wang, J.; et al. Changes of the directional brain networks related with brain plasticity in patients with long-term unilateral sensorineural hearing loss. Neuroscience 2016, 313, 149–161. [Google Scholar] [CrossRef] [PubMed]
  45. Shiell, M.M.; Champoux, F.; Zatorre, R.J. The Right Hemisphere Planum Temporale Supports Enhanced Visual Motion Detection Ability in Deaf People: Evidence from Cortical Thickness. Neural Plast. 2016, 2016, 7217630. [Google Scholar] [CrossRef] [Green Version]
  46. Shi, B.; Yang, L.-Z.; Liu, Y.; Zhao, S.-L.; Wang, Y.; Gu, F.; Yang, Z.; Zhou, Y.; Zhang, P.; Zhang, X. Early-onset hearing loss reorganizes the visual and auditory network in children without cochlear implantation. Neuroreport 2016, 27, 197–202. [Google Scholar] [CrossRef] [PubMed]
  47. Mowery, T.M.; Kotak, V.C.; Sanes, D.H. The onset of visual experience gates auditory cortex critical periods. Nat. Commun. 2016, 7, 10416. [Google Scholar] [CrossRef] [Green Version]
  48. Heggdal, P.O.L.; Brännström, J.; Aarstad, H.J.; Vassbotn, F.S.; Specht, K. Functional-structural reorganisation of the neuronal network for auditory perception in subjects with unilateral hearing loss: Review of neuroimaging studies. Hear. Res. 2016, 332, 73–79. [Google Scholar] [CrossRef] [Green Version]
  49. Harrison Bush, A.L.; Lister, J.J.; Lin, F.R.; Betz, J.; Edwards, J.D. Peripheral Hearing and Cognition: Evidence From the Staying Keen in Later Life (SKILL) Study. Ear Hear. 2015, 36, 395–407. [Google Scholar] [CrossRef] [Green Version]
  50. Voller, J.; Potužáková, B.; Šimeček, V.; Vožeh, F. The role of whiskers in compensation of visual deficit in a mouse model of retinal degeneration. Neurosci. Lett. 2014, 558, 149–153. [Google Scholar] [CrossRef]
  51. Puschmann, S.; Sandmann, P.; Bendixen, A.; Thiel, C.M. Age-related hearing loss increases cross-modal distractibility. Hear. Res. 2014, 316, 28–36. [Google Scholar] [CrossRef]
  52. Salimpoor, V.N.; Benovoy, M.; Larcher, K.; Dagher, A.; Zatorre, R.J. Anatomically distinct dopamine release during anticipation and experience of peak emotion to music. Nat. Neurosci. 2011, 14, 257–262. [Google Scholar] [CrossRef]
  53. Okada, K.; Kurita, A.; Takase, B.; Otsuka, T.; Kodani, E.; Kusama, Y.; Atarashi, H.; Mizuno, K. Effects of music therapy on autonomic nervous system activity, incidence of heart failure events, and plasma cytokine and catecholamine levels in elderly patients with cerebrovascular disease and dementia. Int. Heart J. 2009, 50, 95–110. [Google Scholar] [CrossRef] [PubMed] [Green Version]
  54. Bradt, J.; Dileo, C.; Potvin, N. Music for stress and anxiety reduction in coronary heart disease patients. Cochrane Database Syst. Rev. 2013, 12, CD006577. [Google Scholar] [CrossRef]
  55. Radley, J.; Morilak, D.; Viau, V.; Campeau, S. Chronic stress and brain plasticity: Mechanisms underlying adaptive and maladaptive changes and implications for stress-related CNS disorders. Neurosci. Biobehav. Rev. 2015, 58, 79–91. [Google Scholar] [CrossRef] [Green Version]
  56. Nilsson, U. The effect of music intervention in stress response to cardiac surgery in a randomized clinical trial. Heart Lung J. Crit. Care 2009, 38, 201–207. [Google Scholar] [CrossRef]
  57. Särkämö, T.; Pihko, E.; Laitinen, S.; Forsblom, A.; Soinila, S.; Mikkonen, M.; Autti, T.; Silvennoinen, H.M.; Erkkilä, J.; Laine, M.; et al. Music and speech listening enhance the recovery of early sensory processing after stroke. J. Cogn. Neurosci. 2010, 22, 2716–2727. [Google Scholar] [CrossRef]
  58. Altenmüller, E.; Marco-Pallares, J.; Münte, T.F.; Schneider, S. Neural reorganization underlies improvement in stroke-induced motor dysfunction by music-supported therapy. Ann. N. Y. Acad. Sci. 2009, 1169, 395–405. [Google Scholar] [CrossRef]
  59. Amengual, J.L.; Rojo, N.; Veciana de Las Heras, M.; Marco-Pallarés, J.; Grau-Sánchez, J.; Schneider, S.; Vaquero, L.; Juncadella, M.; Montero, J.; Mohammadi, B.; et al. Sensorimotor plasticity after music-supported therapy in chronic stroke patients revealed by transcranial magnetic stimulation. PLoS ONE 2013, 8, e61883. [Google Scholar] [CrossRef]
  60. Bérard, G.; Brockett, S. Hearing Equals Behavior: Updated and Expanded; eBooks2go: Schaumburg, IL, USA, 2014. [Google Scholar]
  61. Goldberg, D.; Bridges, K.; Duncan-Jones, P.; Grayson, D. Detecting anxiety and depression in general medical settings. BMJ 1988, 297, 897–899. [Google Scholar] [CrossRef] [Green Version]
  62. Montón, C.; Pérez Echeverría, M.J.; Campos, R.; García Campayo, J.; Lobo, A. Escalas de ansiedad y depresión de Goldberg: Una guía de entrevista eficaz para la detección del malestar psíquico. Aten. Primaria Soc. Esp. Med. Fam. Comunitaria 1993, 12, 345–349. [Google Scholar]
  63. Carrobles, J.; Costa, M.; Del Ser, T.; Bartolomé, P. La práctica de la Terapia de Conducta; Promolibro: Valencia, Spain, 1986. [Google Scholar]
  64. Ramos-Brieva, J.A.; Cordero Villafáfila, A. Validación de la versión castellana de la escala de Hamilton para la depresión. Actas Luso-Esp. Neurol. Psiquiatr. Cienc. Afines 1986, 14, 324–334. [Google Scholar] [PubMed]
  65. Todd, W.V.; Douglas, J.G. Cerebral Cortex. Noltes Hum. Brain, 7th ed.; Elsevier: Amsterdam, The Netherlands, 2016; pp. 541–578. [Google Scholar]
  66. Winer, J.A. Decoding the auditory corticofugal systems. Hear. Res. 2006, 212, 1–8. [Google Scholar] [CrossRef] [PubMed]
  67. Straka, M.M.; Hughes, R.; Lee, P.; Lim, H.H. Descending and tonotopic projection patterns from the auditory cortex to the inferior colliculus. Neuroscience 2015, 300, 325–337. [Google Scholar] [CrossRef] [PubMed]
  68. Papesh, M.A.; Hurley, L.M. Modulation of auditory brainstem responses by serotonin and specific serotonin receptors. Hear. Res. 2016, 332, 121–136. [Google Scholar] [CrossRef] [PubMed]
  69. Felix, R.A.; Elde, C.J.; Nevue, A.A.; Portfors, C.V. Serotonin modulates response properties of neurons in the dorsal cochlear nucleus of the mouse. Hear. Res. 2017, 344, 13–23. [Google Scholar] [CrossRef] [PubMed] [Green Version]
  70. Maison, S.F.; Liu, X.-P.; Vetter, D.E.; Eatock, R.A.; Nathanson, N.M.; Wess, J.; Liberman, M.C. Muscarinic signaling in the cochlea: Presynaptic and postsynaptic effects on efferent feedback and afferent excitability. J. Neurosci. Off. J. Soc. Neurosci. 2010, 30, 6751–6762. [Google Scholar] [CrossRef] [PubMed] [Green Version]
  71. Schofield, B.R.; Motts, S.D.; Mellott, J.G. Cholinergic cells of the pontomesencephalic tegmentum: Connections with auditory structures from cochlear nucleus to cortex. Hear. Res. 2011, 279, 85–95. [Google Scholar] [CrossRef] [Green Version]
  72. Khalfa, S.; Collet, L. Functional asymmetry of medial olivocochlear system in humans. Towards a peripheral auditory lateralization. Neuroreport 1996, 7, 993–996. [Google Scholar] [CrossRef] [PubMed]
  73. Philibert, B.; Veuillet, E.; Collet, L. Functional asymmetries of crossed and uncrossed medial olivocochlear efferent pathways in humans. Neurosci. Lett. 1998, 253, 99–102. [Google Scholar] [CrossRef] [PubMed]
  74. Maison, S.F.; Le, M.; Larsen, E.; Lee, S.-K.; Rosowski, J.J.; Thomas, S.A.; Liberman, M.C. Mice lacking adrenergic signaling have normal cochlear responses and normal resistance to acoustic injury but enhanced susceptibility to middle-ear infection. J. Assoc. Res. Otolaryngol. JARO 2010, 11, 449–461. [Google Scholar] [CrossRef] [PubMed] [Green Version]
  75. Nevue, A.A.; Felix, R.A.; Portfors, C.V. Dopaminergic projections of the subparafascicular thalamic nucleus to the auditory brainstem. Hear. Res. 2016, 341, 202–209. [Google Scholar] [CrossRef] [PubMed] [Green Version]
  76. Ji, W.; Suga, N. Histaminergic modulation of nonspecific plasticity of the auditory system and differential gating. J. Neurophysiol. 2013, 109, 792–802. [Google Scholar] [CrossRef] [PubMed]
  77. Sadock, V.A.; Sadock, B.J.; Ruiz, P. Anxiety Disorders. In Kaplan & Sadock’s Synopsis of Psychiatry: Behavioral Sciences/Clinical Psychiatry, 11th ed.; Wolters Kluwer: Alphen aan den Rijn, The Netherlands, 2015; pp. e19290–e19567. [Google Scholar]
  78. Sadock, V.A.; Sadock, B.J.; Ruiz, P. Mood Disorders. In Kaplan & Sadock’s Synopsis of Psychiatry: Behavioral Sciences/Clinical Psychiatry, 11th ed.; Wolters Kluwer: Alphen aan den Rijn, The Netherlands, 2015; pp. e17600–e19258. [Google Scholar]
Figure 1. Flowchart of study participants. AI: Auditory Intervention.
Symmetry 14 02490 g001
Figure 2. Comparison in the Emotional Well-Being group between auditory intervention and no intervention. Comparison of hearing thresholds between ears in Hearing intervention (A), and No Hearing intervention (D). Comparison of hearing thresholds between T0 and T3 in the right ear for Hearing intervention group (B) and No Hearing intervention group (E); and in the left ear for Hearing intervention group (C) and No Hearing intervention group (F). EWB: Emotional Well-Being; RE: right ear; LE: left ear; +AI: auditory intervention; −AI, No auditory intervention; T0: initial moment; T3: at three months. Groups were compared by two-way ANOVA. Statistical significance was considered as p < 0.05. The error bars depict standard deviations.
Symmetry 14 02490 g002
Figure 3. Emotional Well-Being group, interaural differences between T0 and T3 in the No Intervention group (A), Intervention group (B). Interaural differences between Intervention group and No Intervention group (C) at T3. EWB: Emotional Well-Being; RE: right ear; LE: left ear; +AI: auditory intervention; −AI, No auditory intervention; T0: initial moment; T3: at three months. Groups were compared by two-way ANOVA. Statistical significance was considered as p < 0.05. The error bars depict standard deviations.
Symmetry 14 02490 g003
Figure 4. Comparison in the Anxiety group between auditory intervention and no intervention. Comparison of hearing thresholds between ears in Hearing intervention (A), and No Hearing intervention (D). Comparison of Hearing thresholds between T0 and T3 in the right ear for Hearing intervention group (B); and No Hearing intervention group (E) and in the left ear for Hearing intervention group (C); and No Hearing intervention group (F). ANX: Anxiety; RE: right ear; LE: left ear; +AI: auditory intervention; −AI, No auditory intervention; T0: initial moment; T3: at three months. Groups were compared by two-way ANOVA. Statistical significance was considered as p < 0.05. The error bars depict standard deviations.
Symmetry 14 02490 g004
Figure 5. Anxiety group, interaural differences between T0 and T3 in the No Intervention group (A), Intervention group (B). Interaural differences between Intervention group and No Intervention group (C) at T3. ANX: Anxiety; RE: right ear; LE: left ear; +AI: auditory intervention; −AI, No auditory intervention; T0: initial moment; T3: at three months. Groups were compared by two-way ANOVA. Statistical significance was considered as p < 0.05. The error bars depict standard deviations.
Symmetry 14 02490 g005
Figure 6. Comparison in the Mixed group between auditory intervention and no intervention. Comparison of hearing thresholds between ears in Hearing intervention (A), and No Hearing intervention (D). Comparison of hearing thresholds between T0 and T3 in the right ear for Hearing intervention group (B) and No Hearing intervention group (E); and in the left ear for Hearing intervention group (C) and No Hearing intervention group (F). MIX: Mixed; RE: right ear; LE: left ear; +AI: auditory intervention; −AI, No auditory intervention; T0: initial moment; T3: at three months. Groups were compared by two-way ANOVA. Statistical significance was considered as p < 0.05. The error bars depict standard deviations.
Symmetry 14 02490 g006
Figure 7. Mixed group, interaural differences between T0 and T3 in the No Intervention group (A), Intervention group (B). Interaural differences between Intervention group and No Intervention group (C) at T3. MIX: Mixed; RE: right ear; LE: left ear; +AI: auditory intervention; −AI, No auditory intervention; T0: initial moment; T3: at three months. Groups were compared by two-way ANOVA. Statistical significance was considered as p < 0.05. The error bars depict standard deviations.
Symmetry 14 02490 g007
Figure 8. Comparison in each ear, at three months, of the effect of auditory intervention with no intervention in Well-Being group (A), Anxious group (B), and Mixed group (C). EWB: Emotional Well-Being; ANX: Anxiety; MIX: Mixed; RE: right ear; LE: left ear; +AI: auditory intervention; −AI, No auditory intervention; T3: at three months. The groups were compared by two-way ANOVA and Tukey post hoc test. Statistical significance was considered as p < 0.05. The error bars depict standard deviations.
Symmetry 14 02490 g008
Figure 9. Comparison in each ear of hearing thresholds between the Emotional Well-Being group without intervention and the Anxiety (A,B) and Mixed (C,D) groups with auditory intervention. EWB: Emotional Well-Being; ANX: Anxiety; MIX: Mixed; +AI: auditory intervention; −AI, No auditory intervention; T3: at three months. RE, right eye; LE, left eye. The groups were compared by two-way ANOVA and Tukey post hoc test. Statistical significance was considered as p < 0.05. The error bars depict standard deviations.
Symmetry 14 02490 g009
Publisher’s Note: MDPI stays neutral with regard to jurisdictional claims in published maps and institutional affiliations.

