1. Introduction
Symmetry is an important factor in various fields of engineering research. In transport and logistics, the concept of symmetry could be considered in various fields of application, such as in transport engineering; between the demand and the supply of transport services; between transport prices and realized journeys and transported goods; between the delivery time and the transport route; between the frequency of service and the available infrastructure capacity; between infrastructure and rolling stock; between energy efficiency and environmental friendliness of transport.
This paper presents an application of the concept of symmetry in autonomous metro transport. The concept of symmetry provides balance and helps all elements exist in harmony with each other. In addition, it helps to create conceptual models through the tools of group theory. In this regard, the present study is aimed at creating groups of symmetrical autonomous metro lines that are united by common features. It would help to make decisions on the development of elements of the group in the likeness of another and also on the transition from one group to another. The multi-criteria analysis is a powerful tool for detecting and proving symmetry. A balance could be sought here between the goal and the decision-making criteria; between the criteria and the ranking of the studied objects; between the experts and their assessments. The concept of symmetry helps to create patterns, using tools of group theory. In this sense, cluster analysis is also a means of proving symmetry, by grouping many diverse objects by similarity on certain indicators into groups.
The autonomous public transport increases the sustainability of transport mobility in big cities. The implementation of autonomous metro systems allows operators to increase the average speed of the trains, improve the frequency of service, optimize the running time of trains, increase the safety and efficiency, reduce the human errors and risks, increase the energy efficiency, mobility, capacity, availability and flexibility of transport. The autonomous mobility enhances operations and safety in transport. It makes the journeys more efficient, accurate and reliable. These systems enable operators to performs better with less human and risk.
There are four levels of the grade of automation for urban rail transit systems according to the responsibility of the staff, and of the system itself defined by the International Electro-Technical Commission, [
1], as follows: manual operation with automatic train protection (GOA 1); semi-automatic train operation (GOA 2); driverless train operation (GOA 3); unattended train operation (GOA 4). At the lowest level, the automation is through automatic train protection with the driver. In the second level, the automated trains have automatic train protection and automatic train operation. There are the drivers, too. The third level also includes automated door closure. At the highest level of automation, the trains are driverless and all operations are automated. On the one hand, controls are installed on the lines and in stations, and on the other hand, each train has on-board controls. The system is supervised and managed by a central control office from a distance.
There are many metro lines using an autonomous system. There are 64 fully automated metro lines in 42 cities around the world; which are nearly a quarter of the world’s metro systems [
2].
This research examines the full autonomous metro systems in Europe (GOA 4). The objects of this study are 20 fully automated metro train systems in 15 European cities where thousands of passengers travel every day. They are located in France, Italy, Spain, Hungary, Denmark, Switzerland and Germany. The largest number of fully automated metro networks are located in France and Italy. France is one of the four countries in which half of the world’s kilometer of fully automated metro lines are concentrated. In France, they operate in five cities: Paris, Rennes, Toulouse, Lyon and Lille. In Italy, the automated railway systems operate in four cities: Rome, Milan, Turin and Brescia. The fully automated train systems are also in Barcelona in Spain, Budapest in Hungary, Copenhagen in Denmark, Lausanne in Switzerland, and Nuremberg in Germany.
These autonomous metro lines could be analyzed according to different criteria separately, for example, by length, number of journeys and number of stations. Of interest is the issue of the efficiency of the different metro lines, whether they could be grouped based on a set of criteria. The hypothesis that has to be solved in this study is that the autonomous metro systems’ performance depends on different criteria related to the safety, infrastructure and technological development.
The methods of multi-criteria analysis and also of multidimensional statistical analysis, as cluster analysis, are suitable methods for ranking metro systems. In the first case, the studied alternatives are ranked, while in the second case, they are grouped into clusters.
The purpose of this research is to assess the fully autonomous metro systems and to form groups of symmetric autonomous metro lines based on the multi-criteria methods and multi-measurable statistical method of cluster analysis by considering the criteria related to the safety, infrastructure and technological development.
The research question for this study aims to address to the following issues:
How evaluate the performance of autonomous metro lines;
How to form groups of symmetrical autonomous metro lines;
How to determine the impact of different criteria on the development of the autonomous metro systems;
How to reduce subjectivity in evaluating criteria;
How the results of different multi-criteria methods could be combined to an aggregate ranking system.
There is symmetry on the one hand, between the subjectivism of the decision maker when assessing the criteria, and the influence of the criteria for evaluating the metro systems, and on the other hand, between multi-criteria decision-making methods and the ranking of the investigated system. The elaboration of a new integrated evaluation for decision-making permits the symmetry principles to be considered.
The novelty of the proposed evaluation and its main contribution is presented by determination of groups of symmetrical autonomous metro lines; integration of different multi-criteria methods into an aggregative approach, which ranks the alternatives and assesses the criteria. The output of the different multi-criteria methods serves as an input to an aggregated system for decision making.
The paper is structured as follows.
Section 2 provides a literature review.
Section 3 explains the methodology. The experimentation and results are shown in
Section 4.
Section 5 presents the conclusions. The elaborated methodology is applied for autonomous metro systems’ performance in the European Countries.
2. Literature review
2.1. Autonomous Metro Systems
The studies of different authors about the development and effectiveness of autonomous metro systems were focused on the following areas:
Analysis of the autonomous metro lines in different countries [
2,
3];
Investigating the demand for an automated metro system [
4,
5];
Study of the factors influencing the development of autonomous metro lines [
2,
3,
11,
12,
15,
16,
17];
Classifying metro systems according to the influence of predefined criteria [
3,
18,
19,
20,
21].
A general overview of the world metro automation has been previously presented [
2]. The infrastructure, capacity, signaling technology, rolling stock market, construction model, platform track protection systems and growth for word regions were presented and analyzed. The statistics show that fully automated metro lines represent 7% of the world’s metro infrastructure. It was found that four countries (South Korea, France, Singapore and Malaysia) concentrate half of the world’s kilometers of fully automated metro lines. Asia leads in metro automation with 50%, Europe has second position at 30%. In [
3], 25 out of the 40 driverless metro lines existing worldwide were analyzed according to the performance of infrastructure and rolling stock; the reliability and quality of the service; and the innovation demonstrated by the operators. The performance was graded in five levels in order to determine for each indicator the relative performance of each network. It was found that according to the infrastructure and rolling stock, Line A in Toulouse, Line 2 and Line 1 in Lille have big performance (over 4) compared to the other autonomous metro lines included in the research conducted. Four main categories of infrastructure and rolling stock performance were proposed, as follows: efficient, beginner, agile and struggling. The age of infrastructure and rolling stocks were also accounted for. The efficient category includes infrastructure and rolling stock that are several years old; the beginner category includes infrastructure and rolling stock that are generally recent and even new; for the agile category, the rolling stock is advanced age; for the struggling category, there is ageing of the infrastructure. Paris Line 14 and Toulouse Line A were classified in the efficient category, as were Lausanne Line M2 and Paris Line 1 in struggling one.
In [
4], the authors conducted the acceptance of fully automated public transport. For this purpose, an online study was carried out in Nuremberg, Germany. The questionnaire included the investigation about the attitudes of the participants towards autonomous public transport. A high willingness to use the autonomous public transport was found. The autonomous transport according to the user decision-making mobility has previously been commented on [
5].
The challenges of implementing the autonomous metro system were discussed in [
6]. The Tyne and Wear Metro were used as a case study. The London Underground Central Line were analyzed. A discrete event-based simulation modelling was applied to investigate the benefits of implementing driverless trains. The capacity utilization, dwell time, energy consumption, journey time and higher performance rolling stock were compared for both autonomous and conventional metro. A general overview about driverless train operation was presented in [
7]. The authors analyzed safety issues, train control technology, communication systems, lower operation costs, and emergency situations which are the challenges of autonomous metro systems. The history and future trend of these systems were presented. The trends, technologies and challenges in a full automation level in rail transportation were analyzed in [
8]. The authors analyzed 69 studies about user perceptions and outlook, design and technologies, train controls, applications, main advantages and challenges from the deployment of autonomous trains. The development of autonomous trains was studied in [
9]. The risks and issues, necessary to be solved for the full deployment of autonomous trains, were analyzed. The authors found that there is a lack of an overall vision about the systematic and functional aspects of autonomous trains.
An assessment of the need for autonomous mobility was presented in [
10]. A decision-making framework was elaborated on. It consists of an analysis of traffic flows, the life-cycle cost and environmental flows, multi-criteria decision-making framework assigning weightage to cost, energy and emissions. The research was conducted for Abu Dhabi with user surveys with the aim to improve current or future transport and mobility services.
The determination of the appropriate supplier of an autonomous train was studied in [
11]. The multi-criteria methods for decision making as WSA (Whole-of-System Approach method), the Scoring method and the TOPSIS method were applied to make decisions.
The user acceptance of autonomous public transport was investigated in [
12]. The authors defined the factors affecting the use of autonomous transport, such as the performance expectancy, effort expectancy, social influence, facilitating conditions, hedonic motivation, price value, habit, trust and safety, perceived usefulness, perceived risk and behavioral intention. The age and gender of the users, and frequency of public transport were also studied. Both online and paper-based surveys were performed to collect the data. The users from Istanbul took part in these interviews. It was found that the social influence, performance expectancy, habit, and trust and safety constructs have a significant effect on people to use autonomous transport.
In [
13], the emergency situation in an Unattended Train Operation were studied. The FAHP (Fuzzy analytic hierarchy process) and enhanced weighted ordered weighted averaging operator was used as a hybrid decision maker. The criteria safety of passengers, emergency response time, performance of emergency recovery was applied to evaluate emergency alternatives. The Line Yan Fang in Beijing and Line 10 in Shanghai were investigated.
A cost-based analysis of autonomous mobility in regard to the economic competitiveness of public transport was conducted in [
14]. A detailed cost estimation for current and future transport modes was performed. The research covered line-based mass transit (public transport), taxis and private cars. It was found that if the demand increases significantly, the public transportation in its current form will remain economically competitive.
In [
15], 29 metro systems were investigated with respect to the factors connected to their performance. 28 factors for measuring the efficiency of metro systems were proposed, such as: number of stations, distances between stations, network length, operational speed, ticket price, frequency, population density, safety. The factors cover the environmental, technical, social and economic area, security and safety. Principal component analysis and multiple regression analysis were applied as a tool to assess the impact of the factors to improve the performance of the metro system. It was found that there is no one set of specific standards that could be sufficient to evaluate metro system performance.
The quality of service in the metro system in India was studied in [
16]. The paper-based survey by 12 attributes was performed. The authors applied the TOPSIS (Technique for Order of Preference by Similarity to Ideal Solution) method and importance satisfaction analysis to prioritize the attributes. It was found that the metro fare, connection to the metro and metro frequency are the most important in regard to the overall quality of travel by metro.
The Barcelona metro network was studied in [
17] based on statistical and mathematical analysis with the aim to assess the metro stations. This network includes 11 metro lines, as two of them are fully autonomous. The complex network analysis was performed. The principal component analysis and cluster analysis was applied to classify the metro stations of Barcelona. The results of this study are helpful in planning transport.
The state of 10 metro systems in big economics were studied in terms of investments in [
18]. The financial and ridership data were compared and analyzed. The metro systems were ranked by using the following criteria separately: Operating Cash Flow, Operating Cash Flow Margin, Daily Ridership, Usage and Metro Length per Resident. The overall ranking was conformed based on an average of the three different ranks. It was found that Asian countries have invested heavily in the development of the metros.
Forty-four smart cities were ranked in terms of the urban transport by applying TOPSIS method of multi-criteria analysis in another study [
19]. Seven criteria related to the public transport system such as capacity, light, annual number of public transport trips per capita, number of personal automobiles per capita, length of bicycle paths and lanes, transport fatalities and commercial air connectivity were proposed to assess the studied smart cities. The importance of criteria was determined by using the Entropy weight method.
The level of metro developments of 35 cities in China was studied in [
20] based on the TOPSIS method. Twenty-five criteria for assessment of metro systems which indicated demand and supply were established. A coupling coordination degree model was combined with the Entropy weight method to determine the weights of criteria. As a result of this study, the investigated cities were divided into six categories according to the sustainable development of the metro system.
The graph theory and cluster analysis were applied to study metro system of 22 European capitals, [
21]. Ten criteria connected to the state and the structure of a network were used for decision making. The metro systems in European capitals were classified into three groups: complex, simple and with only one line.
Based on the literature review, the following conclusions can be made:
The main methods that were applied by authors in the studies above for analysis and evaluation on the development of autonomous metro systems are as follows: multi-criteria decision-making methods such as TOPSIS [
11,
16,
19], WSA [
11], FAHP [
13]; principal component analysis and cluster analysis [
15]; statistical analysis [
2,
3,
10,
17,
18]; Entropy weight method [
19,
20]; cost-based analysis [
12]; graph theory [
21].
There are research gaps in the literature about the assessment the autonomous metro systems’ performance.
The problem of establishing groups of symmetric autonomous metro lines has also not been investigated. Solving this task is important from the point of view of establishing the efficiency of metro lines, and on this basis to make decisions about their development.
According to the research presented above, the commercial speed, distance between stations, length, headway and passenger safety are the main criteria to assess autonomous metro lines [
3,
11,
12,
15,
16,
17].
The multi-criteria decision-making methods which permit to assess the criteria and alternatives could be used as an important means of evaluating the autonomous metro systems and establish their symmetry.
2.2. Multi-Criteria Decision-Making Approach
The multi-criteria decision analysis is a powerful tool to assess many criteria and alternatives. Different multi-criteria methods could be applied for decision making. In general, it can be summarized that there are pair-wise comparison methods, for example AHP (Analytic hierarchy process) [
22], BWM (Best Worst method) [
23,
24], FUCOM (Full Consistency method) [
25]; distance-based methods, for example TOPSIS (Technique for Order Preference by Similarity to Ideal Solution) [
26,
27,
28], EDAS (Evaluation Based on Distance from Average Solution) [
29], VIKOR (VIseKriterijumska Optimizacija I Kompromisno Resenje) [
30]; utility-based methods, for example WASPAS (Weighted aggregated sum product assessment) [
31], COPRAS (COmplex PRoportional Assessment) [
32], MOORA (Multi-Objective Optimization Method by Ratio Analysis) [
33], MULTIMOORA (Multi-Objective Optimization on the Basis of a Ratio Analysis plus the full MULTIplicative for) [
34], MARCOS (Measurement Alternatives and Ranking according to the COmpromise Solution) [
35]; outranking methods, for example PROMETHEE (Preference Ranking Organization METHod for Enrichment of Evaluations) [
36,
37], ELECTRE (ELimination Et Choix Traduisant la REalité) [
38]; methods based on linear programming, for example SIMUS (sequential interactive model for urban systems method) [
39,
40]; and integration of two or more methods. These methods differ in the way the alternatives are ranked. The choice of the multi-criteria method depends on the problem to be solved, the research objectives, and also the preferences of the researcher. A part of multi-criteria methods can be applied only to determine the weights of the criteria; others permit ranking the alternatives, by setting the weights of the criteria; and a third serve for both criteria and alternatives assessments.
In recent years, quite a few new MCDM (multi-criteria decision-making) methods have been developed. However, the TOPSIS and PROMETHEE methods have gained quite a lot of popularity. The TOPSIS method was developed in 1981 [
26,
27,
28] and PROMETHEE in 1984 [
36,
37], and they have been applied in various fields of research. TOPSIS is a distance-based multi-criteria method which is based on the distance to the best alternative. PROMETHEE is an outranking method which uses the preference function for each criteria and net outranking flows to determine the ranking of alternatives. An overview of applications of these methods was presented in [
41,
42]. A total of 105 reviewed papers which applied the TOPSIS method were presented in [
41]. A comprehensive literature review on applications of the PROMETHEE method was presented in [
42]. A total of 217 papers from 100 journals were analyzed about the methodology and utilization of the ROMETHEE method and promoted the future of research by choosing those methods. The multi-criteria decision-making methods developed after 2000, including MOORA (Multi-Objective Optimization Method by Ratio Analysis) in 2006 [
33], COPRAS (COmplex PRoportional Assessment) in 2013 [
32] and EDAS (Evaluation Based on Distance from Average Solution) in 2015 [
29], which have also found widespread use among researchers to solve various real-life problems in the various areas of science. Various applications of these methods in the research of scientists around the world were analyzed in [
43,
44,
45]. A total of 52 EDAS method applications were summarized in [
43]. An overview of applications of MOORA and its improved version MULTIMOORA (Multi-Objective Optimization on the Basis of a Ratio Analysis plus the full MULTIplicative form) for multi-criteria decision-making were conducted in [
44]. A survey on COPRAS applications in 59 papers were presented in [
45]. It could be concluded that TOPSIS, PROMETHEE, EDAS, COPRAS and MOORA methods are frequently used in decision making.
There is no general consensus as to which MCDM method gives the best solution. Some authors used and compared different multi-criteria methods in their studies. The results by using different methods could be close, but potentially conflicting ranking could also be carried out. Other researchers have devoted their efforts to obtain an aggregated solution to unify the results of the different methods used. In [
46], the authors aimed to propose an approach to resolve disagreements among MCDM methods. They calculated the weight for each multi-criteria method used for decision making based on the Spearman’s correlation coefficient. The weights were normalized and the rankings were used as inputs to produce the secondary rankings. Five MCDM methods, including TOPSIS, ELECTRE III, GRA (Grey relational analysis), VIKOR, and PROMETHEE II were used with purpose to experiment the proposed classification technique. In [
47] the individual weights of the multi-criteria methods were determined based on optimization model. Four MCDM methods, including TOPSIS, VIKOR, PROMETHEE and WSM, were implemented to illustrate the proposed new approach. The experimental studies covered four public-domain multiclass datasets from four different applications. In [
48], an integration technique that includes an average rating method, Borda technique and Copeland’s method were used. Finally, the Poset method was applied to combine the results given by application of the mentioned techniques. Four MCDM methods including SAW (Simple Additive Weighting), TOPSIS, VIKOR and Linear assignment were applied. The integration technique was applied to evaluate Tehran’s 22 districts. A new approach for aggregative solution was proposed based on the half-quadratic theory, which were used to compute the final ranking [
49]. Three MCDM methods (TOPSIS, VIKOR and PROMETHEE) were applied to illustrate the proposed aggregative ranking method. The weights of the methods were determined using the minimizer functions based on the half-quadratic theory. The final aggregated ranking was performed in the form of the weighted sum of the MCDM rankings. The proposed framework was applied to evaluate ontology alignment systems. A rank classification algorithm was elaborated in [
50]. The authors used four MCDM methods: DEA (Data envelopment analysis), TOPSIS, ELECTRE and PROMETHEE. The authors proposed a consensus index and a trust level for the final aggregated ranking. The elaborated approach was applied to classify algorithms for software defect detection.
It could be concluded that the authors used different approaches to aggregate the results of application of different multi-criteria methods. The multi-criteria methods that apply different decision-making approaches were usually chosen. Most authors applied PROMETHEE and TOPSIS methods [
46,
47,
48,
49,
50] as a basis for aggregation. These methods use outranking and distance-based approaches, respectively. The aggregation formed on the utility-based multi-criteria methods was not presented. It could be summarized that the aggregation of multi-criteria methods permits the increase in the accuracy of the decision based on the advantages of different multi-criteria methods used.
It could be concluded that there are research gaps in the literature about the aggregation of multi-criteria methods. There is not enough research in this area. The principle by which to choose multi-criteria method for aggregation is not specified. The authors used different techniques to combine the rankings. In most cases, the aggregation is based on the determination for the weights of the methods.
In this study, based on the literature review, three multi-criteria approaches were studied: distance-based, utility-based and outranking approaches. The distance-based approach includes TOPSIS and EDAS methods the utility-based approach includes MOORA and COPRAS methods and the outranking approaches includes PROMETHEE method. All these methods were selected as they are among the most popular for making decisions. They were applied to ranking autonomous metro lines in European countries. These approaches were perceived as strategies and their scores as the benefits. So, the results of the application of multi-criteria approaches were used as an input to the Laplace’s criterion for decision making to determine the final ranking. The Hurwitz’s criterion for decision making was used to verify the results. So, a new aggregated system for decision making was formed. The results given by the new aggregative approach were verified by cluster analysis. The cluster analysis also permits the establishment of the groups of symmetric autonomous metro lines.
The differences between this study and other studies in related areas lies in the problem solving and decision-making approach. The novelty of this study and its main advantages are as follows:
The evaluation of the autonomous metro systems’ performance and determination of the groups of symmetrical autonomous lines in European countries;
The integration of the distance-based, utility-based and outranking multi-criteria approaches in an aggregative approach for decision making;
The combining an objective and subjective approach to determine the importance of the decision criteria.
3. Materials and Methods
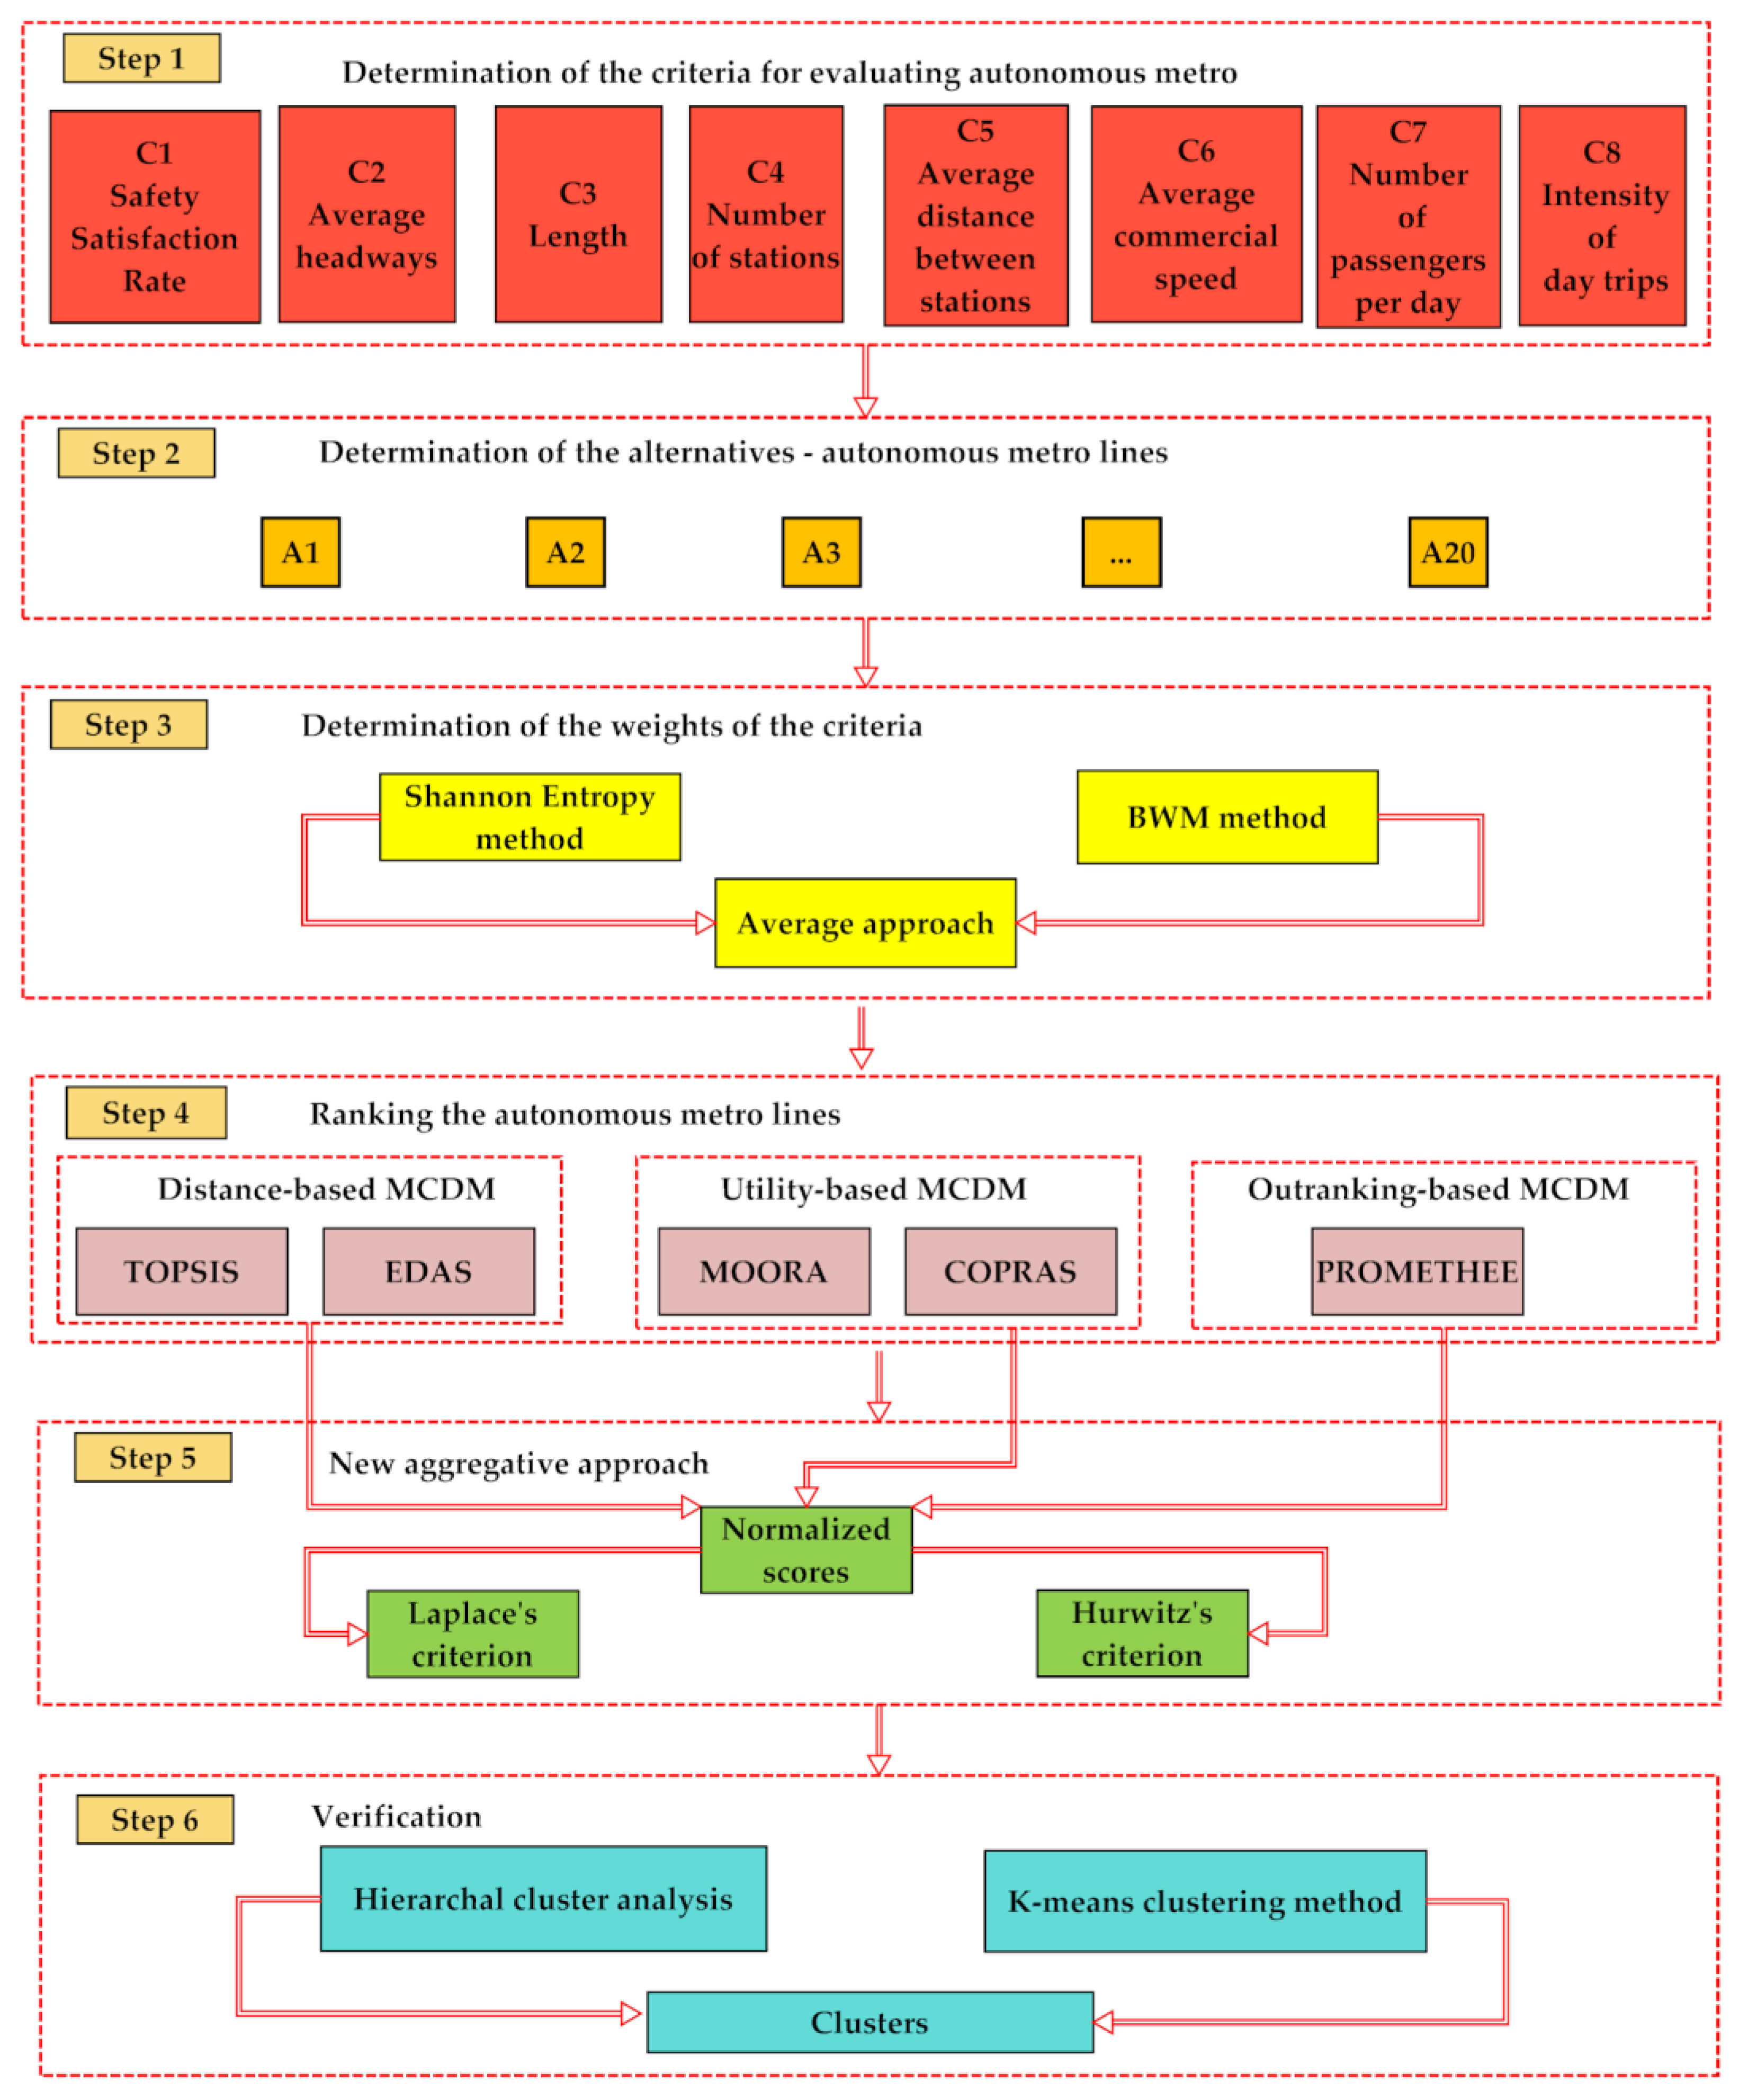
The methodology of the research includes the following steps:
Step 1: Determination of the criteria to assess the autonomous metro system;
Step 2: Determination of the alternatives–autonomous metro in European countries. Twenty autonomous metro systems were included in this research;
Step 3: Determination of the criteria weights. For this purpose, the following approaches were proposed: objective, subjective and combined approaches. The objective approach uses the Shannon Entropy method to calculate the criteria weights. This method is based on the information from the criteria data and does not apply expert judgment. The subjective approach uses the experts’ assessments by predetermined scale and the results are used to determine the weights. This study applies the BWM multi-criteria method for subjective approach. Its advantage is that the expert evaluations are applied in a linear optimization model for determining the weights. Both the Entropy method and BWM method were applied in a combined approach.
Step 4: Ranking the autonomous metro system by using multi-criteria methods. Three multi-criteria decision-making approaches for ranking the alternatives were studied: distance-based, utility-based and outranking approaches. The first approaches include TOPSIS and EDAS methods, the second approach uses MOORA and COPRAS methods, the third approach apply PROMETHEE methods. The results of criteria weights are applied in this step. The application of different ranking methods makes it possible to compare and verify the results. Spearman Rank correlation coefficient is applied to compare the ranking by different methods.
Step 5: Determination the final ranking based on the new aggregative approach. The ranking is carried out based on the three multi-criteria approaches taken together, based on a new aggregative technique proposed in this study, which applied the Laplace’s criterion and the Hurwitz’s criterion for decision making.
Step 6: Verification the results by applying cluster analysis. Two clustering approaches are investigated: hierarchical cluster analysis and K-means. The results were compared with ranking by using multi-criteria decision-making approaches.
Figure 1 represents the scheme of methodology.
3.1. Step 1: Determination the Criteria to Assess the Autonomous Metro System
In the first step, the criteria for assessment of the autonomous metro system were proposed. Based on the research presented in the literature review, it was found that the criteria: commercial speed, distance between stations, length, headway, passenger safety and daily ridership are important to assess metro lines [
3,
11,
12,
15,
16,
17]. Considering this, the following criteria were proposed:
C1–Safety Satisfaction Rate. The safety of a metro line depends on the surrounding environment. The values of this criterion are between 0 and 1 and were determined in [
3]. This criterion takes also into account the security of the transport.
C2–Average headways, min. This criterion indicates the level of the passenger’s service.
C3–Length of the autonomous metro lines, km. This criterion shows the level of infrastructure development of autonomous metro lines.
C4–Number of stations. This criterion shows the level of transport accessibility.
C5–Average distance between stations, km. This criterion is relevant to the commercial speed and the service of the deferent regions in the city.
C6–Average commercial speed, km/h. Commercial speed depends on the density of sections on a given line.
C7–Number of passengers per day, pass./day. It is a measure of transport efficiency.
C8–Intensity of day trips, pass./km. This indicator shows the number of passengers per day for a kilometer of the automated metro lines.
These criteria assess the safety, infrastructural and technological development of the autonomous metro system.
3.2. Step 2: Determination of the Alternatives
In this study, the full autonomous metro systems operating in France, Italy, Spain, Hungary, Denmark, Switzerland and Germany were examined. The alternatives include 20 fully automated metro train systems in 15 European cities, as follows: A1–Copenhagen, Line 1; A2–Copenhagen, Line 2; A3–Barcelona, Line 9; A4–Barcelona, Line 10; A5–Turin, M0; A6–Rome, Line C; A7–Milan, Line 5; A8–Brescia; A9–Paris, Line 1; A10–Paris, Line 14; A11- Rennes, Line A; A12–Toulouse, Line A; A13–Toulouse, Line B; A14–Lile, Line A; A15–Lile, Line B; A16–Lyon, Line D; A17- Nuremberg, Line U2; A18–Nuremberg, Line U3; A19–Budapest, Line 4; A20–Lausanne, Line M2.
3.3. Step 3: Determination of the Weights of the Criteria
First, the decision matrix was formed which contains the data of the criteria for the studied alternatives, is the number of criteria, is the number of alternatives.
Two different ways, as an objective and a subjective approach, were used to determine the weights of the criteria. The objective weighting is based on the Shannon Entropy method according to the information provided by the data. The BWM is applied as a subjective method. It uses the opinion of experts who know the research problem to calculate the weights of the criteria. Finally, the combined approach based on these two methods was applied to calculate the weights.
3.3.1. Shannon Entropy Method
This method uses information entropy for each criterion to determine the weights.
The information entropy is determined as follows [
51]:
where:
is the normalized values of decision matrix
,
number of alternatives,
is the number of criteria.
The normalized values
are calculated as follows:
The values of the parameter
are determined as follows:
The parameter
is used to determine the weights, as follows:
The following conditions are valid:
3.3.2. BWM Method
The methodology of BWM (Best Worst method) is based on a pairwise comparison of the decision criteria, [
23,
24]. The decision maker selects two criteria: the best criterion and the worst criterion. The best criterion is the most important according to the opinion of the decision maker. The worst criterion is the least important. The experts use a predefined scale of pairwise comparison, including the numbers from 1 to 9 to determine the preference of the best criterion over all the other criteria and the preference of each of the other criteria over the worst criterion. The scores are, as follows [
23,
24]: equally important (1); equal to moderately more important (2); moderately more important (3); moderately to strongly important (4); strongly more important (5); strongly to very strongly important (6); very strongly more important (7); very strongly to extremely more important (8); extremely more important (9). The score of 1 shows some importance. The value 9 presents the extreme importance.
Two vectors of pairwise comparisons are used as inputs for a linear optimization problem, which give the optimal solution for the weights of the criteria.
The Best-to-Others vector is as follows:
where
–preference of the best criterion
B over criterion
j. In this case,
=1.
The Others-to-Worst vector is as follow:
where
–preference of the criterion
j over the worst criterion
W. In this case,
=1.
The optimization minimax model is formulated to determine the weights. This mathematical model transfers it to linear optimization model as follows:
where:
is the consistency ratio.
The solution of this linear model is the optimal weights and optimal value . The value is the optimal consistency ratio of the system. Best consistency has the solution with value of closer to zero.
3.3.3. Weights of the Criteria
Both the Schanon Entropy method [
51] and BWM method [
23,
24] were applied in a combined approach. This approach permits the consideration of both information and expert assessment. Thus, it reduces the subjectivity in decision-making and permits to do a sensitivity analysis of results. A similar approach was used for an integrated procedure based on the CRITIC (CRiteria Importance Through Inter-criteria Correlation) and WASPAS methods in [
52]. So, the weights of the criteria are determined as follows, [
52]:
where:
are the weights of criteria,
is a parameter representing the weights of the utilized method.
3.4. Step 4: Ranking the Autonomous Metro System
In this step, according to the methodology, three multi-criteria decision-making approaches were applied for ranking the alternatives: distance based, utility-based and outranking approaches.
3.4.1. Distance Based Approach
The first approach includes two desistance based multi-criteria methods: TOPSIS and EDAS, [
26,
27,
28,
29].
The main concept of the Technique for Order of Preference by Similarity to Ideal Solution (TOPSIS) is that the best alternative should have the shortest geometric distance from the positive ideal solution and farthest geometric distance from the negative ideal solution [
26,
27,
28]. First, the normalized decision matrix
is determined.
The weighted normalized matrix
are calculated, as follows
where:
is the number of alternatives;
is the number of criteria,
is the weight of criterion
.
The ideal best and ideal worst value for each criterion are:
for non-benefits criteria; for benefits criteria
for non-benefits criteria; for benefits criteria
The ranking of the alternatives is based on the Performance Score
. This score presents the relative closeness of each alternative i with reference to negative ideal measure
as follow:
where:
is the Euclidean distance from the ideal best solution;
is the Euclidean distance from the ideal worst solution
The main concept of the EDAS method is that the best alternative should have the higher distance from the nadir solution and lowest distance from the ideal solution [
29]. First, the average solution
according to all criteria is calculated:
The positive
and the negative distance
from average matrices is determined, as follows:
The first Equations in (20) and (22) are for beneficial criteria, the second equations are for other criteria.
The weighted sum of positive
and negative
distance:
The ranking of the alternatives is based on the appraisal score
:
where:
,
are the normalization of the weighted sum of positive and negative distance respectively.
The best alternative based on the appraisal score has the highest assessment value.
3.4.2. Utility-Based Approach
The second approach uses MOORA and COPRAS methods [
32,
33].
The Multi-Objective Optimization on the Basis of Ratio Analysis (MOORA) method uses both beneficial and non-beneficial criteria for ranking the alternatives. This method is based on ratio system, [
33]. The ratio represented the normalized performances
of
-th alternative on
-th criterion.
The normalized performances in the case of maximation (for beneficial criteria) and in the case of minimization (for non-beneficial criteria) is calculated. The criteria weights could be accounted for by using Equation (14). The assessment criterion for ranking
based on the ratio system is determined as follows:
where:
is the number of criteria to be maximized, (
) is the number of criteria to be minimized.
The value can be positive or negative.
The ranking is according to the decreasing values of the assessment criterion. The optimal alternative based on the ratio system has the highest assessment value.
The COPRAS method is based on evaluating the influence of maximizing and minimizing criteria on ranking the alternatives. The best alternative is based on both the ideal and the anti-ideal solutions [
32]. First, the normalization of the decision matrix is performed, as follows:
The weighted normalized matrix is formed by multiplying the elements of the normalized matrix by the weight to the corresponding criterion.
The ranking is based on the relative weights of each alternative
.
where:
is the maximizing index;
is the minimizing index.
where:
k is the number of criteria which is to be maximized, (
) is the number of criteria to be minimized.
The ranking is according to the decreasing values of relative weights. The best alternative is based on the highest the relative weights.
3.4.3. Outranking Based Approach
The preference ranking organization method for enrichment evaluation (PROMETHEE) method is the outranking method in multi-criteria analysis [
36,
37]: the concept of this method is based on the outranking flows. They can be positives and negatives. The positive outranking flow
of alternative
expresses how much each alternative is outranking all the others. The negative outranking flow
of alternative
expresses how much each alternative is outranked by all the others. The value of the preference degree of all criteria for each pair of possible decisions is determined. The alternatives are ranked according to the net outranking flows
of alternative
, which are determined as a difference between
and
. The ranking is according to the decreasing values of net outranking flows.
The following condition is valid:
The type of the preference function is specified for each criterion by the decision maker. There are six types of preference functions: usual criterion, quasi-criterion, V-shape criterion, level criterion, linear criterion and Gaussian criterion.
3.4.4. Comparison of the Results
To determine the consistency of the results obtained by using the multi-criteria decision-making methods, the Spearman Rank correlation coefficient was proposed [
53].
where
is the Spearman Rank correlation coefficient;
is the distance between the ranks for each
,
data pairs of ranking methods, n is the number of elements in each data series (i.e., the number of studied autonomous metro systems).
The Spearman Rank correlation coefficient is appropriate to apply when the data need to be ranked. Therefore, this coefficient was used in this study. The value of Spearman Rank correlation coefficient is between −1 and 1, where the value of −1 indicate the stronger perfect relationship between two sets of rank, and the value of −1 shows a strong negative correlation between the methods; 0 is no correlation.
3.5. Step 5: Determination the Final Ranking Based on the New Aggregative Approach
The ranking was carried out based on the three multi-criteria approaches which include five MCDM methods taken together, based on a new aggregative technique proposed in this study, which applied the Laplace’s criterion
and the Hurwitz’s criterion
for decision making. These criteria serve to choose one strategy over others, when facing a decision under uncertainty [
53].
The Laplace criterion considered all conditions as equally likely [
53]. The best alternative is the one with the maximum average payoff. The Hurwitz’s criterion uses the maximum and the minimum value of the payoff of the alternatives, and also a coefficient to compute the value for each alternative [
53]. The alternative with the highest value of criterion is the best.
The new approach elaborated on in this study considers the estimates obtained by the different methods as benefits of the different conditions for the individual alternatives.
Thus, a payoff matrix
(
is the number of alternatives;
is the number of multi-criteria decision-making methods used) is formed, in which the columns are the scores obtained by the applied multi-criteria methods, and the rows are the investigated autonomous metro system. So, to use the scores, they must be normalized. A normalized payoff matrix
is formed by applying the average sum method. The elements of normalized payoff matrix
are calculated as follows:
The Laplace criterion in point view the new aggregated approach is determined, as follows:
where:
is the number of multi-criteria decision-making methods used;
are normalized values of the scores calculated by different methods.
With the purpose to perform normalization of the scores obtained by multi-criteria methods, it is necessary that their values be positive. Therefore, for methods such as PROMETHEE in which there are positive and negative values of the net outranking flows, transformation is carried out, as follows:
where:
are the corrected values of the net outranking flows;
is correction parameter.
The value of the correction parameter is determined according to the maximum absolute value of net outranking flows and is the larger integer.
For example, if the minimum negative value of net outranking flows is , , then according to Equation (36), . If the minimum negative value of net outranking flows is then .
The normalization is conducted by using these corrected values.
The best alternative is determined based on the maximum value of Laplace’s criterion, as the normalized values are considered as benefits. The ranking is in descending order of the criterion.
The Hurwitz’s criterion in the point of view the new aggregated approach is determined, as follows:
where
is coefficient enabling to make a decision in the different situations. The value of
is between 0 and 1. Generally,
.
The alternative of having a maximum value of Hurwitz’s criterion was selected as the best. The ranking is in descending order of the criterion. The results determined by Hurwitz’s criterion verify these calculated by using Laplace’s criterion.
3.6. Step 6: Verification the Results by Applying Cluster Analysis
The fifth step of the methodology includes a validation of results of multi-criteria decision-making approaches by applying the multi-measurable statistical method cluster analysis. The cluster analysis method permits a classification to be made on the examined alternatives into groups called clusters, [
54,
55]. In this study, two approaches of cluster analysis have been investigated: hierarchal cluster analysis and K-means clustering method. These approaches allow for the results to be verified. The hierarchal cluster analysis represents the clusters and the distance between them in the form of a dendrogram. The average linkage within groups method is preferred as an agglomerative method to define the clusters. The average of the distances between all observations of pairs of clusters is minimized by using this method. The Euclidean distance and Squared Euclidean distance as a metric for distance, are proposed as these are the most commonly used distances between two points. The K-means cluster analysis is a non-hierarchical method. The number of clusters is specified in advance based of the results received by the hierarchal cluster analysis. The K-means cluster analysis was applied to verify the results obtained by hierarchal cluster analysis. Both clustering methods verify the results of the ranking autonomous metro systems with the application of multi-criteria analysis.
4. Results and Discussion
This research was conducted under the following limitations:
The average number of daily journeys was taken into account in this study;
The changes in peak periods, as well as daily and monthly irregularity of trips, were not taken into account;
The fully autonomous metro lines between airport terminals were not considered;
The planned extensions of the existing autonomous lines were not taken into account;
The manufacturer of the rolling stock and the type of the rolling stock according to the wheel are not taken into account;
The type of signalling is not taken into account.
4.1. Determination of the Weights of Criteria
The methodology is used for ranking 20 autonomous metro system in Europe.
Table 1 represents the initial decision matrix with the values of criteria for the investigated metros. The data were collected from [
3]. The last row of this table shows the type of optimization for the criteria–minimization or maximization.
The level of security depends on the surrounding environment. Line 1 and Line 2 in Copenhagen have the highest level of security. The autonomous metro lines in Paris, Barcelona and Toulouse have the lowest level of security. The safety performance of a metro line depends on the safety of the city and the regions. The length of the line and the number of stations determine the average distance between stations. Barcelona has the longest network of autonomous metro lines. It could be seen according to the data represented in
Table 1 that the driverless metro lines have a short distance between stations. This is due to the smaller surface areas. Line M2 in Lausanne is characterized with the least distance between stations. The average commercial speed is different for the investigated metro lines. Some lines operated at low commercial speed such as Turin and Lausanne. The commercial speed is inversely proportional to the density of the stations.
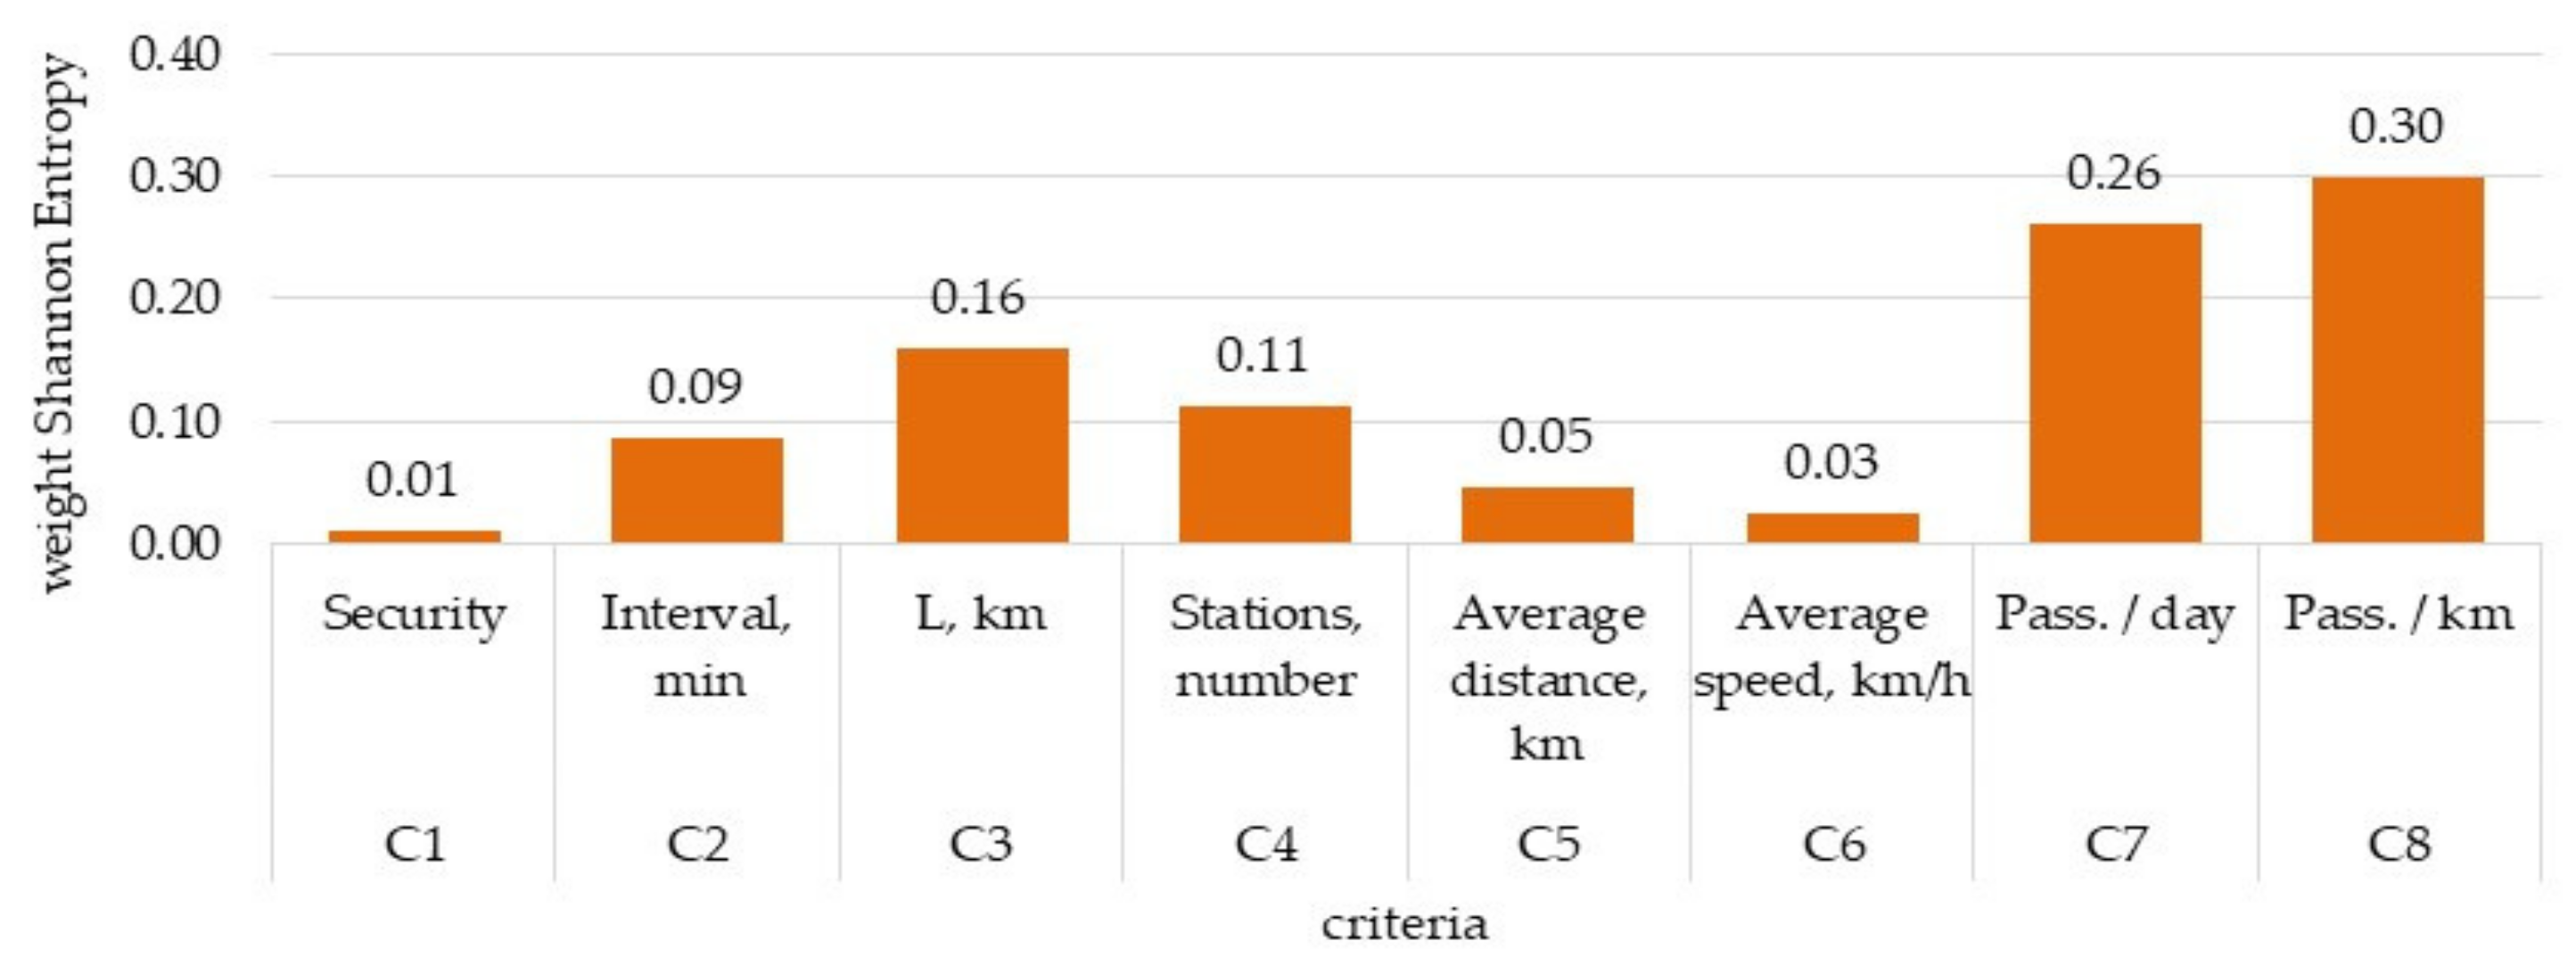
Table 2 shows the results of the Shannon Entropy method.
Figure 2 illustrates the values of the weights. It can be seen that the intensity of day trips (C8) and the number of passengers per day (C7) have the greatest impact on the investigated systems. The criteria security (C1), average distance (C5) and average speed (C6) have a small influence.
The group of eight experts who are specialists in academia (three experts) and specialists in railway transport administration (five experts) with long experience, gave an overall rating using the scale of the BWM method. The criterion intensity of day trips (C8) was determined by experts as the best and the criterion average distance (C5), respectively, as the worst.
Table 3 represents the pairwise comparison vectors for the best criterion, and for the worst criterion. The optimal solution of the linear optimization model given by Equations (9)–(13) were solved by Solver (MS Excel). The value of the consistency
is closed to zero, which indicates a high degree of consistency.
Figure 3 illustrates the weights of criteria given by the BWM method. It can be seen that the intensity of day trips (C8) and the number of passengers per day (C7) have the greatest impact on the investigated systems. The results shows that the criterion security (C1) also has a great influence on the efficiency of autonomous metro systems. The results according to the criteria with the great impact are similar to these calculated by the Shannon Entropy method. The criterion length of the autonomous metro lines has the least influence.
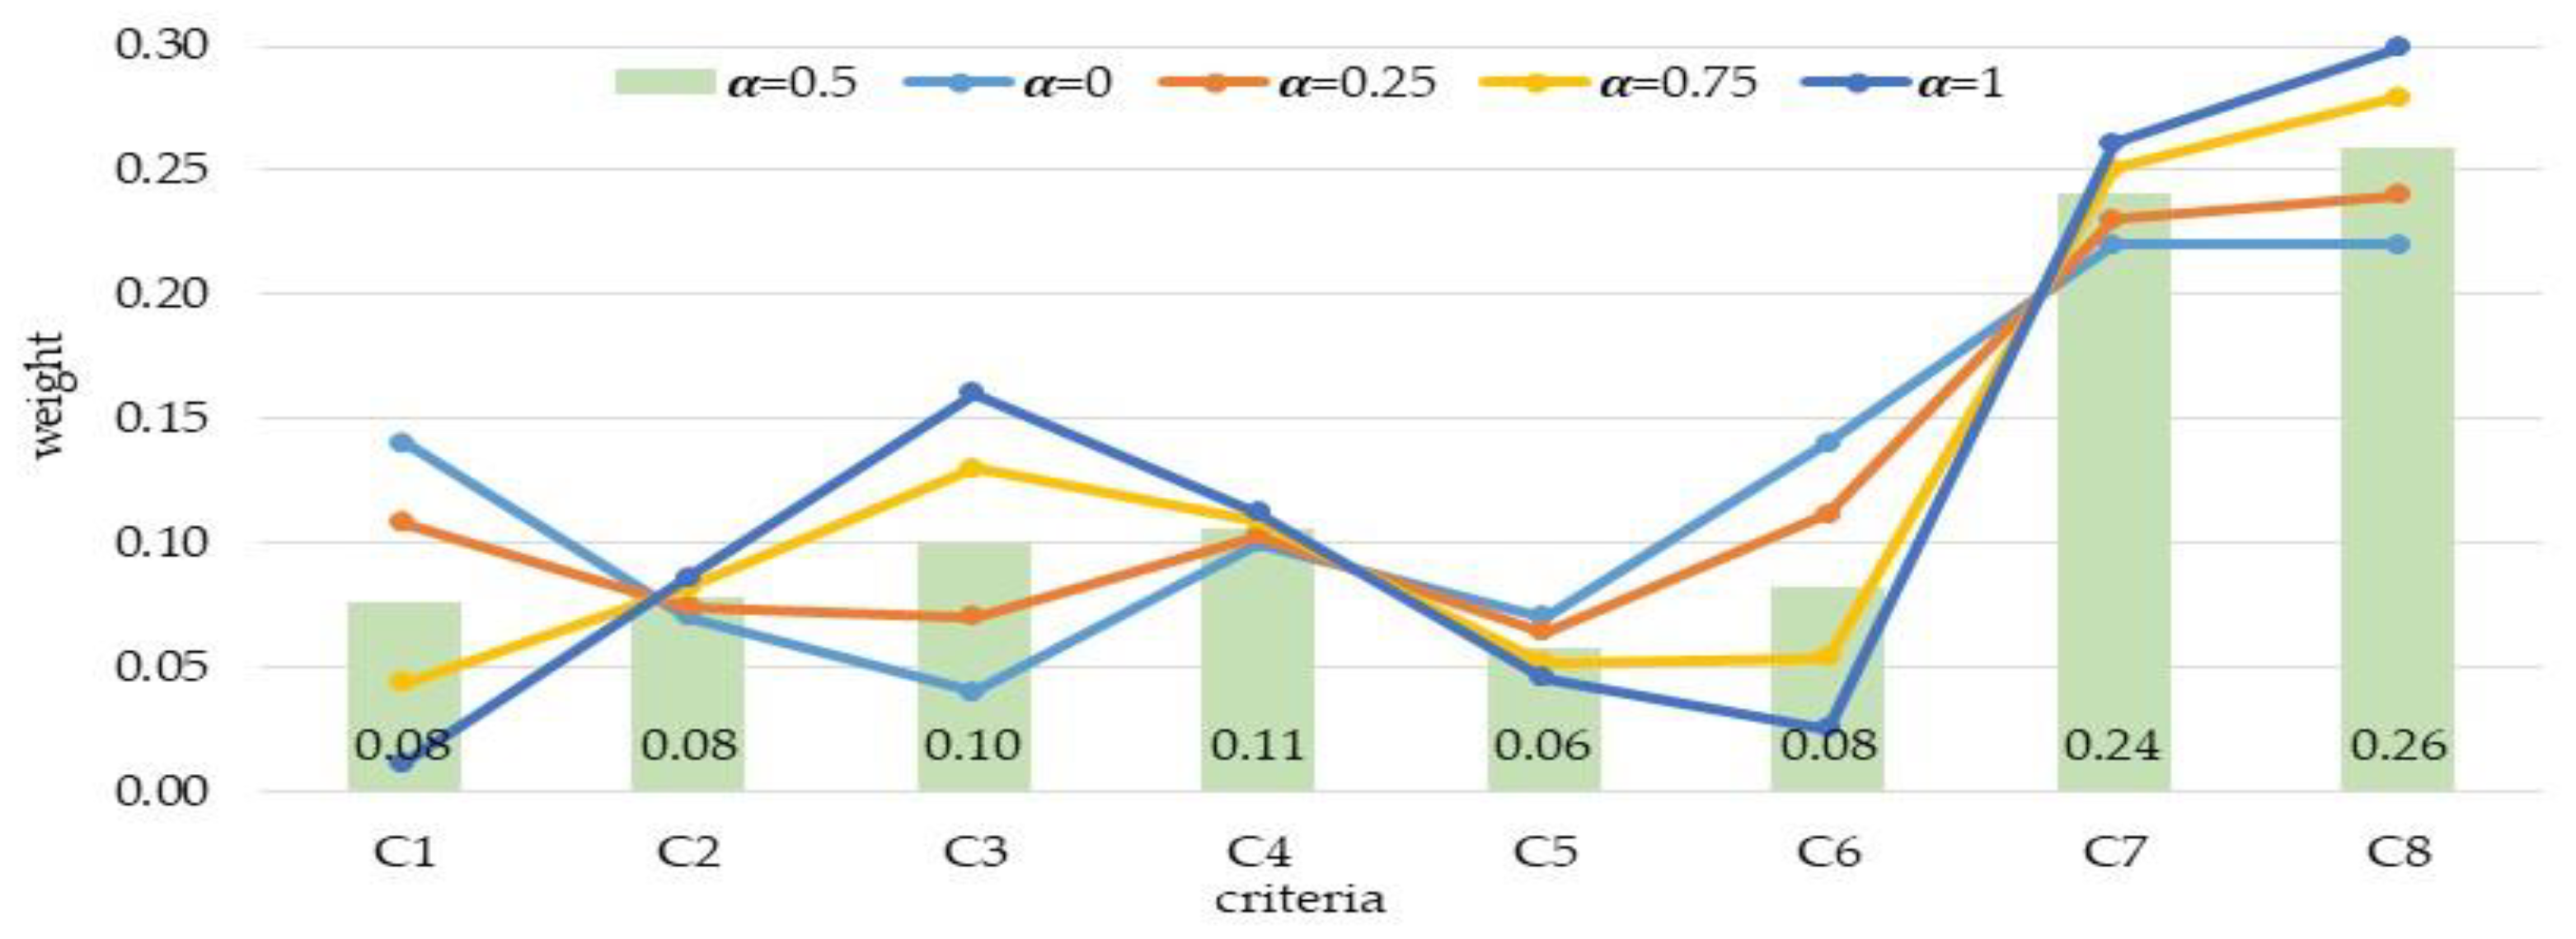
The final weights of criteria were determined by Equation (14). The influence of the chance of the parameter α on both Shannon Entropy and BWM method was examined.
Figure 4 shows a comparison of the weights according to the variation in the parameter α. Value α = 0 means the results of the BWM method; value α = 1 means the results of the Shannon Entropy method. The average value of both methods indicates α = 0.5 and it is illustrated in
Figure 4 by columns. It can be seen that the criteria security (C1), length of the autonomous metro lines (C3), average speed (C6) and intensity of day trips (C8) have a large variation depending on the parameter α. The variation in the criteria interval between trains (C2) and number of stations (C4) is small. This is due to the fact that by both methods, their values are close. The greatest impact according to the average method is found to be the criteria and intensity of day trips (C8) and average number of passengers per day (C7).
4.2. Ranking the Autonomous Metro System
In this step, according to the methodology, three multi-criteria approaches were applied for ranking the autonomous metro systems. The ranking of autonomous metro for each of the multi-criteria approaches is performed according to the weights given by Shannon entropy method, BWM method and average weights by both methods.
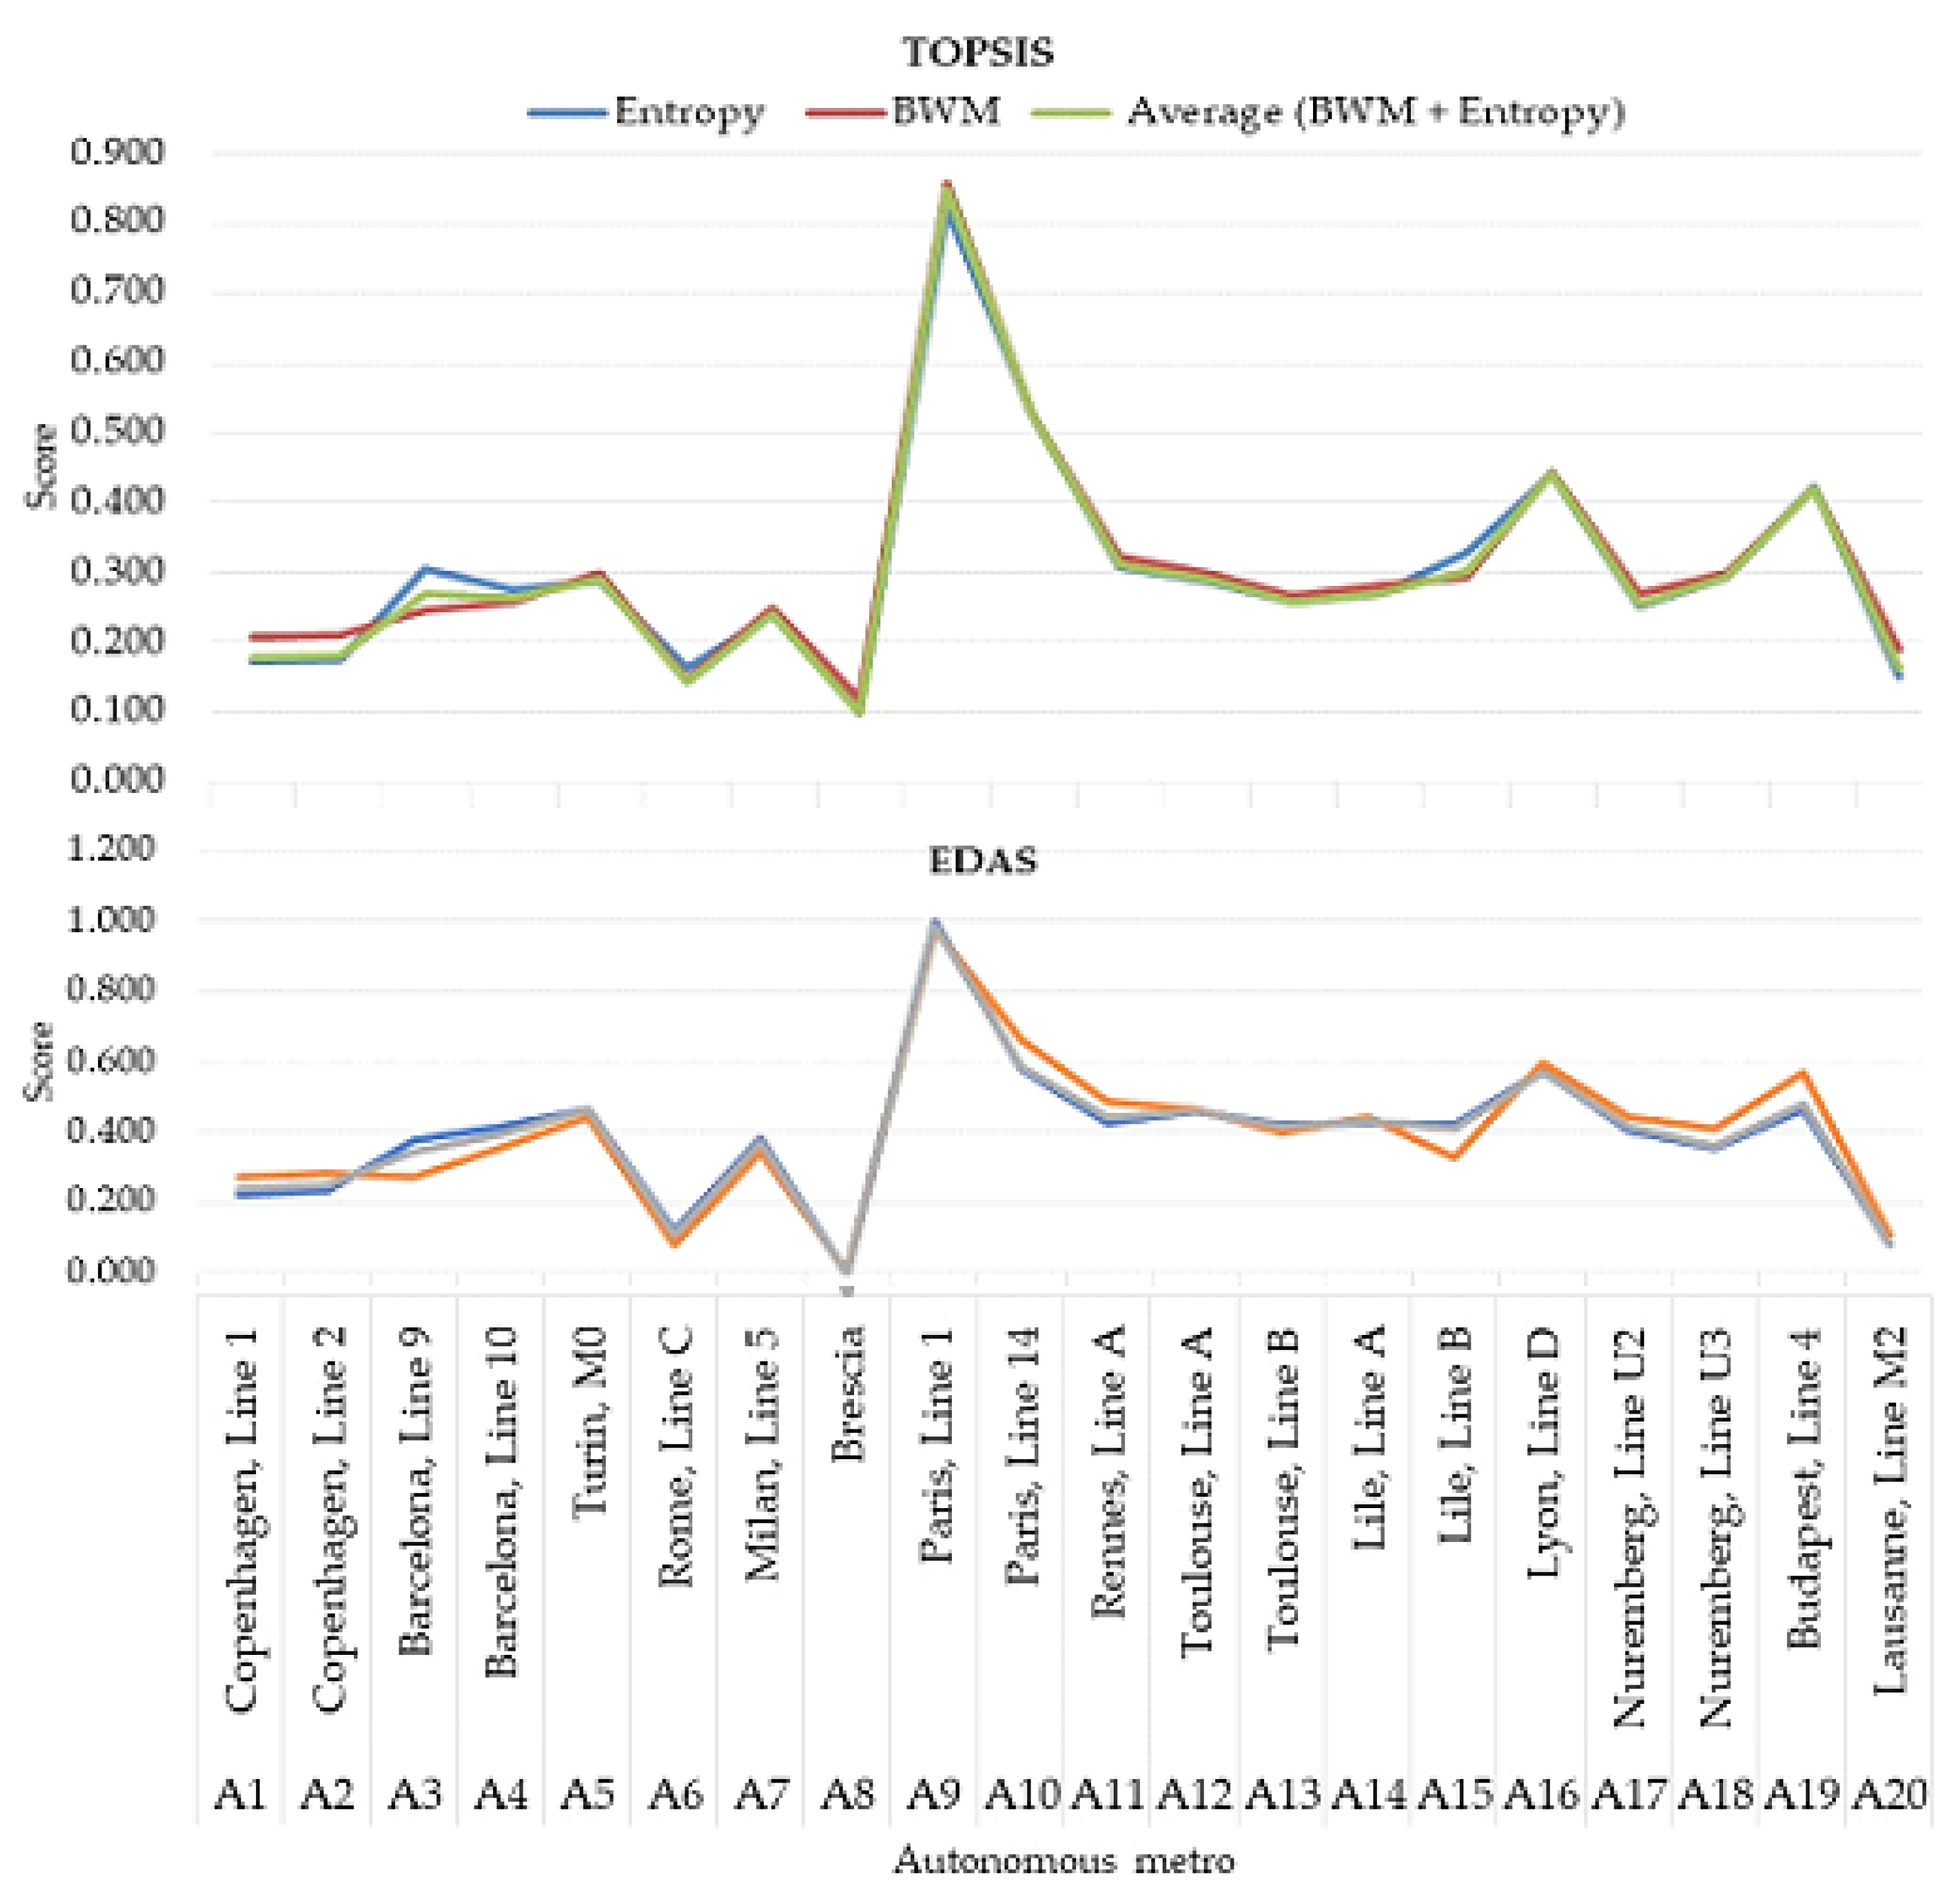
Figure 5 illustrates the results of ranking by TOPSIS and EDAS methods.
Table A1 in
Appendix A represents the results by TOPSIS method. It can be seen that the ranking determined by different weighting approach is similar. The first position is for Line 1 of the Paris autonomous metro system, and the second one is for Line 14, also in the Paris autonomous metro system. Line D in the Lion metro is in the third position. There is a significant difference between the position of Line 1 in Paris, and the other alternatives.
Table A2 in the
Appendix A shows the results of the EDAS method. In can be seen that the results are similar to those calculated by using the TOPSIS method. This is due to the fact that both methods use distance as a measure to rank the alternatives. The ranking by using different weighting approaches is almost the same.
Table A3 in the
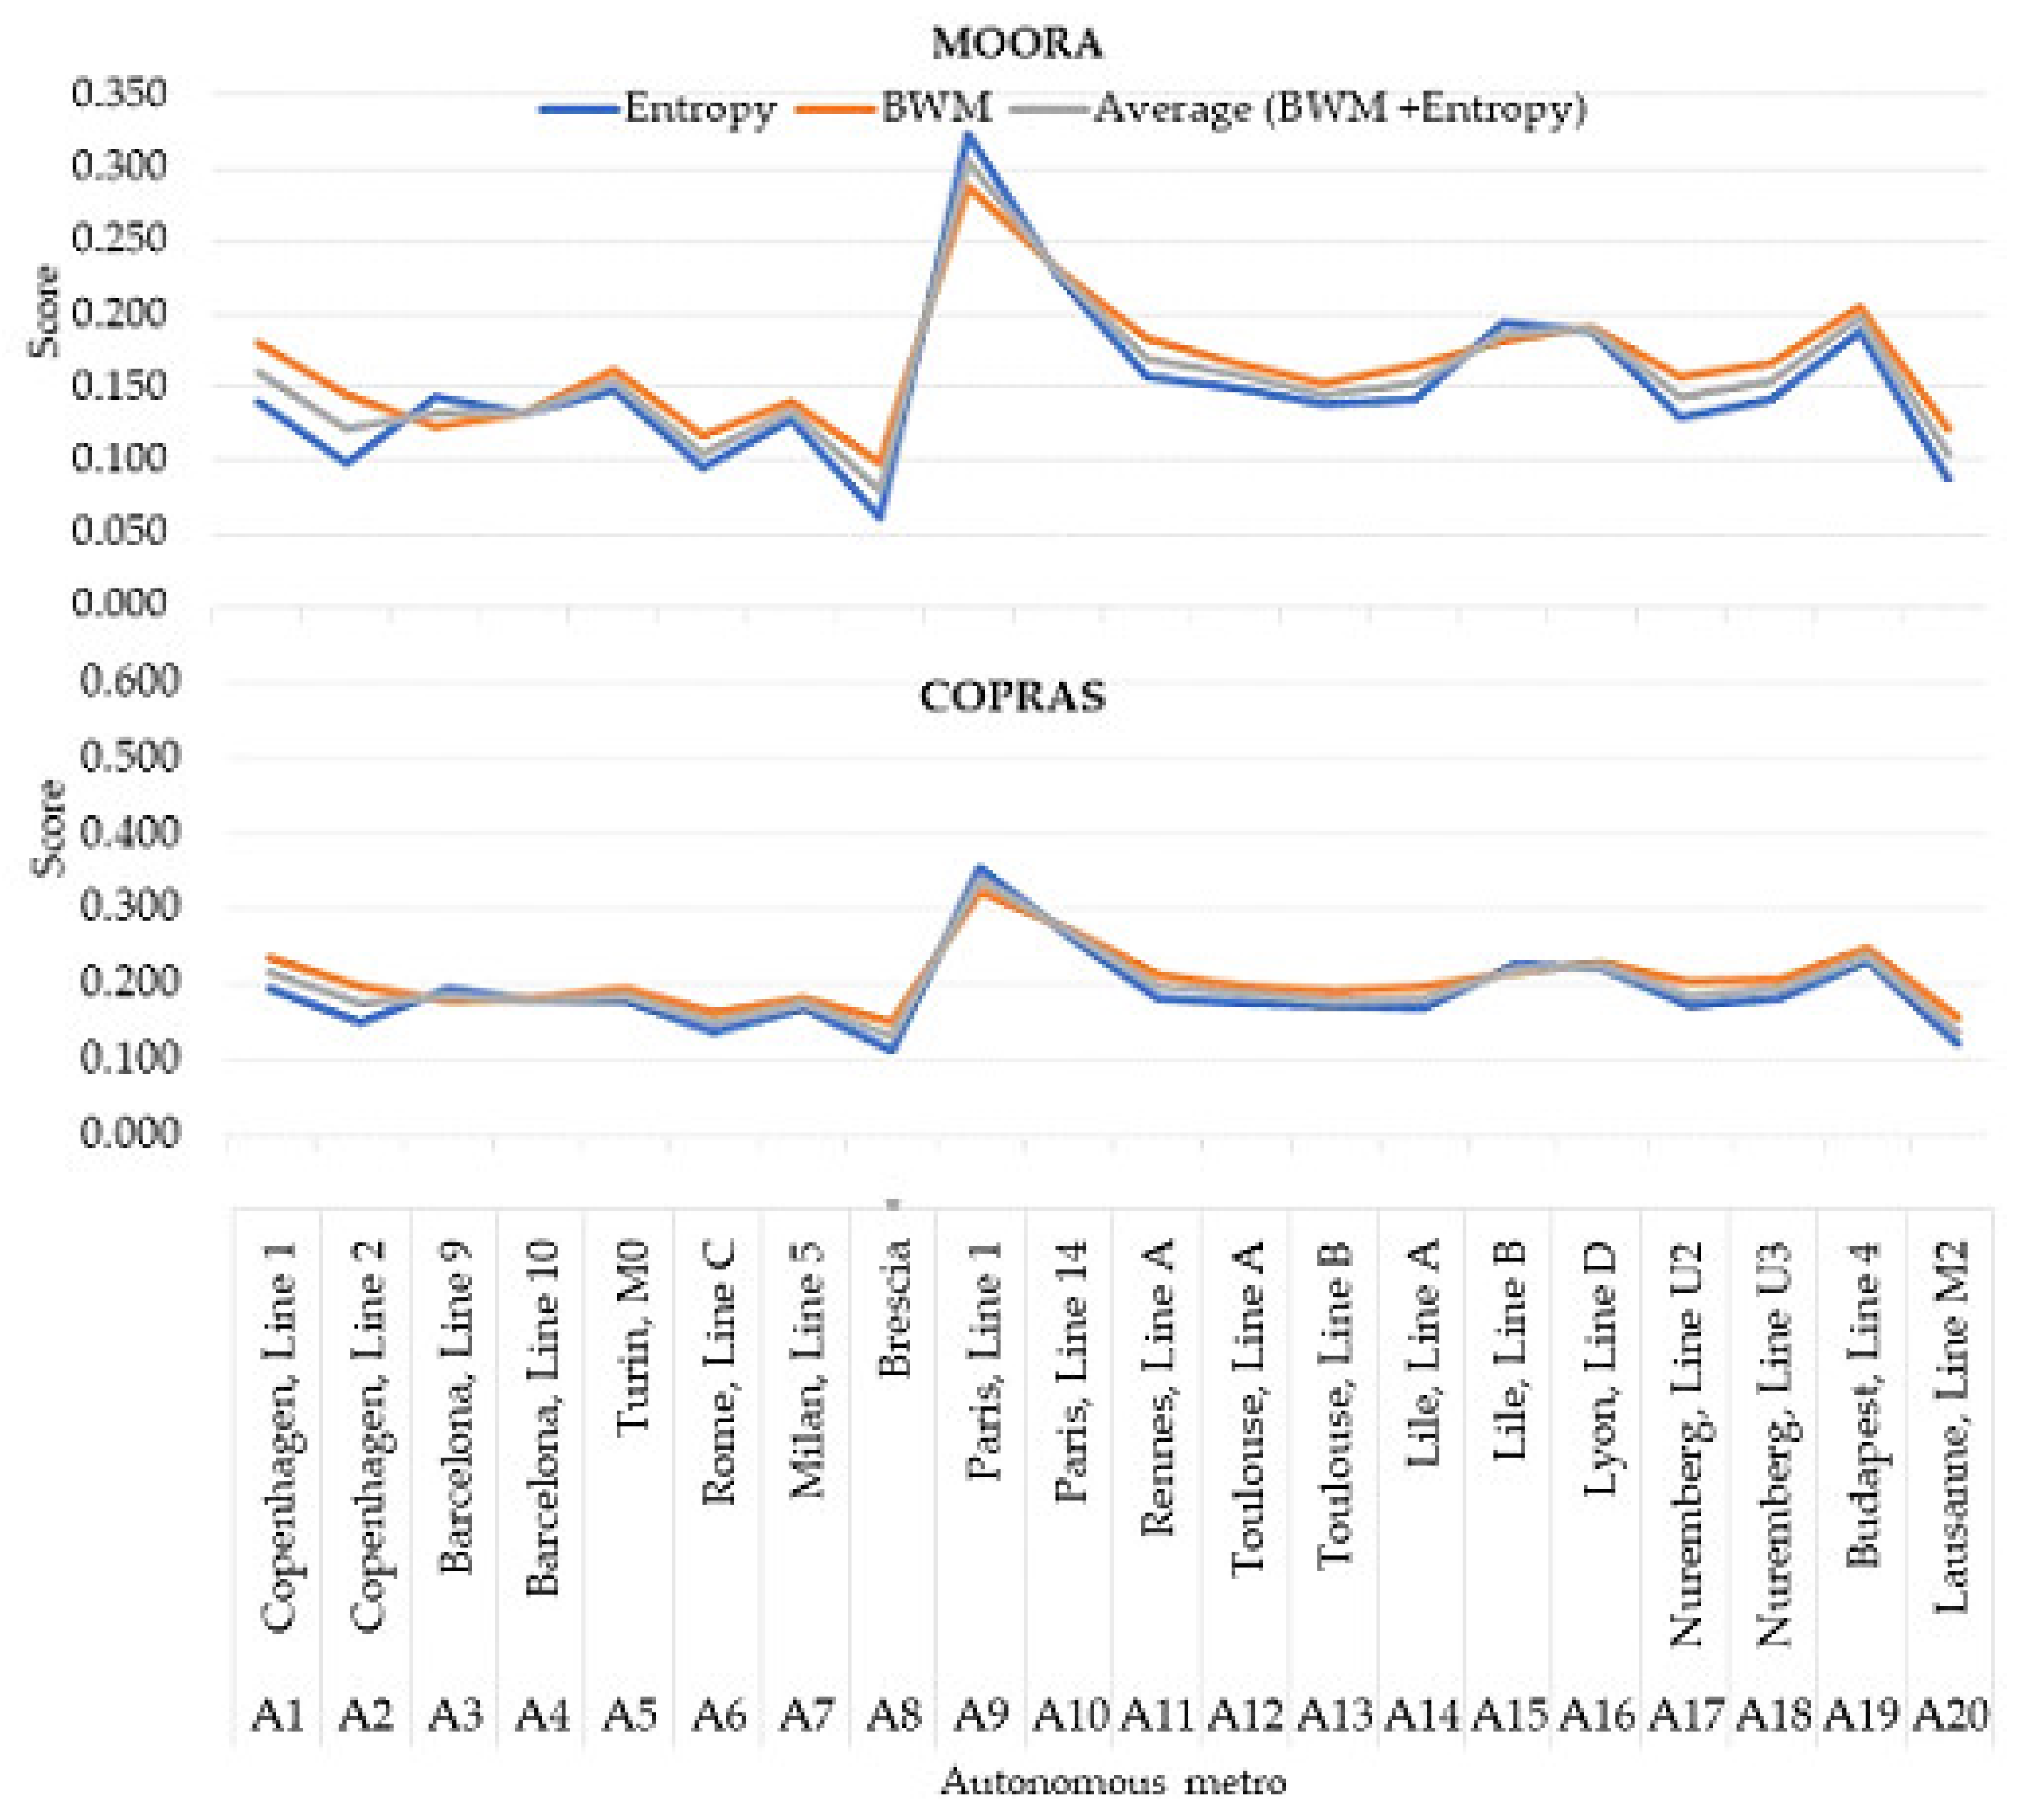
Appendix A shows the results by using the MOORA method. The best alternative is again Line 1 of the Paris autonomous metro system, Line 14 is in the second position. There are some differences for the third position. Line 4 in Budapest is ranked third according to the BWM method and the average weighting approaches. There are some differences in the ranking between the weighting approaches used.
Table A4 in
Appendix A represents the results by applying the COPRAS method. It can be seen that the best alternative according to the COPRAS method is again Line 1 in the Paris metro; Line 14 in the Paris metro is in the second position; the third position is for Line D in Lion. It can be seen that there are similar results according to the weighting approaches used.
Figure 6 illustrates the results of ranking by both MOORA and COPRAS methods. There is a big distance between the first and second position in ranking. The distance between the other positions in ranking are small. The results show that the ranking by utility approach is close to those performed by using a distance-based approach.
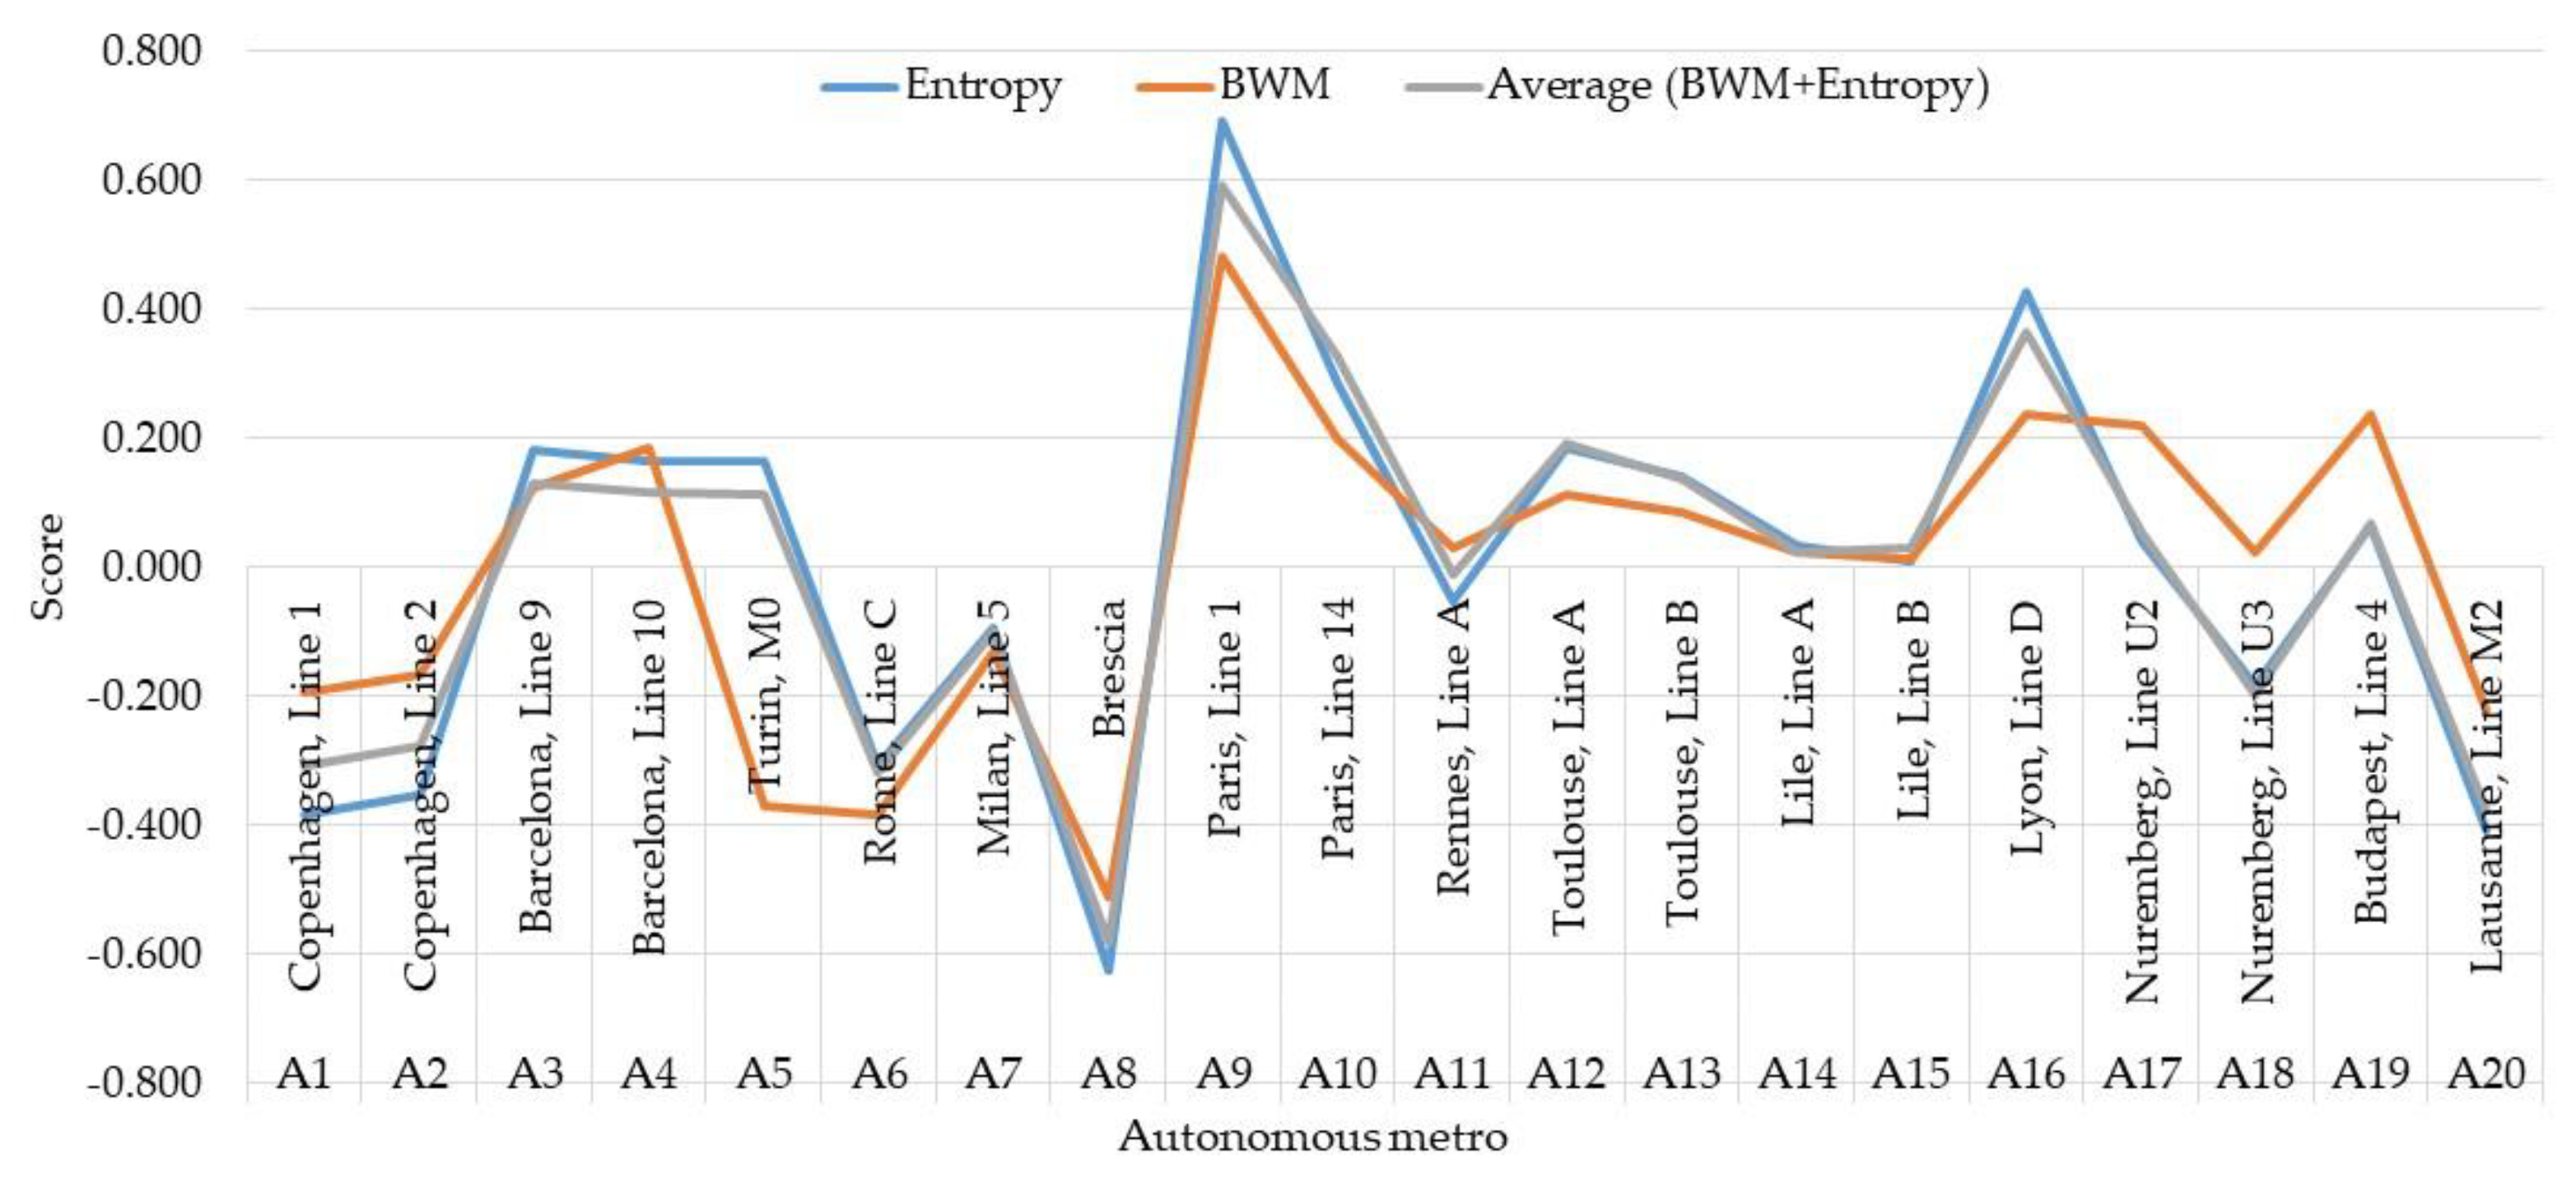
Table A5 in
Appendix A and
Figure 7 presents the results of net outranking flows by PROMETHEE method. The linear type of the preference function is set for each of the criteria. The results show that the best autonomous metro is Line 1 in Paris. The second and the third positions are for Line 14 in Paris and Line D in Lion. The results given by different weighting approaches are close. There is displacement between second and third place according to the results obtained by distance-based and utility-based multi-criteria methods. The first position of Line 1 in Paris is clearly expressed.
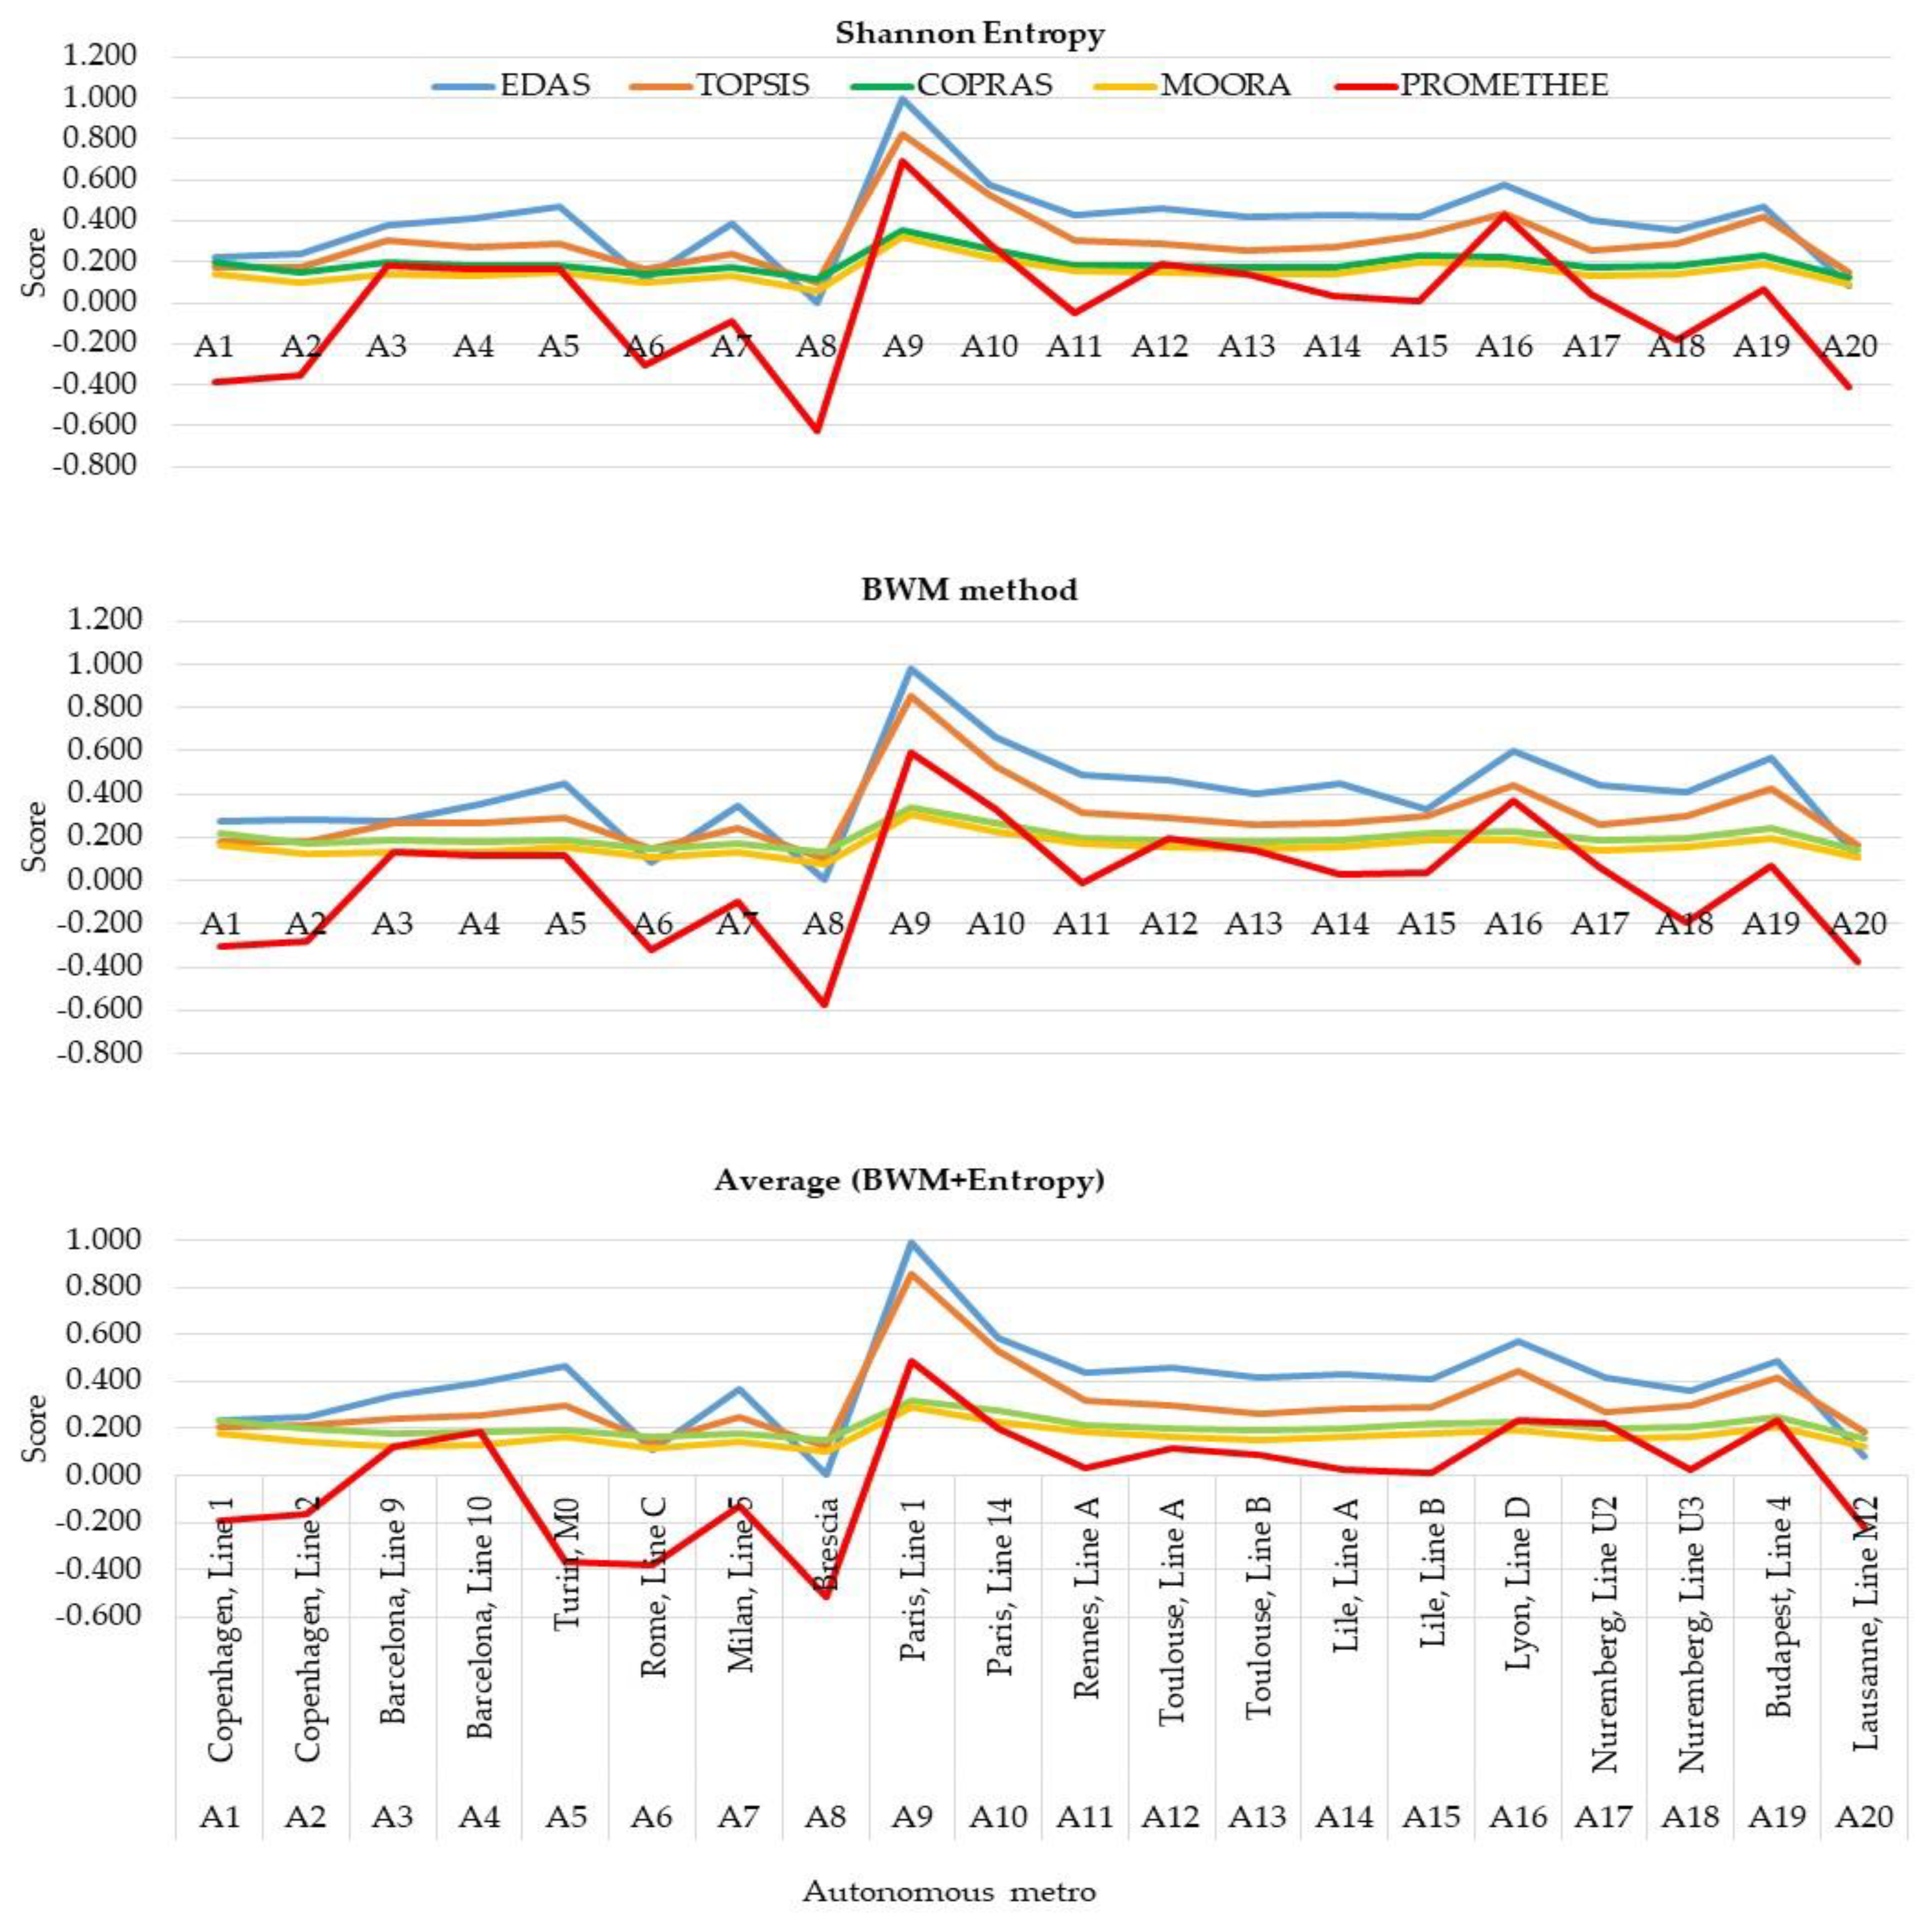
Figure 8 illustrates the comparison of the ranking given by different multi-criteria methods and different weighting approaches.
It can be seen that Line 1, Line 14 in Paris and Line D in Lion are the best autonomous metro systems for all variants of ranking. These autonomous metro systems differ significantly from other systems. The weighting by BWM method and ranking by PROMETHEE method place Line 14 in Paris in second position, while by both Shannon Entropy and average methods, the second position is for Line D in Lion. At the bottom of the ranking are Brescia and Line M2 in Lausanne. These positions are similar according to all multi-criteria approaches. These autonomous metro lines have the smallest intensity of day trips as it can be seen according to the data given in
Table 1. It can be summarized that the results by applying Shannon Entropy method, BWM and average approach are similar. This is due to the fact that the criteria number of passengers per day (C7) and intensity of day trips (C8) have the greatest influence on the ranking.
The multi-criteria methods applied in this research were compared by using Spearman correlation coefficient. This technique was applied to the results obtained using the weights of the average approach when both Shannon Entropy and BWM method were considered.
Table 4 represents the results for Spearman correlation coefficient. It can be concluded that there is a strong correlation between the results by different methods. The ranking obtained by EDAS and TOPSIS methods are almost the closest,
rs = 0.83. The same applies to the results of the ranking obtained by the methods COPRAS and EDAS,
rs = 0.91. This is due to the fact that the respective methods apply the same approach, EDAS and TOPSIS methods are distance-based and the COPRAS and MOORA are utility-based. The ranking given by the PROMETHEE method is closest to that obtained through the EDAS method
= 0.85.
4.3. Ranking by the New Aggregative Approach
The final ranking of the autonomous metro systems is performed by applying the new aggregative approach. For this purpose, the results of scores by the different multi-criteria methods used were applied. The average approach of weighting was applied (
Table A1,
Table A2,
Table A3,
Table A4 and
Table A5 in
Appendix A).
The new aggregative approach considers the estimates obtained by the different multi-criteria methods as the benefits of different strategies. Thus, the different autonomous metro lines could be ranked considering the benefits of different strategies.
First, the score of each alternative is determined by applying each of the investigated multi-criteria method (EDAS, TOPSIS, MOORA, COPRAS and PROMETHEE) based on average approach of weighting using Equation (14). These are the results in the column before the last of each of the
Table A1,
Table A2,
Table A3,
Table A4 and
Table A5 in
Appendix A.
Thus, a payoff matrix is formed, in which the columns are the scores obtained by the applied multi-criteria methods, and the rows are the investigated autonomous metro system.
Table 5 represents the payoff matrix. The last column of
Table 5 shows the transformed values of net outranking flows according to Equation (35). The minimum negative value of net outranking flows is
,
. So, according to Equation (36),
.
The first part of
Table 6 shows the normalized payoff matrix which consists of the normalized values of the scores; the second part presents the results for the Laplace’s criterion and Hurwitz’s criterion is determined by applying Equations (34) and (37).
It can be seen that the ranking by both criteria is almost the same. Line 1 in Paris was placed in the first position, Line 14 in Paris was ranked in the second position and Line D in Lion is in third place. These are also the metro lines with the highest average number of passengers per day. Brescia and Line M2 in Lausanne were placed at the end of the ranking. These are also the metro lines with the lowest average number of passengers per day. The results by Laplace’s criterion and Hurwitz’s criterion are similar. There is some difference after the seventh position.
Table 7 represents the values of Spearman correlation coefficient by using the ranking by both criteria and results of the positions by applying the multi-criteria methods. The Spearman correlation coefficient between both ranking by using Laplace’s criterion and Hurwitz’s criterion is 0.99, which indicate that the results are the same. It could be seen that the ranking obtained by new aggregative approach is closest to that obtained by EDAS method (
rs = 0.96)
4.4. Sensitivity Analysis
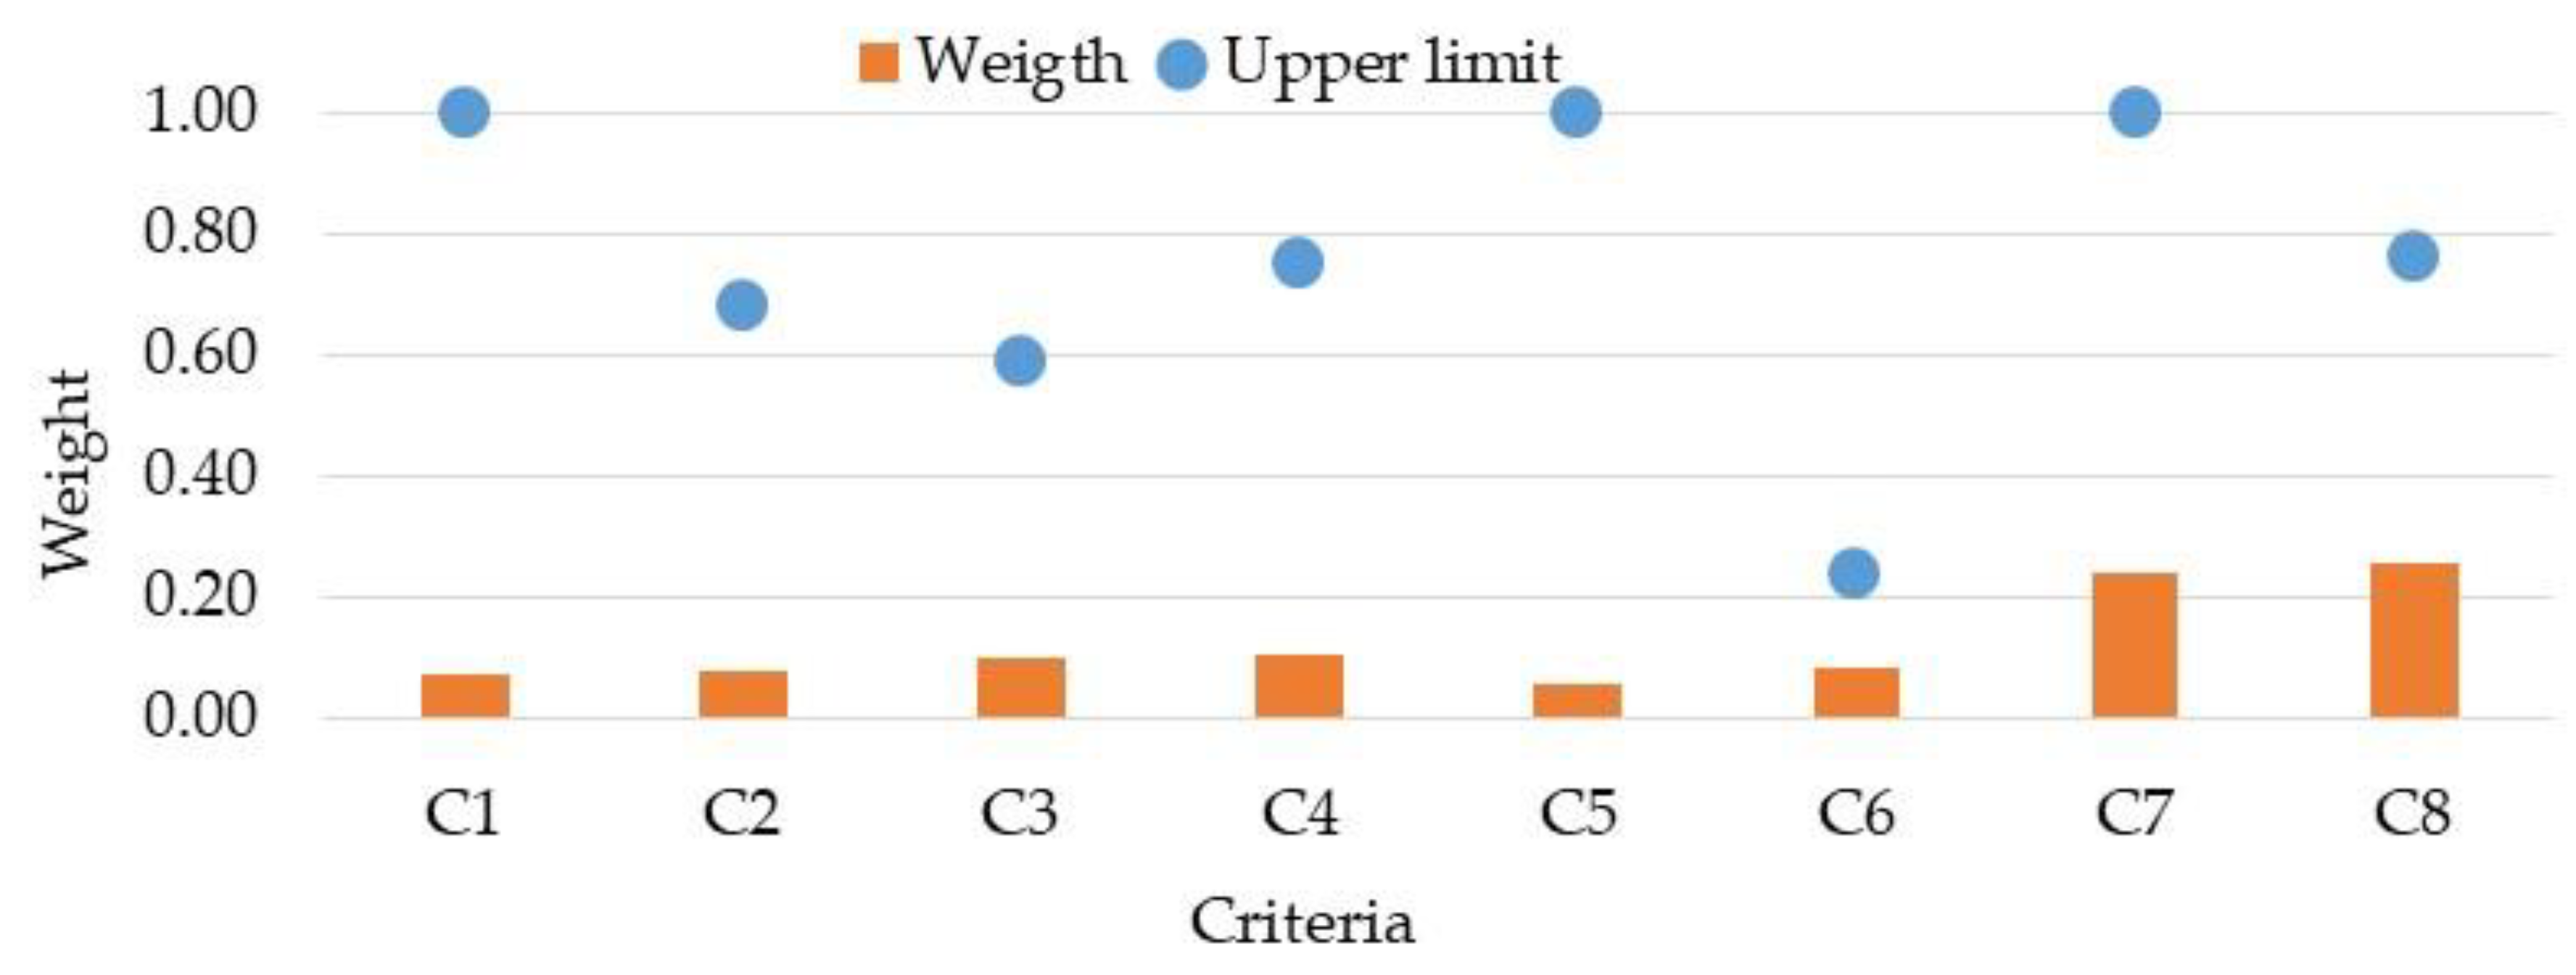
The sensitivity analysis according to the variation in the values of criteria was performed. For this purpose, the weights determined by using average approach (BWM and Shannon Entropy method) and ranking by using the aggregative approach were examined. The limits of variation in the weights of the criteria at which the ranking is preserved were defined.
Figure 9 represents the weights and their upper limits. The lower limit for all criteria is 0. The criteria safety satisfaction rate (C1), average distance between stations (C5), number of passengers per day (C7) and intensity of day trips (C8) have wide ranges of variation. The criterion average commercial speed (C6) has small limits of variation. The criteria average headways (C2), length of the autonomous metro lines (C3, number of stations (C4) and intensity of day trips (C8) have an average limit of variation.
4.5. Verification the Results by Applying Cluster Analysis
The hierarchal cluster analysis and K-means clustering method were used to verify the results obtained by different approaches of multi-criteria analysis.
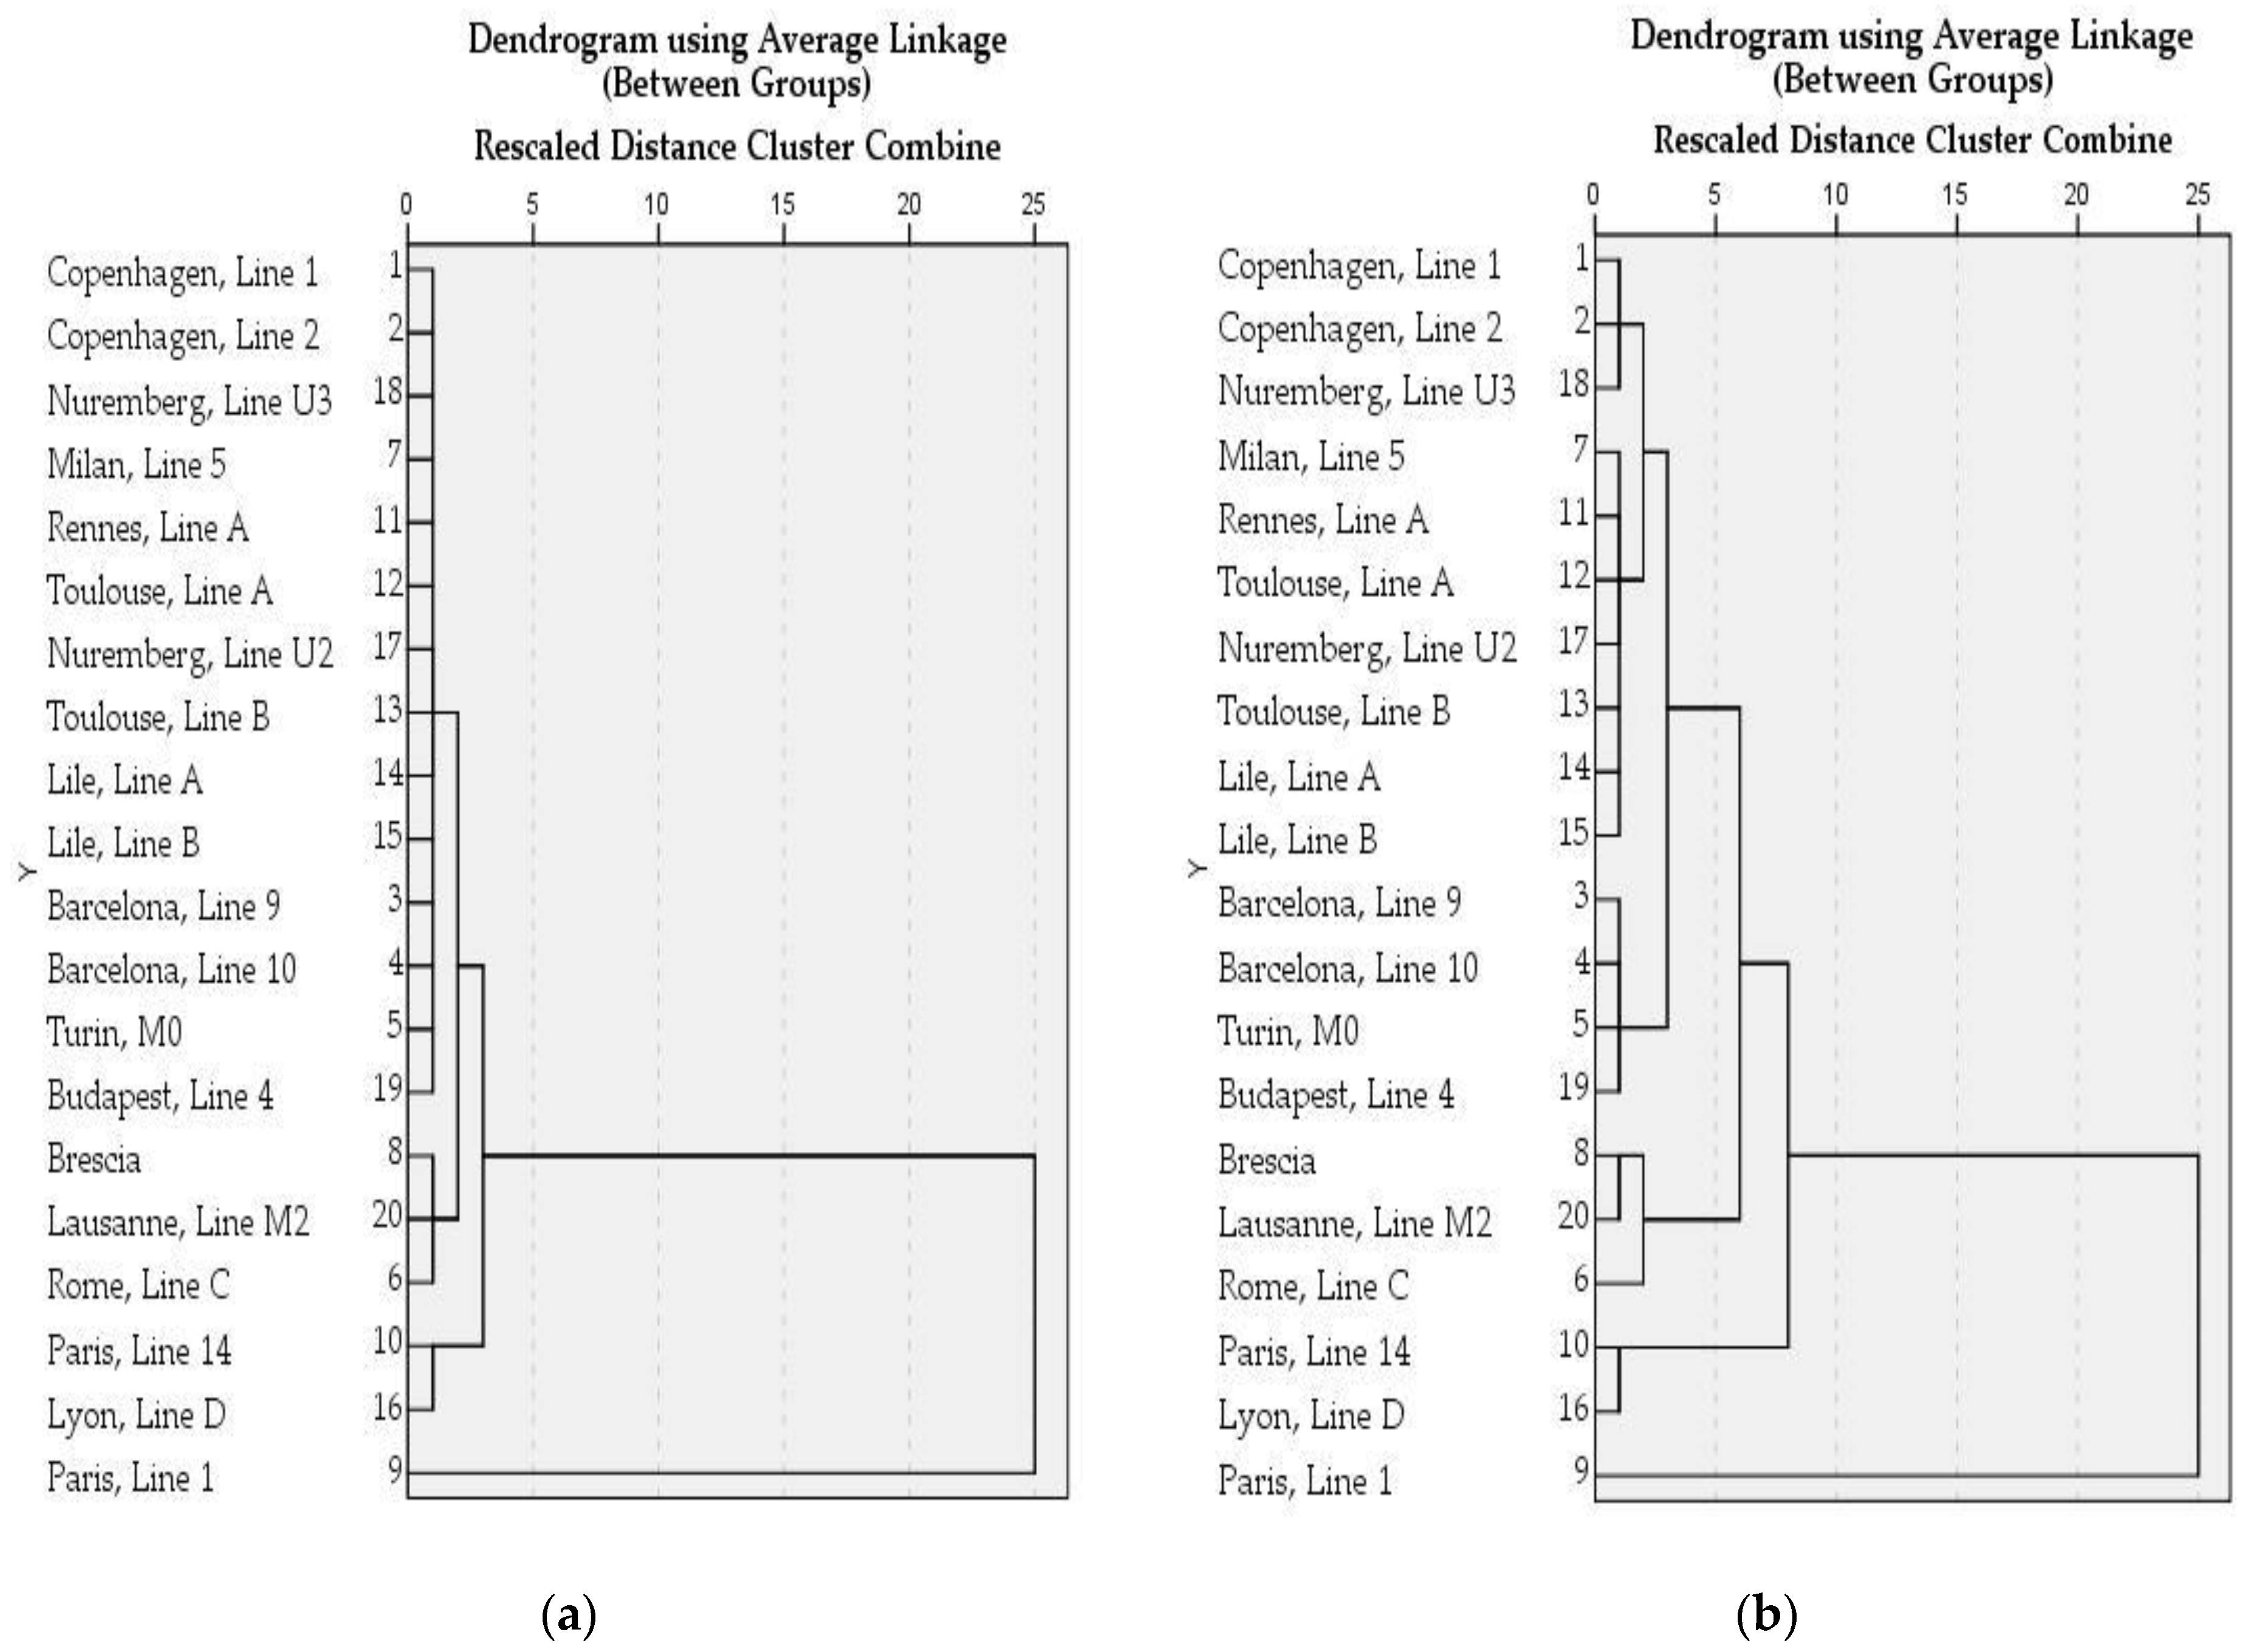
Figure 10 illustrates a dendrogram according to the hierarchal cluster analysis and average linkage between groups by both Squared Euclidean distance and Euclidean distance as measure of distance.
It could be seen according to the results by using Squared Euclidean distance (
Figure 10a) that Line 1 in Paris forms a first cluster. Its elements are at a considerable distance from the other metro lines. The second cluster is formed by the other autonomous metro lines and is equidistant from the first one. This cluster contains two subclusters that are homogeneous. The first subcluster includes the following two metro lines: Line 14 in Paris and Line D in Lion. The second subcluster also includes two subclusters. The first subcluster includes Line C in Rome, Line M2 in Lausanne and Brescia. The second subcluster is formed by the following autonomous metro lines: Line 9 and Line 10 in Barcelona, Line U2 and Line U3 in Nuremberg, Line 1 and Line 2 in Copenhagen, Line M0 in Turin, Line A in Rene, Line A and Line B in Toulouse, Line A and Line B in Lille, Line 5 in Milan, Line 4 in Budapest. The elements of these subclusters are united at a relatively small distance.
Figure 10b shows the results given by Squared Euclidean distance. The results by using Euclidean distance are similar to these obtained by Squared Euclidean distance. Two clusters were formed again. The first cluster includes Line 1 in Paris. The second cluster includes the other autonomous metro lines. It contains more subclusters compared to the Squared Euclidean distance. The first subcluster is formed by two subclusters: on the one hand Line 14 in Paris and Line D in Lion, and on the other hand, the other four subclusters. First, Line M2 in Lausanne, Line C in Rome and Brescia are united in a common subcluster. Second, Line 1 and Line 2 in the Copenhagen metro and Line U3 in Nuremberg also form a separate subcluster. Third, Line 9 and Line 10 in Barcelona, Line M0 in Turin and Line 4 in Budapest also form a subcluster. Fourth, Line A in Rene, Line A and Line B in Toulouse, Line A and Line B in Lile, Line U2 in Nuremberg and Line 5 in Milan are structured in a separate subcluster which is homogeneous. It can be concluded that the results of both distance approaches are similar.
It is important that Line 1 in Paris is significantly different from the others. K-means clustering requires the number of clusters to be set in advance. The method determines the autonomous metro lines in each cluster. K-means cluster Analysis was conducted based on the number of clusters obtained by Hierarchical Cluster Analysis. Three variants of number of clusters were formed, based on the results illustrated in
Figure 10. The first variant consists of two clusters; the second variant has three clusters, and the third variant includes four clusters. The statistical importance of different criteria was determined by using the F criterion (Fisher’s criterion). This test was used only for descriptive purposes. The observed significance levels cannot be applied as tests of the hypothesis that the cluster means are equal.
Table 8 shows the values of the F test. The criteria average number of passengers per day (C7), intensity of day trips (C8) and average distance (C5) have a significant importance according to the results of F criterion.
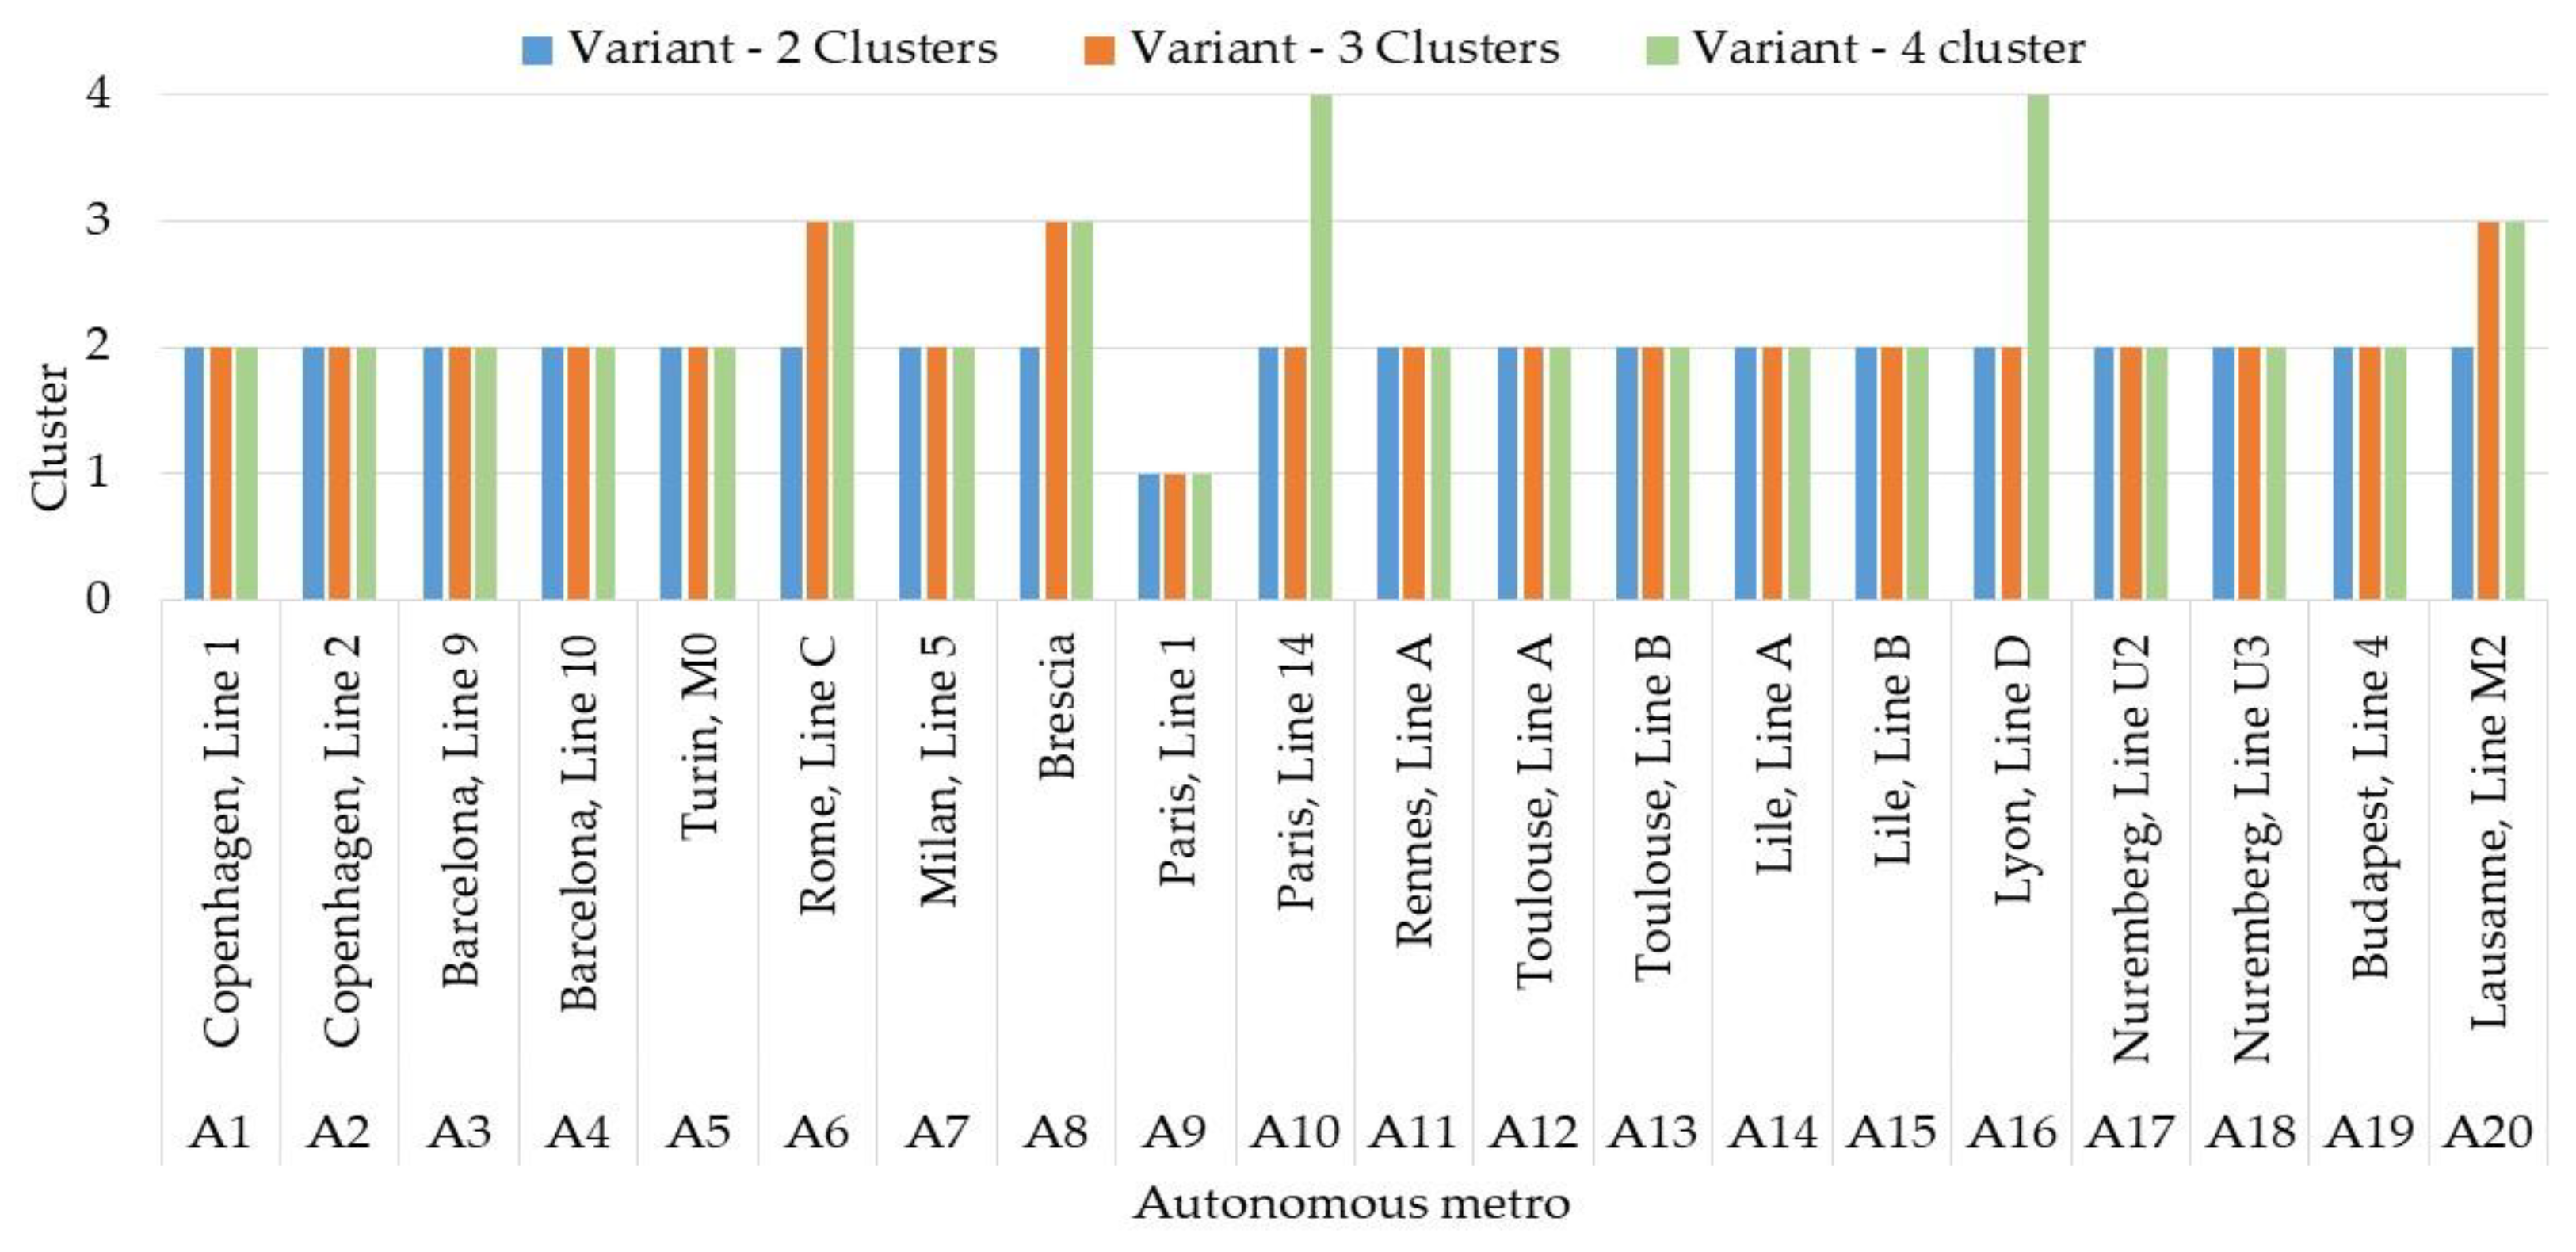
Figure 11 illustrates the results of K-means clustering according to the number of clusters and the autonomous metro lines in each cluster. It can be seen that for the first variant with two clusters, Line 1 in Paris forms the first cluster; all other metro lines are the elements of the second cluster. The results for variant 2 in which three clusters were formed shows that Line 1 in Paris forms the first cluster again; the second cluster consists of 16 metro lines; the third cluster includes Line M2 in Lausanne, Line C in Rome and Brescia. The results for variant 3 in which four clusters were formed show that Line 1 in Paris forms a separate cluster, Line 1 in Paris and Line D in Lyon also form a separate cluster, 14 metro lines form another cluster, and Line M2 in Lausanne, Line C in Rome and Brescia are included in another cluster. The results show that the clustering with three and four clusters are similar. Line 1 in Paris is distinguished from other metro lines. It is observed that the results obtained from the hierarchical cluster analysis coincide with those obtained from the K-means cluster analysis.
Table 9 represents a comparison of the results by both cluster analysis and new aggregated approach. It can be seen that according to the results given by Laplace’s criterion and Hurwitz’s criterion, the values of these criteria for the autonomous metro line in the first cluster are the upper limits of 0.1. The values of these criteria for the elements of the second cluster are between 0.65 and 0.75. The values of the Laplace’s criterion and Hurwitz’s criterion in the end of the table are between 0.01 and 0.03. These elements form the fourth cluster. Considering that the third cluster is formed by metro lines with the values of Laplace’s criterion and Hurwitz’s criterion between 0.08 and 0.03, it can be concluded that the results by cluster analysis are similar to these obtained by new aggregated approach. This gives reason to conclude that there are four clearly formed clusters.
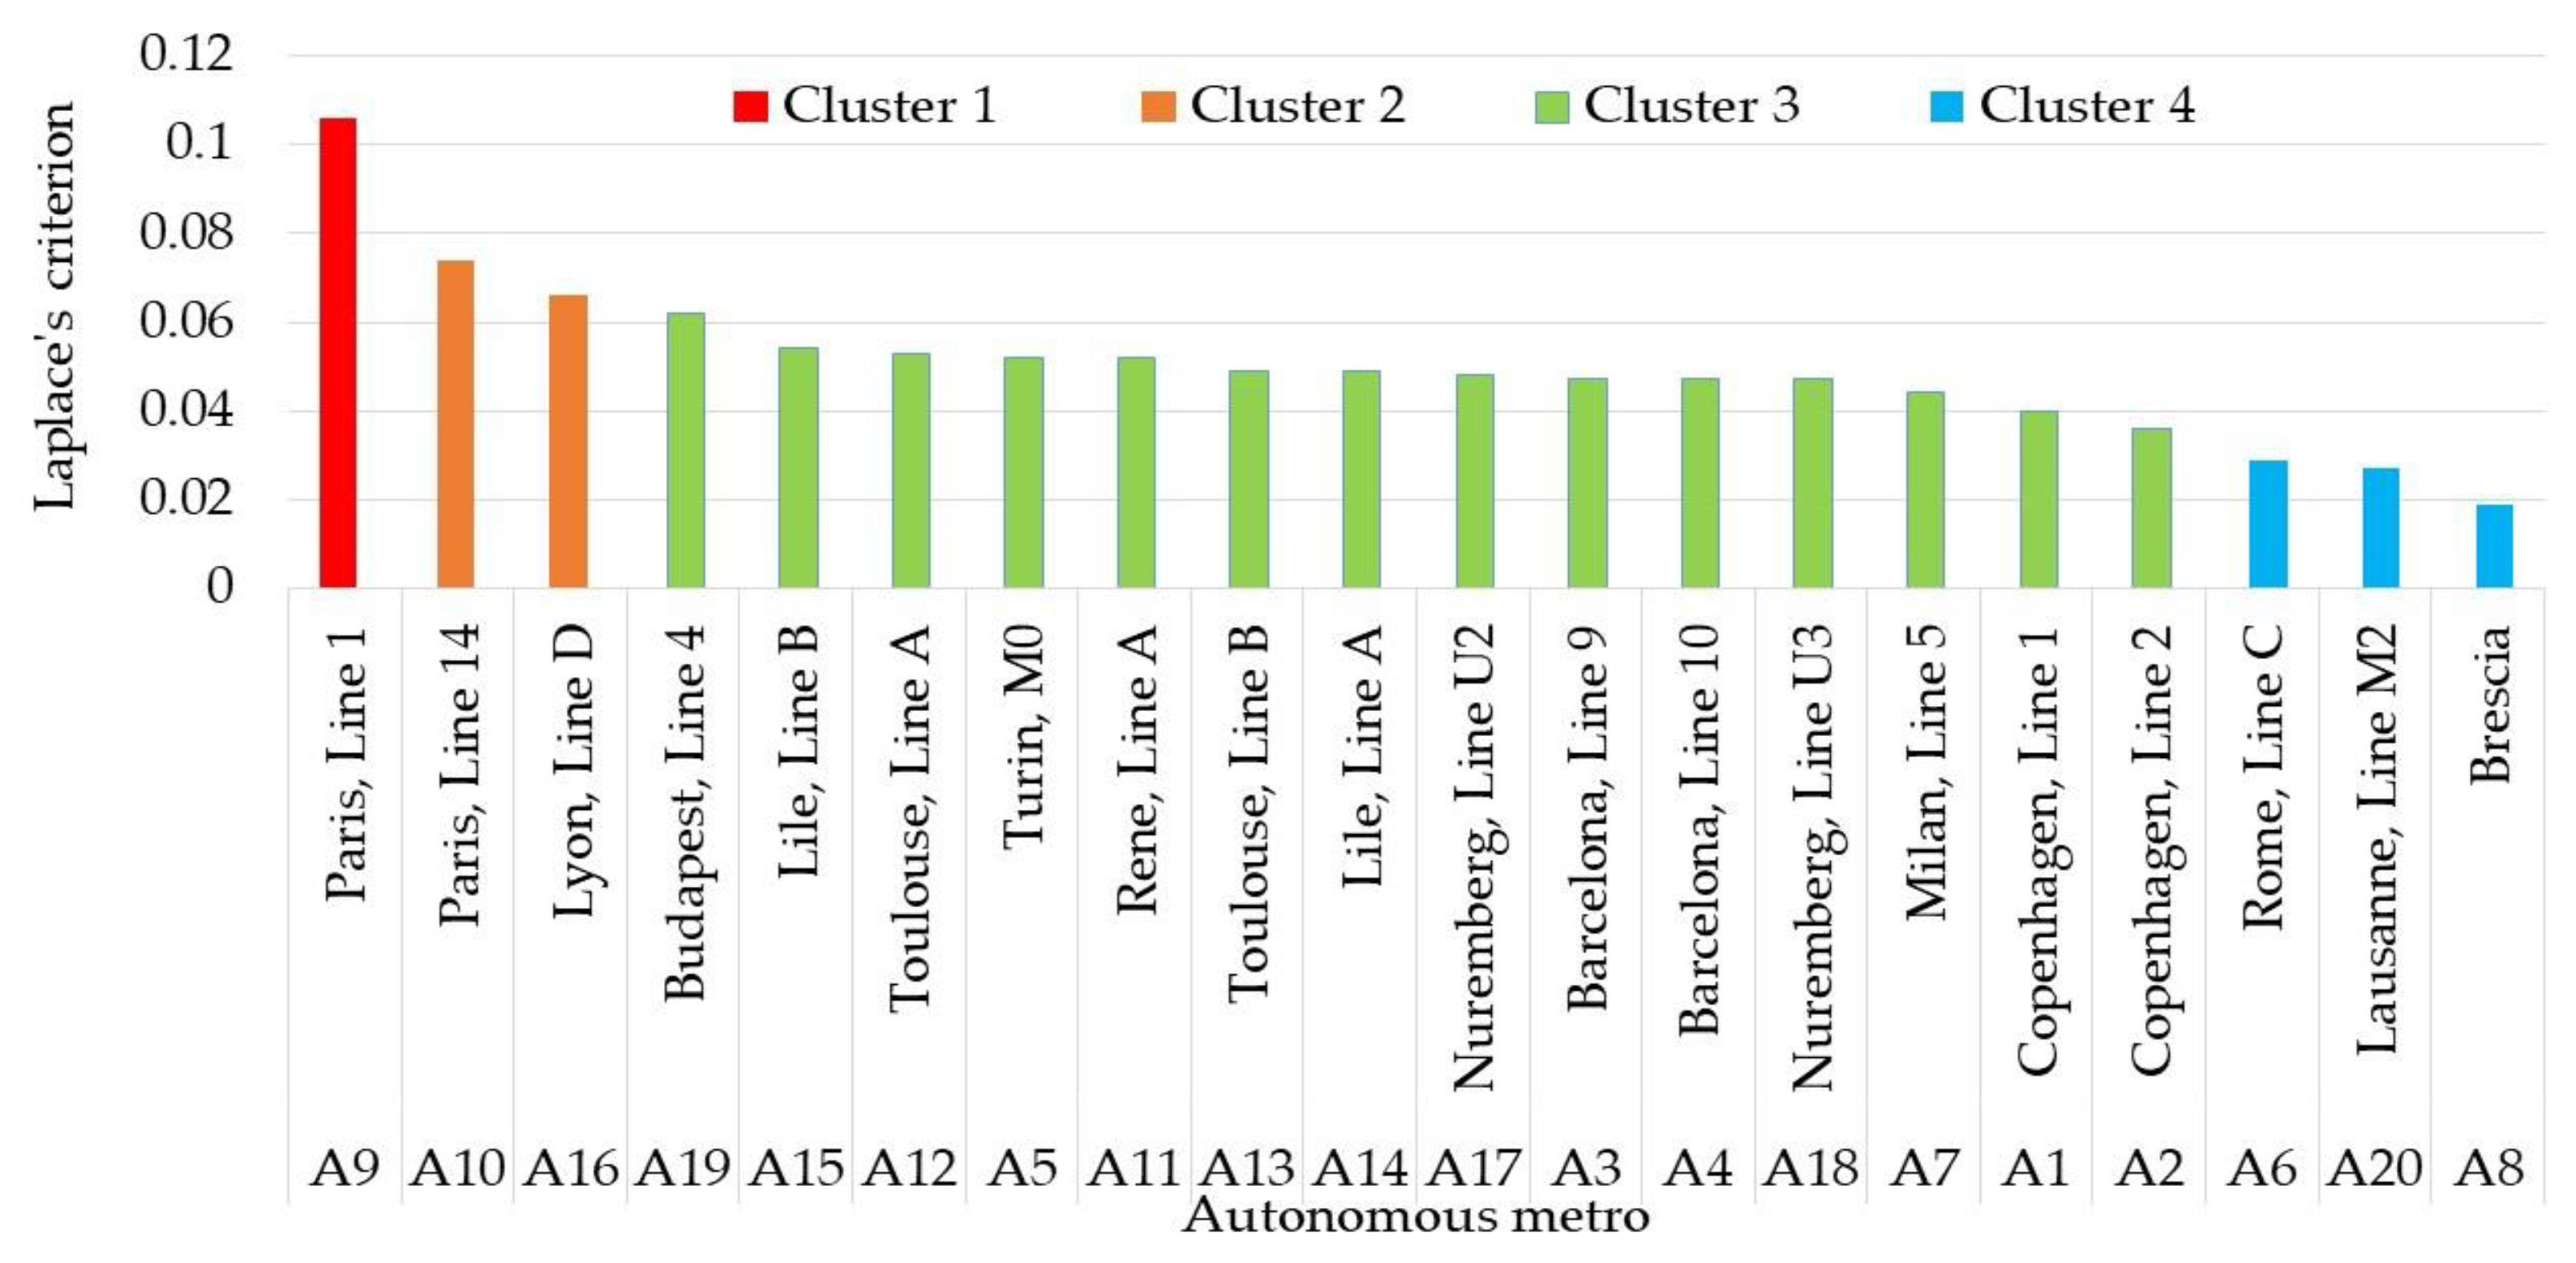
Figure 12 shows a summary of clusters based on the results by both clustering methods and new aggregative approach based on multi-criteria decision-making methods.
The clusters are as follows:
Cluster 1–This cluster includes Line 1 in Paris, which were ranking as the best by all methods. It was placed in the first position respectively by both Laplace’s and Hurwitz’s criteria. These metro lines carry over 400 thousand passengers per day. The values of Laplace’s criterion and Hurwitz’s criterion are the upper limits of 0.1.
Cluster 2–This cluster contains two autonomous metro lines: Line 14 in Paris and Line D in Lyon. They were placed in second and third positions by both Laplace’s and Hurwitz’s criteria. The values of Laplace’s criterion and Hurwitz’s criterion of these metro lines are between 0.065 and 0.075. These metro lines carry between 200 thousand and 400 thousand passengers per day.
Cluster 3–This cluster includes fourteen autonomous metro lines: Line A and Line B in Toulouse; Line A and Line B in Lille; Line 5 in Milan; Line 1 and Line 2 in Copenhagen metro; Line M0 in Turin; Line U2 and Line U3 in Nuremberg; Line 9 and Line 10 in Barcelona; Line A in Rennes; Line 4 in Budapest. They were placed between fourth and seventeenth positions by both Laplace’s and Hurwitz’s criteria. The values of Laplace’s criterion and Hurwitz’s criterion of these metro lines are below 0.035 and 0.065. These metro lines carry between 100 thousand and 200 thousand passengers per day.
Cluster 4–This cluster is formed by three metro lines: Line C in Rome; Line M2 in Lausanne, and Brescia. The values of Laplace’s criterion and Hurwitz’s criterion of these metro lines are below 0.035. These metro lines carry below 100 thousand passengers per day.
5. Conclusions
This paper proposes a new integrated six-step methodology for the multi-criteria evaluation of fully autonomous metro systems’ performance. Groups of symmetric autonomous metro lines were formed. A new aggregative approach based on multi-criteria methods for ranking was developed. This approach was applied to evaluate 20 fully autonomous metro systems in European countries.
Eight criteria accounting for the safety, infrastructural and technological development were defined to assess the autonomous metro system. The new average approach to determine the criteria weights was elaborated which includes both objective and subjective techniques for assessment. For this purpose, the Shannon Entropy method and BWM were applied. It was found that the intensity of day trips (30%) and the number of passengers per day (25%) have the greatest impact on investigated systems. Three multi-criteria approaches including five multi-criteria methods were used to evaluate the fully autonomous metro systems: distance-based, utility-based and outranking approaches. The Spearman rank correlation coefficient was implemented to compare the results. It was found that that there is a strong correlation between the results by different multi-criteria methods. The final ranking was performed based on the new proposed aggregative approach which considers multi-criteria analysis scores as benefits of different strategies and inputs them to Laplace’s and Hurwitz’s decision-making criteria. It was found that Line 1 in Paris is the best. Line 14 in Paris and Line D in Lyon ranked in the second and third position, respectively. These three metro lines are also with the highest average number of passengers per day. Brescia, Line C in Rome, and Line M2 in Lausanne were placed at the end of the ranking. These are also the metro lines with the lowest average number of passengers per day.
The verification of the results was carried out through hierarchal cluster analysis and K-means clustering methods. The average linkage between groups hierarchical method and both Squared Euclidean distance and Euclidean distance as a measure of distance were applied for clustering. It was observed that the results obtained from the hierarchical cluster analysis coincide with those obtained from the K-means cluster analysis. In was found that Line 1 in Paris forms a cluster that which is at a great distance from the other autonomous metro lines. The results by cluster analysis are similar to those obtained by multi-criteria methods.
Finally, four clearly formed groups were proposed. The first includes Line 1 in Paris. This line carries over 400 thousand passengers per day. The second cluster includes Line 14 in Paris and Line D in Lyon. These metro lines carry over 200 thousand passengers per day. These three metro lines, which are elements of the first and second clusters, were ranked as the best by all methods. The third cluster is formed by 14 autonomous metro lines. These metro lines carry between 100 thousand and 200 thousand passengers per day. The fourth cluster has three metro lines. These metro lines carry under 100 thousand passengers per day.
The results could be used to compare different fully autonomous metro lines. The elaborated new aggregated approach could serve to assess the position of autonomous metro lines and make decisions for their development.
The novelty of this study and its main advantage consists of the establishment of groups of symmetrical autonomous metro lines; the evaluation on the performance of autonomous metro lines; the combining of an objective and subjective approach to determine the importance of the decision criteria; the integration of the distance-based, utility-based and outranking multi-criteria approaches in an aggregative approach for decision making.
The results could be used by metro operators to evaluate the level of their development. Measures could be taken to increase security and safety, to reduce the train headway and respectively increase the number of metro trains and the capacity of vehicles. The demographic and economic growth of the cities impact their mobility and planning is needed to increase the capacity of autonomous metro lines. The metro lines which form one group could apply for financial resources under European programs for their development and expansion. The classification from one group to another depends mostly on the passengers carried and the intensity of the trips.
Future research will expand the number of criteria for decision making and the scope of the studied autonomous metro systems; the uncertainty of transport process also could be examined. The presented aggregative approach could also be used in the case of uncertainty. In this case it is necessary to apply fuzzy or interval extensions of multi-criteria decision-making methods. The final ranking could be performed based on the new aggregative approach proposed in this study which considers multi-criteria analysis scores as benefits of different strategies and inputs them to Laplace’s and Hurwitz’s decision-making criteria. In the future, research will be presented on the new aggregative approach based on fuzzy or interval methods.
The proposed new aggregated approach could also be used for evaluation in different areas of research. A different number of multi-criteria methods could be applied in this new aggregated approach.


