1. Introduction
In recent years, with the rapid development of the automobile industry and vehicle technology, road traffic safety has become a worldwide problem [
1,
2]. It is estimated that the number of road traffic fatalities reached 1.35 million in 2016 and is increasing every year [
3]. To solve the problem of traffic safety and improve driving safety, many methods have been proposed to detect dangerous driving including the classification of driver context [
4,
5,
6], vehicle context [
7,
8,
9], and road context [
10,
11,
12]. It has been reported that more than 90% of vehicle traffic accidents in the United States are caused by driver error [
13], which is similar to other countries around the world. Compared with other objective factors, driver behavior is subjective and can be standardized. Therefore, it is necessary to study the behaviors that lead to driver operational errors.
There are many studies on behaviors that may lead to driver operational errors, with research content classifying abnormal behaviors including fatigued driving, distracted driving, and dangerous driving.
For the study of fatigued driving, some studies believe that a driver’s fatigue behavior is a kind of human physiological state, so by finding the physiological indicators related to the abnormal behavior of the driver, fatigued driving can be determined. For example, in [
14], by detecting the EEG signal of a driver’s physiological indicators, it is possible to predict whether the driver has fatigued driving behavior. However, the physiological detection method for a driver, similar to an EEG signal, is difficult to implement in a real vehicle because a sensor device needs to be placed such as a pole piece into the driver, which easily causes a psychological burden to the driver. Therefore, Guanglong Du et al. proposed a fatigue detection method characterized by the facial information of the levels of eye and mouth opening [
15]; Bappaditya Mandal et al. proposed predicting driver fatigue behavior by estimating the pose of the eyes [
16] including eye opening estimation and eyelid closure percentage estimation. Moreover, methods of detecting fatigued driving based on the key information features of the driver’s face will not affect the driver and they are widely used in the detection of abnormal driver behavior.
For research on distracted driving, Alberto Fernándezs et al. believe that the driver’s use of mobile phones is a distracted driving behavior; therefore, a traditional learning strategy was proposed [
17]. First, the key features of the mobile phone were manually extracted from image samples to build a detection model. Second, the mobile phone target was detected using a SVM detector. Finally, whether the driver exhibits distracted driving behavior is predicted [
18]. However, the manual feature extraction method of this traditional learning strategy is challenging for the selection of excellent features, and the detection process is time-consuming. Landu Jiang et al. believe that a driver’s smoking and phone calling behavior is a kind of distracted driving behavior, and a deep convolutional neural network (CNN) method was designed. A CNN network can automatically extract key features in image samples and classify the detected smoking and phone calls [
19]. This deep learning-based method does not require manual feature extraction, and the detection speed of the target is fast. Therefore, in the detection of abnormal behaviors, deep learning-based methods outperform traditional learning strategies [
20].
In the research of dangerous driving, some studies have determined whether the driver has dangerous driving behaviors using a vehicle data (e.g., speed, acceleration) detection method. For example, [
21] proposed identifying dangerous driving by constructing a set of vehicle trajectory histograms (e.g., control point histogram and velocity histogram). Chen et al. applied the SAX method to detect dangerous driving behavior by analyzing acceleration [
22]. However, detection methods that analyze vehicle data are not real-time and cannot intervene in a timely manner in dangerous driving situations. Therefore, Galarza et al. proposed the use of smart devices and a CNN to detect driver drowsiness, dangerous driving behavior, and real-time monitoring and timely reminders for dangerous drowsy driver behavior [
23]. This method of combining smart devices with a CNN solves the problem that vehicle data analysis cannot be carried out in real-time and provides a new method for the detection of dangerous driving behavior.
The above method for detecting the abnormal behavior of a driver using the key features of the driver’s face to detect fatigued driving behavior is operable in an actual vehicle environment. In the detection of distracted driving behavior and dangerous driving behavior, the detection method using a deep CNN has the advantages of fast detection speed, and when combined with the use of smart devices, the output detection results can be obtained in real-time. Therefore, a multiangle analysis of driver abnormal behavior is very important to solve actual traffic safety problems.
Regarding the abnormal behavior of a driver during the driving process, the reasons for the specific behavior are also different according to their different performance characteristics. An abnormal behavior analysis problem caused by various factors can be realized by constructing different deep learning models. To the best of our knowledge, there is no mature work on the multiangle analysis of abnormal driver behavior at home or abroad.
The contributions of this paper are as follows:
We established an abnormal behavior analysis library, in which natural behavioral factors include: (1) eyes closed, (2) yawning, and (3) nodding; unnatural behavioral factors include: (1) smoking, (2) phone, and (3) drinking water; and passive behavioral factors include disturbance. The abnormal behavior library provides the basis for the construction of a driver abnormal behavior recognition model.
A driver abnormal behavior analysis strategy is proposed. According to the specific and key abnormal behavior characteristics of a driver, the abnormal behavior of the driver is analyzed from three aspects: natural behavioral factors, unnatural behavioral factors, and passive behavioral factors.
A driver abnormal behavior recognition system was developed. The system was tested and applied in real vehicles, and a series of experimental results showed that this research has high accuracy in the task of the real-time detection of abnormal driver behavior.
The rest of this paper is organized as follows. In
Section 2, the analysis and model design of abnormal behavior problems are studied. In
Section 3, the design of the driver abnormal behavior recognition model is introduced. In
Section 4, the experimental details and results of the driver abnormal behavior analysis system are described.
Section 5 summarizes the main conclusions of this paper and discusses future work.
3. Design of the Driver Abnormal Behavior Recognition Model
Figure 3 shows the structural design of the driver abnormal behavior detection model. Video obtained from a vehicle camera is used as the input, the abnormal behavior of the driver is inferred and predicted through Module A and Module B, respectively, and the judgment result is output to the system monitoring the visualization interface in real-time.
The design of Module A adopted the structure of a PFLD deep neural network [
33], which was divided into the input, backbone, and prediction layers. The video stream data were obtained through an on-board camera installed in the cab, and the video frame picture was obtained by sampling the video frame-by-frame.
The red-green-blue (RGB) image of the input layer is the frame picture of the collected video. The image enters the backbone layer to perform 2, 4, and 8 times downsampling operations to obtain the key point feature information of the input image. The prediction layer performs multiscale operations, which can predict key points of three different scales. The obtained feature map information is processed using a full connection, which predicts the coordinate information of 68 key points on the driver’s face and uses the coordinate information to determine whether the driver has abnormal behaviors such as long-term eye closure, frequent yawning, or frequent nodding caused by natural behavioral factors.
The design of Module B adopted the structure of the YOLOv5 deep neural network [
34], which was divided into the input, backbone, neck, and prediction layers. It also uses the frame picture of the video collected from the vehicle camera as the input image. Anchors were introduced at this point to optimize the prediction of the width and height of the ground-truth (GT) bounding box to improve the accuracy.
The backbone layer performed 8, 16 and 32 times downsampling to aggregate images at different granularities and extract the image features. The neck layer fuses the image features twice through operations such as 2 times upsampling and concatenation and then passes the transformed image features to the prediction layer, which applies anchors to the feature map to generate bounding boxes with associated class probabilities. According to the predicted category information and bounding box coordinate information, it determines whether the driver has abnormal behaviors such as smoking, making a telephone call, or drinking water or disturbed driving caused by unnatural and passive behavioral factors.
3.1. PFLD Network Model Design
3.1.1. Design Principles
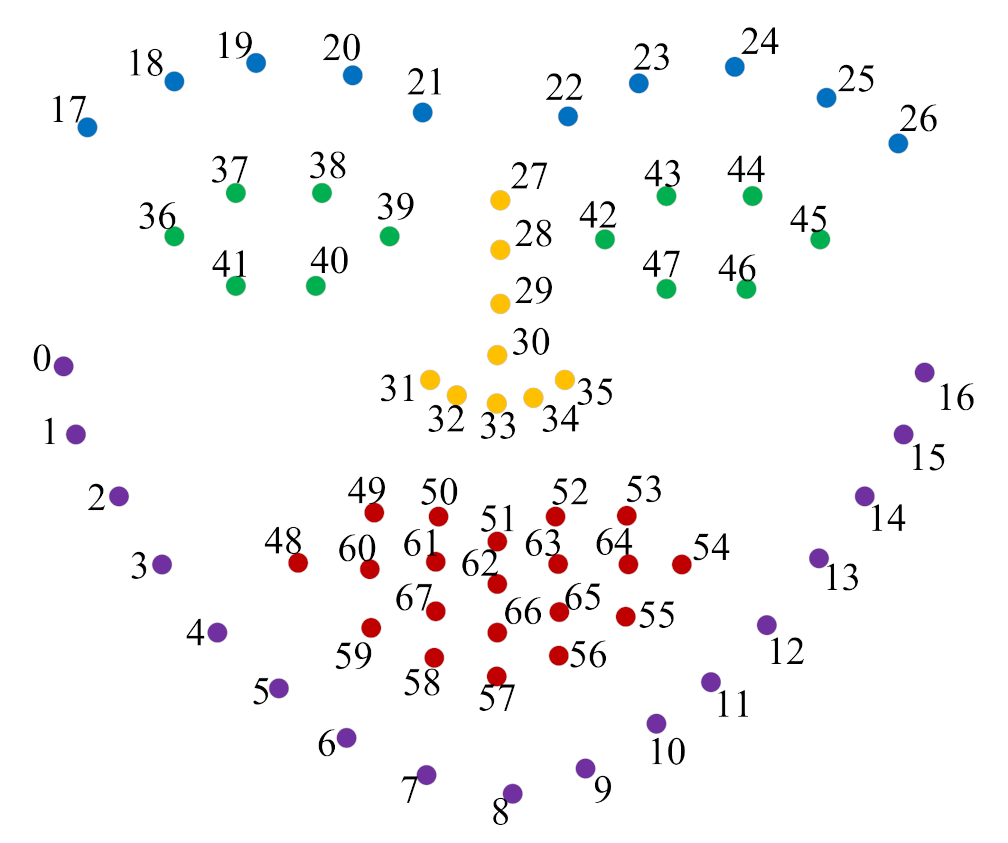
The module was designed to use facial key point detection tasks to identify abnormal behaviors caused by natural driver behavioral factors. Sixty-eight facial key point detection is the most common solution today including eyebrows, eyes, nose, mouth, and contours. The location information of facial key point annotation is shown in
Figure 4.
There were five key points for unilateral eyebrows, which were uniformly sampled from the right to the left, for a total of 5 × 2 = 10 key points. The eyes were divided into six key points, and the upper and lower eyelids were uniformly sampled from the right to the left boundary, for a total of 6 × 2 = 12 key points. The lips were divided into 20 key points, except for the two corners of the mouth, which were divided into the upper and lower lips, the outer boundary of the upper and lower lips, each of which was uniformly sampled by five key points, and the inner boundary of the upper and lower lips, each of which was uniformly sampled by three key points, so a total of 20 key points. The nose included four key points of the bridge of the nose and five points evenly collected from the tip of the nose, for a total of nine key points. The face contours were uniformly sampled with 17 key points.
For the detection problem of the 68 key points on a driver’s face, we built a nonlinear model that satisfies Equation (1):
where
, with
being the detected
th key point. Here,
is an unknown nonlinear function, and
is the input image extracted from the video frame. Two parameters were selected for the output
: a and b, which are the abscissa and ordinate of
, respectively.
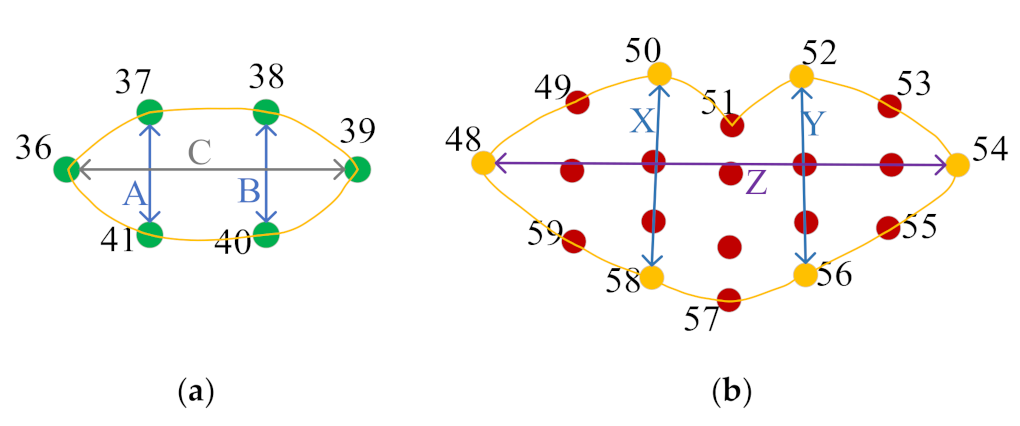
The abnormal behavior was identified on the output key point position information, and the behavior detection from three consecutive frames was determined as the completion of one action. According to Equation (2), it can be determined that if the ratio of the height and width of the eyes in three consecutive frames is less than the value, one eye closure has occurred. In the experiment, 60 continuous eye-closing actions were set as the long-term eye-closing behavior. According to Equation (4), it can be determined that if the ratio of the height and width of the mouth in the three-frame detection is less than the value, a yawn has occurred. In the experiment, if the yawning action occurred 15 times, the recognition result was frequent yawning behavior. Head pose estimation was used to obtain the attitude angle of the head through a facial image and calculate the three Euler angles of the pitch, yaw, and roll [
35]. Because the nodding behavior is only the action of nodding up and down, only the size of the pitch is considered, and if the pitch for three consecutive frames is less than the set threshold of 0.3, nodding has occurred. In the experiment, if nodding occurred 15 times, the recognition result was frequent nodding behavior.
where
and
are the ratio of the height and width of the right eye and the left eye, respectively;
is the average value of the height and width ratio of the two eyes; and
is the threshold parameter of the height and width ratio of the eye, which was set to 0.2 after actual adjustment. Taking the eye as an example, the calculation equation is:
where
,
, and
, as shown in
Figure 5a, the coordinates
,
,
,
,
, and
are the coordinates of the six key points of the right eye.
where
,
, and
;
is the average value of the height and width ratio of the mouth; and
is the threshold parameter of the height and width ratio of the eyes, which was 0.5 after actual adjustment. As shown in
Figure 5b, the coordinates
,
,
,
,
, and
were the coordinates of the six key points on the outer boundary of the lips.
3.1.2. Network Structure
Figure 6 shows the PFLD network structure diagram. The input is an RGB image, and the output is the predicted facial key points. The network structure is divided into two parts: the main network structure and the auxiliary network structure. The red box is the 68 key points used by the main network structure to predict the face; the black box is the auxiliary network structure. Previous studies have shown that adding appropriate auxiliary constraints can make the detection of facial landmarks more stable and robust [
36,
37]. The spatial geometry of the head pose pitch, yaw, and roll is used in the process of training key points. The information is used as a constraint to improve the robustness of key point detection.
The bottleneck structure in the main network uses MobileNet [
38] blocks instead of traditional convolution operations. The basic unit of MobileNet is depthwise separable convolution, which is a factorized convolution that can be decomposed into two smaller operations: depthwise convolution and pointwise convolution. Depthwise convolution is different from standard convolution. For standard convolution, the convolution kernel is used on all input channels (input channels), while depthwise convolution uses different convolution kernels for each input channel; that is, each convolution kernel corresponds to an input channel. Pointwise convolution is actually an ordinary convolution, but it uses a 1 × 1 convolution kernel. Depthwise separable convolution first uses depthwise convolution to convolve different input channels separately and then uses pointwise convolution to combine the above outputs. The overall effect is similar to a standard convolution, but it will greatly reduce the amount of calculation and number of model parameters, making the model smaller and faster.
The auxiliary network structure takes the fourth-layer feature map of the main network as input, obtains a 1 × 1 × 128 feature map through four convolution operations, and obtains the spatial geometric information of the head pose pitch, yaw, and roll (i.e., the Euler angles) through the full connection operation [
39]. The purpose of the network is to estimate the three-dimensional Euler angles for each input face sample, and the ground truth is estimated from the face key point information in the training data so that large angles and large deviations can be used for large samples by passing a larger loss and supervised and assisted training convergence.
To solve the data imbalance problem, the ability of accurate detection is improved by imposing a large penalty on the small number of training samples [
40]. In mathematical terms, the loss function is expressed as follows:
where
is the number of samples;
is the number of feature points;
is different weights; and
is the distance measure (L1 or L2 distance) of the feature points. Considering the balance of geometric constraints and data, a new loss function was designed as follows:
where
is the final sample weight.
K = 3 represents the three dimensions of the face pose estimation, that is, the yaw, pitch, and roll angles. From the calculation formula, the higher the angle, the greater the weight.
C is the number of different face categories, and the face is divided into six categories: side face, front face, head up, head down, expression, and occlusion. The weight
was set according to a small number of samples belonging to category
C, and if there were few samples in a certain category, the given weight was greater.
3.2. YOLOv5 Network Model Design
3.2.1. Design Principles
The module was designed to use object detection tasks to identify abnormal behaviors caused by unnatural and passive driver behavioral factors. Considering the limitations of label definition for target detection [
41], the possible target classification labels were divided into four categories: (1) face, (2) cigarette, (3) mobile phone, and (4) water bottle. We built a nonlinear model that satisfies Equation (7):
where
, with
denoting a detected bounding box of face;
denoting a detected bounding box of cigarette;
denoting a detected bounding box of mobile phone; and
denoting a detected bounding box of water bottle. Here,
is an unknown nonlinear function, and
is the image input extracted from the video frame.
The output is expressed as , , and nine parameters are contained. Among them, a and b are the abscissa and ordinate of , respectively; w and h are the width and height of , respectively; c is the confidence of belonging to the current class; and denotes the classification results of the four label categories, where represents a face label, represents a cigarette label, represents a mobile phone label, and represents a water bottle label.
According to Equation (7), the output label value is identified as abnormal behavior. If label 1 and label 2 exist at the same time, the recognition result is smoking behavior. The recognition result of label 1 and label 3 is making a telephone call behavior. If label 1 and label 4 exist at the same time, the recognition result is drinking water behavior. If label 1 appears twice, and the label position distance is less than the safety threshold, there are other people in the cab, which may interfere with driving. At this time, the recognition result is disturbed driving behavior.
where
are the horizontal and vertical coordinate values of the detected first face label and
are the horizontal and vertical coordinate values of the detected second face label, and the Euclidean distance is used to calculate the distance between the two labels.
is the distance threshold parameter, which is actually adjusted to 226.
3.2.2. Network Structure
Figure 7 shows the YOLOv5 network structure diagram. The input is an RGB image, and the output is three tensors representing three different scale bounding boxes. The parameter information contained in each tensor produces the classification result of object detection. The network model defaults to the 640 × 640 image input, and multiple combined CBS+CSP operations are designed in the network to extract deeper feature maps, in which the CBS consists of a convolution operation (Conv), batch normalization (BN) layer, and SiLU activation function [
42]. Deeper feature maps have stronger semantic features and weaker location information, while shallower feature maps have stronger location information and weaker semantic features. Correspondingly, these two types of features can undergo information transfer and fusion to obtain feature maps that capture more complex feature information.
The cross-stage partial network (CSPNet) [
43] divides the input feature map into two branches: one branch is convolutional, and the other branch is concatenated with the convolution result of the previous step, which reduces the information loss in the inference process. This structure can be effectively applied in the backbone to enhance the learning ability of neural networks. The SPPF structure passes the input serially through multiple 5 × 5 MaxPool layers. Compared with the original SPP structure [
44], two 5 × 5 convolution operations were used to replace a 9 × 9 convolution operation, three 5 × 5 convolution operations replaced one 13 × 13 convolution operation, and the receptive field remained unchanged. However, the calculation time was reduced, which helped to solve the matching problem between the anchor points and feature maps.
The generalized intersection over union (GIOU) loss indicator in the prediction layer was used to evaluate the position loss between the target and predicted bounding boxes [
45], and the binary cross-entropy (BCE) logit loss function [
46] was used to evaluate the object classification loss. The GIOU loss function is:
Among them, the IOU loss evaluation index [
47] evaluates the accuracy of the position regression according to the intersection ratio (intersection/union) of the target bounding box and the predicted bounding box. box_p is the prediction bounding box, box_gt is the ground-truth box, and box_r is the minimum bounding rectangle of box_p and box_gt.
Due to the imbalance of the number of positive and negative samples, the BCE logit loss was used to increase the number of positive sample anchors to balance the number of positive and negative samples, which can accelerate convergence in practice. The BCE logit loss function is:
where
;
n represents the total number of categories;
is the predicted value of the current category;
is the probability of the current category; and
is the true value of the current category.
4. Experiment
This section presents the experimental platform design and results of this study. In
Section 4.1, the design of the experimental platform is introduced. In
Section 4.2, the abnormal behavior recognition PFLD model of natural behavioral factors, abnormal behavior recognition YOLOv5 model of unnatural and passive behavioral factors experimental results, the deployment of the PFLD and YOLOv5 models using Nvidia Jetson Xavier modules, and the test of the experiment platform in a real vehicle scene were analyzed.
4.1. Experimental Platform Design
Figure 8 shows a flow chart of the experimental design. The experimental design was divided into three parts: test vehicle, test platform, and visual interface.
The process of driver abnormal behavior recognition is represented by the green line in
Figure 8, in which the video capture card of the experiment platform is connected with the on-vehicle cameras on the experimental vehicle through wiring, the real-time monitoring data in the cab can be collected, and the data can be collected through the serial input to the Nvidia Jetson Xavier (NX) module. The NX module transmits the image of the video stream data into the deployed abnormal behavior recognition model. If there is an abnormal driver behavior, the visual interface of the system displays a picture of the moment when the behavior occurs and outputs the alarm information.
At the same time, considering the complex bus environment of the experimental vehicle, on-vehicle cameras need to meet certain practical requirements such as high performance, low power consumption, high video frame rate, and adaptation to outdoor environments. The experiment platform is the key to the driver abnormal behavior analysis system. Its basic structure includes a carrier board, video capture card, and NX module. The details of the three basic structures of the test platform are as follows:
The system uses an RTSO-6002E carrier board, which is an industrial-level carrier board with low power consumption and high safety. Its operating temperature range is −40–+80 °C, making it suitable for complex outdoor environments.
- 2.
Video capture card
The system uses an RTSV-6911i mini-PCIe video capture card to meet the needs of the visual processing system. This video capture card supports the full frame rate, multichannel video capture, and hardware color space conversion, and can convert the captured video data into the format required for system display, image analysis, image processing, and other applications. Therefore, it provides powerful front-end processing support.
- 3.
Nvidia Jetson Xavier module
The Nvidia Jetson Xavier [
48] is a processor from Nvidia for deep machine learning. The NX has a deep learning inference computing framework that is natively supported by the entire Jetson platform, optimizing the use of GPU resources. It has strong computing power, fast processing speed, and a small module area. Therefore, it can achieve high computing performance in a compact modular system.
4.2. Experimental Results
In this study, there were three factors that caused the abnormal behavior of drivers, namely, natural behavior factors, unnatural behavior factors, and passive behavior factors. We constructed two abnormal behavior detection models according to the characteristics of the three factors. Abnormal behaviors under the influence of natural behavioral factors were identified using the PFLD model, and abnormal behaviors influenced by unnatural behavioral factors and passive behavioral factors were identified using the YOLOv5 model. Due to the different models, the indicators for training and evaluating each model were also different. In terms of evaluating the indicators of each model, considering the practical application problems, the experiment only took the detection accuracy of the model and the detection speed of the model as the reference.
4.2.1. Experimental Results for Natural Behavior Factors
The PFLD model uses the 300 W Common dataset, of which 3148 images were used as a training set and 689 images were used as a test set. In the data augmentation part, methods of flipping, rotating the image at 5° intervals (−30°~30°), and randomly occluding 20% of the face area were adopted. The parameter settings of the training process were shown in
Table 1. The entire network was trained on Nvidia GeForce RTX 3090 GPUs.
Interocular normalization (ION) is a commonly used index to evaluate the accuracy of the face key points, and its mathematical equation is:
where
represents the predicted coordinates of the
th point, and
represents the ground truth of the
th point. d is the distance between the left and right corners of the eyes. Clearly, this value is used to indicate the accuracy of the prediction, and the smaller the value, the better.
Table 2 compares the PFLD model with other excellent models on the 300 W Common dataset.
The PFLD model had a high accuracy, the ION could reach 3.11 on the 300 W Common dataset, and the running speed was very fast, up to 3.5 ms on the GPU GTX 1080 Ti processor.
4.2.2. Experimental Results of Unnatural and Passive Behavioral Factors
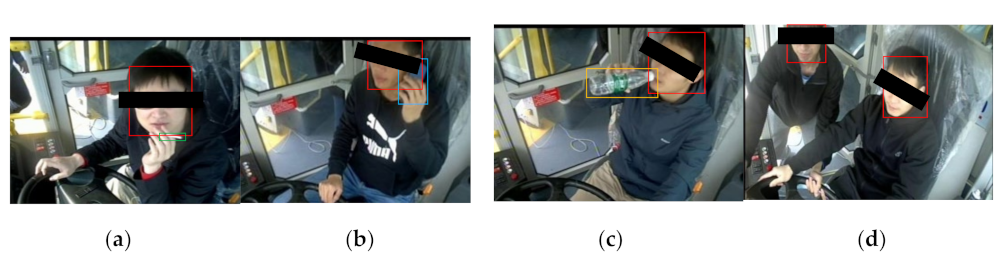
The dataset for the YOLOv5 model was made locally by us. The goal of the dataset was to simulate specific abnormal behaviors, collect multiple videos, cut and frame these videos, convert the videos into sample images, and then classify and annotate the sample images. The resulting labeled samples were used as a dataset of abnormal bus driver behavior.
Figure 9 shows examples of the labeled images for various types of abnormal driver behaviors represented in the dataset. Among them, 7965 images were used as the training set, and 2433 images were used as the test set.
In the data augmentation part, the mosaic data augmentation method was adopted. The main idea is to randomly crop and scale four pictures and then randomly arrange and splice them to form a picture. The parameter settings of the training process are shown in
Table 3. The entire network was trained on Nvidia GeForce RTX 3090 GPUs.
In the evaluation of the YOLOv5 model, the precision refers to the proportion of positive examples that are correctly identified and proportional to the number of positive examples, indicating the proportion of the target detected by the model as the real target object, as shown in the confusion matrix in
Table 4 and Equation (12). The recall is the number of positive examples that are correctly identified as sorted out of all the positive samples tested, which represents the proportion of all real targets detected by the model, as shown in Equation (13). The average precision (AP), expressed as the integration of the precision to recall on the precision–recall curve, as shown in Equation (14), and the mean average precision (mAP) refers to the AP value. The mean under all categories was evaluation for the entire dataset.
The weight of the YOLOv5 model obtained in the experiment was small, the mAP could reach 0.87 on the test dataset, and the running speed was very fast. The detection rate on the Tesla P100 processor was 140 f/s.
4.2.3. Deployment of the PFLD and YOLOv5 Models on the NX
The optimal model was obtained by modifying and adjusting the PFLD and YOLOv5 networks. The optimal model needs to be deployed in the NX module of the experimental platform before it can be applied in actual vehicles. To obtain the real-time frame rate of the in-vehicle video, the NX used TensorRT to deploy the model.
TensorRT is a deep learning inference computing framework that optimizes the use of GPU resources [
52]. TensorRT can be divided into two phases: the build phase and the compile phase. In the build phase, TensorRT receives externally provided network structure weights and hyperparameters, optimizes the network compiled on the NX, and generates an inference engine. In the compile phase, the GPU computing resources are called by running the inference engine, and the process is shown in
Figure 10.
In fact, TensorRT only provides inference and does not require real-time feedback. Network deployment does not affect the computing power and memory resources. Resources are usually not particularly tight, but they can speed up the acquisition of video frame rates on the NX side. Using the TensorRT inference engine in the experiment, the NX side can obtain a video frame rate of approximately 40 fps, which meets the real-time requirements.
4.3. Real Vehicle Test
The performance of the model deployed to the NX side was evaluated, and the performance of the model on the application side was evaluated by calculating the precision rate (
PR), missed alarm rate (
MR) and false alarm rate (
FR), and the
PR expectation on the application side could reach 95%. The
PR,
TR, and
FR are shown in the confusion matrix in
Table 4 and Equations (15)–(17):
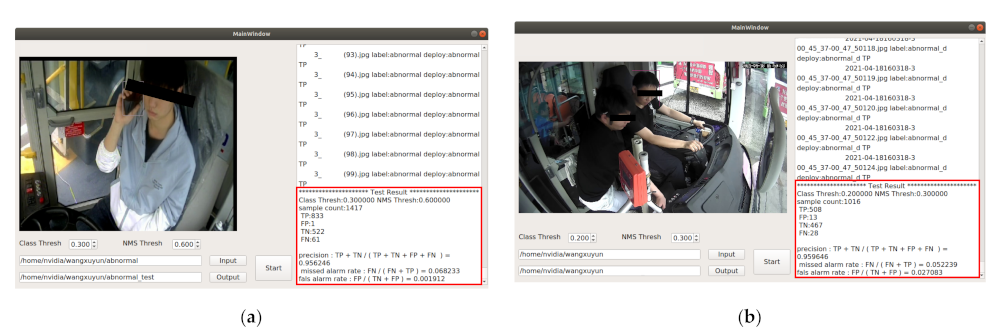
This experiment verified the performance of the model on the NX side by randomly selecting the data in the local scene many times.
Figure 11 shows the
PR,
MR, and
FR of the NX side model. Among them, (a) randomly selecting the detection results of 1417 local image data,
PR = 95.6%,
MR = 6.8%,
FR = 0.2%; (b) randomly selecting the detection results of 1016 local image data,
PR = 95.9%,
MR = 5.2%,
FR = 2.7%. After multiple verifications, the
PR was above 95%.
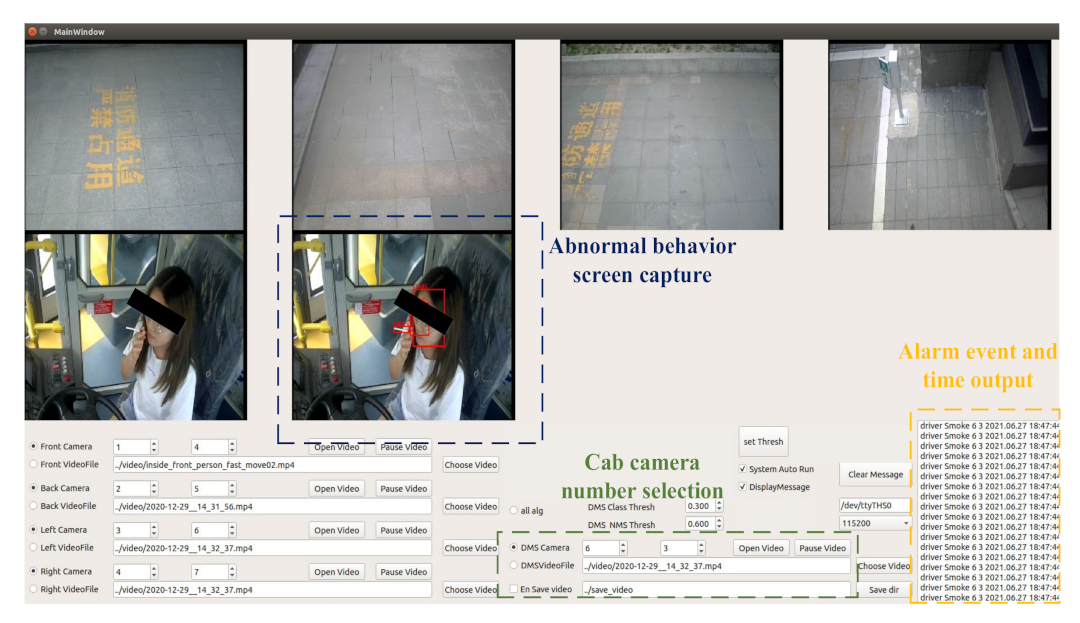
We developed an interface display for the identification of abnormal driver behavior in the form of an external window.
Figure 12 shows the visual interface of the system operation. The visual interface can output multichannel camera images, display the captured video frames of abnormal driver behavior, and output alarm information in real-time.
This paper proposed a novel driver abnormal behavior recognition and analysis strategy, developed a driver abnormal behavior analysis system based on deep learning, and applied it in practical vehicles. The driver abnormal behavior analysis system identified driver abnormal behavior through the real-time acquisition of in-vehicle video and outputs the recognized results to the visual interface of the system operation. Moreover, the system was applied in the real bus, and the state was stable.
5. Conclusions and Discussion
In this work, a novel driver abnormal behavior analysis system was developed to solve the recognition and analysis of driver abnormal behaviors. There are many kinds of abnormal behaviors of drivers, so a library for analyzing the abnormal behaviors of drivers was established. The driver abnormal behavior library, according to the behavior performance of each abnormal action, divides the factors that cause driver abnormal behavior into three categories: natural behavior factors, unnatural behavior factors, and passive behavior factors. Among them, the abnormal behaviors of closing eyes, yawning, and dozing off are natural behavioral factors; smoking, making phone calls, and drinking water are unnatural behavioral factors; and disturbed driving is a passive behavioral factor. Then, two neural network models were established through the representation of the actual scene of the three behaviors, and the driver abnormal behavior caused by natural behavioral factors was identified by a PFLD neural network model based on the detection of facial features. Abnormal driver behavior caused by unnatural behavioral factors and passive behaviors were identified by a target-based YOLOv5 neural network model. Furthermore, an embedded system for analyzing the abnormal behavior of drivers was developed. The purpose of the driver’s abnormal behavior recognition system is to apply to the actual vehicle, therefore, the accuracy and speed of the mobile terminal need to be considered in the research. After a test of the practical application, the precision rate of the abnormal behavior recognition proposed in this paper was more than 95%, in addition, the detection speed could also meet the requirements of real-time.
There are many kinds of abnormal driver behaviors, and the system did not consider other abnormal behaviors of drivers except the seven typical abnormal behaviors of drivers in this study. At the same time, there are many options for the identification of different abnormal behaviors. However, selecting an appropriate detection method for a specific abnormal behavior poses a great challenge to the driver’s abnormal behavior recognition system.
In the future, we will further study the abnormal behavior of drivers based on the actual situation, in addition to considering the abnormal behavior of the driver’s hands off the steering wheel.


