Article

Adaptive Autonomous Robot Navigation by Neutrosophic WASPAS Extensions

Department of Graphical Systems, Vilnius Gediminas Technical University, Sauletekio Ave. 11, LT-10223 Vilnius, Lithuania
*
Author to whom correspondence should be addressed.
Symmetry 2022, 14(1), 179; https://doi.org/10.3390/sym14010179
Submission received: 22 December 2021 / Revised: 2 January 2022 / Accepted: 14 January 2022 / Published: 17 January 2022

Abstract

:
In this research, a novel adaptive frontier-assessment-based environment exploration strategy for search and rescue (SAR) robots is presented. Two neutrosophic WASPAS multi-criteria decision-making (MCDM) method extensions that provide the tools for addressing the inaccurate input data characteristics are applied to measure the utilities of the candidate frontiers. Namely, the WASPAS method built under the interval-valued neutrosophic set environment (WASPAS-IVNS) and the WASPAS method built under the m-generalised q-neutrosophic set environment (WASPAS-mGqNS). The indeterminacy component of the neutrosophic set can be considered as the axis of symmetry, and neutrosophic truth and falsity membership functions are asymmetric. As these three components of the neutrosophic set are independent, one can model the input data characteristics applied in the candidate frontier assessment process, while also taking into consideration uncertain or inaccurate input data obtained by the autonomous robot sensors. The performed experiments indicate that the proposed adaptive environment exploration strategy provides better results when compared to the baseline greedy environment exploration strategies.

1. Introduction

The application of autonomous robots in search and rescue (SAR) missions, can enable the rescue teams to collect on-scene information about the disaster site, without risking the safety of human personnel [1]. One of the key requirements in these missions is robots’ ability to explore the environment and complete multiple high-level objectives without (or only with minimal) intervention from the robot operators [2,3,4]. Therefore, an efficient environment exploration strategy is an important issue that should be addressed.
In general, environment exploration strategies define how autonomous robots move within the initially unknown environment and gather information about its features. If no a priori information about the exploration environment is known, a common approach to this problem is to apply the greedy next-best-view strategies, that interpret the robot-constructed map to determine a set of candidate locations within the partly explored search space and choose the one that should be visited by the robot [5]. By applying these strategies, the decision on where the robot should move next is made on the go and therefore depend only on the current state of the robot and the known environment information.
There are many different strategies that can be applied to assess the candidate locations. However, a popular and easy-to-implement approach that is commonly used as a reference point for algorithm improvement and testing [6,7] is proposed by Yamauchi [8]. The original strategy is based on the frontier assessment approach in which the robot is directed to the closest one. By following this approach, every time the robot reaches the selected frontier, newly acquired environment information is added to the robot-constructed environment map. Then, the list of available frontiers is updated and the process of decision making and moving to the selected candidate frontier is repeated. In theory, when given enough time and applying this strategy, the robot will eventually visit all available frontiers, and consequently, discover all environment information. However, a more efficient approach to the frontier-based environment exploration problem is the assessment of candidates by balancing several competing criteria that define a set of optimisation priorities.
Several papers tackle this problem by introducing multiple strategies for the assessment of the candidates. For example, González-Baños and Latombe [9] propose to assess the utility of a candidate by measuring the distance between the candidate and the robot, while also estimating how much new information could be gained by reaching it. Makarenko et al. [10] propose to assess the candidates by the sum of the information gain utility, the cost utility, and the localization utility. Amigoni and Gallo [11] propose to take into consideration the information overlap, and Visser and Slamet [12] propose to expand the criteria list by taking into account the robot’s ability to communicate. Basilico and Amigoni [5] propose to assess the candidate by applying a set of competing criteria. Namely, the distance to the candidate frontier, the estimated information gain, and the probability to communicate after reaching the candidate. These criteria are combined by applying the MCDM method based on the Choquet integral. Gomez et al. [6] introduce criteria that incorporate the semantic (transit area importance), geometric (the size of the frontier) and topological (the distance that robot must travel) environment information. Selin et al. [13] propose to store and evaluate the potential information gain. Recently, the authors of this paper introduced several strategies for candidate frontier assessment by considering the robot safety-related criteria [14], the need to reach the survivors [15] and explore around the prioritized areas within the environment [16].
Although environment exploration strategies that are based on the candidate assessment approach allow for the possibility to balance multiple competing criteria, the multi-criteria decision-making (MCDM) method application capabilities in complex scenarios are yet to be exhaustively studied, especially if SAR missions are considered. A major issue that should be taken into consideration when deciding on where the robot should move next is the unstable robot movement and path planning performance and the inaccurate input data characteristics that are applied in the decision-making process when exploring the SAR environment. The ability to take into consideration inaccurate input data is a prominent issue that causes researchers to look for modern techniques when dealing with such complex decision-making problems. Therefore, in the field of MCDM problems that cover various real-world selection issues [17,18,19], research is often based on various versions of fuzzy sets, which found many applications in practical and theoretical studies [20,21,22].
The main focus of this research is directed at the performance evaluation of the author-proposed neutrosophic WASPAS method extensions (namely, WASPAS-IVNS [15] and WASPAS-mGqNS [16]) that are applied together with the novel candidate assessment strategy for SAR missions, proposed in this research. The WASPAS method is chosen as a base for an extension due to the stability and wide application of this method in multiple decision-making problems (e.g., in recent years WASPAS method was applied in multiple papers such as [23,24,25], just to name a few). The motivation of this research is to propose a generalized candidate assessment strategy that incorporates multiple SAR mission-related criteria and evaluate the performance of the author-proposed methods within the SAR environment.

2. Neutrosophic WASPAS Extensions

The proposed adaptive environment exploration strategy for SAR missions is built on the frontier-assessment approach and is modelled by applying the three main components: the fuzzy logic controller that selects the appropriate candidate frontier assessment strategy by evaluating the current state of the robot and the known environment information [26]; the multi-criteria decision-making method which measures the utility of a candidate frontier (in this case, WASPAS-IVNS [15] and WASPAS-mGqNS [16] methods are applied individually); and the four novel candidate assessment strategies that are modelled to define the specific SAR robot behaviours. As the main focus of this research is directed at the evaluation of the novel candidate assessment strategies, the fuzzy logic controller is applied as-is, referencing the previous research of the authors.

2.1. The Proposed Candidate Frontier Assessment Strategy

One of the possible approaches for modelling adaptive environment exploration strategies is to enable the robot to switch between the rules that govern the candidate frontier assessment process. When applying the multi-criteria decision-making approach, this can be achieved by defining different criteria optimums and weights to the matching criteria sets. For example, by modelling the criteria set in the way that forces the robot to prioritise the frontiers with the computed path that also enables the robot to reach and monitor detected survivors, the robot will showcase the Altruistic behaviour patterns. However, if the robot prioritises its safety and survivability, the Egoistic candidate assessment strategy is defined.
In this research, eight criteria are proposed for candidate assessment tasks to model technical, social and safety requirements of the autonomous SAR mission. It is also worth noting, that the proposed criteria set is not exhaustive and can be extended by the robot operator by considering other factors that are important in specific SAR missions. The proposed criteria set is constructed from the two subsets—the first subset includes three criteria that were derived from the commonly applied candidate assessment and selection strategies [5,12,14,27,28]. Namely, the amount of new information that could be obtained after reaching the candidate frontier (expressed as the estimated length of a frontier), the cost of reaching the candidate frontier (expressed as the estimated time needed to reach the frontier), and the ability to transmit information from the candidate location to the robot control station (expressed as the Euclidean distance between the candidate and robot control station).
The second subset is constructed from five criteria, that address the technical, safety and social aspects of search and rescue missions, derived from the previous research by the authors. Namely, the current lowest recognition rate of a hypothesised survivor near the computed path (modelled by the shortest distance between the waypoints in the planned path and the survivor), the estimated penalty for following the computed path (measured by applying the penalty-based methodology proposed in [15]), the ratio between the free cells around the frontier and the sample population [16], the Euclidean distance from the frontier to the closest priority location, and the total recognition rate of hypothesised survivors that could be monitored while following the computed path to the candidate frontier.
The latter criterion is maximised to prioritise paths that enable the robot to monitor already discovered survivors. Even if the survivors’ condition is stable, the situation can change at a later time of SAR environment exploration. For example, a nearby dangerous object can change its location along with its area-of-effect zone (e.g., a fire source can expand). Such events should be registered and sent to the rescue teams to enable them to make better decisions. Thus, the ability to monitor survivors should be taken into consideration when modelling environment exploration strategies for SAR missions. In the context of this paper, the criterion value of the total recognition rate of survivors that can be monitored by following the computed path is estimated by measuring the Euclidean distance d v from each waypoint w p i in the planned path R ( p f ( x , y ) i ) to the known survivor locations. If d v < 3   m it is assumed that the survivor is visible to the robot and that its status can be monitored. The estimated survivor recognition rates are then summed.
The final criteria set that defines the frontier assessment strategies is presented in Table 1. The considered variance is applied by the WASPAS-IVNS method and is set considering the parameters of the deployed autonomous SAR robot. Please note that although these parameters are application-specific, they can be modelled to address the uncertainty of the input data characteristics as defined by the experts or robot operators. Here, n w p   represents the number of waypoints that are located in the dangerous areas along the planned path, and n v   represents the number of survivors that can be monitored while moving along the planned path.
The strategies that define the proposed adaptive environment exploration strategy are presented in Table 2. In this research, four main strategies of danger avoidance (DA), restrictive reach survivor (RRS), reach survivor (RS) and information gain (IG) are remodelled and applied by the fuzzy logic controller [26] to decide where the robot should move next.
The implementation of the fuzzy logic controller and the decision-making methods in the proposed adaptive environment exploration strategy is schematically presented in Figure 1.
First, by applying the proposed adaptive environment exploration strategy, the input data are collected from the robot sensors and the environment representation model is updated. As in the original approach [26], the four strategies (DA, RRS, RS, and IG) used in the candidate assessment process are switched depending on the distance between the robot and dangerous areas Ε ( d ) , and the distance between the robot and detected survivors Ε ( s ) . These data are passed to the fuzzification module which maps the parameters to the corresponding membership functions. After the fuzzy inference step, the centre of sums method is applied in the defuzzification module to determine which of the four candidate assessment strategies should be applied at the current stage of the environment exploration process. Then, the appropriate neutrosophic WASPAS extension is applied to assess the candidate frontiers and determine the goal the robot should reach next. This goal is then passed to the robot path planning module and the robot is directed to the selected location. This process is repeated until the mission termination conditions are met (e.g., there are no available frontiers left or the given time limit of the SAR mission has passed).

2.2. Preliminaries of the WASPAS-IVNS and WASPAS-mGqNS Methods

Next, the key definitions of the applied WASPAS-IVNS and WASPAS-mGqNS methods are discussed. Please note, that for the complete neutrosophic algebra operations applied by these methods, please refer to the original research papers by the authors [15,16].
Definition 1. 
The Interval-valued neutrosophic set IVNS [29] is defined by the three independent membership functions: the truth membership— T i v ( x ) , the indeterminacy membership— I i v ( x ) , and the falsity membership function— F i v ( x ) . The neutrosophic set components of truth and falsity membership are asymmetric, and the indeterminacy component can be considered as the axis of symmetry. These independent components can be modelled by taking into consideration the problem of inaccurate and incomplete input data characteristics, that can have a significant impact on the quality of the candidate frontier assessment process.
Definition 2. 
The interval-valued neutrosophic set can be defined as:
I V N S = { T i v ( x ) , I i v ( x ) , F i v ( x )   : x   X } ,
where the three independent membership functions fulfil the following conditions:
T i v ( x ) = [ T i v ( x ) , T i v ( x ) + ] [ 0 ,   1 ] ;
I i v ( x ) = [ I i v ( x ) , I i v ( x ) + ] [ 0 ,   1 ] ;
F i v ( x ) = [ F i v ( x ) , F i v ( x ) + ] [ 0 ,   1 ] ;
0   T i v ( x ) + + I i v ( x ) + + F i v ( x ) + 3 .
Definition 3. 
The interval-valued neutrosophic number (IVNN) can be defined as:
N i v = [ t i v ,   t i v + ] , [ i i v , i i v + ] , [ f i v , f i v + ] .
Definition 4. 
The interval-valued neutrosophic numbers can be compared by applying the following score  S ( Q ) , accuracy  a ( Q ) , and certainty  c ( Q ) functions:
S ( Q ) = [ t i v + 1 i i v + + 1 f i v + ,   t i v + + 1 i i v + 1 f i v ] ;
a ( Q ) = [ m i n { t i v f i v ,   t i v + f i v + } , m a x { t i v f i v ,   t i v + f i v + } ] ;
c ( Q ) = [ t i v ,   t i v + ] .
Definition 5. 
The comparison between the interval-valued neutrosophic numbers can be performed by applying the degree of probability p, when:
I f   p ( S ( Q 1 ) S ( Q 2 ) ) > 0.5 ,   t h e n   Q 1 Q 2 ; I f   p ( S ( Q 1 ) S ( Q 2 ) ) = 0.5   a n d   p ( a ( Q 1 ) a ( Q 2 ) ) > 0.5 ,   t h e n   Q 1 Q 2 ; I f   p ( S ( Q 1 ) S ( Q 2 ) ) = 0.5   a n d   p ( a ( Q 1 ) a ( Q 2 ) ) = 0.5 ,   a n d   p ( c ( Q 1 ) c ( Q 2 ) ) > 0.5 ,   t h e n   Q 1 Q 2 ; I f   p ( S ( Q 1 ) S ( Q 2 ) ) = 0.5   a n d   p ( a ( Q 1 ) a ( Q 2 ) ) = 0.5 ,   a n d   p ( c ( Q 1 ) c ( Q 2 ) ) = 0.5 ,   t h e n   Q 1 Q 2 .
Definition 6. 
The degree of probability p is measured by applying the following function:
p ( S ( Q 1 ) S ( Q 2 ) ) = max { 1 max ( S ( Q 2 ) + S ( Q 1 ) ( S ( Q 1 ) + S ( Q 1 ) ) + ( S ( Q 2 ) + S ( Q 2 ) ) , 0 ) , 0 } .
The degrees of accuracy and certainty are measured by applying the equivalent approach.
Smarandache considered the neutrosophic set as the generalisation of various fuzzy sets [30], highlighting the possibility of a generalised neutrosophic set that includes the benefits of all the considered fuzzy sets. Next, the key definitions of the applied WASPAS-mGqNS method, which is modelled by applying this concept, are discussed.
Definition 7. 
The m-generalized q-neutrosophic set (mGqNS) is defined by the three independent m-generalized q-neutrosophic memberships: the truth membership— T m q ( x ) , the indeterminacy membership— I m q ( x ) , and the falsity membership— F m q ( x ) .
Definition 8. 
The m-generalized q-neutrosophic set (mGqNS) is defined as:
m G q N S = { T m q ( x ) , I m q ( x ) , F m q ( x ) : x X } ,
where the three membership functions also satisfy the conditions:
T m q ( x ) , I m q ( x ) , F m q ( x ) : X [ 0 ,   r ] ,   ( 0 r 1 ) ;
0   ( T m q ( x ) ) q + ( I m q ( x ) ) q + ( F m q ( x ) ) q 3 m ;
m = 1   o r   3 ;   q 1 .
Definition 9. 
The m-generalized q-neutrosophic number (mGqNN) is defined by:
N m q = t m q , i m q , f m q .
Definition 10. 
The score function for the m-generalized q-neutrosophic set can be defined by:
S ( N m q ) = 3 + 3 t m q q 2 i m q q f m q q   6 .
Next, the key steps of the WASPAS [31] multi-criteria decision-making method, which defines the core of the proposed environment exploration strategy (and is also applied while modelling the author-proposed WASPAS-IVNS and WASPAS-mGqNS methods) are discussed.
Step 1. The first step of the considered WASPAS-IVNS and WASPAS-mGqNS methods is the computation of the decision matrix D . Each element of the decision matrix is denoted as [ d ] i j , where i = 1 , 2 , , n is the index of a candidate, and j = 1 , 2 , , k is the index of a criterion.
Step 2. Then, the normalization of the decision matrix elements is performed. The normalization for the WASPAS-IVNS is performed by the following functions:
[ d i v ] i j = [ d i v ] i j   max [ d i v ] i j k ,   [ d i v ] i j + = [ d i v ] i j +   max [ d i v ] i j k ,
and the element normalization for the WASPAS-mGqNS method is performed by:
[ d m q ] i j = [ d m q ] i j j = 1 k ( [ d m q ] i j ) 2 .
Step 3. The normalized matrix elements are converted to the neutrosophic form by applying the conversion method defined in [32]. After this step, the elements of the decision matrix obtain their neutrosophic form of [ d ¯ i v ] i j = [ t i v ,   t i v + ] , [ i i v , i i v + ] , [ f i v , f i v + ] (for WASPAS-IVNS) or [ d ¯ m q ] i j = t m q , i m q , f m q (for WASPAS-mGqNS).
Step 4. The first objective of the WASPAS method is obtained by the following function:
Q i ( 1 ) = ( j = 1 O m a x [ d ¯ ] i j w j ) + ( j = 1 O m i n [ d ¯ ] i j w j ) c .
where O m a x and O m i n represent the groups of maximized and minimized criteria, respectively, [ d ¯ ] i j represents an element of a decision matrix in its neutrosophic form, and w j is the criterion weight.
Step 5. The second objective of the WASPAS method is obtained by:
Q i ( 2 ) = ( j = 1 O m a x ( [ d ¯ ] i j ) w j   ) ( j = 1 O m i n ( [ d ¯ ] i j ) w j   ) c .
where the component definitions are identical to the ones presented in Step 4.
Step 6. The joint generalized value of the WASPAS method is obtained by:
Q i = 0.5 Q i ( 1 ) + 0.5 Q i ( 2 ) .
Step 7. Finally, by applying the score functions presented by Definitions 4–6 (for the WASPAS-IVNS method) and Definition 10 (for the WASPAS-mGqNS method), the neutrosophic values obtained in step 6 of the WASPAS method are converted to the crisp score values. Then, the candidate frontier with the highest utility score is selected as the next goal the robot should reach.

3. Assessment of the Proposed Environment Exploration Strategy

3.1. Setup of the Case Study

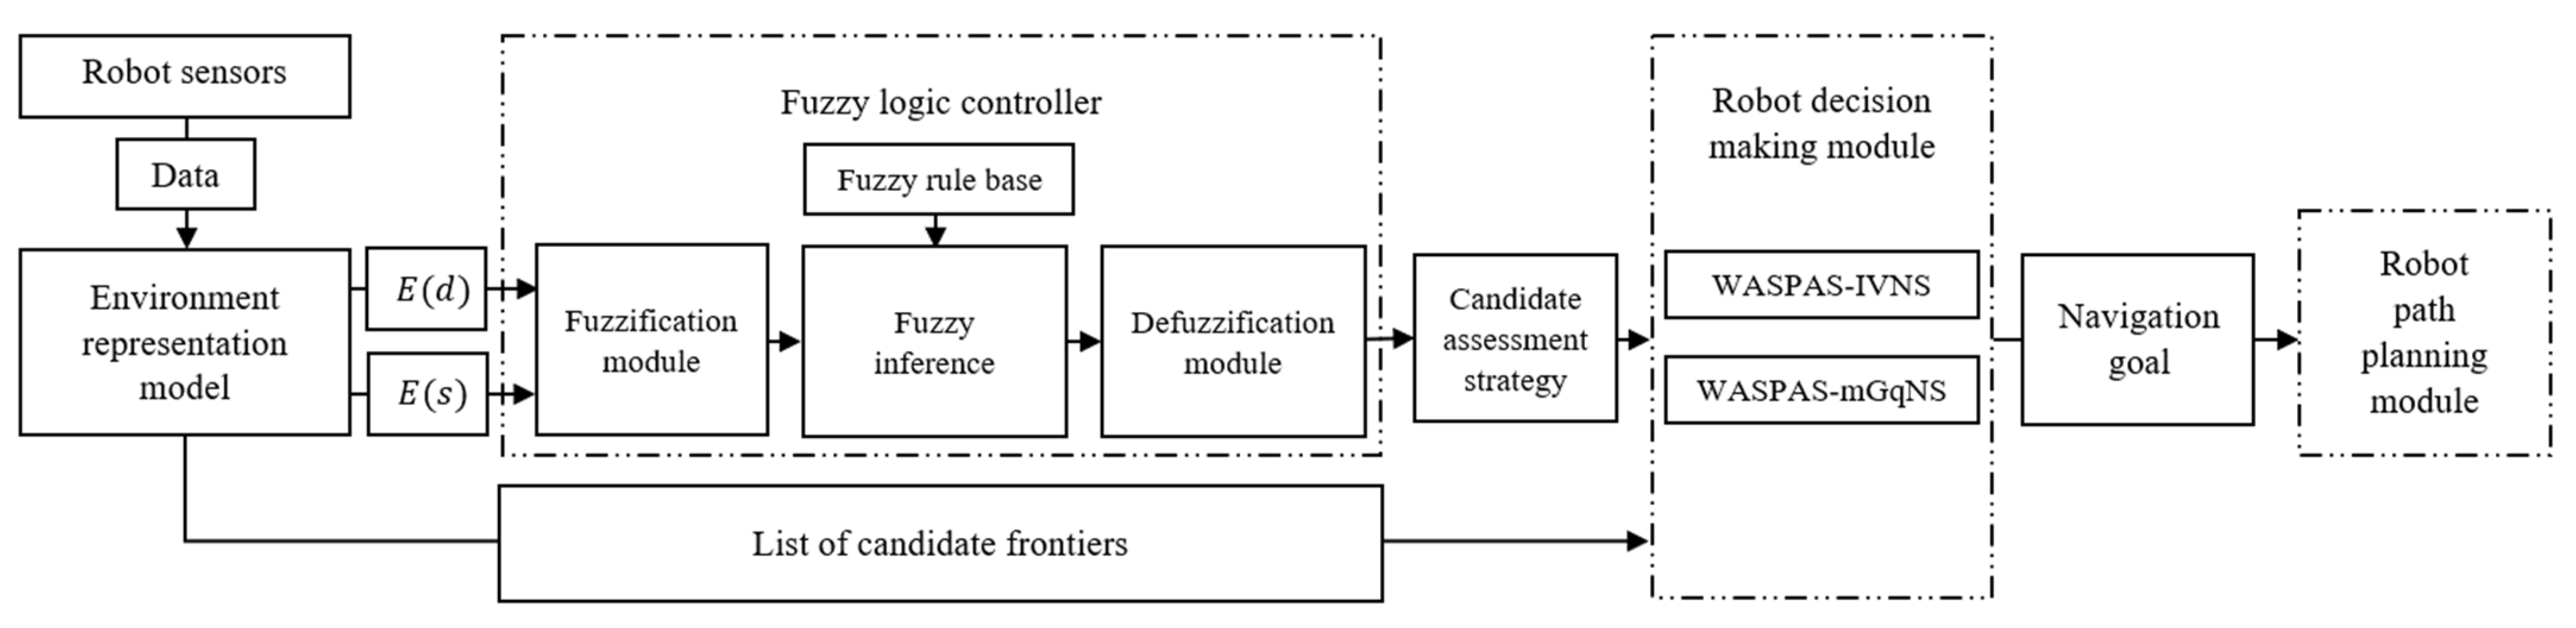
The proposed autonomous environment exploration strategy is implemented into the simulated multi-purpose four-wheeled Pioneer 3-AT robot. This robot platform is chosen due to its extensive application in the context of academic autonomous mobile robot research, including the field of search and rescue missions. The Robot Operating System (ROS) provided libraries and packages are applied to set up robot navigation stack and other core components, including environment perception, localisation, movement, and mapping modules. However, the navigation stack is extended by implementing the proposed autonomous environment exploration strategy which is introduced in the Section 2 of this paper.
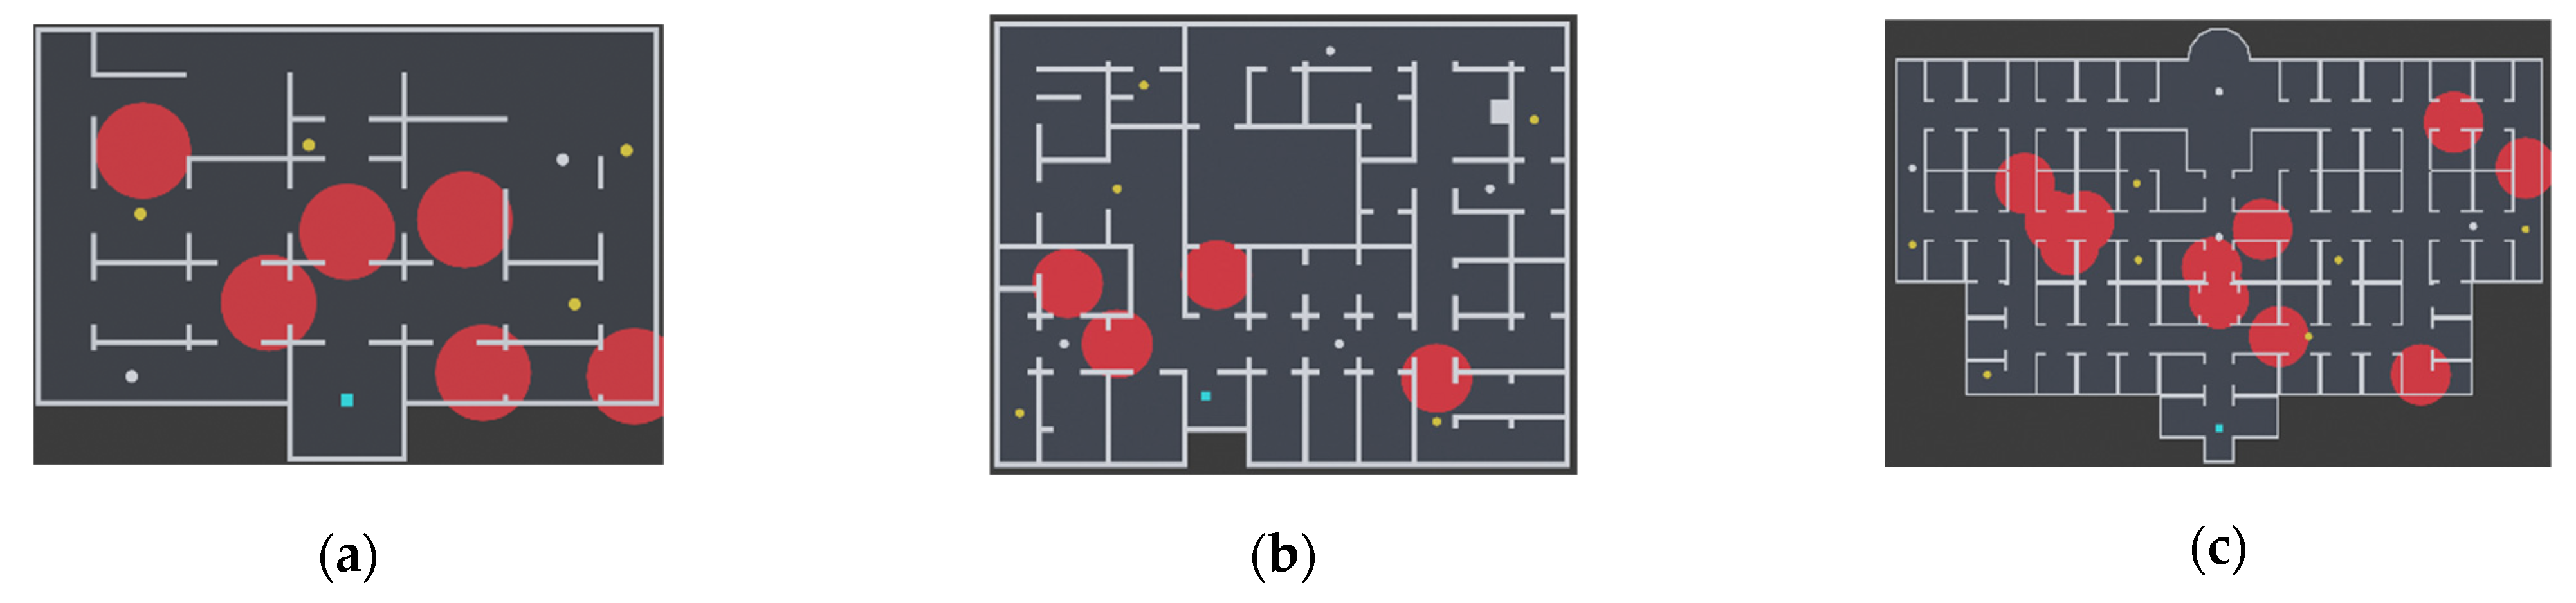
The proposed environment exploration strategy is evaluated in the three simulated indoor environments that represent hypothetical disaster sites. The structures of these environments are presented in Figure 2. Here, the blue squares represent the robot starting positions. The red markers represent dangerous areas with a diameter of 4 m that the robot must avoid. The yellow markers represent the survivors the robot must reach. Lastly, the white markers represent priority locations set by the robot operators.
The 1st environment (a) represents the SAR environment with multiple open spaces. This topology allows the robot to move to any room within the exploration space without any need for backtracking. The 2nd environment (b) represents an environment with clearly separated left and right areas. This topology should force the robot to show backtracking behaviour as there is only one path that connects both areas. Finally, the 3rd environment (c) represents an environment with a mirrored loop-type topology. In this kind of topology, the robot can visit multiple areas while moving between the connecting corridor loops. To simplify the simulation, it is assumed that in all three environments, survivors and dangerous areas do not change their locations during the simulation. It is also worth noting, that the autonomous robot must cancel its current task and reach the detected survivor if it is nearby. If there are two or more unvisited objects near the autonomous robot, specifically, the hypothesised survivors or prioritised locations, the robot will always try to reach the closest survivor first. The survivor is considered successfully reached when the distance between it and the robot is less than 1.5 m [33]. The environment exploration process is continued until one of the mission termination conditions are met, that is if the 10-min simulation-time window has elapsed or the robot has visited all the priority locations. In total, twenty simulation runs are performed for each strategy.
To perform the comparison between the proposed strategy and the baseline environment exploration methods, five parameters are considered. Namely, the robot travelled distance, the amount of the discovered environment information, the amount of received penalty, the ratio between the robot travelled distance and the discovered information, and the ratio between the received penalty points and the discovered information. The main goals of this assessment are:
  • To test the performance and the stability of the WASPAS-IVNS and WASPAS-mGqNS methods against the state-of-the-art WASPAS-SVNS [32] method in simulated SAR missions.
  • To test the capabilities of the proposed environment exploration strategy in the simulated search and rescue mission and compare the results against the baseline frontier-assessment methods, namely, the Closest Frontier (CF) strategy, and the Standard Information Gain (SIG) strategy.
By applying the CF strategy, the decision on where the robot should move next is based only on the estimated time that is needed to reach the candidate frontier. The SIG strategy is based on the multi-criteria decision-making approach and is derived from previously discussed candidate assessment strategies [5,12,14,27,28]. The criteria that define the SIG strategy along with their optimums and weights are presented in Table 3. The utility of a candidate is measured by applying the state-of-the-art WASPAS-SVNS method.

3.2. Assessment of the WASPAS-IVNS and WASPAS-mGqNS Methods

The performance of the WASPAS-IVNS and WASPAS-mGqNS methods in SAR missions is first compared against the state-of-the-art WASPAS-SVNS method. The tested methods are expected to introduce slight differences in the robot performance when comparing the previously discussed parameters of the average amount of gained information, the average penalty received by the robot for traversing dangerous areas, and the average of robot travelled distance. However, the proposed methods should provide similar results when compared to the WASPAS-SVNS method, meaning, that the obtained variations between the results should mostly be insignificant, regardless of the increased (or decreased) robot performance. The simulation results are presented in Table 4.
The obtained results indicate that the WASPAS-IVNS and WASPAS-mGqNS methods provide similar results when compared to the state-of-the-art WASPAS-SVNS method. In the 1st environment, the robot discovered the same amount of information and travelled an almost identical distance (with a 4–6% value increase between the results, when applying WASPAS-IVNS and WASPAS-mGqNS methods, respectively). Similar results were obtained in the 2nd and 3rd environments. In the 2nd environment, the amount of discovered information was increased by up to 1%, and the amount of travelled distance varied from a 1% decrease to 1% increase when applying WASPAS-IVNS and WASPAS-mGqNS methods, respectively. In the 3rd environment, the value of the robot travel distance was decreased by 4.5–6.5%, when applying WASPAS-IVNS and WASPAS-mGqNS methods. As the obtained results are relatively similar, an ANOVA statistical analysis test was performed to assess the significance of the observed variations. The obtained p values are presented in Table 5.
The p values indicate that there is no statistical significance between the slight variations of the results by the state-of-the-art WASPAS-SVNS method and the WASPAS-IVNS method. However, the decrease in average robot travel distance by 6.5% and the average penalty for traversing dangerous areas by up to 63% in the 3rd environment by WASPAS-mGqNS method, can be considered as significant. Considering this result, it could be reasoned that in different topology SAR environments, the WASPAS-IVNS and WASPAS-mGqNS methods provide as stable results as the state-of-the-art WASPAS-SVNS method, while also making it possible to deal with the inaccuracies in the input data characteristics. This ability enables the robot to make slightly better decisions which, due to the applied frontier-based environment exploration approach, can have a long-term impact on the robot performance.
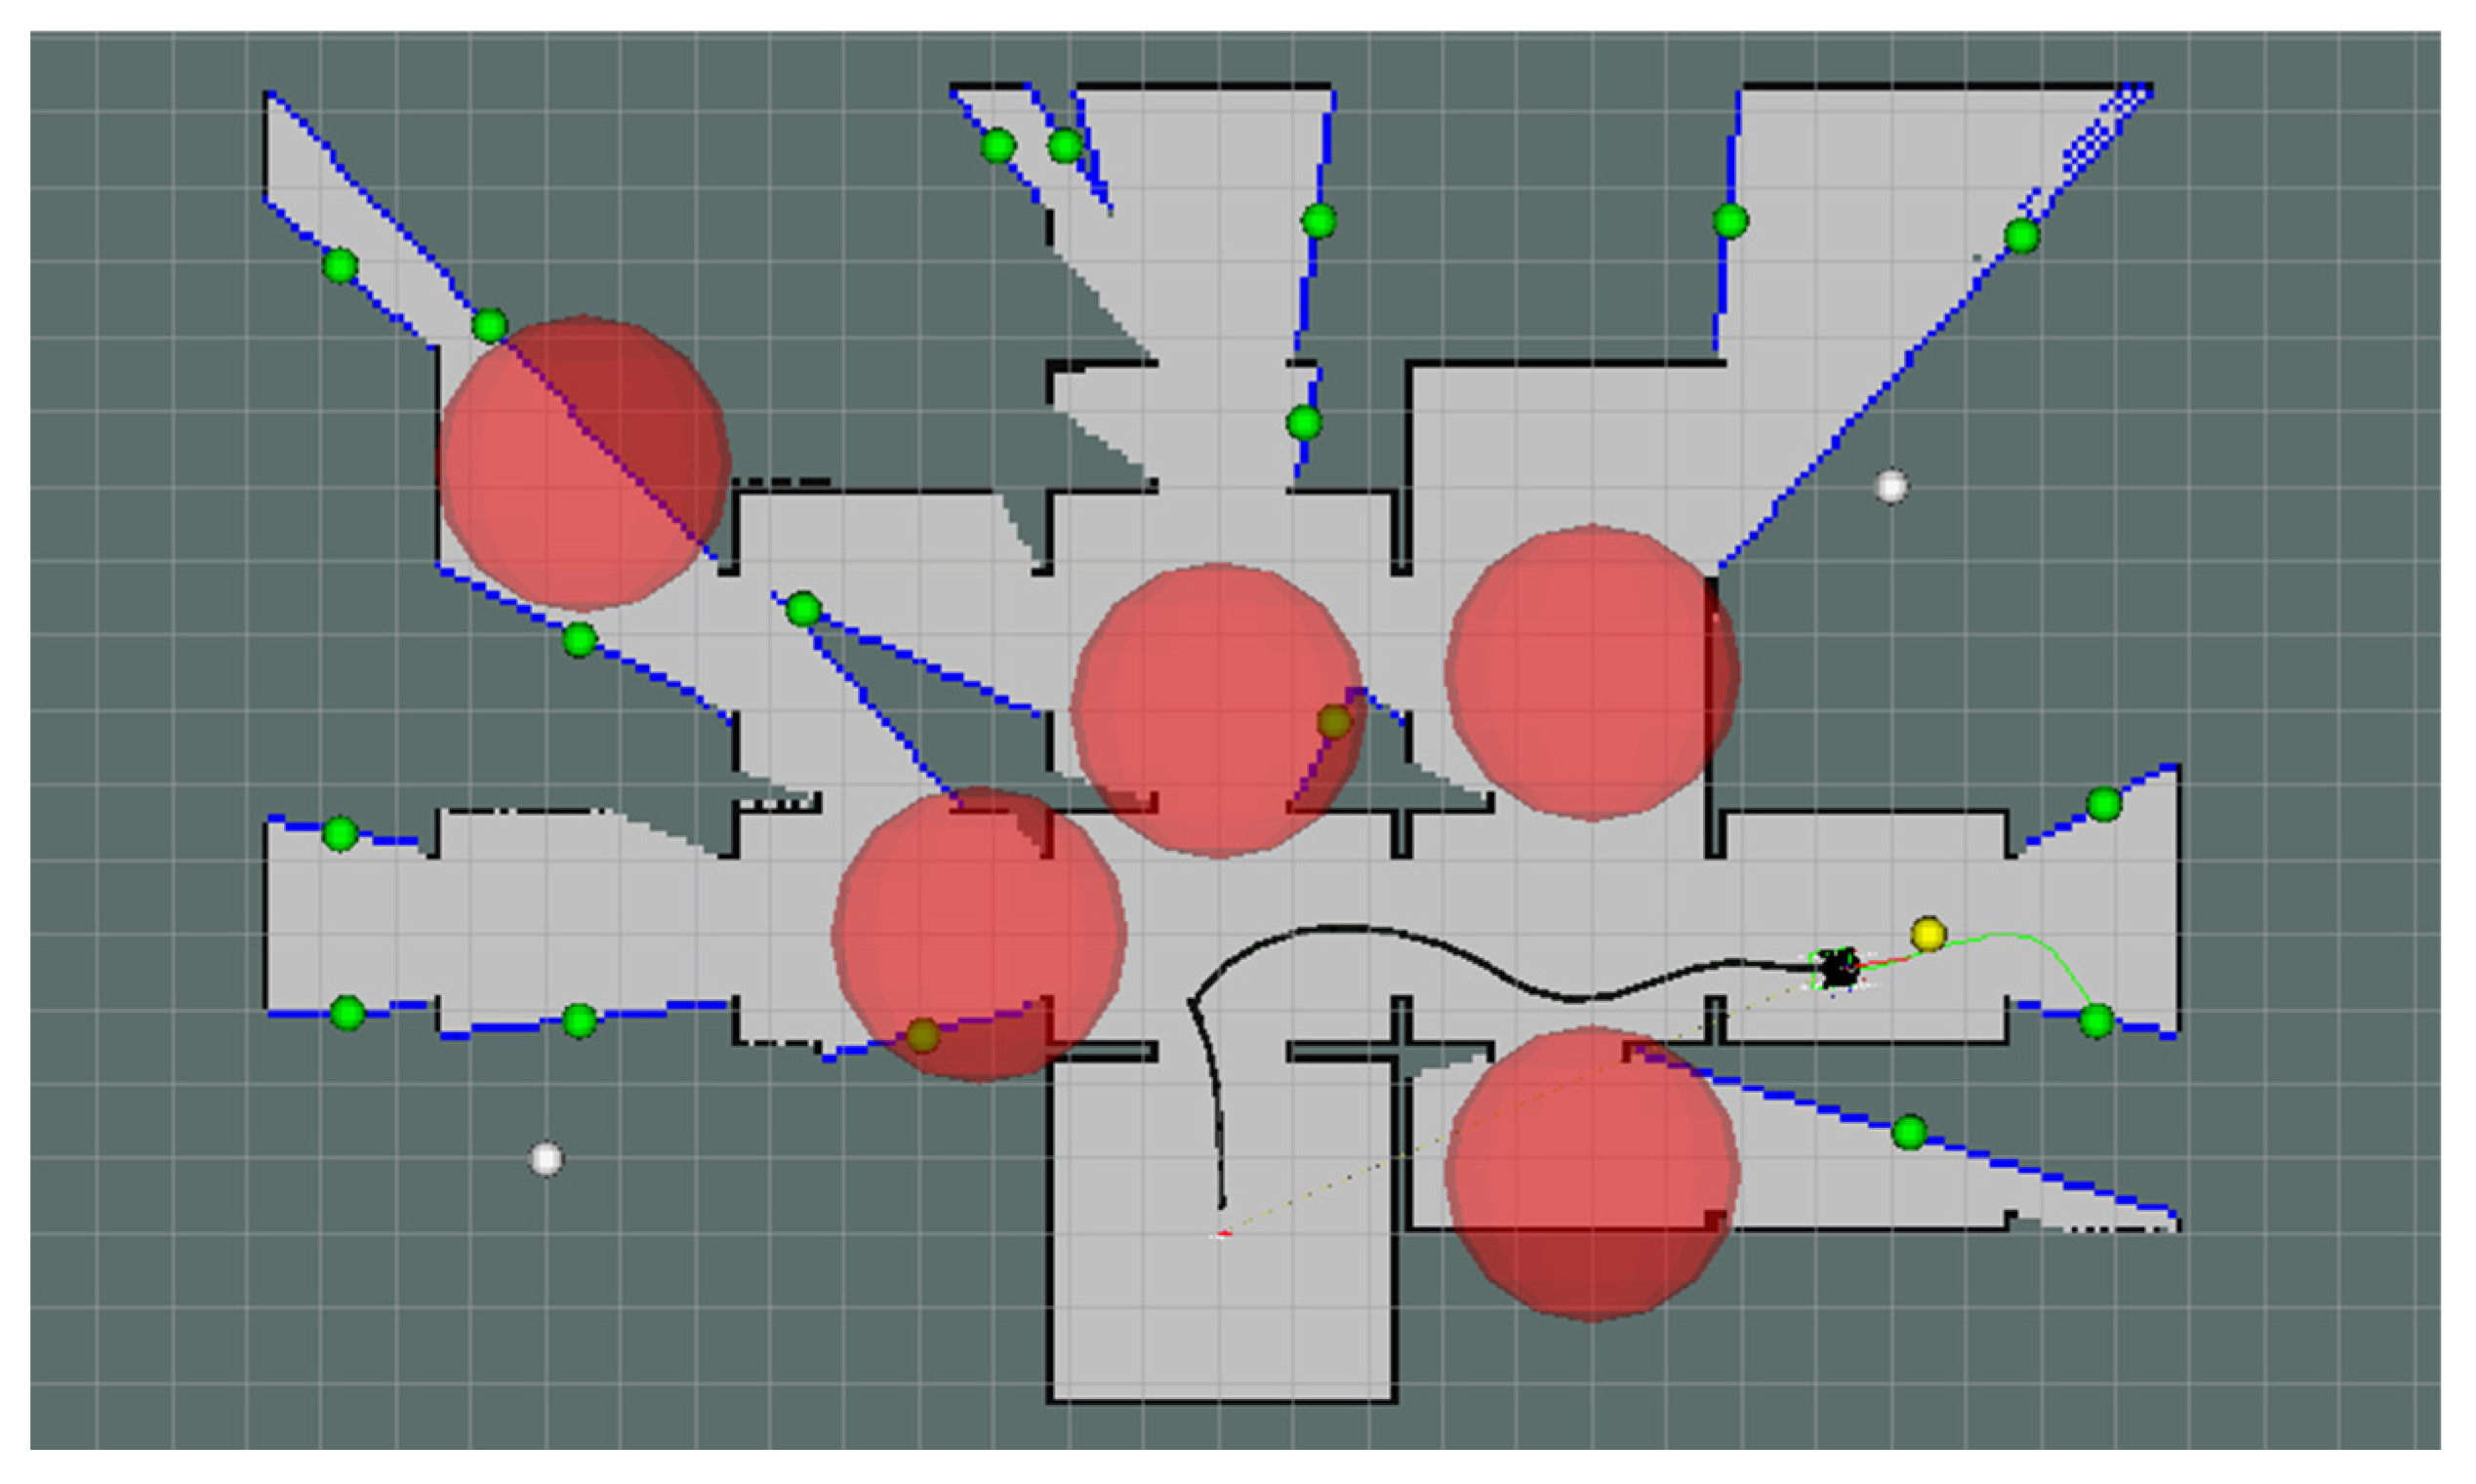
The ability to take into consideration the inaccurate input data characteristics and lead the robot to different frontiers is highlighted by providing a solution to a frontier assessment problem, presented in Figure 3. Here, the robot’s position is marked by a black square. The frontier regions are marked by blue lines of grid map cells that are located between the known and the unknown exploration space. The green markers indicate the candidate frontiers. The white markers represent the priority locations, set by the robot operators. The yellow markers represent the detected survivors, and the red markers indicate dangerous areas.
In the considered frontier assessment problem, the robot must measure the utility of 18 candidate frontiers and select the one that should be reached next. The initial decision matrix constructed for the considered frontier assessment problem is presented in Table 6. It is worth noting, that in this example there are no survivors that can be taken into consideration for the monitoring task, meaning that the c 5 criterion has no influence in the decision-making process. Therefore, to address the specifics of the neutrosophic set algebra, the criterion value is set to a small positive number. Furthermore, to avoid indecisive robot behaviour, the c 6 criterion value is set to a high randomised value when the robot is very close to the confirmed survivor. This is done so the robot would prioritise the survivors that are yet to be visited.
Next, the criteria values of the initial decision matrix are normalised and converted to the neutrosophic numbers by applying the methodologies presented in Section 2 of this paper. Then, the products of the first and second WASPAS objectives are computed for each MCDM method that is tested, namely, for the WASPAS-SVNS, WASPAS-IVNS and WASPAS-mGqNS. Then, the results of the first and the second WASPAS objectives are summed to obtain the joint generalized value of the WASPAS method. Finally, the utility of each candidate frontier is measured and ranked by applying the WASPAS-SVNS, WASPAS-IVNS and WASPAS-mGqNS score functions. The candidate frontier with the highest utility score is then chosen as the next optimal goal the exploring robot should reach. The frontier utilities obtained in this step are presented in Table 7.
Considering the computed utility scores, it can be observed that the candidate frontier f 1 is determined as the highest-valued frontier by the WASPAS-SVNS and WASPAS-mGqNS methods. However, when the assessment is performed by applying the WASPAS-IVNS method, the frontier f 2 is chosen as the next goal the robot should reach (this frontier is assumed to be the second-best by WASPAS-SVNS and WASPAS-mGqNS methods). A similar value switch of the candidate ranks is also observed when considering the frontiers ranked at the 3rd and the 4th place. This example highlights how the proposed methods can take into consideration the possible inaccuracies in the input data characteristics and consequently make better assessments when comparing similar candidates. Next, the results obtained by testing the proposed environment exploration strategy in all three simulated environments are discussed and compared against the baseline SIG and CF strategies.

3.3. Comparison of the Environment Exploration Strategies

The proposed environment exploration strategy which applies the fuzzy logic controller and either the proposed WASPAS-IVNS or WASPAS-mGqNS method for computing the utility of a candidate frontier is compared against the Closest Frontier strategy (CF) and the standard information-gain strategy (SIG). It is anticipated that the proposed adaptive environment exploration strategy will significantly increase the robot performance on all of the considered aspects: will increase the amount of the discovered environment information, reduce the robot travelled distance and reduce the robot-received penalty for traversing dangerous areas. To test this hypothesis, all strategies are applied individually when exploring the three previously introduced SAR environments. The averaged results obtained in these simulations are presented in Table 8.
Considering the obtained results, the discovered information in the 1st environment is similar when comparing the four strategies. As the environment is relatively small the robot can discover its characteristics simply by reaching every available frontier within the set mission time limit, regardless of the applied strategy. Therefore, the important comparison metric in this type of environment is not the amount of discovered information, but rather the ability to balance multiple optimisation priorities, modelled by applying the proposed criteria set. For example, the robot travel distance or the penalty received for crossing dangerous areas.
Considering the penalty for crossing dangerous areas this value is reduced by 87.44% and 87.07% when comparing the proposed strategy which applies the WASPAS-IVNS method to the SIG and CF strategies. Similar results are observed when comparing the proposed strategy that applies the WASPAS-mGqNS method to the SIG and CF strategies. This average is reduced by 89.80% and 89.50%, respectively. By applying the proposed environment exploration strategy, the robot travel distance in this environment is reduced by 8.84–11.46%.
However, the amount of distance travelled by the robot is increased in the 2nd environment, as due to the environment topology the autonomous robot must traverse already visited areas multiple times. When comparing the SIG and CF strategies to the proposed environment exploration strategy by applying the WASPAS-IVNS method, the increase in travelled distance of 3.8% and 18.17% is observed. Similarly, the increase of 6.19% and 20.95% is observed, when the baseline strategies are compared to the proposed strategy that applies the WASPAS-mGqNS method.
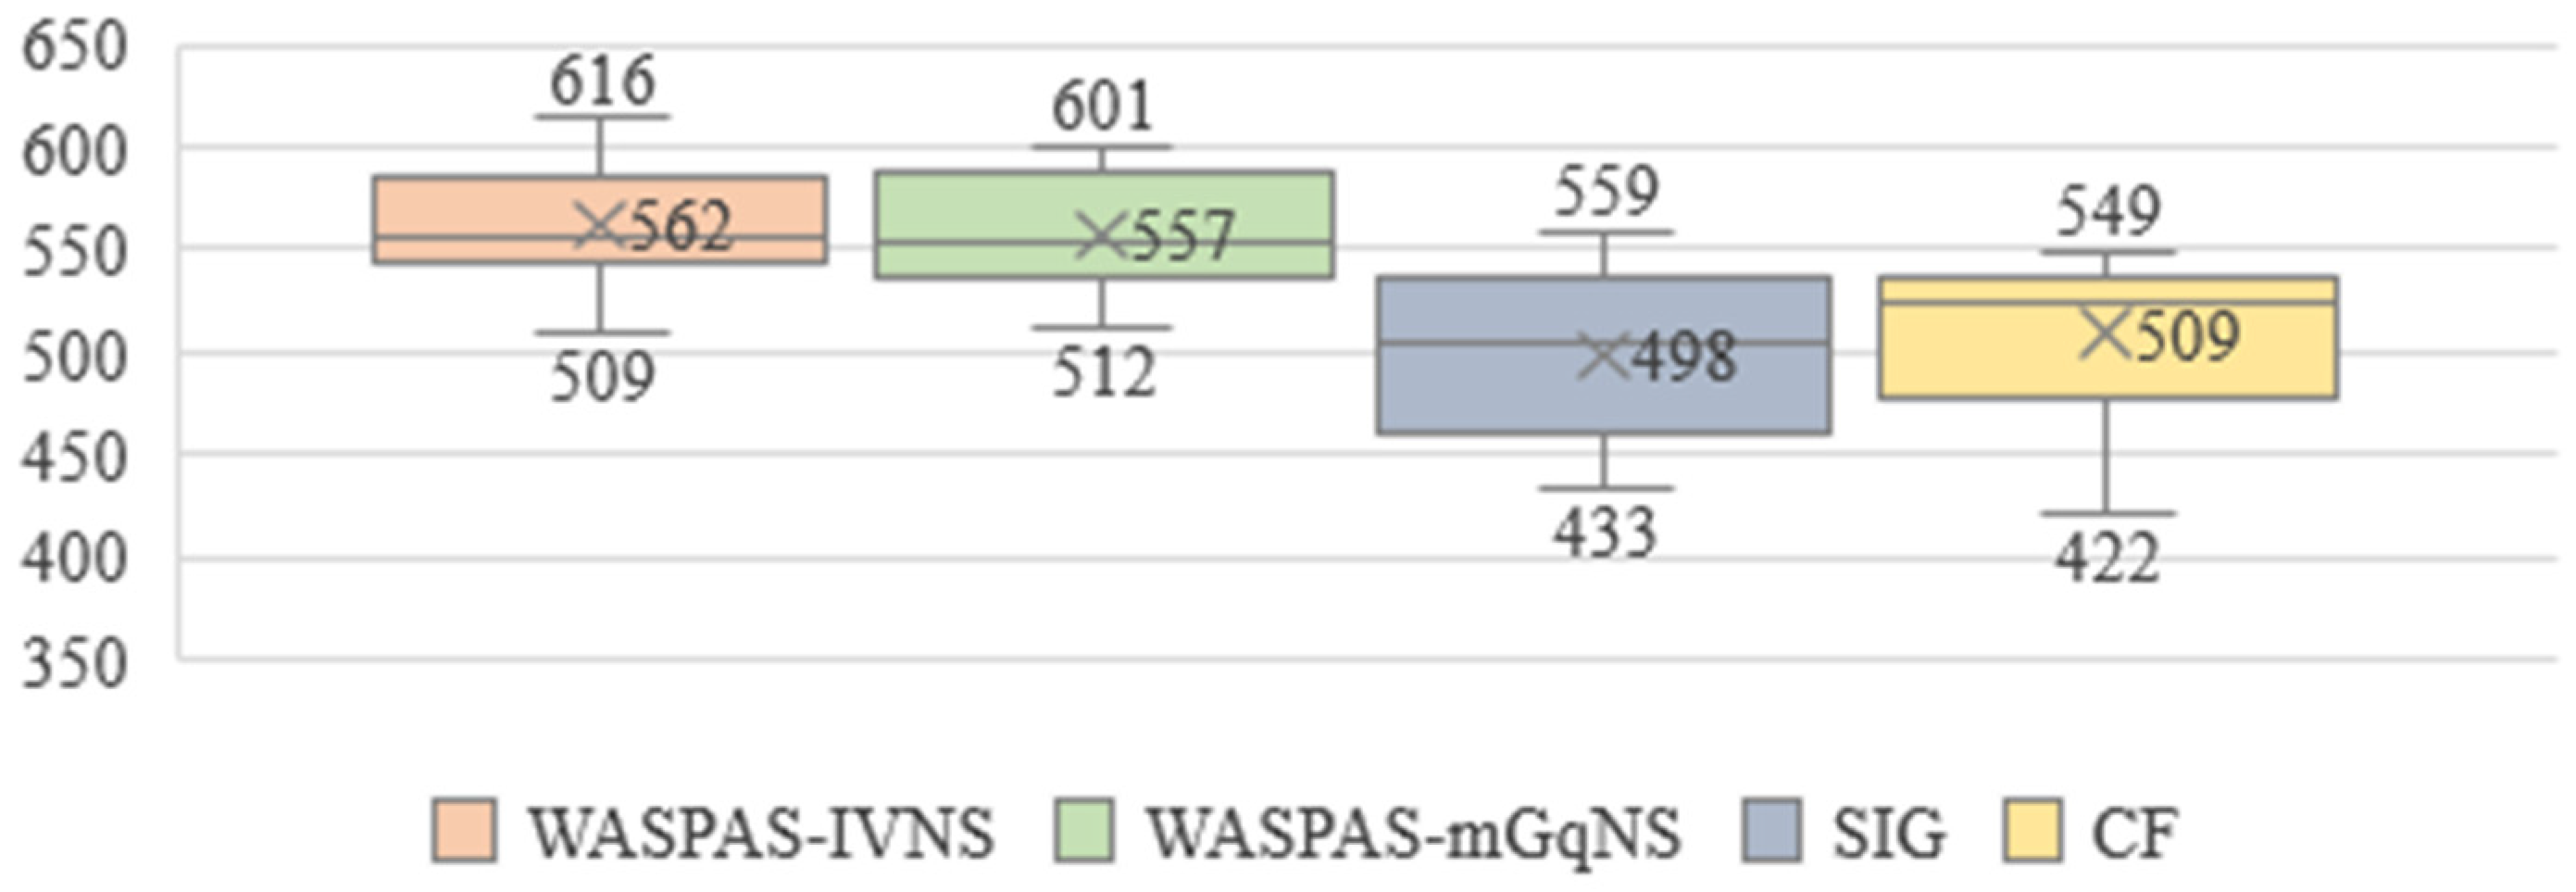
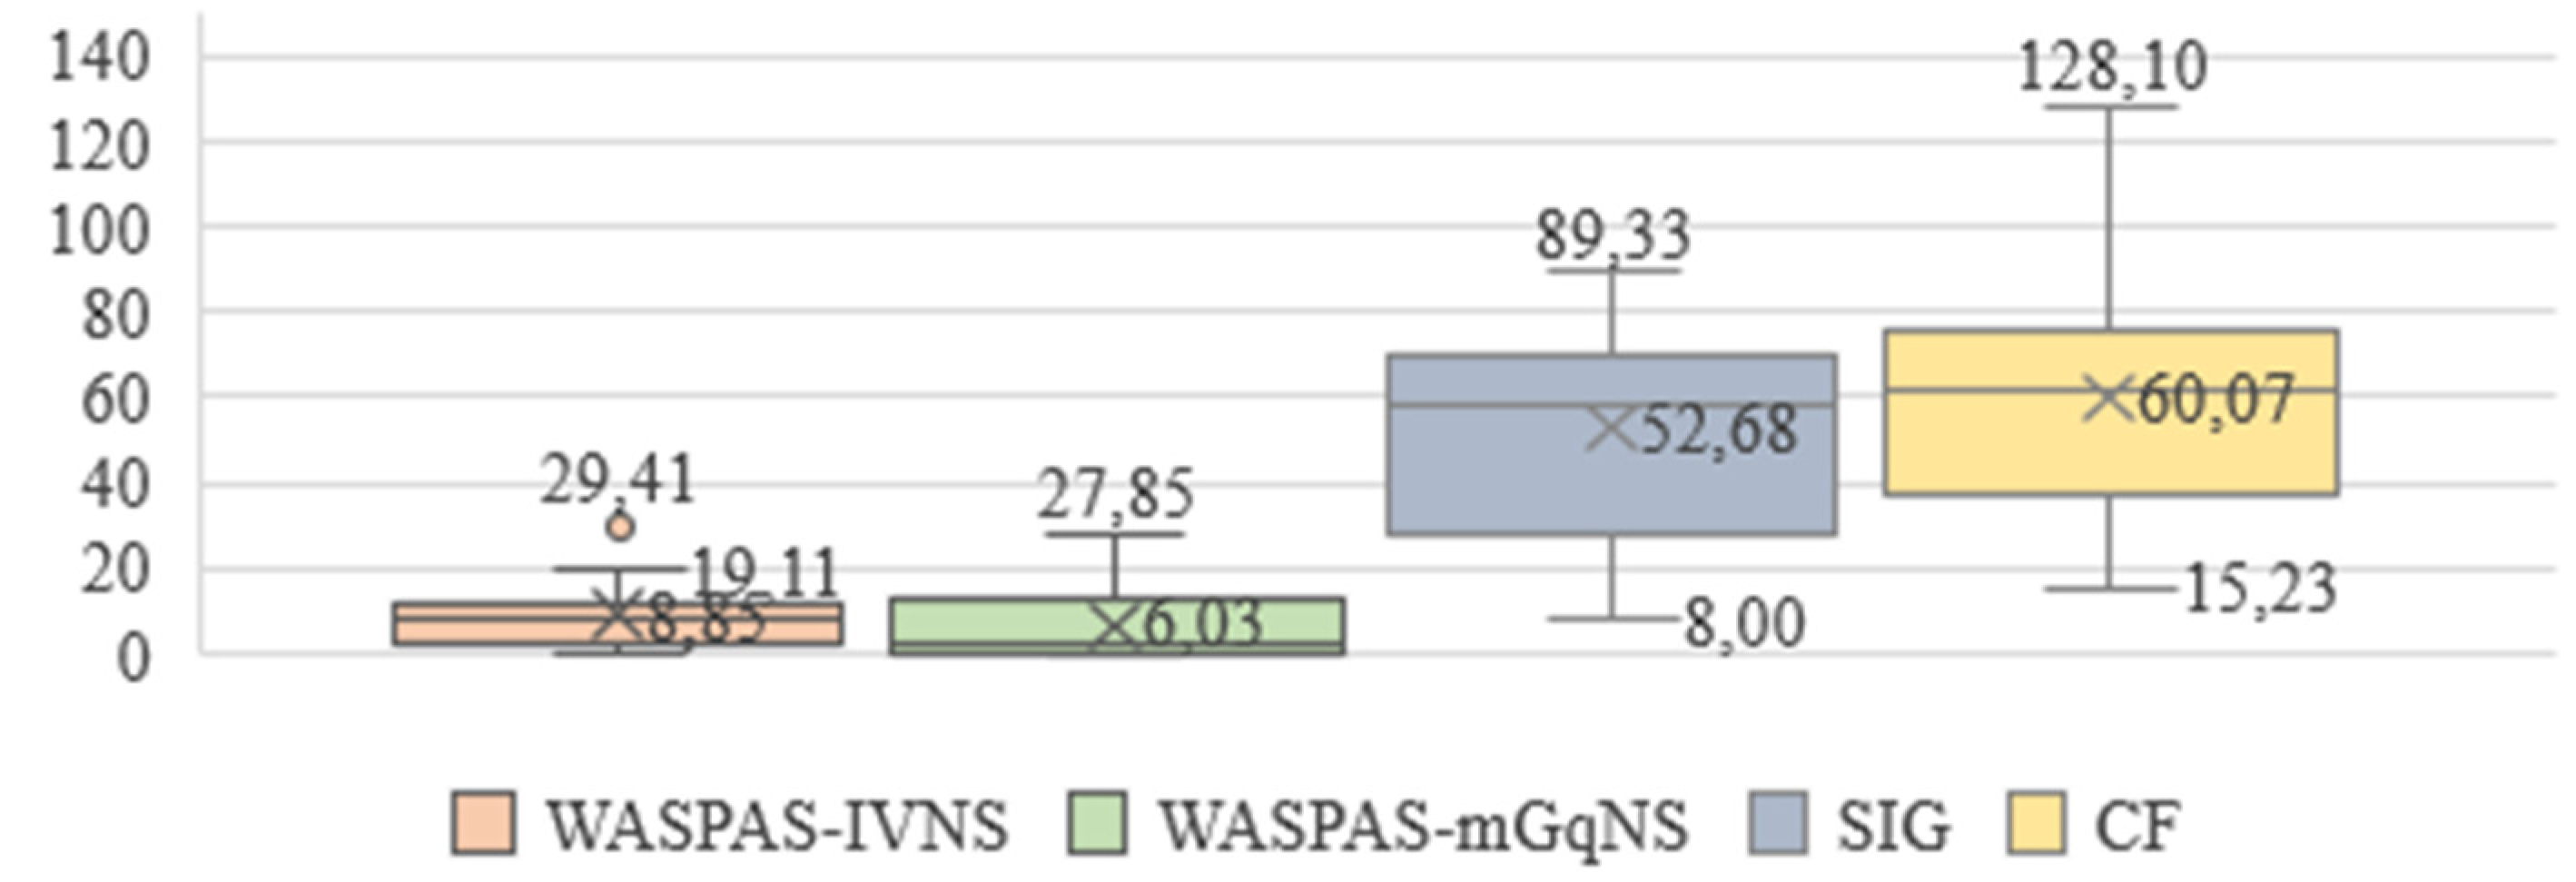
Nevertheless, the proposed environment exploration strategy increased the average of the discovered environment information by up to 9.51–12.69%. The amount of the discovered information in the 2nd environment is presented in Figure 4. Here, the maximum value obtained by applying the SIG strategy is just slightly above the average, obtained by the proposed environment exploration strategy, when applying the WASPAS-mGqNS method. The minimum value, obtained by the proposed strategy when applying WASPAS-IVNS is just above the average obtained by the SIG strategy and is equal to the average obtained by the CF strategy.
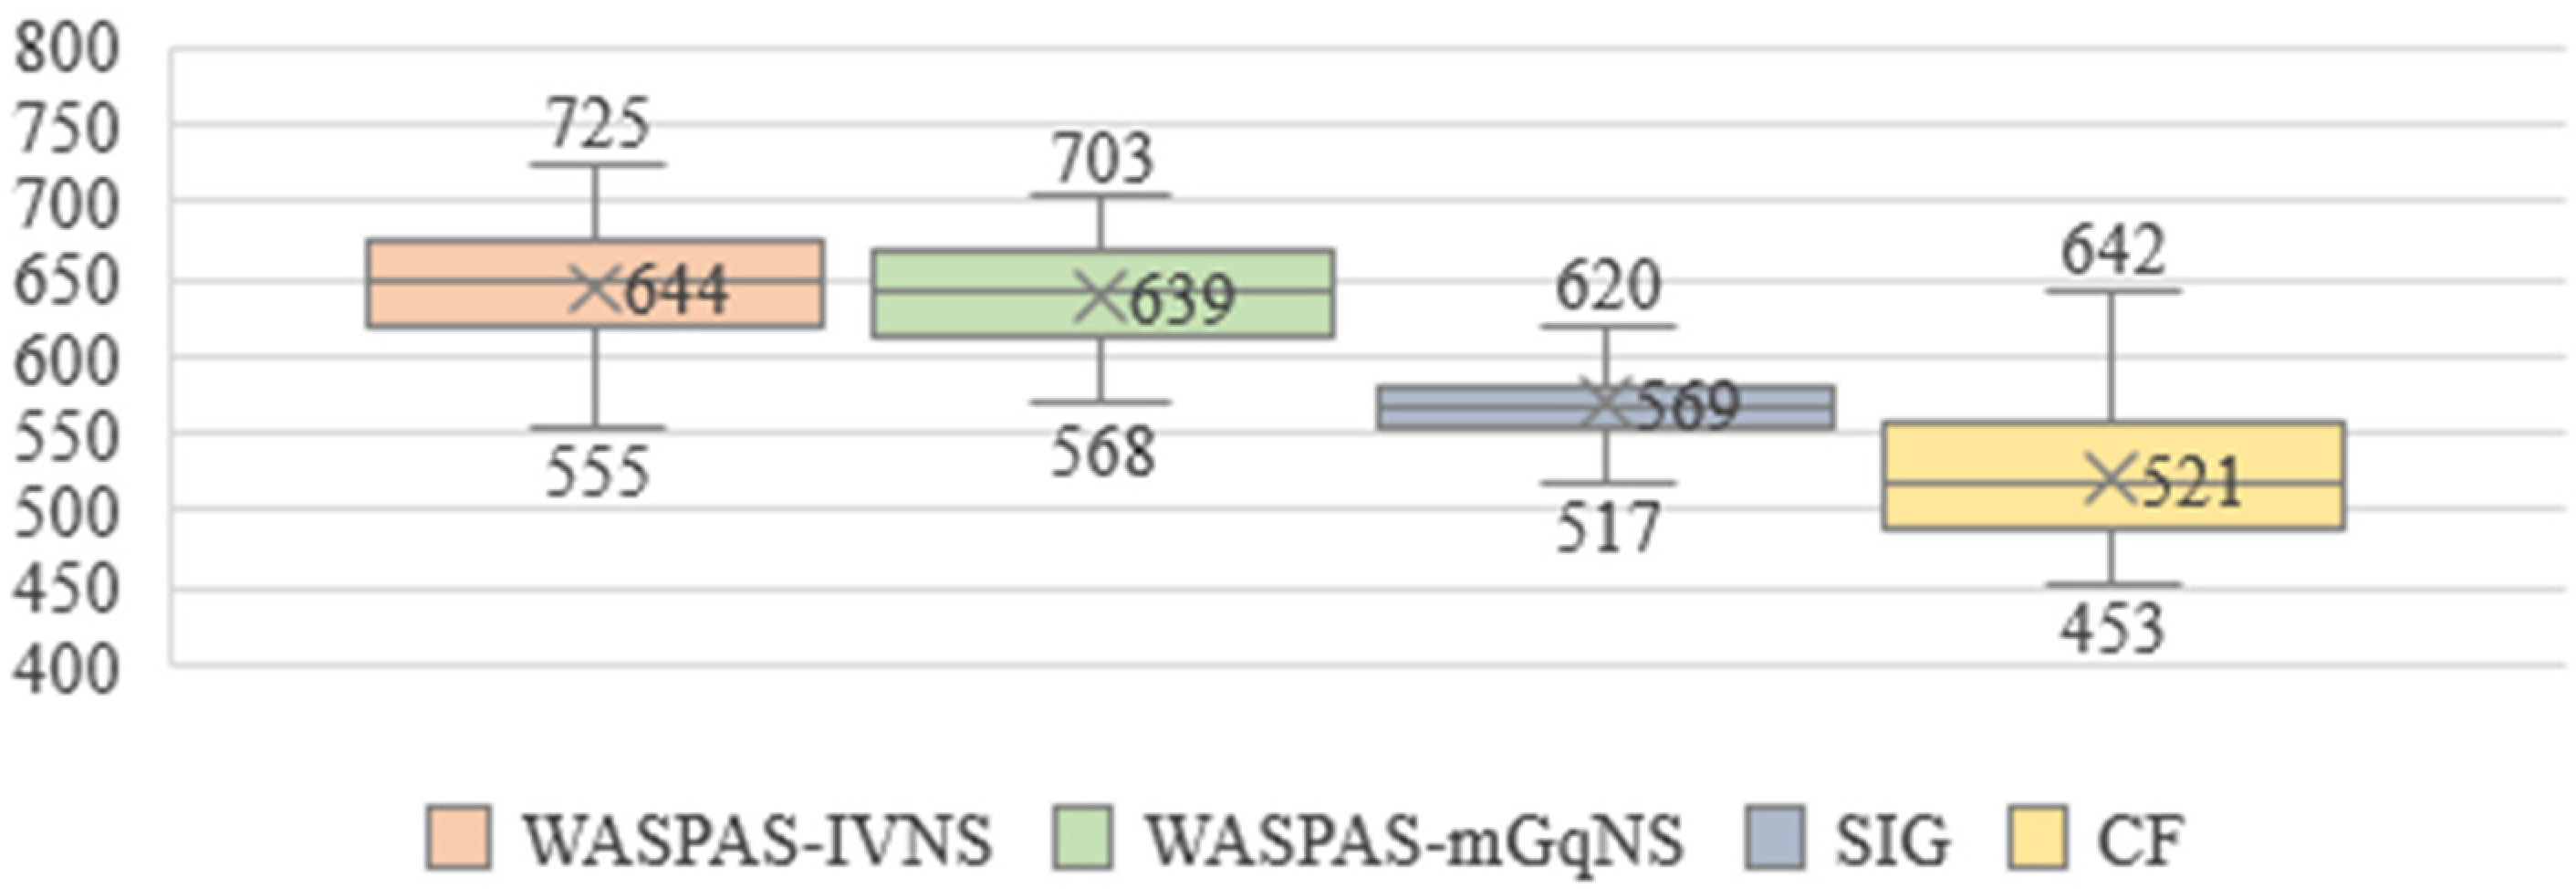
Finally, the penalty received for traversing dangerous areas is also reduced when applying the proposed environment exploration strategy. This value is reduced by 83.20% and 85.27% when comparing results obtained by applying the WASPAS-IVNS method to the results obtained when applying SIG and CF strategies, respectively. A similar observation can be made when comparing the results obtained when applying the WASPAS-mGqNS method. Here, the penalty is reduced by 88.56% and 89.97% when compared to the SIG and CF strategies, respectively. Furthermore, the data presented in Figure 5 indicates that the baseline strategies display high variation between the received penalty values. In this case, the highest obtained penalty was received when applying the CF strategy, as this strategy tends to direct the robot to the frontiers that are located around (or within) the dangerous area, essentially locking the autonomous robot in the dangerous environment until the exhaustive exploration within the area is performed.
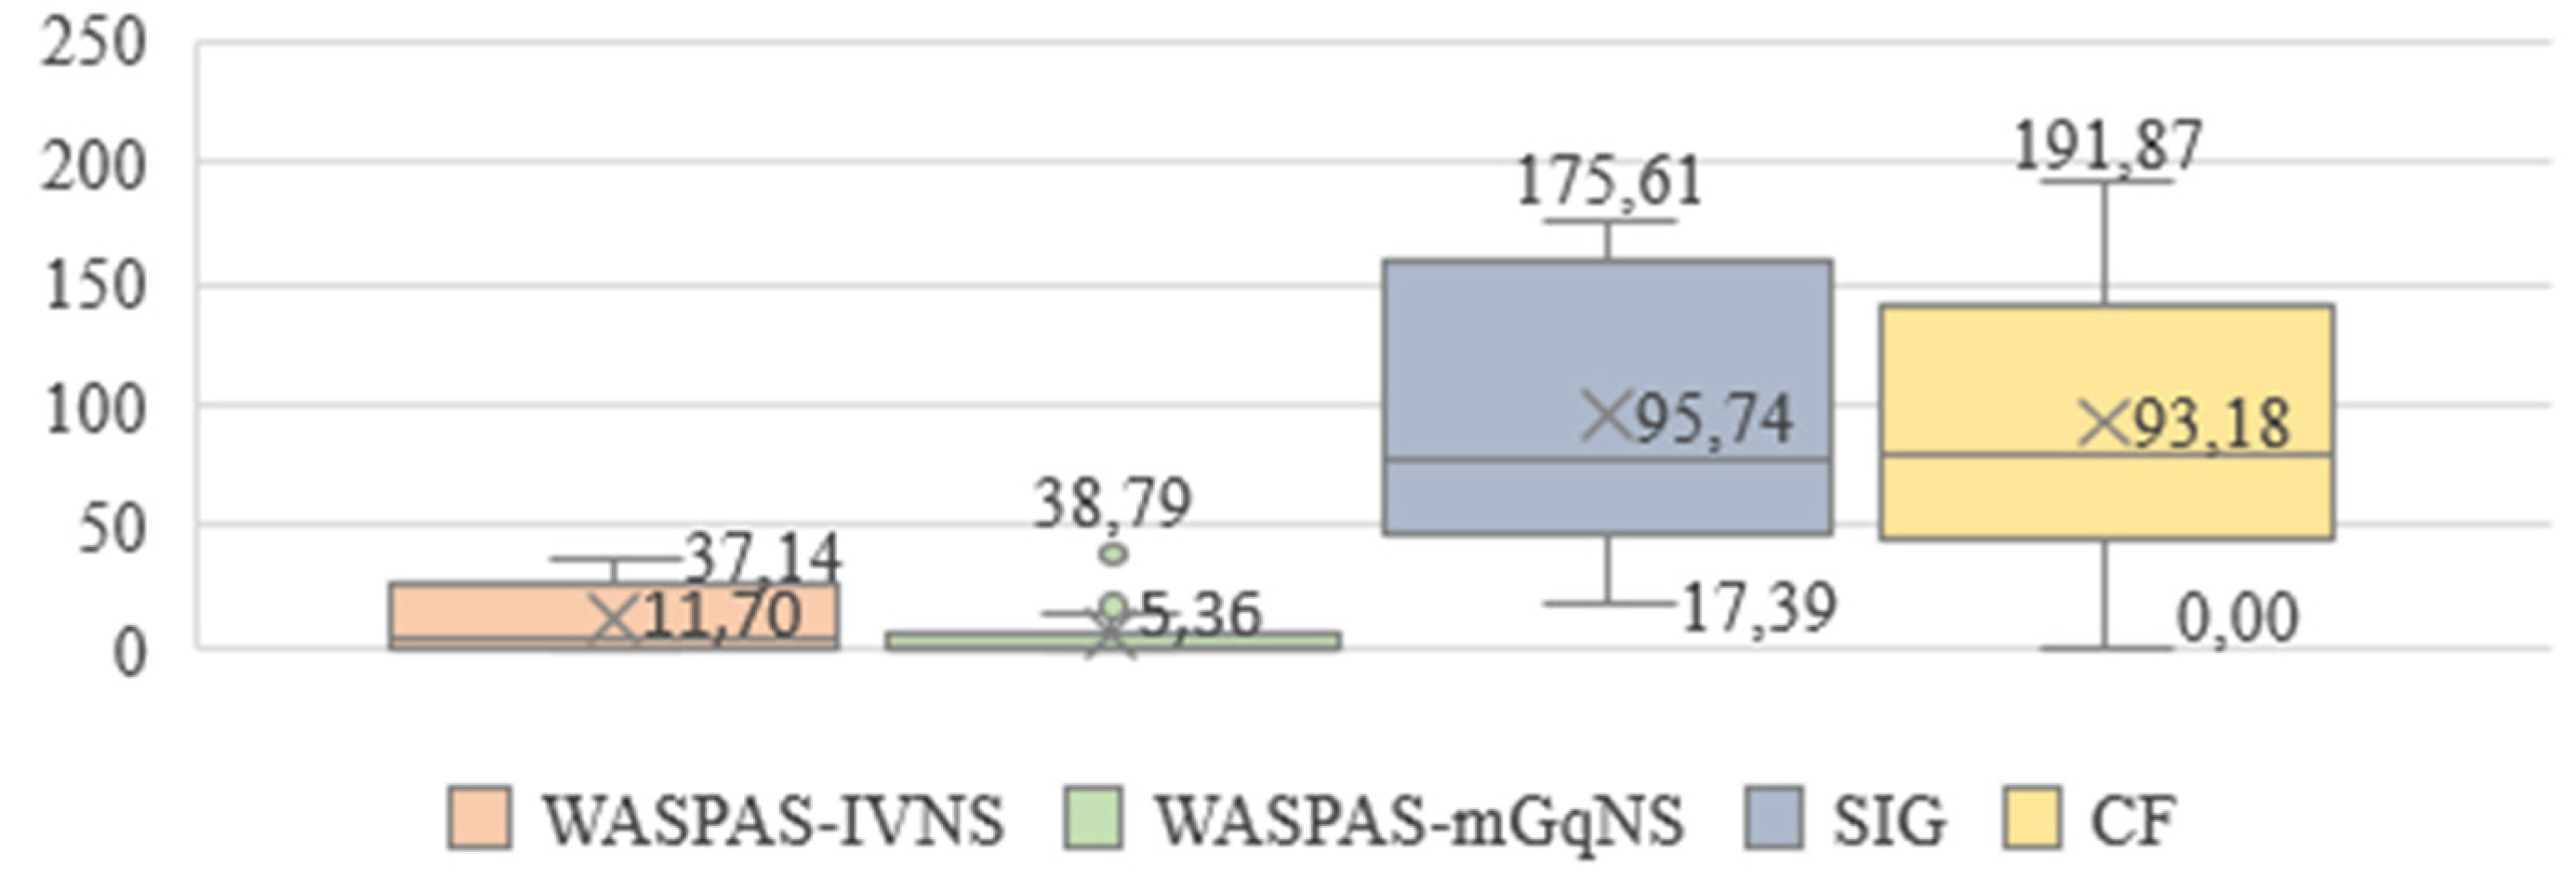
When considering the results obtained in the 3rd environment, it can be observed that the amount of the discovered information is increased by 13.19% and 23.60% when comparing the proposed environment exploration strategy (which applies the WASPAS-IVNS method) to the SIG and CF strategies. An increase of 12.27% and 22.60% is observed when applying the WASPAS-mGqNS. These results correlate to the those obtained in other environments, indicating the effectiveness of the proposed environment exploration strategy. Considering the additional data presented in Figure 6, it can be observed that the maximum value obtained by the SIG strategy is less than the average of the discovered information by applying the proposed environment exploration strategy. However, the maximum value obtained by the CF strategy is slightly above the average obtained when the WASPAS-mGqNS method is applied, and slightly lower than the one obtained when the WASPAS-IVNS method is applied. Nevertheless, the average amount of information obtained by the CF strategy is the lowest of the four strategies.
The penalty for traversing the dangerous areas is also reduced in this environment. The decrease of up to 87% is observed when applying the proposed environment exploration strategy and the WASPAS-IVNS method. A decrease of up to 94.4% is observed when applying the WASPAS-mGqNS method. Furthermore, evaluating the additional data provided in Figure 7, it can be reasoned that the CF strategy displays similar issues to the ones observed in the 2nd environment. As this strategy is more sensitive to various errors in the environment representation model than the proposed environment exploration strategy, it can often direct the robot to the different frontiers between the multiple simulations, depending only on how close the frontier is to the robot. This sensitivity reduces the stability of the baseline CF method, resulting in more dispersed results.
The improvements provided by the proposed environment exploration strategy are observed across all simulated environments. However, it is also observed that the proposed environment exploration strategy increases the robot travelled distance, and this increase is notable in the 2nd and the 3rd environments. For example, in the 3rd environment, the travelled distance was increased by up to 33.64% when applying the proposed environment exploration strategy. To assess the significance of the observed results, the ANOVA statistical analysis test is conducted. The obtained p values are presented in Table 9 when the SIG strategy is tested against the proposed environment exploration strategies. The p values for the CF strategy are presented in Table 10. The considered α value in both tests is 0.05.
Considering the results presented in Table 9 and Table 10, it can be reasoned that the proposed environment exploration strategy can significantly increase the robot’s ability to avoid dangerous areas in SAR missions. Furthermore, by applying the proposed environment exploration strategy, the robot can significantly increase the amount of discovered information in larger environments that have a similar topology to that of the 2nd and 3rd environments. However, as the increase in robot travelled distance is observed to be rather significant in the 2nd and the 3rd environments, two additional ratio parameters (namely, the ratio between the robot travelled distance and the discovered information and the ratio between the received penalty and the discovered information) are considered to determine if the proposed environment exploration strategy is actually balancing between the optimisation priorities. These results are presented in Table 11.
The averaged ratio values highlight that the proposed environment exploration strategy decreases the penalty for every travelled meter by up to 85–90%. These results are stable across the simulated SAR environments. However, the ratio between the robot travelled distance and the obtained information is not as stable. This value is decreased by up to 12% in the 1st environment. Decreased by 8.7% and increased by up to 9% in the 2nd environment and increased by up to 7% in the 3rd environment. To assess the significance of the observed variations between the proposed WASPAS-IVNS and WASPAS-mGqNS methods and the baseline strategies, an ANOVA statistical analysis test is performed. The obtained p values for the SIG method are presented in Table 12. However, considering the ANOVA test results against the CF strategy, the increase and decrease of values in all environments are considered as significant, with all p values < 0.05.
Considering the results, it can be concluded that the decrease in the received penalty relative to the travelled distance is significant in all three simulated environments. However, the increased robot travel distance in the 3rd environment is considered insignificant, when the proposed environment exploration strategy is compared to the baseline SIG strategy, and the decrease is significant in the 1st environment. This indicates, that in multiple situations the robot could balance between the given prioritisation requirements. However, it is worth noting that the results obtained by the frontier assessment strategies (such as the proposed one) strongly depend on the structure of the environment, and the positions of objects that attract or redirect the exploring robot. Nevertheless, the robot’s ability to avoid dangerous areas while also increasing the discovered environment information is an important feature that can be employed when exploring the SAR environments. The obtained results confirm that in some situations the proposed adaptive environment exploration strategy can significantly increase the robot performance when compared to the baseline CF and SIG strategies. It is also worth noting that the path planning process (which is used for several criteria value calculations) is a time-consuming procedure. However, the proposed decision-making approach for candidate frontier assessment does not require significant additional computational resources.

4. Conclusions

In this research, the proposed adaptive candidate frontier assessment strategy which applies the neutrosophic WASPAS-IVNS and WASPAS-mGqNS methods is evaluated in the simulated SAR environments. The proposed environment exploration strategy is compared against the standard CF and SIG strategies, and the MCDM methods are compared against the state-of-the-art WASPAS-SVNS method. The WASPAS-IVNS and WASPAS-mGqNS methods show computational stability when compared to the WASPAS-SVNS method. By applying the proposed candidate frontier assessment strategy, generally insignificant result fluctuation of the considered comparison parameters (at p value > 0.05) is observed in 1st and 2nd simulated SAR environments. Also, the m-generalised q-neutrosophic set includes all the benefits of the considered fuzzy sets [30], thus introducing additional flexibility to the proposed candidate frontier assessment approach.
The proposed environment exploration strategy which applies the WASPAS-IVNS and WASPAS-mGqNS methods, provides noteworthy performance improvements when compared to the SIG and CF strategies. When comparing to the SIG strategy, the proposed environment exploration strategy increases the robot performance regarding the discovered environment information by up to 1.8%, 12.69%, and 13.19% in the three simulated environments, when applying the WASPAS-IVNS method, and up to 1.8%, 11.83%, and 12.27% when applying the WASPAS-mGqNS method. When compared to the CF strategy, the proposed environment exploration strategy increases the robot performance regarding the discovered environment information by up to 0.5%, 10.36%, and 23.63% in the three simulated environments, when applying the WASPAS-IVNS method. The values increase by up to 0.5%, 9.51%, and 22.60% when applying the WASPAS-mGqNS method. The increase in performance is significant in the 2nd and 3rd environments at p values < 0.05. Furthermore, the proposed environment exploration strategy is capable of decreasing the robot obtained penalty for traversing dangerous regions by up to 94.4%. The observed ability to decrease the received penalty is significant in all three environments at p values < 0.05. However, the average of robot travelled distance can increase when applying the proposed adaptive environment exploration strategy. Nevertheless, a robot that applies the proposed navigation strategy is capable of balancing multiple prioritisation objectives, enabling it to discover more environment information while also avoiding dangerous areas in the environment.

Author Contributions

Conceptualization, R.S. and R.B.; methodology, R.S. and R.B.; software, R.S.; validation, R.S. and R.B.; formal analysis, R.S. and R.B.; investigation, R.S.; resources, R.S. and R.B.; data curation, R.S.; writing—original draft preparation, R.S.; writing—review and editing, R.S. and R.B.; visualization, R.S.; supervision, R.B.; project administration, R.B. All authors have read and agreed to the published version of the manuscript.

Funding

This research received no external funding.

Institutional Review Board Statement

Not applicable.

Informed Consent Statement

Not applicable.

Data Availability Statement

Not applicable.

Conflicts of Interest

The authors declare no conflict of interest.

References

  1. De Cubber, G.; Doroftei, D.; Rudin, K.; Berns, K.; Matos, A.; Serrano, D.; Sanchez, J.; Govindaraj, S.; Bedkowski, J.; Roda, R.; et al. Introduction to the Use of Robotic Tools for Search and Rescue. In Search and Rescue Robotics—From Theory to Practice; IntechOpen: London, UK, 2017; pp. 1–17. [Google Scholar]
  2. Jacoff, A.; Messina, E.; Weiss, B.A.; Tadokoro, S.; Nakagawa, Y. Test arenas and performance metrics for urban search and rescue robots. In Proceedings of the 2003 IEEE/RSJ International Conference on Intelligent Robots and Systems (IROS 2003) (Cat. No.03CH37453), Las Vegas, NV, USA, 27–31 October 2003; IEEE: Piscataway, NJ, USA; 2003; Volume 3, pp. 3396–3403. [Google Scholar]
  3. Bahadori, S.; Calisi, D.; Censi, A.; Farinelli, A.; Grisetti, G.; Iocchi, L.; Nardi, D.; Tipaldi, G.D. Autonomous Systems for Search and Rescue. In Rescue Robotics; Birk, A., Carpin, S., Nardi, D., Jacoff, A., Tadokoro, S., Eds.; Springer: Berlin, Germany, 2005. [Google Scholar]
  4. Sheh, R.; Schwertfeger, S.; Visser, A. 16 Years of RoboCup Rescue. KI-Künstliche Intell. 2016, 30, 267–277. [Google Scholar] [CrossRef] [Green Version]
  5. Basilico, N.; Amigoni, F. Exploration strategies based on multi-criteria decision making for searching environments in rescue operations. Auton. Robot. 2011, 31, 401–417. [Google Scholar] [CrossRef]
  6. Gomez, C.; Hernandez, A.C.; Barber, R. Topological Frontier-Based Exploration and Map-Building Using Semantic Information. Sensors 2019, 19, 4595. [Google Scholar] [CrossRef] [PubMed] [Green Version]
  7. Juliá, M.; Gil, A.; Reinoso, O. A comparison of path planning strategies for autonomous exploration and mapping of unknown environments. Auton. Robot. 2012, 33, 427–444. [Google Scholar] [CrossRef]
  8. Yamauchi, B. A frontier-based approach for autonomous exploration. In Proceedings of the IEEE International Symposium on Computational Intelligence in Robotics and Automation, Monterey, CA, USA, 10–11 July 1997; IEEE Computer Society Press: Washington, DC, USA, 1997; pp. 146–151. [Google Scholar]
  9. González-Baños, H.H.; Latombe, J. Navigation Strategies for Exploring Indoor Environments. Int. J. Rob. Res. 2002, 21, 829–848. [Google Scholar] [CrossRef]
  10. Makarenko, A.A.; Williams, S.B.; Bourgault, F.; Durrant-Whyte, H.F. An experiment in integrated exploration. In Proceedings of the IEEE/RSJ International Conference on Intelligent Robots and System, Lausanne, Switzerland, 30 September–4 October 2002; IEEE: Piscataway, NJ, USA, 2002; Volume 1, pp. 534–539. [Google Scholar]
  11. Amigoni, F.; Gallo, A. A Multi-Objective Exploration Strategy for Mobile Robots. In Proceedings of the 2005 IEEE International Conference on Robotics and Automation, Barcelona, Spain, 18–22 April; IEEE: Piscataway, NJ, USA, 2005; pp. 3850–3855. [Google Scholar]
  12. Visser, A.; Slamet, B.A. Including communication success in the estimation of information gain for multi-robot exploration. In Proceedings of the 2008 6th International Symposium on Modeling and Optimization in Mobile, Ad Hoc, and Wireless Networks and Workshops, Berlin, Germany, 1–3 April 2008; pp. 680–687. [Google Scholar] [CrossRef] [Green Version]
  13. Selin, M.; Tiger, M.; Duberg, D.; Heintz, F.; Jensfelt, P. Efficient Autonomous Exploration Planning of Large-Scale 3-D Environments. IEEE Robot. Autom. Lett. 2019, 4, 1699–1706. [Google Scholar] [CrossRef] [Green Version]
  14. Bausys, R.; Cavallaro, F.; Semenas, R. Application of Sustainability Principles for Harsh Environment Exploration by Autonomous Robot. Sustainability 2019, 11, 2518. [Google Scholar] [CrossRef] [Green Version]
  15. Semenas, R.; Bausys, R. Modelling of Autonomous Search and Rescue Missions by Interval-Valued Neutrosophic WASPAS Framework. Symmetry 2020, 12, 162. [Google Scholar] [CrossRef] [Green Version]
  16. Semenas, R.; Bausys, R.; Zavadskas, E.K. A Novel Environment Exploration Strategy by m-generalised q-neutrosophic WASPAS. Stud. Inform. Control 2021, 30, 19–28. [Google Scholar] [CrossRef]
  17. Popović, M. An MCDM Approach for Personnel Selection Using the Cocoso Method. J. Process Manag. New Technol. 2021, 9, 78–88. [Google Scholar] [CrossRef]
  18. Özdağoğlu, A.; Keleş, M.K.; Altınata, A.; Ulutaş, A. Combining Different MCDM Methods with the Copeland Method: An Investigation on Motorcycle Selection. J. Process Manag. New Technol. 2021, 9, 13–27. [Google Scholar] [CrossRef]
  19. Kumar, V.; Kalita, K.; Chatterjee, P.; Zavadskas, E.K.; Chakraborty, S. A SWARA-CoCoSo-Based Approach for Spray Painting Robot Selection. Informatica 2021, 1–20. [Google Scholar] [CrossRef]
  20. Kalibatienė, D.; Miliauskaitė, J. A Hybrid Systematic Review Approach on Complexity Issues in Data-Driven Fuzzy Inference Systems Development. Informatica 2021, 32, 85–118. [Google Scholar] [CrossRef]
  21. Stanujkić, D.; Karabašević, D.; Popović, G.; Pamučar, D.; Stević, Ž.; Zavadskas, E.K.; Smarandache, F. A Single-Valued Neutrosophic Extension of the EDAS Method. Axioms 2021, 10, 245. [Google Scholar] [CrossRef]
  22. Mahmood, T.; Ullah, K.; Khan, Q.; Jan, N. An approach toward decision-making and medical diagnosis problems using the concept of spherical fuzzy sets. Neural Comput. Appl. 2019, 31, 7041–7053. [Google Scholar] [CrossRef]
  23. Keshavarz-Ghorabaee, M.; Amiri, M.; Zavadskas, E.K.; Turskis, Z.; Antucheviciene, J. Simultaneous Evaluation of Criteria and Alternatives (SECA) for Multi-Criteria Decision-Making. Informatica 2018, 29, 265–280. [Google Scholar] [CrossRef] [Green Version]
  24. Zavadskas, E.K.; Kalibatas, D.; Kalibatiene, D. A multi-attribute assessment using WASPAS for choosing an optimal indoor environment. Arch. Civ. Mech. Eng. 2016, 16, 76–85. [Google Scholar] [CrossRef]
  25. Zavadskas, E.K.; Đalić, I.; Stević, Ž. Application of novel DEA-SWARA-WASPAS model for efficiency assessment of agricultural products. J. Smart Environ. Green Comput. 2021, 1, 32–46. [Google Scholar] [CrossRef]
  26. Semenas, R.; Bausys, R. Adaptive Strategy for Environment Exploration in Search and Rescue Missions by Autonomous Robot. In Communication and Intelligent Systems. Lecture Notes in Networks and Systems; Sharma, H., Gupta, M.K., Tomar, G.S., Lipo, W., Eds.; Springer: Singapore, 2021; Volume 204, pp. 335–353. [Google Scholar] [CrossRef]
  27. Taillandier, P.; Stinckwich, S. Using the PROMETHEE multi-criteria decision making method to define new exploration strategies for rescue robots. In Proceedings of the 2011 IEEE International Symposium on Safety, Security, and Rescue Robotics, Kyoto, Japan, 1–5 November 2011; IEEE: Piscataway, NJ, USA, 2011; pp. 321–326. [Google Scholar]
  28. Zagradjanin, N.; Pamucar, D.; Jovanovic, K.; Knezevic, N.; Pavkovic, B. Autonomous Exploration Based on Multi-Criteria Decision-Making and Using D* Lite Algorithm. Intell. Autom. Soft Comput. 2022, 32, 1369–1386. [Google Scholar] [CrossRef]
  29. Zhang, H.; Wang, J.Q.; Chen, X.H. Interval Neutrosophic Sets and Their Application in Multicriteria Decision Making Problems. Sci. World J. 2014, 2014, 645953. [Google Scholar] [CrossRef] [PubMed]
  30. Smarandache, F. Neutrosophic Set is a Generalization of Intuitionistic Fuzzy Set, Inconsistent Intuitionistic Fuzzy Set (Picture Fuzzy Set, Ternary Fuzzy Set), Pythagorean Fuzzy Set, Spherical Fuzzy Set, and q-Rung Orthopair Fuzzy Set, while Neutrosophication is a Generalization of Regret Theory, Grey System Theory and Three-Ways Decision (revisited). J. New Theory 2019, 29, 1–31. [Google Scholar]
  31. Zavadskas, E.K.; Turskis, Z.; Antucheviciene, J.; Zakarevicius, A. Optimization of Weighted Aggregated Sum Product Assessment. Elektron. Ir Elektrotechnika 2012, 122, 3–6. [Google Scholar] [CrossRef]
  32. Zavadskas, E.K.; Baušys, R.; Lazauskas, M. Sustainable assessment of alternative sites for the construction of a waste incineration plant by applying WASPAS method with single-valued neutrosophic set. Sustainability 2015, 7, 15923–15936. [Google Scholar] [CrossRef] [Green Version]
  33. Aghababa, F.P.; Kabiri, A.; Hughes, J.; Visser, A.; Amigoni, F.; Shimizu, M. RoboCup 2019 RoboCup Rescue Simulation League Virtual Robot Competition Rules Document; Version 1.0. 18 April 2019, pp. 1–6. Available online: https://rescuesim.robocup.org/wp-content/uploads/2019/04/RoboCup2019-RVRL-Rules-v1_0.pdf (accessed on 20 December 2021).
Figure 1. The proposed adaptive environment exploration strategy.
Symmetry 14 00179 g001
Figure 2. (a) The 1st simulated SAR environment representing 26 by 17 m exploration space with an open topology. (b) The 2nd simulated SAR environment representing 32 by 26 m exploration space with the separated area topology. (c) The 3rd simulated SAR environment representing 43 by 28 m exploration space with a mirrored loop-type topology.
Symmetry 14 00179 g002
Figure 3. The considered candidate frontier assessment problem. The red markers represent dangerous areas. The yellow marker represents visible survivor and white markers represent priority locations that should be visited by the robot. Frontier regions are defined by blue lines and the candidate frontiers f are marked by the green markers.
Symmetry 14 00179 g003
Figure 4. The information discovered in the 2nd environment.
Symmetry 14 00179 g004
Figure 5. The penalty received in the 2nd environment.
Symmetry 14 00179 g005
Figure 6. The information discovered in the 3rd environment.
Symmetry 14 00179 g006
Figure 7. The penalty received in the 3rd environment.
Symmetry 14 00179 g007
Table 1. The criteria set for the proposed frontier assessment strategy.
CriterionCriterion NameUnitsConsidered Variance
c 1 The estimated length of the frontier.m±0.6 m
c 2 The estimated distance from the candidate frontier to the robot control station.m±0.3 m
c 3 The estimated time needed to reach the candidate frontier.s±7 s
c 4 The estimated penalty for following the computed path.Penalty (p)± ( n w p 0.3 ) p
c 5 Total recognition rate of the hypothesised survivors that could be monitored by following the computed path.%± ( n v 10 ) %
c 6 Current lowest hypothesized survivor recognition rate.%±10%
c 7 Distance from the frontier to the closest priority location.m±0.3 m
c 8 The ratio between the free cells around the frontier and sample population.%±10%
Table 2. Criteria weights that define the DA, RRS, RS and IG environment exploration strategies.
Weights
CriterionOptimumDARRSRSIG
c 1 Max0.0560.0290.0430.213
c 2 Max0.0610.0730.0190.075
c 3 Min0.1970.2030.1310.322
c 4 Min0.3940.3730.3950.043
c 5 Min0.0370.0390.0650.033
c 6 Min0.1120.1250.2340.081
c 7 Min0.0780.0700.0250.137
c 8 Max0.0650.0890.0880.097
Table 3. The standard information gain (SIG) strategy.
Criteria NameOptimumWeight
The estimated length of the frontier.Max0.50
The estimated time needed to reach the candidate frontier.Min0.30
The estimated distance from the candidate frontier to the robot control station.Min0.20
Table 4. The average results obtained in the three simulated environments by applying the proposed environment exploration strategy.
EnvironmentMethodInformationPenaltyDistance
1stWASPAS-SVNS3675.4766.11
WASPAS-IVNS3677.2068.92
WASPAS-mGqNS3675.8570.36
2ndWASPAS-SVNS5564.73149.41
WASPAS-IVNS5628.85147.67
WASPAS-mGqNS5576.03151.14
3rdWASPAS-SVNS64314.47137.03
WASPAS-IVNS64411.70130.94
WASPAS-mGqNS6395.36128.03
Table 5. The p values between the proposed environment exploration strategies that apply WASPAS-SVNS, WASPAS-IVNS and WASPAS-mGqNS methods.
EnvironmentWASPAS-SVNS Results Compared againstInformationPenaltyDistance
1stWASPAS-IVNS0.930.310.12
WASPAS-mGqNS0.890.820.06
2ndWASPAS-IVNS0.510.070.71
WASPAS-mGqNS0.860.570.65
3rdWASPAS-IVNS0.930.550.15
WASPAS-mGqNS0.730.030.03
Table 6. The initial decision matrix for the considered candidate frontier assessment problem.
c 1 c 2 c 3 c 4 c 5 c 6 c 7 c 8
f 1 2.112.0914.690.0010.001327.07.660.14
f 2 2.013.1720.490.0010.001423.35.120.28
f 3 7.29.3536.7880.320.001446.98.650.06
f 4 8.817.1450.12111.10.001494.93.780.57
f 5 2.17.0229.3990.390.001207.68.090.16
f 6 3.515.1843.72111.10.001324.14.150.50
f 7 2.84.7638.27107.50.001363.75.310.53
f 8 1.510.9147.1591.150.001298.87.890.01
f 9 6.310.0348.87175.270.001452.98.120.08
f 10 3.89.0150.78135.260.001389.11.900.51
f 11 3.513.6251.6790.720.001326.78.430.53
f 12 3.911.6858.89128.50.001204.36.960.51
f 13 2.112.0259.87135.30.001375.53.290.14
f 14 3.114.6953.3491.080.001468.911.950.46
f 15 2.012.9163.38135.30.001360.55.150.27
f 16 6.315.5875.24258.80.001280.211.180.15
f 17 1.514.8558.7891.120.001487.112.790.36
f 18 2.217.4989.78258.60.001410.112.260.62
Table 7. The utility scores of the candidate frontiers by the three MCDM methods.
WASPAS-SVNSWASPAS-IVNSWASPAS-mGqNS
ScoreRankScoreRankScoreRank
f 1 0.8391[2.467, 2.636]20.7111
f 2 0.8382[2.492, 2.620]10.7072
f 3 0.7439[2.181, 2.494]110.6076
f 4 0.7635[2.354, 2.507]60.6047–8
f 5 0.7664[2.325, 2.558]40.6323
f 6 0.7616[2.352, 2.513]50.6095
f 7 0.7753[2.384, 2.539]30.6234
f 8 0.69114[2.119, 2.438]150.58612
f 9 0.67616[2.049, 2.400]160.55816
f 10 0.7468[2.338, 2.493]80.5989
f 11 0.7547[2.331, 2.513]70.6047–8
f 12 0.73710[2.321, 2.487]90.59010
f 13 0.68915[2.174, 2.397]140.56814
f 14 0.72911[2.278, 2.465]100.58711
f 15 0.69213[2.219, 2.402]130.56615
f 16 0.59817[2.057, 2.312]170.52217
f 17 0.70012[2.208, 2.414]120.57213
f 18 0.58118[2.068, 2.288]180.51618
Table 8. The averaged results obtained in the three simulated SAR environments by the CF, SIG and the proposed environment exploration strategy when applying the WASPAS-IVNS and WASPAS-mGqNS methods.
EnvironmentMethodInformationPenaltyDistance
1stWASPAS-IVNS3677.2068.92
WASPAS-mGqNS3675.8570.36
SIG36057.3277.18
CF36555.7277.84
2ndWASPAS-IVNS5628.85147.67
WASPAS-mGqNS5576.03151.14
SIG49852.68142.33
CF50960.07124.97
3rdWASPAS-IVNS64411.70130.94
WASPAS-mGqNS6395.36128.03
SIG56995.74113.30
CF52193.1897.98
Table 9. The p values by performing ANOVA test between the proposed environment exploration strategies that apply WASPAS-IVNS and WASPAS-mGqNS methods and the SIG strategy.
EnvironmentSIG Compared againstInformationPenaltyDistance
1stWASPAS-IVNS0.240.000.02
WASPAS-mGqNS0.250.000.06
2ndWASPAS-IVNS0.000.000.29
WASPAS-mGqNS0.000.000.04
3rdWASPAS-IVNS0.000.000.00
WASPAS-mGqNS0.000.000.00
Table 10. The p values by performing ANOVA test between the proposed environment exploration strategies that apply WASPAS-IVNS and WASPAS-mGqNS methods and the CF strategy.
EnvironmentCF Compared againstInformationPenaltyDistance
1stWASPAS-IVNS0.510.000.00
WASPAS-mGqNS0.560.000.02
2ndWASPAS-IVNS0.000.000.00
WASPAS-mGqNS0.000.000.00
3rdWASPAS-IVNS0.000.000.00
WASPAS-mGqNS0.000.000.00
Table 11. The averaged ratio values obtained in the three simulated environments.
EnvironmentMethodDistance/InformationPenalty/Information
1stWASPAS-IVNS0.190.02
WASPAS-mGqNS0.190.02
SIG0.210.16
CF0.210.15
2ndWASPAS-IVNS0.260.02
WASPAS-mGqNS0.270.01
SIG0.290.11
CF0.250.12
3rdWASPAS-IVNS0.200.02
WASPAS-mGqNS0.200.01
SIG0.200.17
CF0.190.18
Table 12. The p values between the proposed environment exploration strategies that apply WASPAS-IVNS and WASPAS-mGqNS methods and the baseline SIG strategy.
EnvironmentSIG Results Compared againstDistance/InformationPenalty/Information
1stWASPAS-IVNS0.000.00
WASPAS-mGqNS0.020.00
2ndWASPAS-IVNS0.010.00
WASPAS-mGqNS0.080.00
3rdWASPAS-IVNS0.450.00
WASPAS-mGqNS0.830.00
Publisher’s Note: MDPI stays neutral with regard to jurisdictional claims in published maps and institutional affiliations.

