Article

Seismic Mitigation of Curved Continuous Girder Bridge Considering Collision Effect

MOE Key Laboratory of New Technology for Construction of Cities in Mountain Area, School of Civil Engineering, Chongqing University, Chongqing 400030, China
*
Author to whom correspondence should be addressed.
Symmetry 2022, 14(1), 129; https://doi.org/10.3390/sym14010129
Submission received: 10 December 2021 / Revised: 4 January 2022 / Accepted: 6 January 2022 / Published: 11 January 2022
(This article belongs to the Special Issue Symmetry in Structural Health Monitoring)

Abstract

:
Due to structural irregularity, curved bridgesaremore likely to cause non-uniform collisions and unseating between adjacent components when subjected to earthquakes. Based on the analysis of the collision response of curved bridges duringearthquakes, and according to the seismic characteristics of curved bridges, research was carried out on pounding mitigation and unseating prevention measures. A curved bridge with double column piers was taken as an engineering example, and a finite element model of curved bridges thatcould consider the non-uniform contact collision between adjacent components was built with ABAQUS software. Viscoelastic dampers, viscous dampers, and a lead rubber bearing were selected as the damping devices, and a steel wire rope-rubber mat was used as the pounding mitigation device to form the combinatorial seismic mitigation system. Based on the principle of energy dissipation combined with constraints, three kinds of combined seismic mitigation case were determined; a seismic response analysis was then performed. The results indicated that the three kinds of combined seismic case were effective atreducing the response topounding force, stress, damage, girder torsion and displacement, and achieved the goals of seismic mitigation and unseating prevention.

1. Introduction

Over the past decades, curved continuous girder bridges have been widely used in transportation networks that featuregeometric restrictions and constraints on site space, such as complicated interchanges and river crossings. However, curved bridges are vulnerable to earthquakes. Research in previous studies showed that curved bridges could sustain severe damage due to the coupling between bending and torsional forces or the displacement caused by complex vibrations [1,2,3]. The combination of their horizontal curvature and the irregularity of their adjacent segments means that curved bridges feature complex dynamic characteristics, which cause non-uniform collisions along the contact surface [4,5]. In addition, large pounding forces during collisions can amplify the relative displacement, which may lead to girder unseating and the collapse of the bridge. Chiyu Jiao et al. [6] conducted a shake table experiment on a 1/25-scale curved bridge model to investigate the influence of collision between adjacent girders on the seismic response of bridges. It was found that the collision was non-uniform along the contact surface, and the girder-to-girder collision could induce significantly large in-plane rotation of the adjacent bridges, which could substantially increase the global displacement demands of the bridges.
Damage to curved bridges is mainly due to pounding between girders or between girders and the abutment, aswas commonly observed during past major earthquakes [7]. Damage reports oncurved bridges during the 1995 Hyogo-Ken Nanbu earthquake in Japan indicated that pounding can lead to local damage and the collapse of bridge decks [8]. The failure of girder ends and bearing damage due to the pounding of adjacent simply-supported spans were reported after the 2001 Bhuj earthquake in Gujarat, India [9].The collapse of curved bridges, such as Baihua bridge, wasreported as a consequence of the 2008 Wenchuan earthquake. It was noted that the collapse only occurred in one of the curved segments of the 18span bridge while the other straight segments remained in location [10]. The destruction of bridges was also observed in the 2010 Chile earthquake and in the 2011 Christchurch earthquake [11,12]; most of the bridge damage, including the phenomenon of unseating, was caused by collisions between adjacent structures, especially the damage to curved bridges.
Reports from past major earthquakes and research findings from analytical and experimental researches highlight the seismic vulnerability of curved bridges and the seismic pounding impact on bridges. Therefore, seismic mitigation and collision prevention measures on curved Bridges have been highly valued in academic and engineering circles.
A variety of seismicmitigationtechnologieshave been proposed for bridges, including seismic isolation bearing, passive energy dissipation devices, tuned damper, and semi-active damping devices. Seismic isolation devices, such as rubber or lead rubber bearings, have been used to reduce seismic forces [13,14,15,16]. However, the use of lead rubber bearings can lead to large displacements, which consequently increase the possibility of pounding between adjacent segments or even unseating damage. In order to mitigate possible pounding and unseating damage, some researchers recommended the installation of rubber shock absorbers and restrainers. A few researchers have investigated the effectiveness of using steel restrainers [17,18,19,20,21] or Shape Memory Alloy (SMA) [22] and rubber bumpers together to mitigate pounding and unseating damage between adjacent decks. Felix [17] performeda comparative analysis of curved viaducts with cablerestrainers and different isolation bearings, and pointed out that cablerestrainers could reduce the probability of girder unseating. Raheem [19] conducted numerical studies on an isolated bridge with cablerestrainers and a natural rubber shock absorber. It was found that the use of rubber shock absorbers at the expansion gaps can significantly reduce the pounding forces, since the absorbers can reduce the impact stiffness and the cablerestrainers can effectively prevent girder unseating. Chiyu Jiao [21] performed a shake table experiment on a curved bridge model with a pounding buffer zone made of a natural rubber pad or aluminum foam at the expansion joint location to mitigate the pounding effect. The results show that the buffer zones of rubber and aluminum can effectively reduce seismic impact forces, and hence alleviate the localized damage. Meanwhile, the application of viscous dampers or viscoelastic dampers to bridges has received significant attention in recent years [23,24,25,26]. Due to the large resistance force and energy dissipation capacity, viscous dampers offer wide application prospects [27]. The main advantage of viscous dampers is that they are only activated during earthquakes, and theyshow no resistance force under slow relative segment movement.
Although there are some studieson seismic mitigation and unseating prevention, relatively few studies of curved continuous girder bridges have comprehensively considered the measures of seismic energy dissipation and pounding or unseating prevention together. In order to improve the seismic performance of curved girder bridges, it is necessary to carry out further research on the reasonable combination of seismicmitigationtechnologies and pounding mitigation measures together. For this purpose, this paper presents acomparative numerical analysis of the impact of different combinations of unseating restrainer with different isolation bearings or dampers on the dynamic response of the curved continuous girder bridge to seismic shock. Based on the principle of energy dissipation combined with constraints, this paper optimizes the combination of unseating restrainers and damping devices to form three seismic mitigation strategies for the curved continuous girder bridge. Athree-dimensional non-linear model of anentire bridge structural system is established; the model includes adjacent bridge superstructures with different sizes and the presence of expansion joints, as well as considering the unbalanced distribution of pounding forces across the contact surface and the nonlinear characteristics of bearings and dampers. Furthermore, the seismic response of the bridge structural systems is studied by dynamic nonlinear analysis. This study sheds some light on the benefits and limitations of restraining devices and damping or isolation devices when acting in combination. The results presented could assist bridge engineers in selecting damping devices to effectively mitigate damage tothis type of bridge structure.

2. Bridge Analysis Model

The bridge model takes the middle bridge section of the Jinjiang Interchange of Lipan Highway as an example. The schematic plan is shown in Figure 1. The curved ramp bridge has two joints, four spans, and three expansion gap joints, and the width of expansion joint is 50 mm. In order to analyze the collision of the curved bridge during anearthquake, three expansion joints in the original bridge are retained and abutments are set at both ends. In the figure, the first span is between the right abutment and the pier ①, and the second, third, and fourth spans are from the pier ① to the left abutment in turn. The span length of the first, second, and third spans is 18.33 m, respectively, and the length of the fourth span is 26.18 m. The radius of the curvature of the curved bridge is 50 m.The constraint conditions of the bridge support are shown in Figure 1, and the original structure of the bridge uses ordinary rectangular plate rubber bearings. The superstructure of the bridge uses cast-in-placereinforced concrete box girders, and the substructure piers are double-columnreinforced concrete round piers with a height of 20 m. The specific sections are shown in Figure 2.

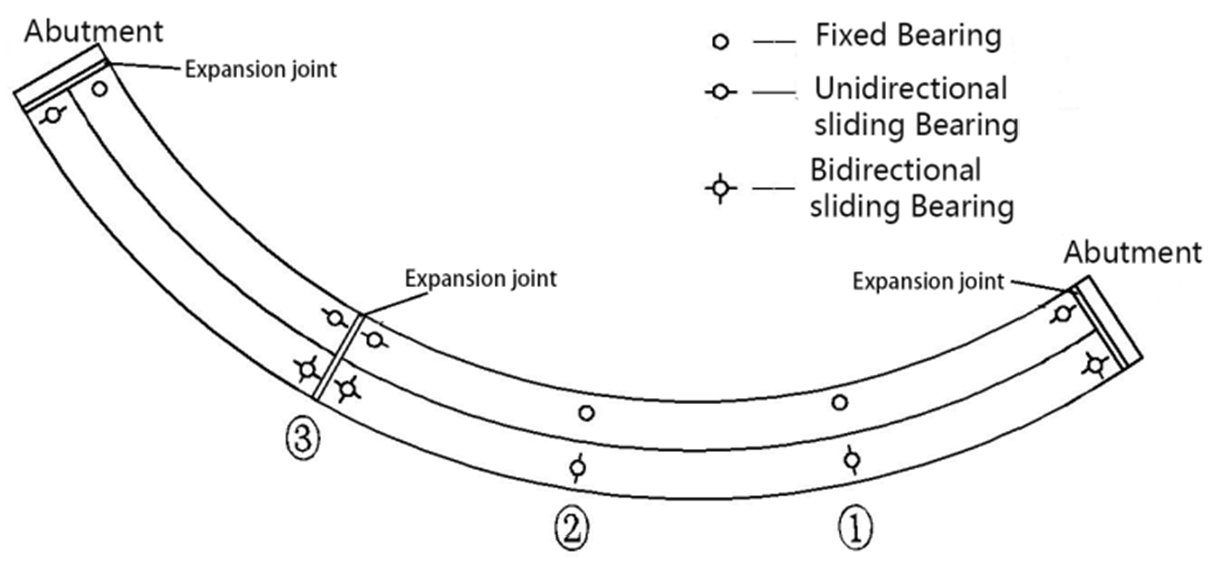
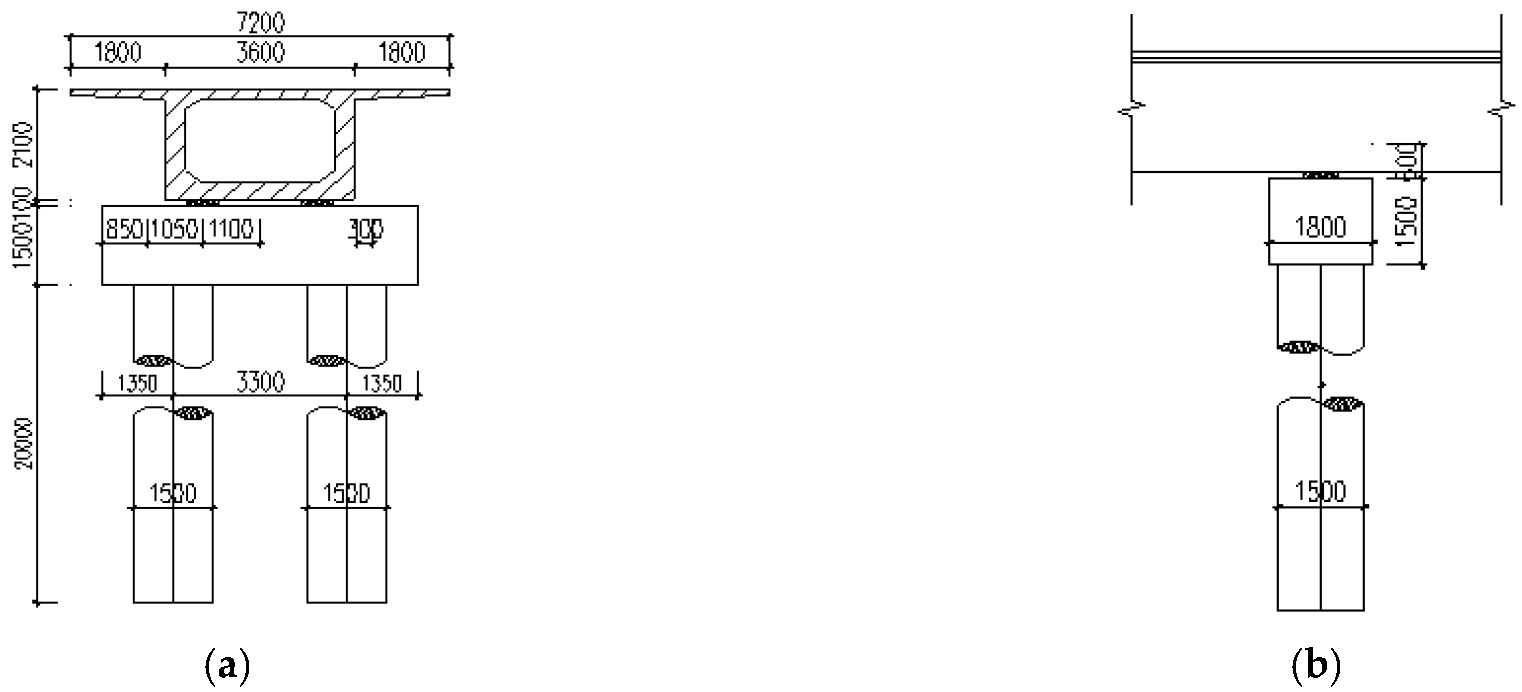
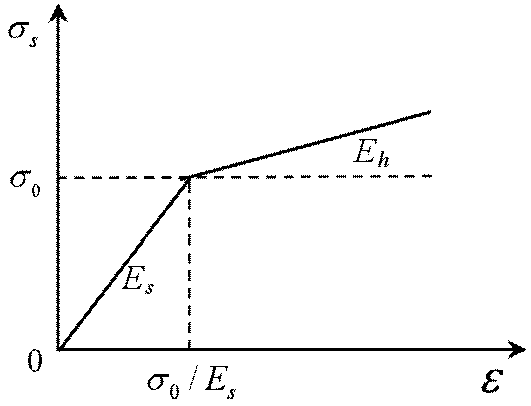
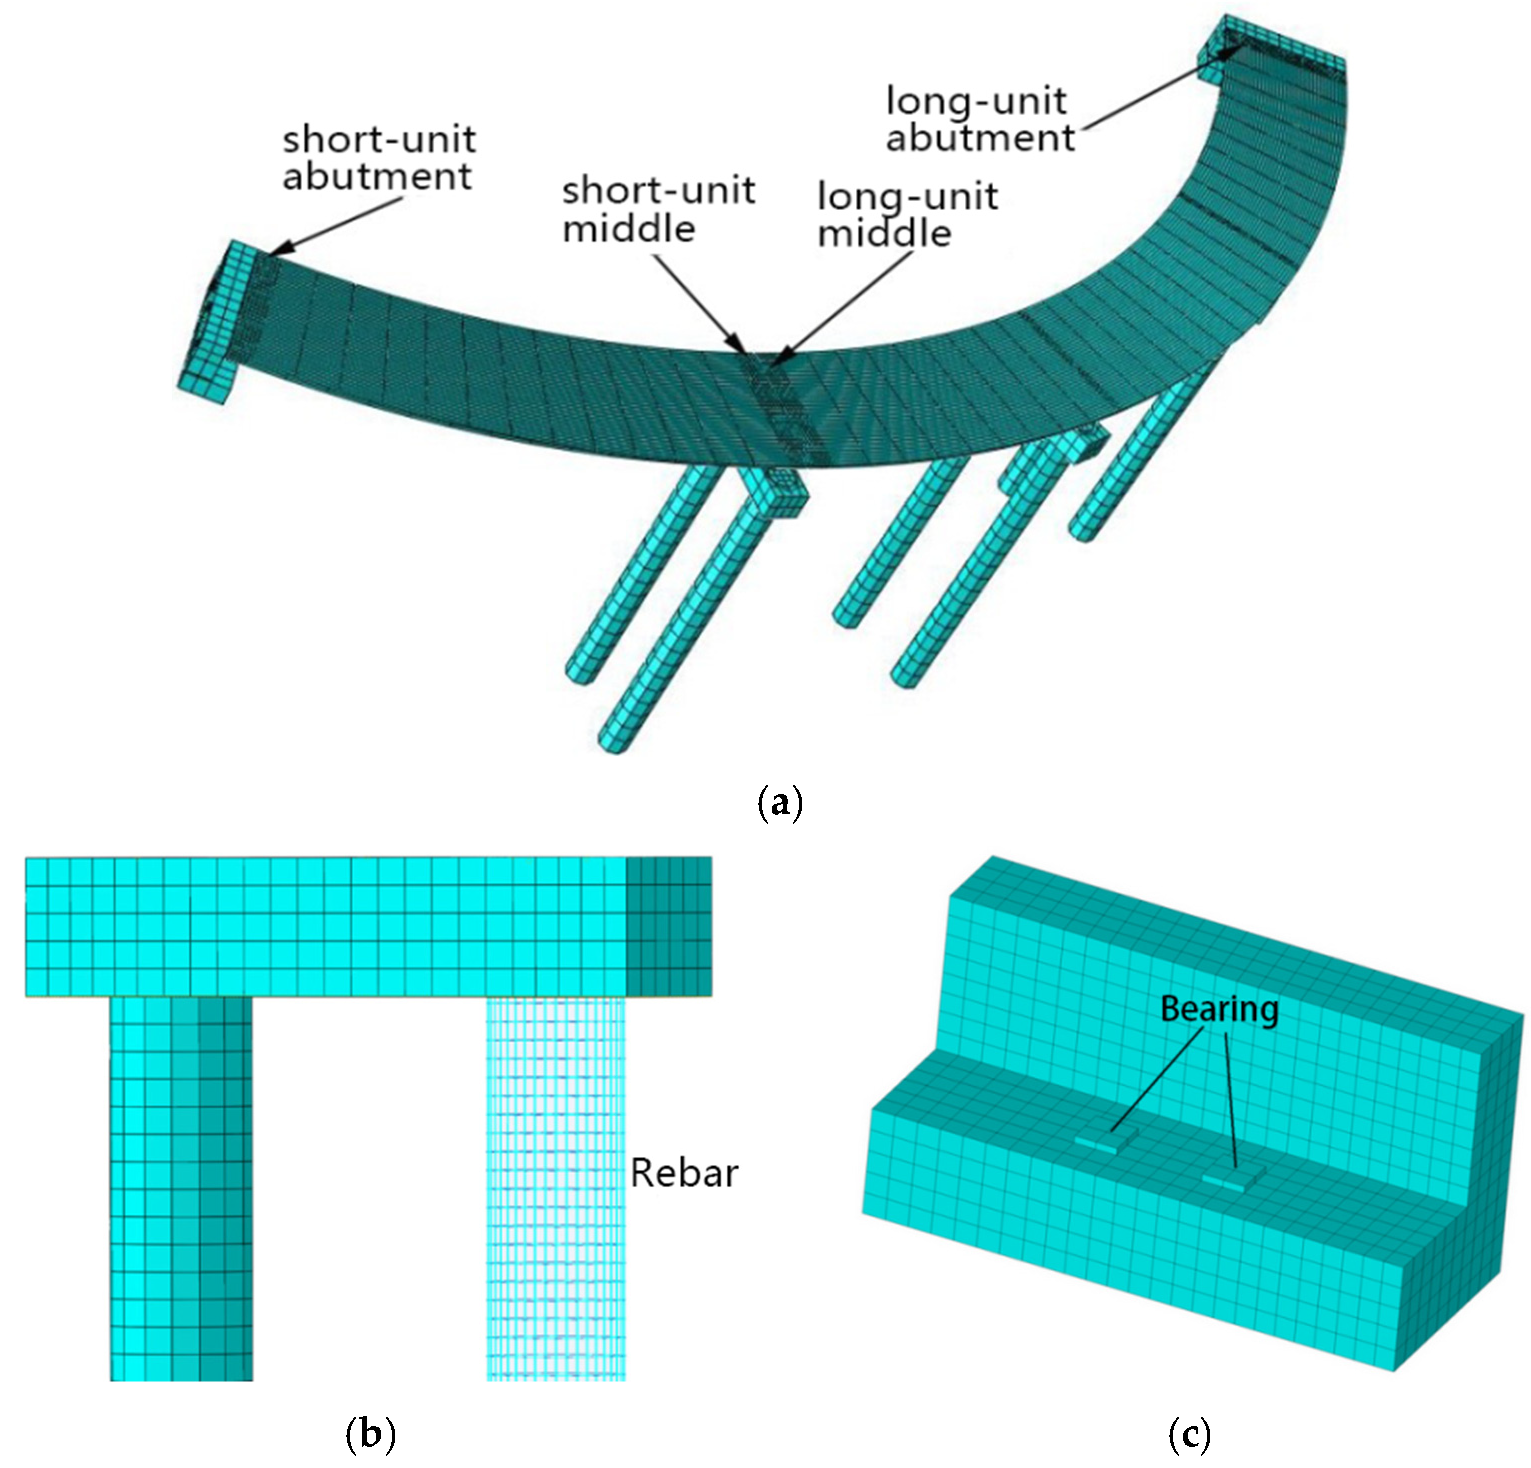
2.1. Bridge Main Structure Model

This paper establishes afinite element model with ABAQUS software to carry out a structural dynamic nonlinear time-history analysis, considering the non-uniform collision response between the expansion joints of the curved continuous girder bridge and the nonlinearity of the piers, damping devices and supports.
The superstructure of the bridge is a reinforced concrete box girder. Because of the asymmetrical collision response between the expansion joints, the use of beam elements is not applicable. Considering the solid element integral model, the three-dimensional solid reduction integral element C3D8R is used to simulate the bridge deck [28]. In order to better simulate the collision response without excessive calculation workload, the bridge deck main girder uses the multi-scale method to divide the grid [29]. Refining the grid at the expansion joint, the grid size near the expansion joint is 0.18 m, and the grid size at other parts is 0.50 m. The pier adopts a separated model; the three-dimensional solid reduction integral element C3D8R is used to simulate the concrete; the two-node bar element T3D2 is used to simulate the reinforcement [28].
The concrete intensive grade is C40, and the concrete damage plasticity model is used as the constitutive model [30], which describes the stiffness degradation of concrete during an earthquake through the tensile and compressive damage factors. For C40 concrete, the modulus of elasticity is 3.25 × 10⁴ N/mm2, the density is 2400 Kg/m3, and the Poisson’s coefficient recommended is 0.2. In the plastic phase of concrete material, the stress-strain relationship and damage factor of the constitutive model are shown in Table 1. Furthermore, the characteristics of the longitudinal and transverse reinforcement bars are defined based on the bilinear elastic-plastic model shown in Figure 3. The elastic modulus of the longitudinal reinforcement and transverse reinforcement bars is 2.0 × 10⁵ N/mm2 and 2.1 × 10⁵ N/mm2, respectively, and the yield strengths are 360 N/mm2 and 270 N/mm2, respectively. The limit strain is recommended to be 0.1; the density is 7850 Kg/m3, and the Poisson’s coefficientis 0.3. At the strengthening stage, the elastic modulus Eh is 1/100 of the initial elastic modulus Es.

2.2. Contact Collision Simulation

During an earthquake, the actual collision between adjacent structures of a curved bridge is not a single problem ofnormal frontal contact, but a complex problem ofspatial contact. The collision between adjacent components that is caused by the in-plane rotation of the curved bridge is arbitrary and asymmetrical. In order to consider anon-uniform collision, the master–slave surface method [28] is used. This method is mainly applied to deal with the contact between two surfaces, and could simulate the non-uniform collision between adjacent contact surfaces at the expansion joints with relative accuracy. The master–slave surface method involvestwo surfaces in contact with each other as master and slave surfaces, respectively, and the nodes on the master and slave surfaces are defined as master and slave nodes, respectively. Duringthe analysis process, the following instruction s should be followed: first, search for the contact pairs on the master and slave surfaces; next, calculate the effect of the contact pairs. The algorithms involved mainly include search algorithm and contact algorithm. The surface-to-surface contact automatic search algorithm [28] is used in this paper, and the penalty function method [28] is used as the contact algorithm. The penalty function method is used to obtain the contact force by multiplying a penalty parameter related to the element stiffness by the contact surface intrusion value [31]. The calculation of the contact force mainly includes the normal contact force and tangential friction force. In ABAQUS software, the “surf-to-surf” command adopted to simulate the normal contact force is set as “hard contact”, and the penalty friction is adopted to simulate tangential force [28]. According to [32], the tangential friction coefficient is set as 0.5.
There are three types of contact pairs in the bridge model. One is formed by the adjacent structural surfaces at the expansion joints of the curved bridge. The expansion joint at the abutment position takes the abutment contact surface as the master surface, the middle expansion joint takes the contact surface of long unit girder as the master surface, and the corresponding surface is the slave surface, including the free surface of the rubber pad. Another is formed by the top surface of the sliding support and the bottom surface of the girder at the corresponding position, with the bottom surface of the girder as the master surface and the top surface of the support as the slave surface. The other is formed by the contact surfaces of the other components, including the upper and lower surfaces of the fixed support and its adjacent contact surfaces, the contact surfaces between cylindrical piers and cap beams, and the contact surfaces between rubber pads and the girder attached to it.The three-dimensional finite element model of the whole structure and its components is shown in Figure 4. In order to express the collision response at different expansion joints more clearly, they were named as shown in Figure 4 and Figure 5. The three expansion joints are respectively named as short unit expansion joints, middle expansion joints, and long unit expansion joints; the positions of the collision surface are respectively named as the short-unit abutment position, the short-unit middle position, the long-unit middle position, and the long-unit abutment position; the nodes at both ends of the expansion joint are numbered.

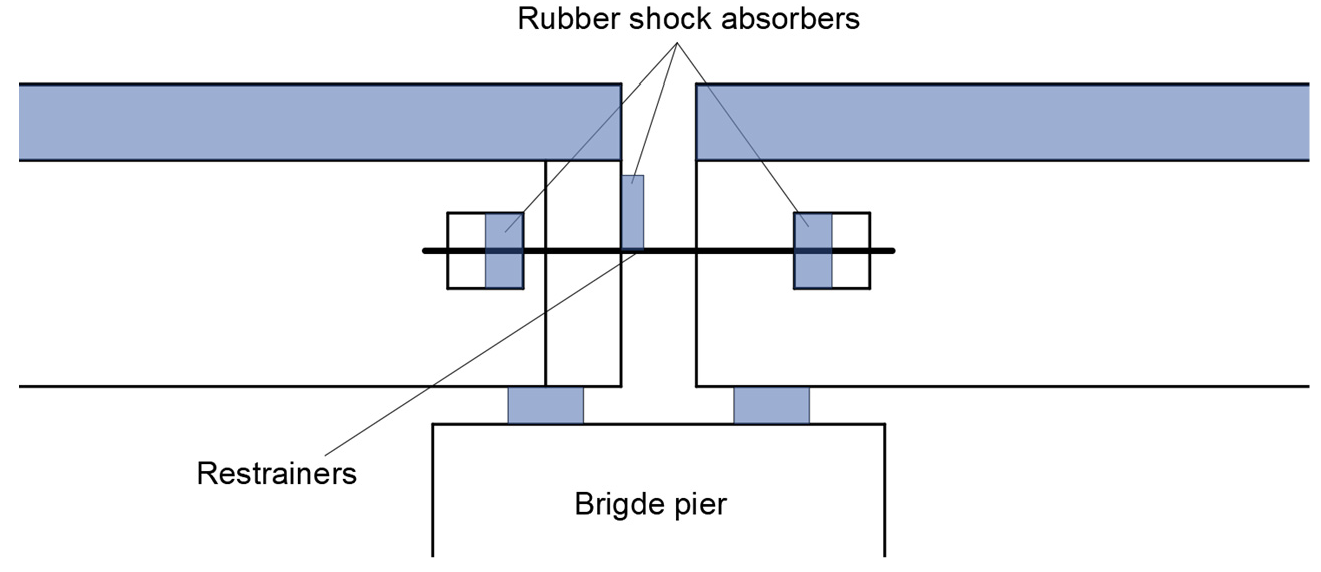
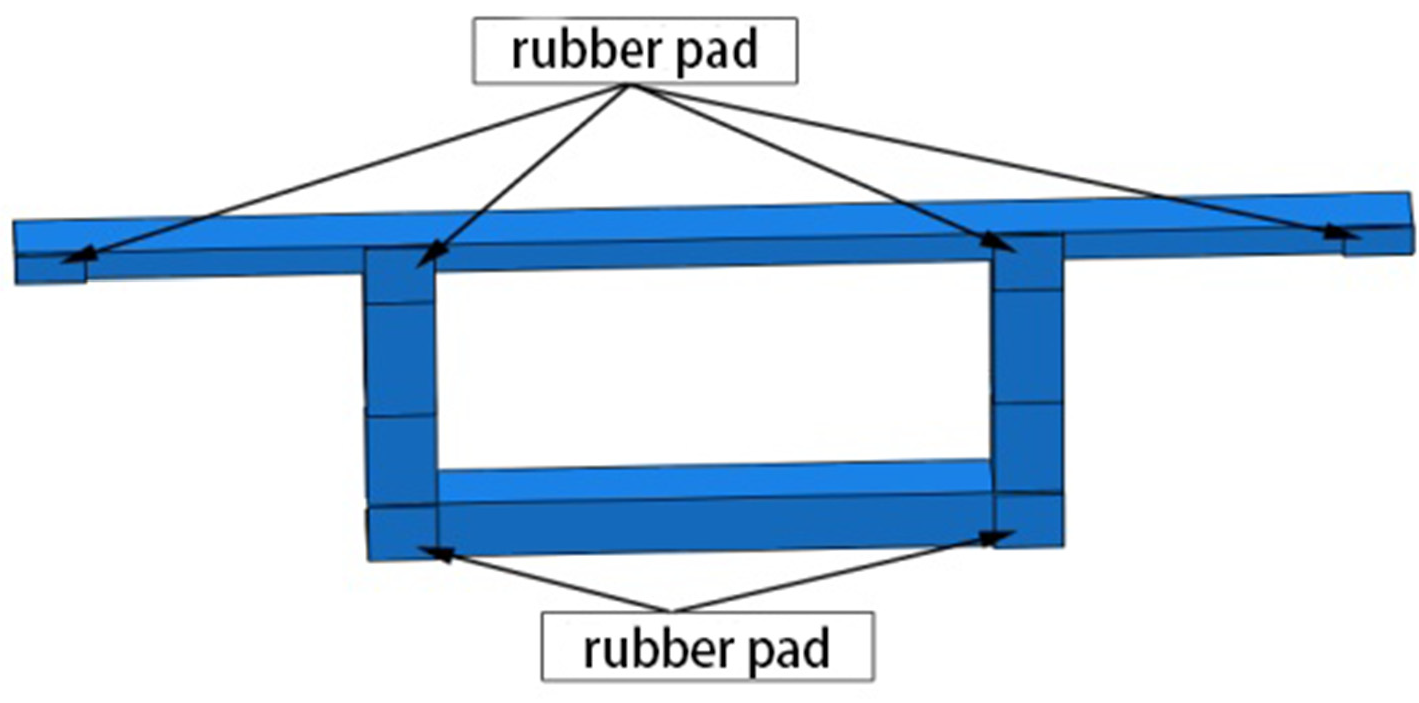
2.3. Seismic Mitigation and Unseating Prevention Devices

In order to reduce the collision response of the curved girder bridge and improve the seismic performance during seismic shock, a relatively effective method is to install unseating restrainers or damping devices inside and outside the expansion joints. The restraint effect of the unseating restrainer and the energy consumption effect of the damping device can effectively reduce the torsion and collision reaction of the beam to achieve the goal of pounding mitigation and unseating prevention. The seismic mitigation and unseating prevention devices used in this paperinclude viscoelastic dampers, viscous dampers, steel strand cables-rubber pads, and lead-core rubber bearings.
Steel strand cable restrainers are usually used to prevent the girder from falling, but traditional steel strand cables can only bear axial tension. Therefore, they prevent unseating but offer no pounding mitigation function. In order to achieve the goal of seismic mitigation and unseating prevention function simultaneously, the two ends of the steel stranded cable are anchored at the webs of the beams on both sides of the expansion joint, and rubber pads are set between the expansion joints, as shown in Figure 6. The setting of rubber pads on the contact surfaces of each expansion joint isshown in Figure 7. The restrainer can prevent excessive relative displacement between the beams to perform the unseating prevention function. The rubber pad can buffer collisions with adjacent beams, and can also absorb the energy generated by the collision between the beams and avoid the direct collision of adjacent beams, thereby mitigating pounding.
The pounding mitigation and unseating prevention device is composed of the Strand Cable-Rubber Blanket (SCRB), which is mainly composed of steel strand cables and rubber pads. Among these, the rubber pad is made of general rubber, and its elastic modulus is taken as the elastic modulus of natural rubber. The cable restrainer used on the bridge usually is the steel stranded cable. The mechanical model of the cable restrainer can be the bilinear model. Its pre-yield stiffness is K1, its post-yield stiffness is K2, and it generally takes K2 = 0.05 K1 [12]. The elongation of the steel cable, whose length is L, is ΔL, and the pre-yield stiffness can be calculated using the following formula:
K 1 = E A 0 L
E = T L A 0 Δ L = E ( 6 L 3 + 1.0671 S 3 ) L ( 6 S + 1.0671 L ) S 3
where E′ is the elastic modulus of steel strand,
T is the total tension of steel strand,
E is the elastic modulus of steel wire, generally taken as 2 × 10⁵ N/mm2,
S is the length of inner and outer wire of a twist pitch, S = 4 π 2 R 2 + L 2 ,   R = d 1 + d 2 2 = 1.0165 d 1 ,
R is the distance between the centerline of the outer wire and the centroid of the steel strand,
d1 is the cross-section diameter of outer wire,
d2 is the cross-section diameter of inner wire.
Consider the use of lead rubber bearings (LRB) and laminated rubber bearings (GJZ) for seismic isolators. The shear force-displacement hysteretic curve of laminated rubber bearings, which can be approximately linearized, is narrow and long, [33]. The stiffness of the lead rubber bearing includes vertical stiffness, horizontal stiffness, and horizontal equivalent stiffness. The horizontal stiffness includes two important parameters, namely the pre-yield stiffness and the post-yield stiffness. The horizontal restoring force model can be simulated by the bilinear model.The pre-yield stiffness of the support is used in the elastic stage, and the post-yield stiffness is used in the plastic stage. According to industry standards [34], the ratio of the pre-yield and post-yield stiffness is between 0.15 and 0.16; in this paper, it is taken as 0.154.
Viscoelastic Dampers (VEDs) arecomposed of viscoelastic material, which is usually polymer, constrained steel plate, and related parts. Viscoelastic dampers depend on the damping of some viscoelastic material, and they feature initial stiffness. Theircommon mechanical calculation models include the Kelvin model, the standard linear and equivalent standard solid model, etc. The most commonly used model to describe the properties of Viscoelastic Dampers is the Kelvin model. The Kelvin model [35] is composed of a spring and a damper in parallel. This model is used in this article, and its mechanical equation is as follows:
f = k u + c u ˙
where u is the displacement acting on the model,
f is the output force of the damper,
k is the spring equivalent stiffness,
c is the equivalent damping coefficient.
Viscous Fluid Damper (VFDs) arecomposed of pistons, cylinders, orifices, and other related components. Viscous dampersare velocity-dependent and can dissipate seismic energy without adding any initial stiffness to the bridge structure. The mechanical model of VFDs adopt the Maxwellmodel, which is created by connecting the spring and dampers in series. Due to the series of viscous elements, deformation will increase infinitely under any small external force, so the Maxwell model is essentially viscous. According to [36], if the actual frequency is less than the cut-off frequency of 4 Hz, the effect of the spring stiffness on the displacement is negligible. Therefore, the relationship between the damping force and the relative speed can be expressed by the following formula:
f = c u ˙ α
where c is the damping coefficient,
α is the speed index.
In order to achieve a better effect of pounding mitigation and unseating prevention, the aforementioned damping devices and unseating restrainers were optimized in combination. The four cases obtained are shown in Table 2. In the table, Case A represents the original structure, in which all supports are GJZ, and there is no unseating restrainer at the expansion joints. All the supports in Case F are GJZ, and the VED and SCRB are set inside and outside the expansion joints. All the supports in case G are GJZ, and the VFD and SCRB are set inside and outside the expansion joints. All the supports in case H are LRB, and SCRB is set inside and outside all the expansion joints.
The design parameters of the damping devices and unseating restrainers selected in the calculation conditions are shown in Table 3.

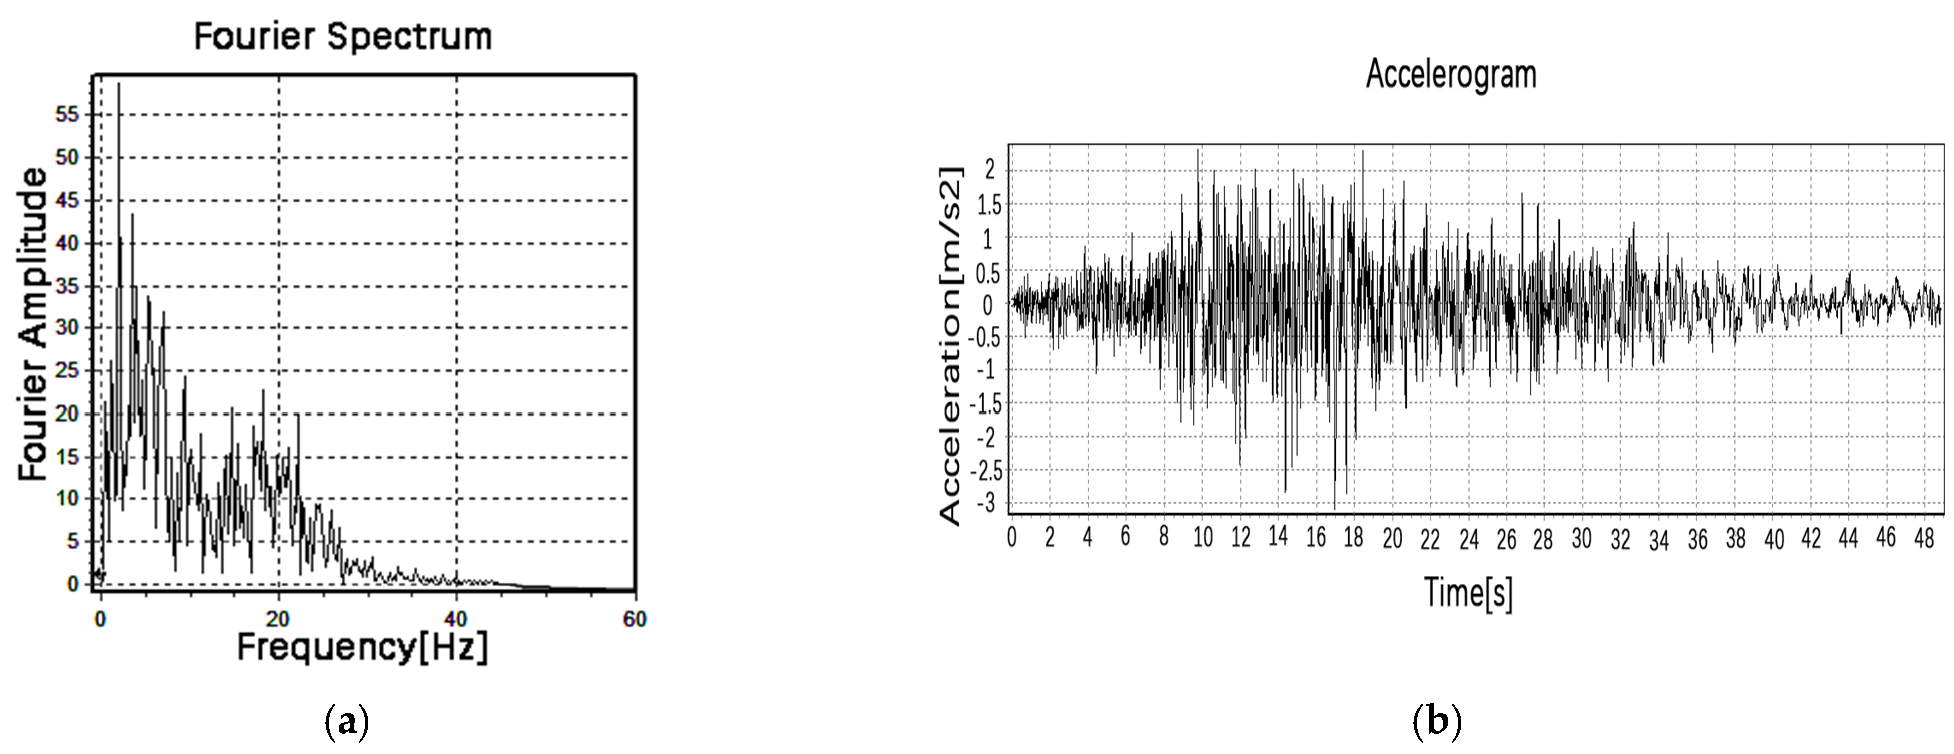
3. Dynamic Analysis Method and Ground Motion Input

Implicit and explicit algorithms can be used to solve dynamic equations, sincethe low frequency component is usually the main component in the dynamic response of the bridge structure. Considering the calculation accuracy, a larger time step is allowed; therefore, the unconditionally stable implicit algorithm, the Newmark method, is used to solve the dynamic equation. The contact collision process is the nonlinear problem. Nonlinear dynamic equations require iterative solutions that adopt the modified Newton-Raphson iterative method [37]. The structure in this study considers Rayleigh damping. To determine the α and β factors, the radial frequency of the first mode and the highest mode to achieve a 90% modal mass participation wereconsidered, respectively. We tookthe damping coefficient as 0.05, the calculated massdamping coefficient α = 0.4158, and the stiffness damping coefficient β = 0.006.
The bridge is located in Renhe District, Panzhihua City, Sichuan Province, China, with site category I1 (i.e., with a shear wave velocity, VS, in the range of 250 to 500 m/s, and with a thickness of covering soil of less than 5 m). The seismic fortification intensity is determined to be 7 degrees (the peak acceleration of rare earthquakes is 3.1 m/s2). Through a modal analysis, it was determined that the basic period of the bridge structure is 0.7966 s. The wave selection software, compiled by the Structural Engineering and Disaster Prevention Center of Chongqing University, was used to input the basic information aboutthe bridge structure and site for wave selection, and MEX00003 was finally selected. The Fourier spectra and the acceleration waveform of the scaled ground motion are shown in Figure 8. Due to the far-field type of the selected motions, the vertical component of the motion was neglected; only the horizontal seismic ground motion was considered.
When analyzing the seismic response of curved bridges, the seismic input should be carried out separately along the connecting direction of two adjacent bridge piers to determine the most unfavorable seismic horizontal input direction. The curved bridge model established in this paper features three piers. According to the requirements of the specification, the ground motion should be input along the connection direction of piers ① and ② and the connection direction of piers ② and ③. Comparing the effect of collision response of curved bridges at different input angles of ground motion, it was found that the connecting direction of piers ② and ③ is the most unfavorable direction.Therefore, the seismic response of the structure was mainly analyzed when the seismic wave was input along the connecting direction of piers ② and ③.

4. Seismic Response Analysis

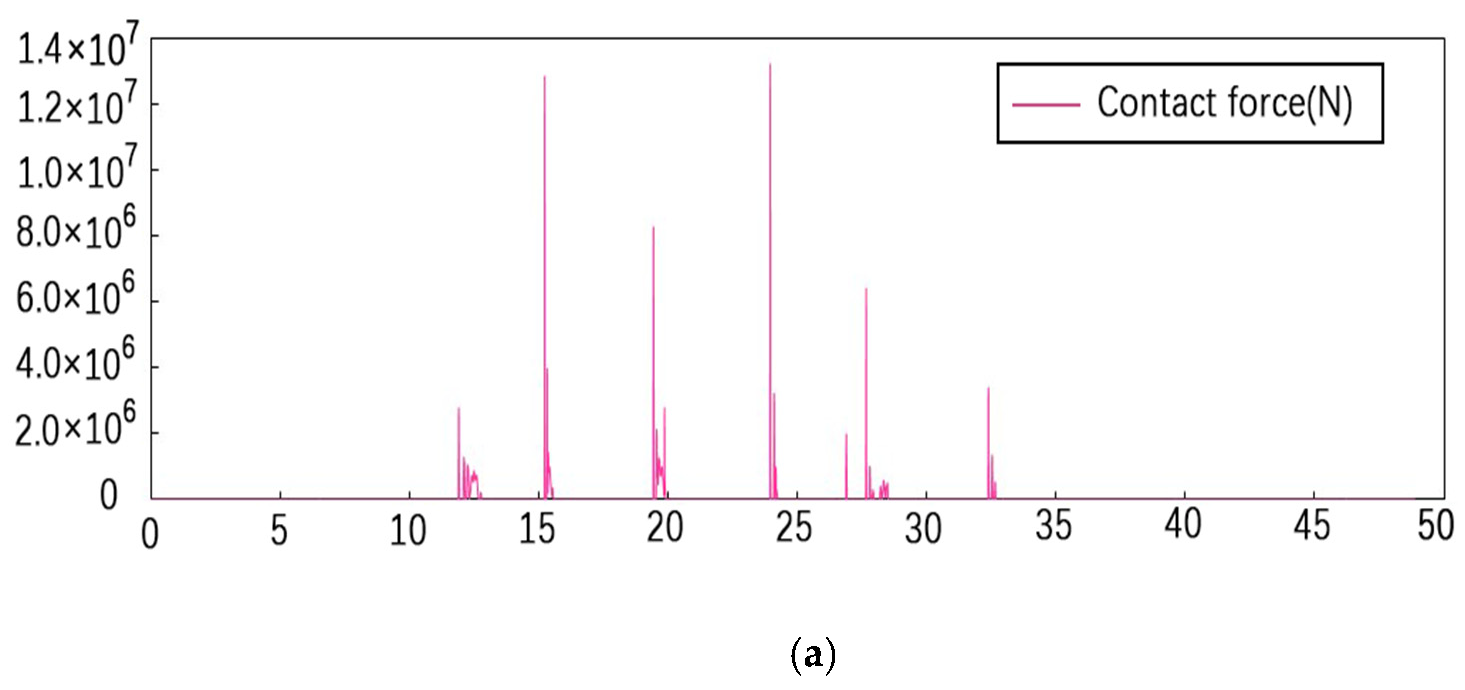
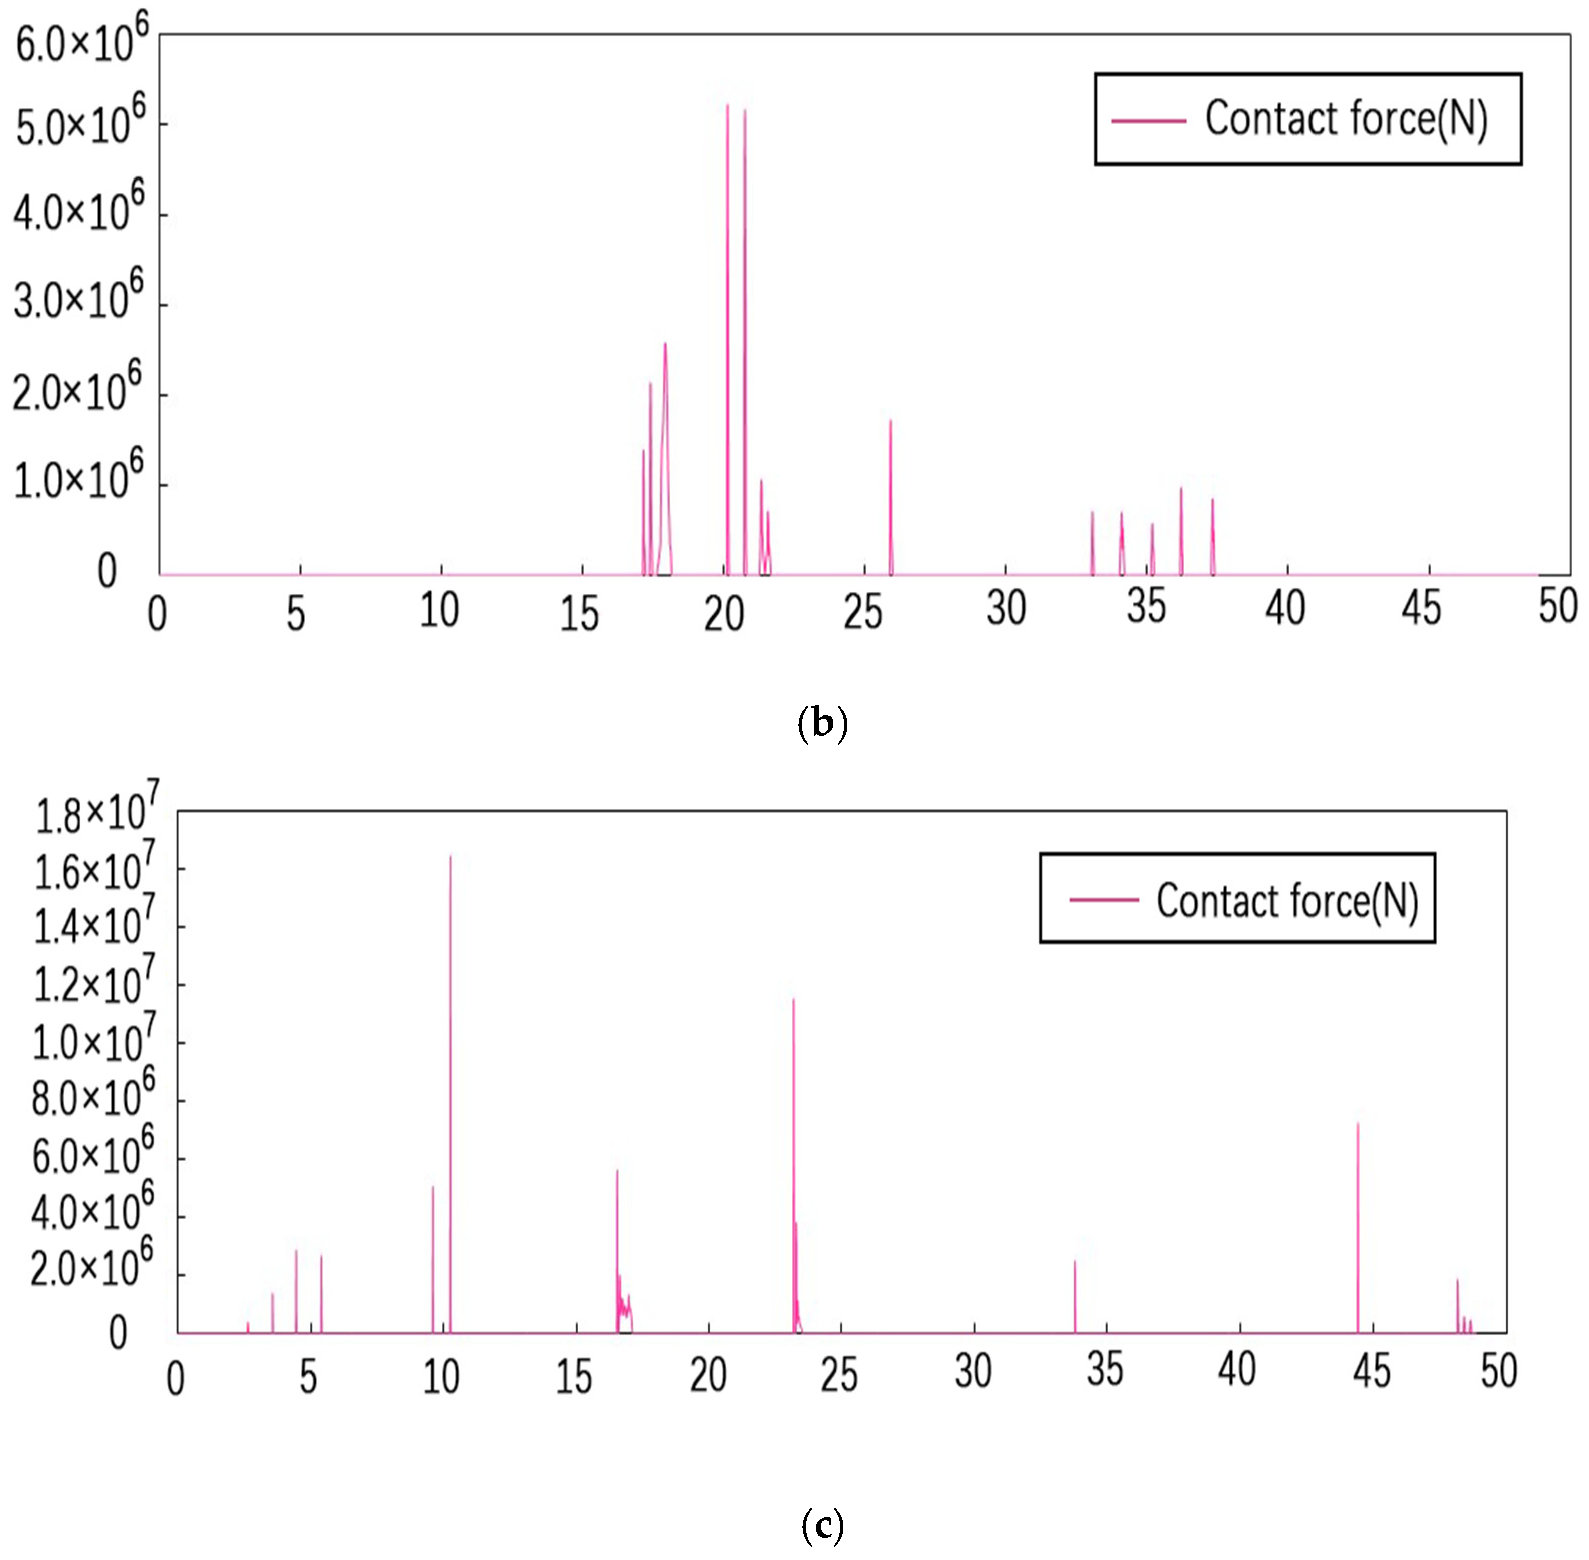
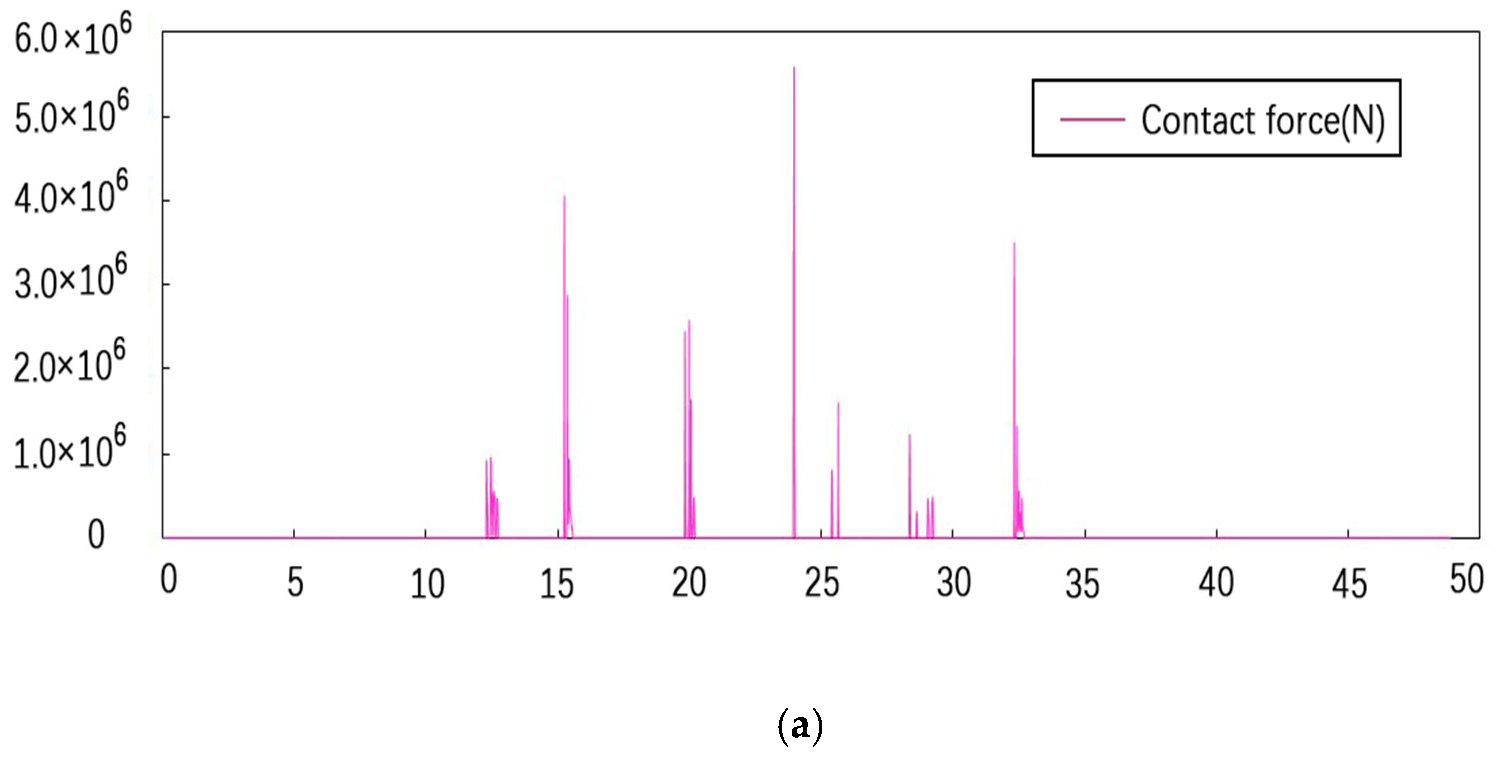
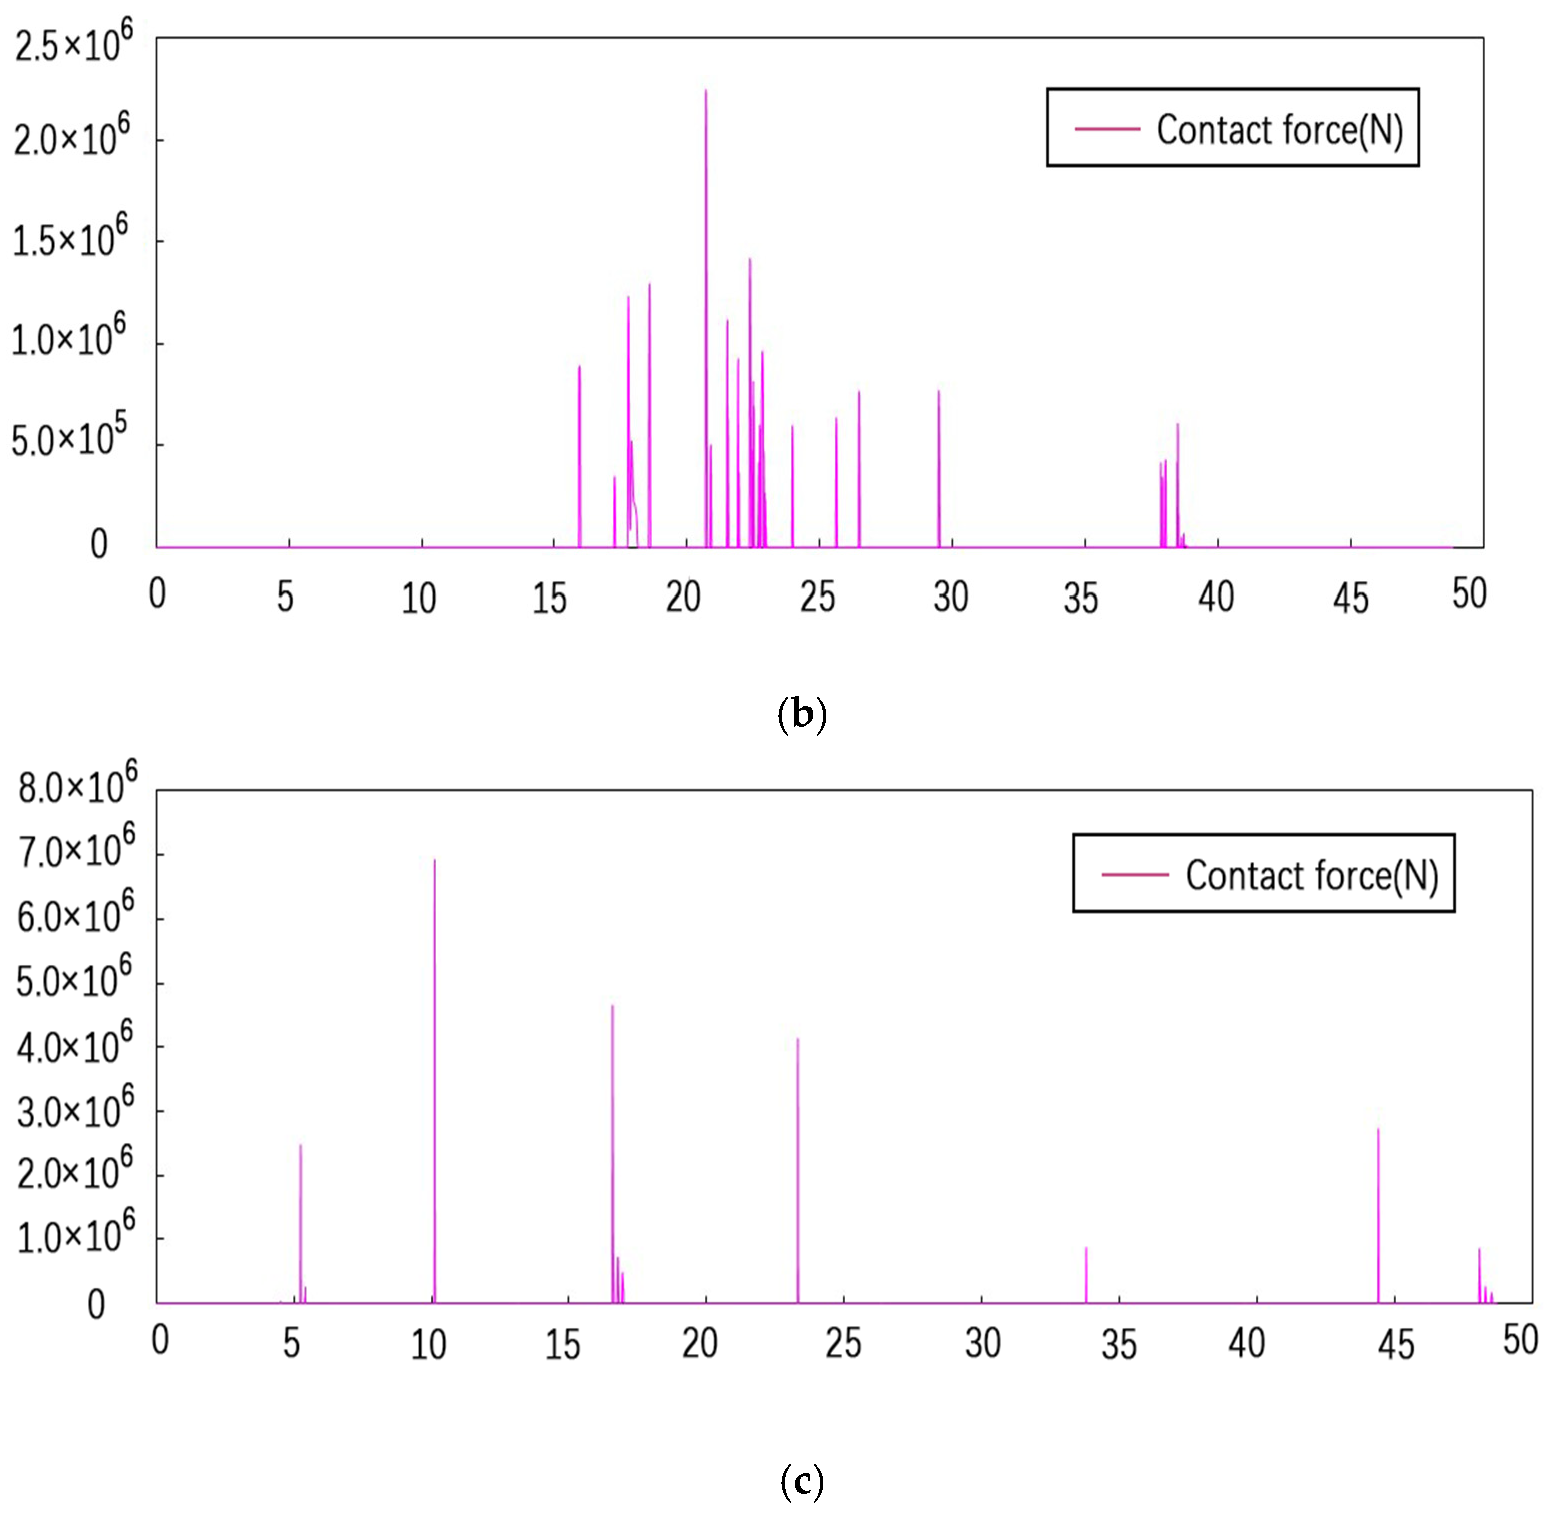
4.1. Contact Force between Adjacent Structures at the Expansion Joint

A comparative analysis of several cases was carried out on the displacement, stress, contact force, and damage of the bridge structure obtained through the dynamic analysis. Compare the peak value of the normal contact force at each expansion joint of the three combined shock absorption cases with the case A. The peak value of the normal contact force of each case is shown in Figure 9. The normal contact force time history of cases A and G are listed in Figure 10 and Figure 11.
From the analysis in Figure 9, the combined shock absorption working case provides more effective pounding mitigation. The maximum contact force of case F (the combination of VED and SCRB) is reduced by 47.6% at the maximum; case G (the combination of VFD and SCRB) is reduced by 57.9% at the maximum; and case H (the combination of LRB and SCRB) is reduced by 57.4% at the maximum. Thisindicates that the energy dissipation effect of dampers or seismic isolator plus the cushioning effect of rubber pads can greatly reduce the contact force between adjacent beams. Analyzing the anti-collision effect of each combination device from the perspective of contact force, the energy dissipation and seismic mitigation effect of the VFD and LRB combined with SCRB are more effective.
From the comparison of Figure 10 and Figure 11, it can be seen that in cases G and A, the contact force time history curves are similar and the moment of the maximum contact force is almost the same, but the maximum contact force is quite different. For case A, the times corresponding to the peak contact force at the three expansion joints (the peak contact force) are 23.95 s (13.22 MN), 20.16 s (5.23 MN), and 10.26 s (16.45 MN), and for case G, they are 23.98 s (5.56 MN), 20.72 s (2.25 MN), and 10.24 (6.92 MN). This shows that the maximum contact force was greatly reduced after installing the combined VFD and SCRB devices.

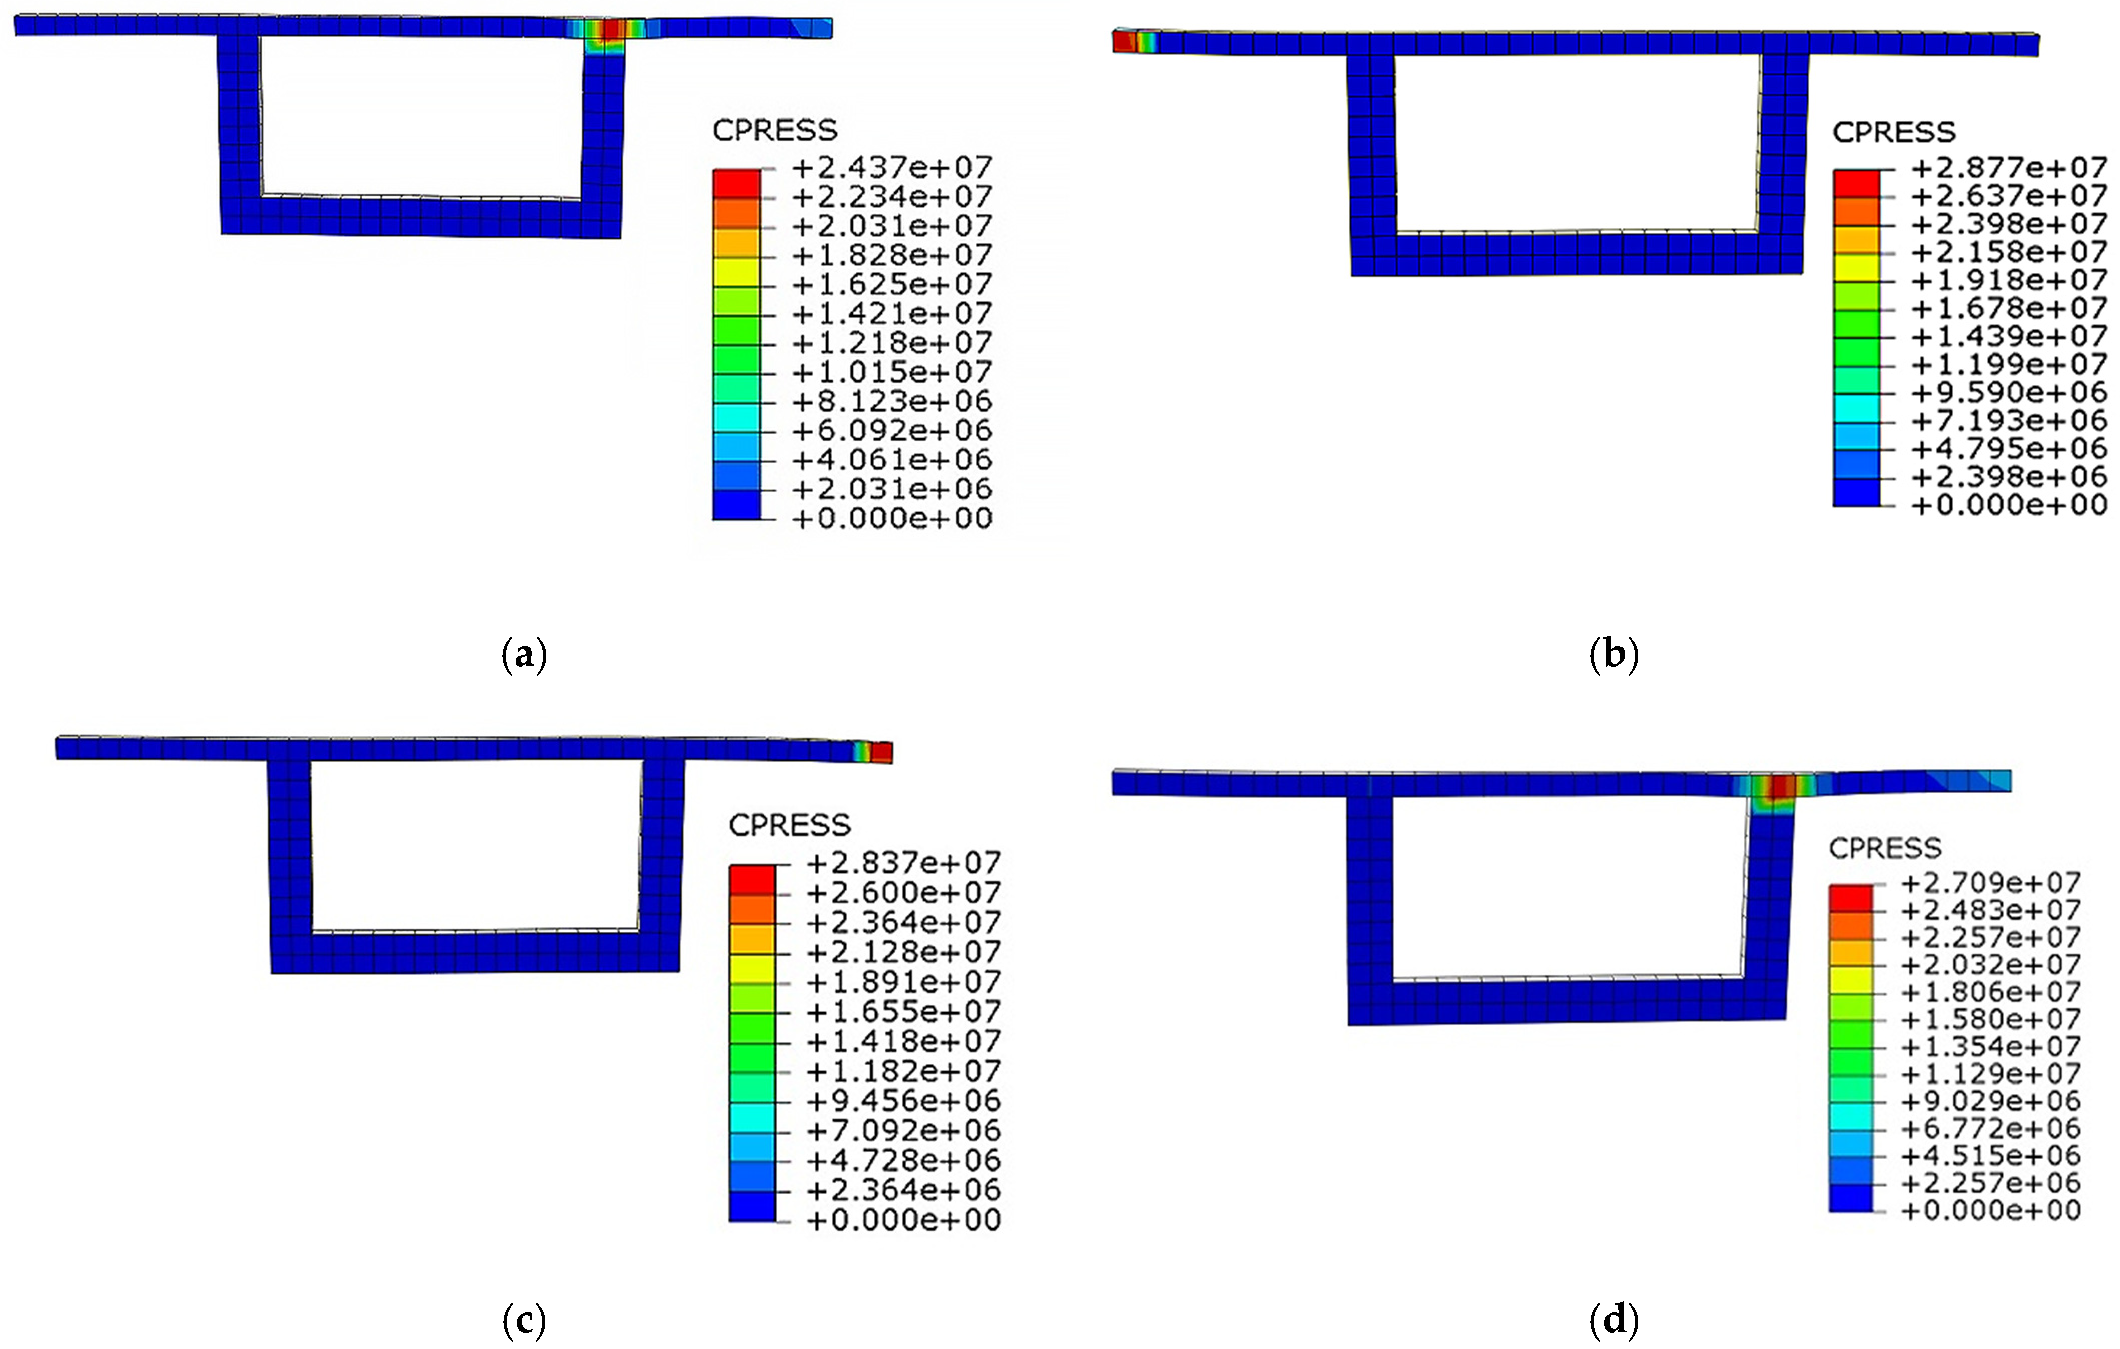
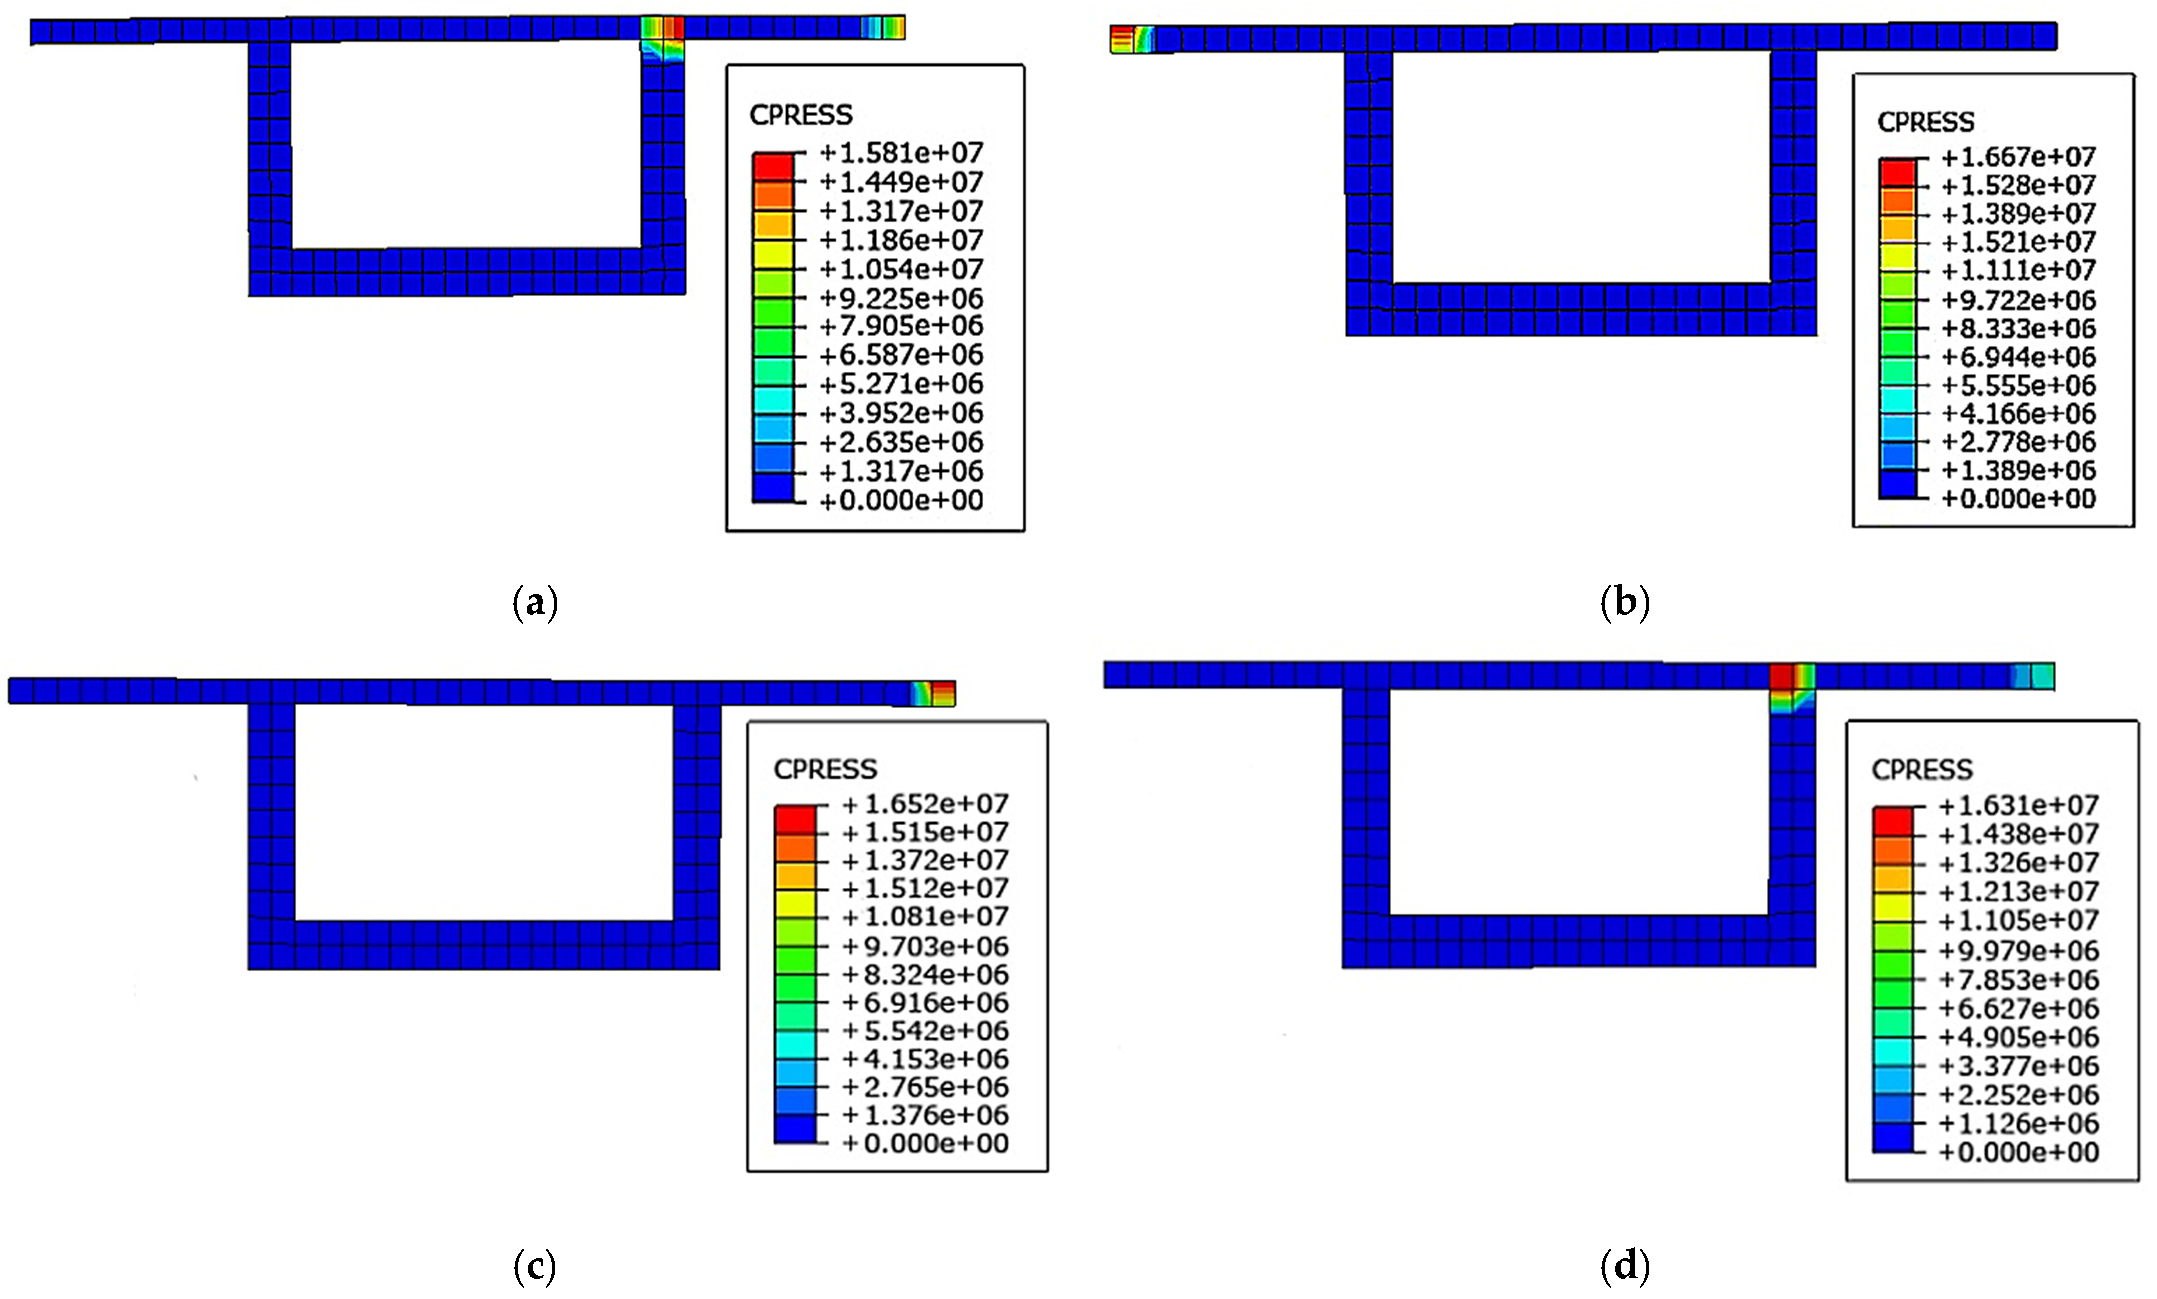
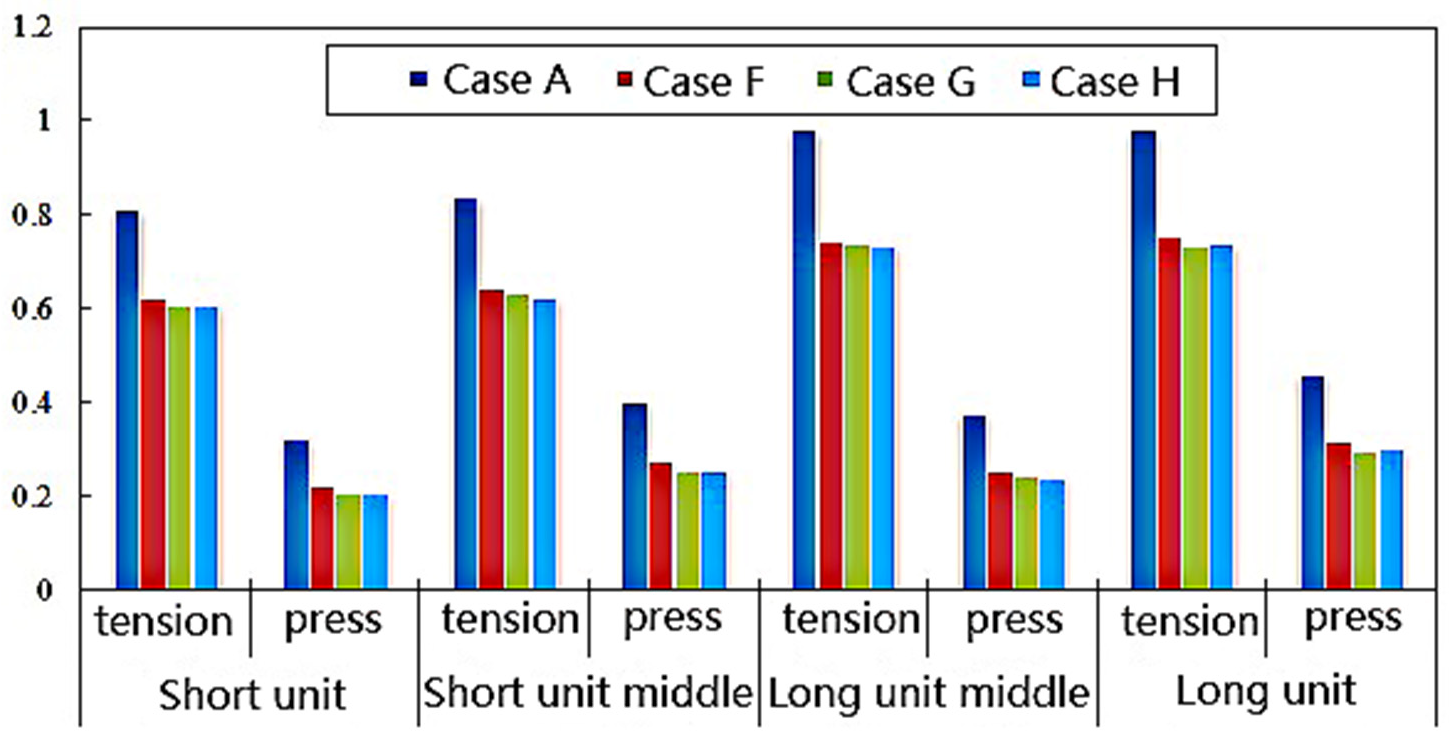
4.2. Contact Stress of the Contact Surface of the Expansion Joint

Extracting the normal contact stress of the contact surface at the expansion joint, the anti-collision effect of the combined case was analyzed from the perspectiveof stress. The position of each collision surface is shown in Figure 4, and the maximum stress of each combined case is shown in Figure 12. The peak stress of cases A and G, where the effect of the seismic mitigation is the strongest, is shown in Figure 13 and Figure 14.
According toFigure 12, these mitigation and unseating prevention devices could effectively reduce the maximum contact stress of contact surfaces. Case F (the combination of VED and SCRB) is reduced by 36.2% at the maximum; case G (the combination of VFD and SCRB) is reduced by 42.3% at the maximum; and case H (the combination of LRB and SCRB) is reduced by 41.5% at the maximum. Cases G and H are more effectiveat seismic mitigation and unseating prevention.
In Figure 13 and Figure 14, it is shown that the collision betweenadjacent components does not occur on the entire contact surface, but locally. The location of the maximum contact stress at different expansion joints is different. For the position of the short unit expansion joint, the collision occurs between the junction of the top plate of the box girder and the outer web and the bridge abutment in cases A and G. For the position of the middle expansion joint, the collision occurs between the outer side of the box girder top plate of the adjacent girder. For the position of the long unit expansion joint, the collision occurs between the junction of the top plate of the box girder and the inner web and the bridge abutment. After installing the pounding mitigation and unseating prevention devices, because of the installation of the rubber pad at the beam end on the side of the expansion joint, the contact stress only appears in the area with the rubber pad. Thisshows that the adjacent girders did not directly collide, but indirect collisions were caused by the force transmission of rubber pad.

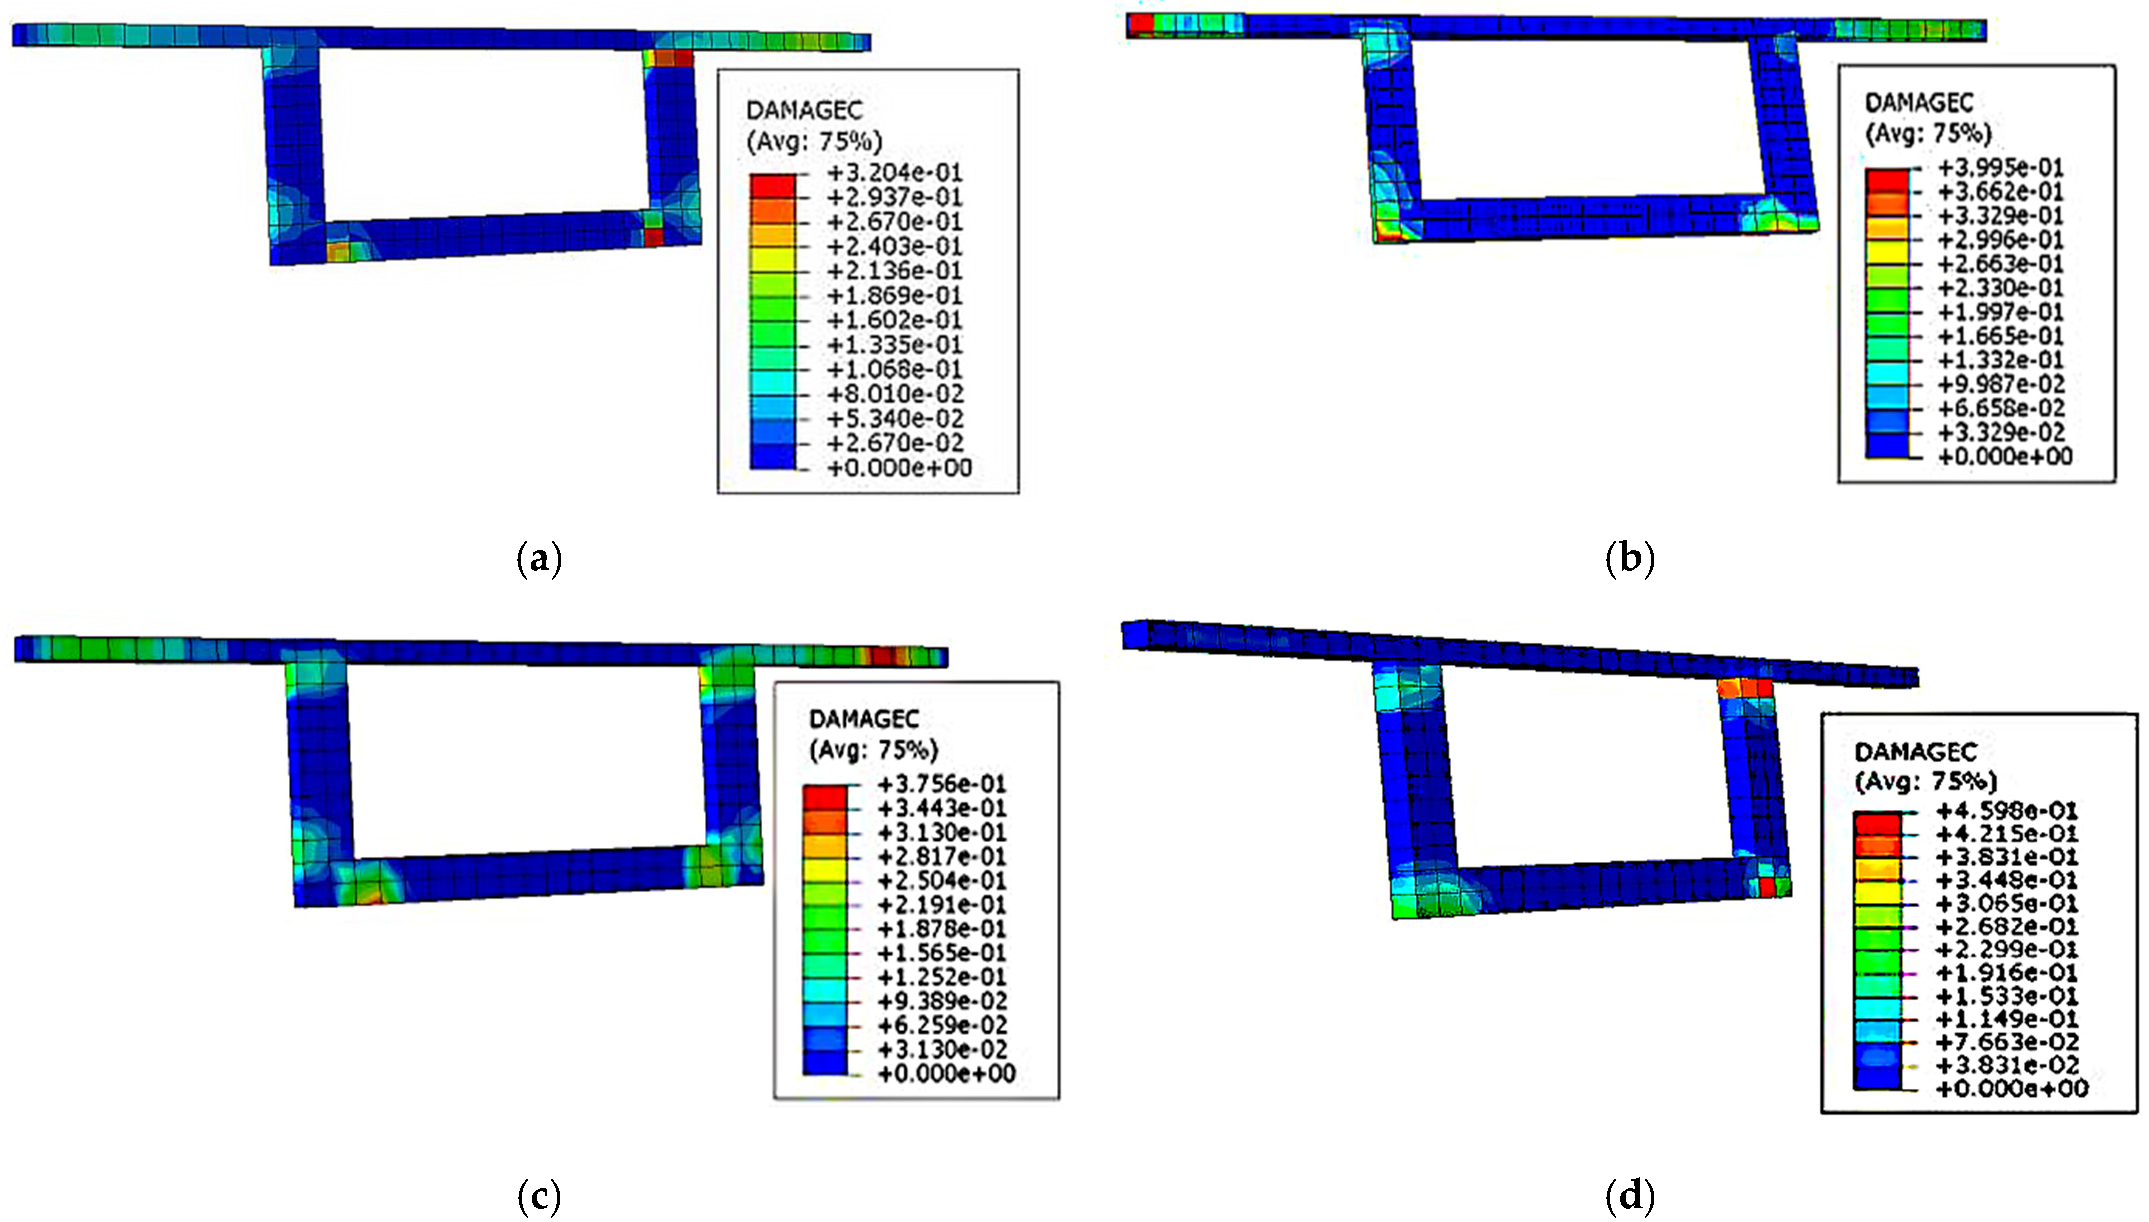
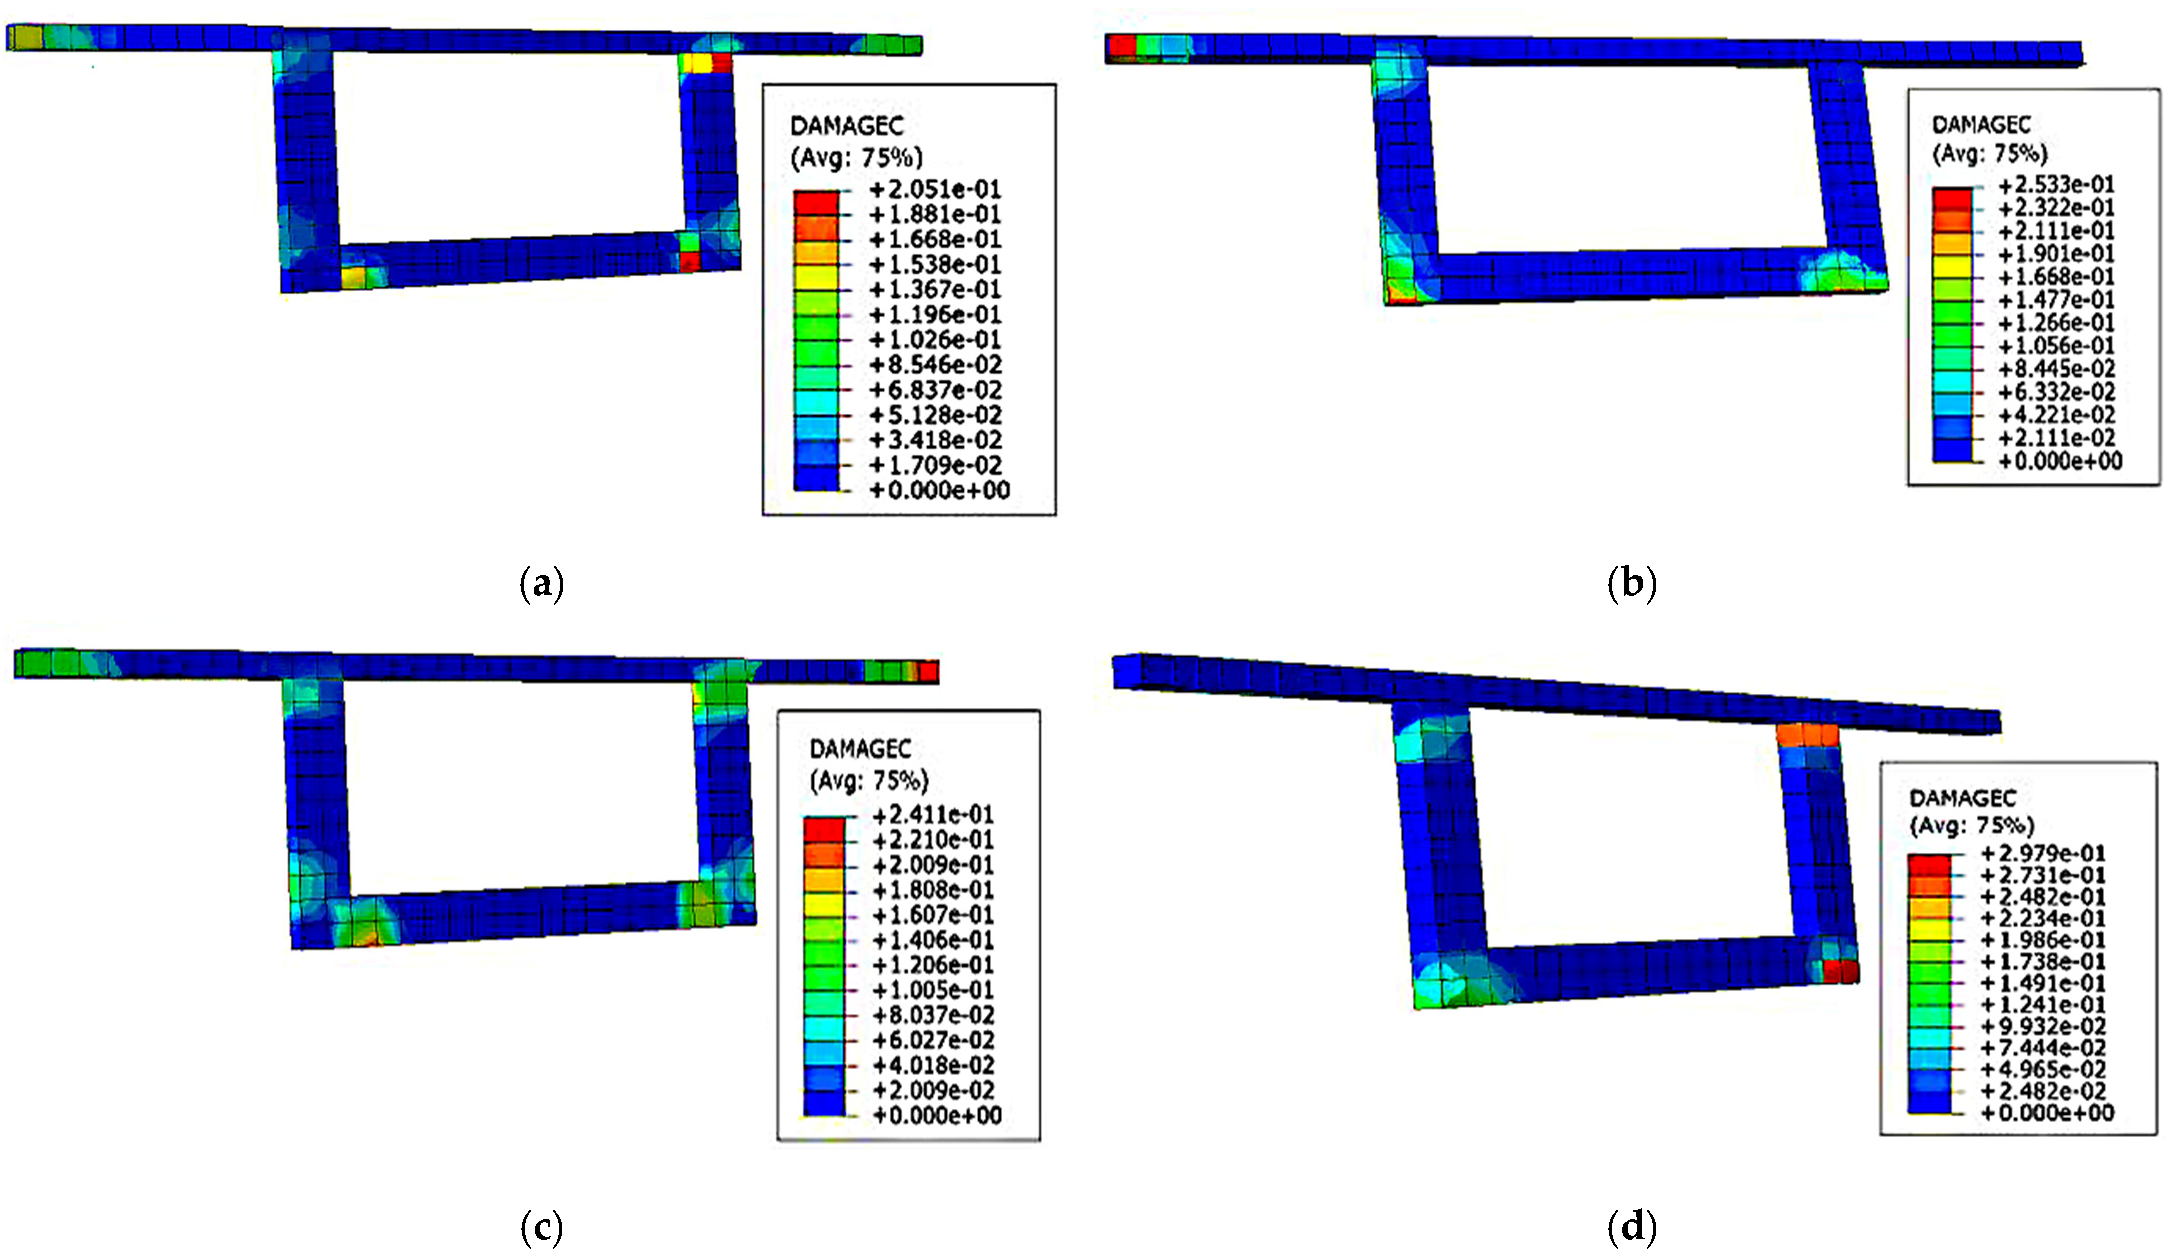
4.3. Damage to Adjacent Structures at Expansion Joints

We extracted the tensile damage and compression damage at the last moment of the ground motion of each case. The maximum cumulative damage of each combined case is shown in Figure 15. The compression damage of the girder at the expansion joints of cases A and G are shown in Figure 16 and Figure 17, respectively. The values in the figure represent the cumulative degree of plastic damage; 0 means the material is intact, 1 means complete loss of strength.
Figure 15 shows that the tensile damage toconcrete is more serious than the compression damage. After installing the seismic mitigation and unseating prevention device, both tension and compression damage are reduced to a certain extent, but the reduction ratio of the tensile damage is smaller and the ratio of compression damage reduction is larger. For tensile damage, the maximum reduction percentage in each combined case is about 24%. For compressive damage, case F (the combination of VED and SCRB) is reduced by 32.2% at the maximum; case G (the combination of NFVD and SCRB) is reduced by 36.6% at the maximum; and case H (the combination of LRB and SCRB) is reduced by 36.3% at the maximum.
From the comparison of Figure 13 and Figure 16, it can be found that the location where the maximum contact stress is generated is also the place where the compression damage is the most serious. This shows that the huge contact pressure generated by collision damages and destroysthe bridge structure.

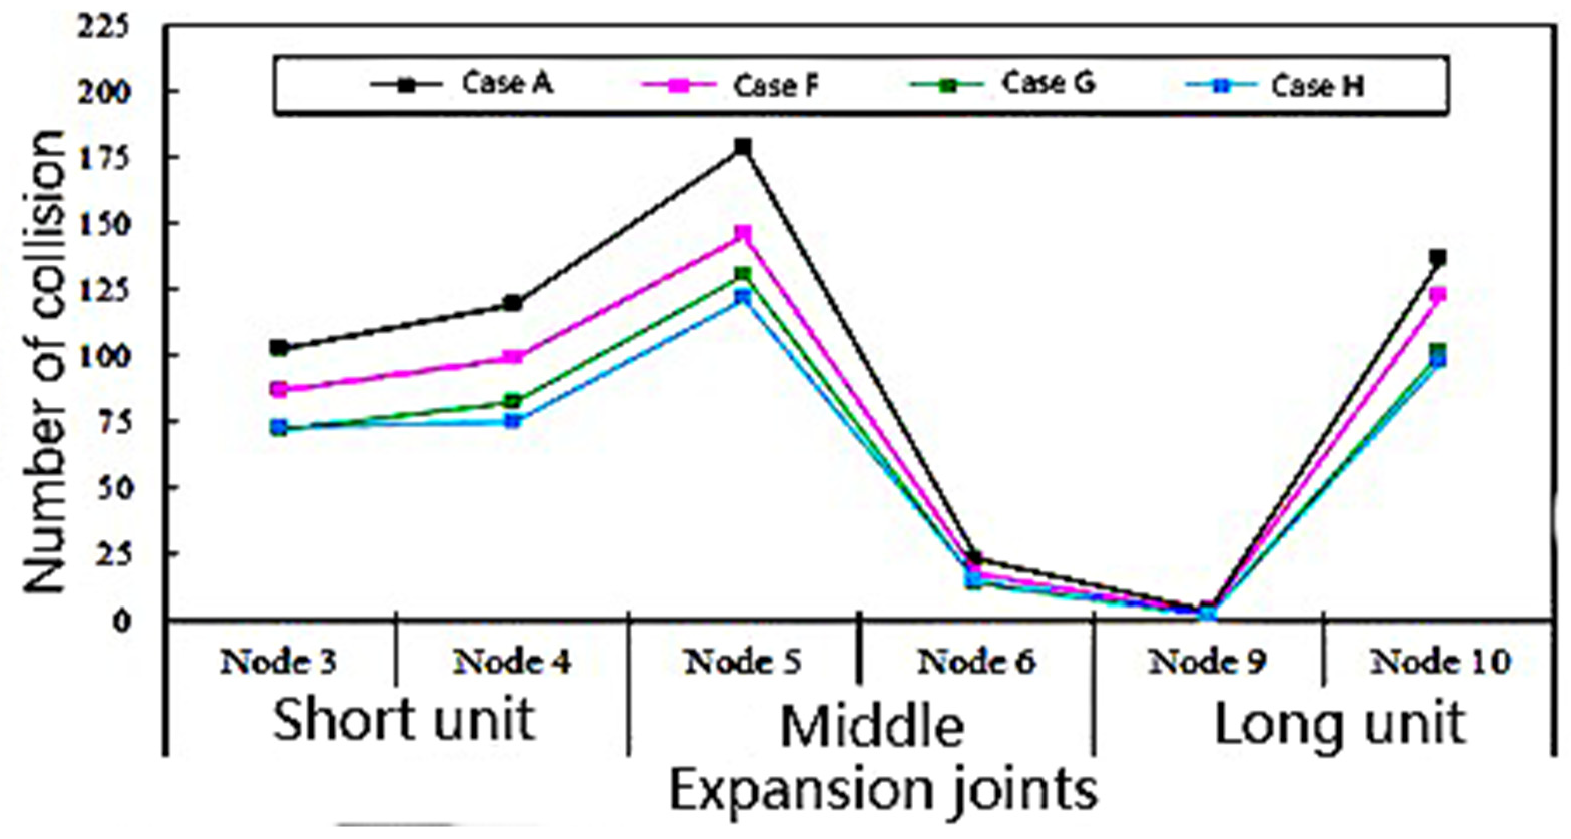
4.4. The Number of Collisions at the Edge of Expansion Joints

The timehistory contact stress of nodes at the edges of different expansion joints in each case was extracted, and the number of collisions of each node was obtained by statistics. Figure 18 shows the number of collisions at the edge of the expansion joints in each case. Refer to Figure 5 for the location of each node.
Figure 18 shows that each combined case can effectively reduce the number of collisions of each edge node, and cases G and H exerta better effect on reducing the number of collisions. The collision responses between the inner node and the outer node of the same expansion joint arequite different. At the short unit expansion joint, the number of collisions on the outer side (node 3) is less than on the inner side (node 4).At the middle expansion joint, the number of collisions on the outer side (node5) is much higherthan on the inner side (node 6), and the outer contact stress is greater.At the long unit expansion joint, the number of collisions on the outside (node 9) is far lower than on the inside (node 10), and the contact stress on the inside is greater. This phenomenon shows that when the seismic wave is input along the connecting direction of piers ② and ③, the short unit mainly twists horizontally, counterclockwise, around the Z axis, while the long link mainly twists horizontally, clockwise, around the Z axis; the length of the long unit bridge is longer, and the torsion effect is obvious, which makes the numberof collisions and the collision stress between the inner and outer nodes obviously different.

4.5. Displacement Response

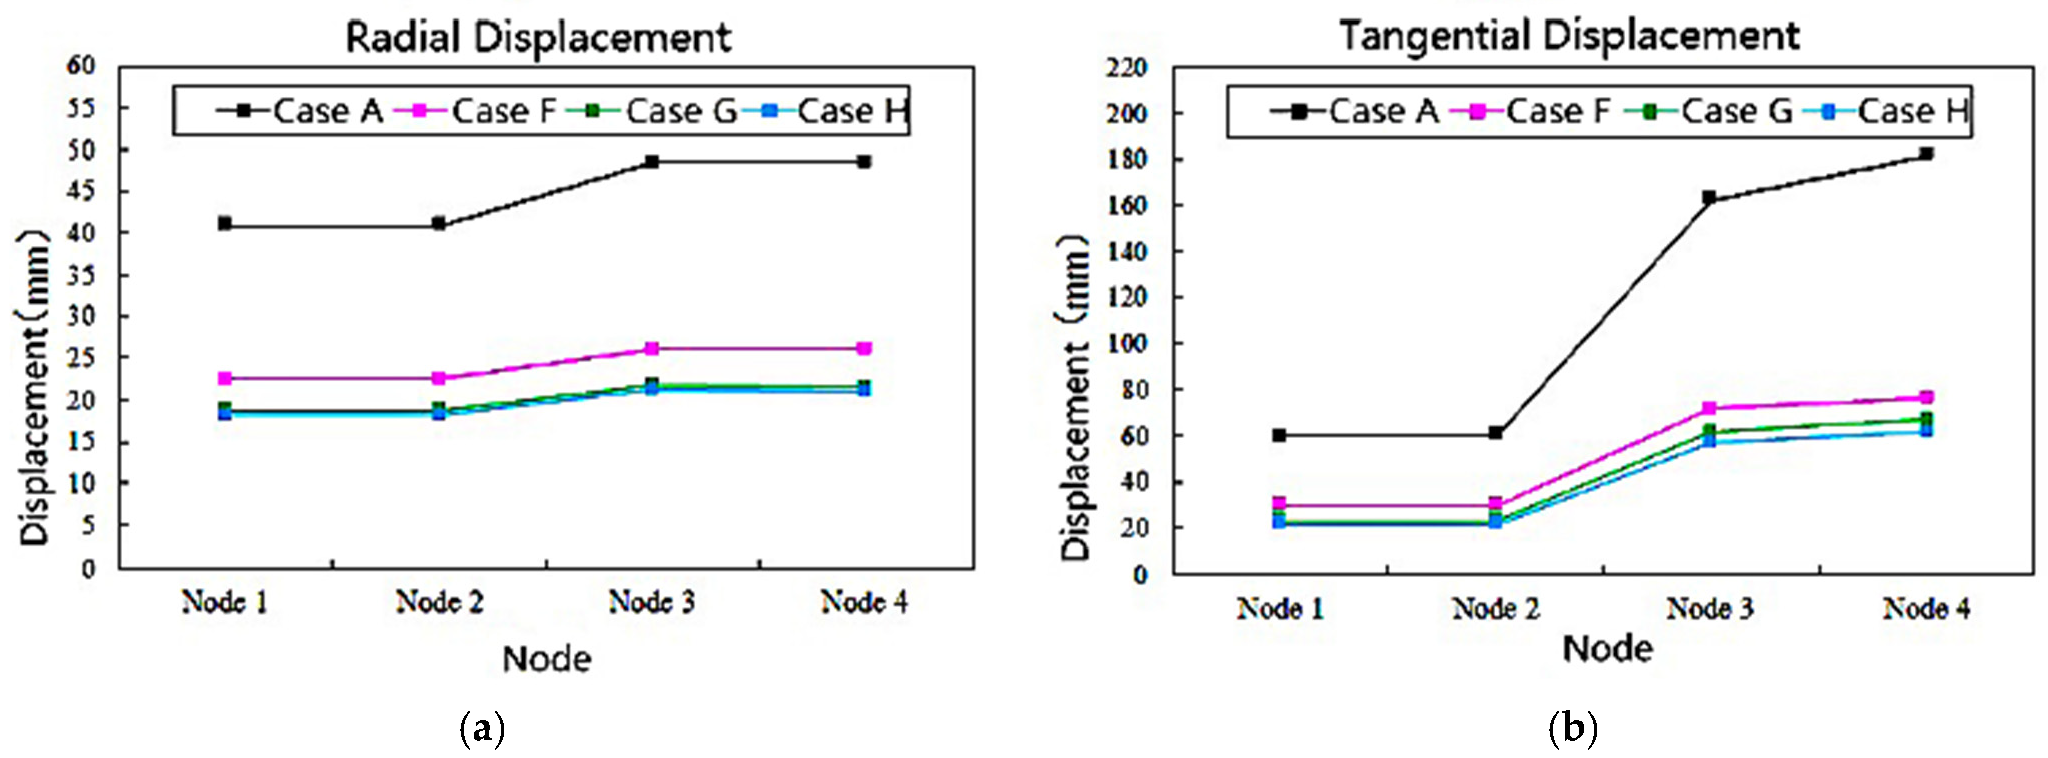
4.5.1. Displacement at the Short Unit Expansion Joint

We extracted the displacement of each node of the expansion joint and tookthe displacement of each node minus the displacement of the corresponding pier or abutment bottom node at each time. The displacement of the outer node was subtracted from the corresponding pier or abutment bottom, and the displacement of the inner node was subtracted from the corresponding pier or abutment bottom. Subsequently, the maximum absolute value was taken as the peak displacement of each node. We extracted the radial and tangential peak displacementof the four inner and outer nodes at the short unit expansion joint in all the cases, as shown in Figure 19.
Figure 19 shows that each combined case exertsan obvious effect on reducing the peak radial tangential displacement of each node at the edge of the short unit expansion joint, and the reduction rate reached more than 45%. Among these, cases G and H producethe greatestseismic mitigation effect. Comparing Figure 19a,b, the peak tangential displacement of the joint at the short unit expansion joint is obviously greater than the peak radial displacement of the joint. The main reason for this is that the ground motion in this paper only considers the input along the direction of piers ② and ③, and does not consider the input perpendicular to the horizontal direction. Therefore, the radial displacement of the beam is mainly caused by the torsion of the beam. The tangential displacement is composed of two parts, one of which is caused by the translation of the beam, and the other by the torsion of the beam.
Figure 19b shows that the difference in the tangential displacement ofnodes 3 and 4 in case A is mainly caused by the torsion of the girder. However, after installing the seismic mitigation and unseating prevention devices, the torsional response is effectively reduced, the inward and outward torsion is balanced and essentiallythe same, and the peak tangential displacement ofnodes 3 and 4 also become more consistent.

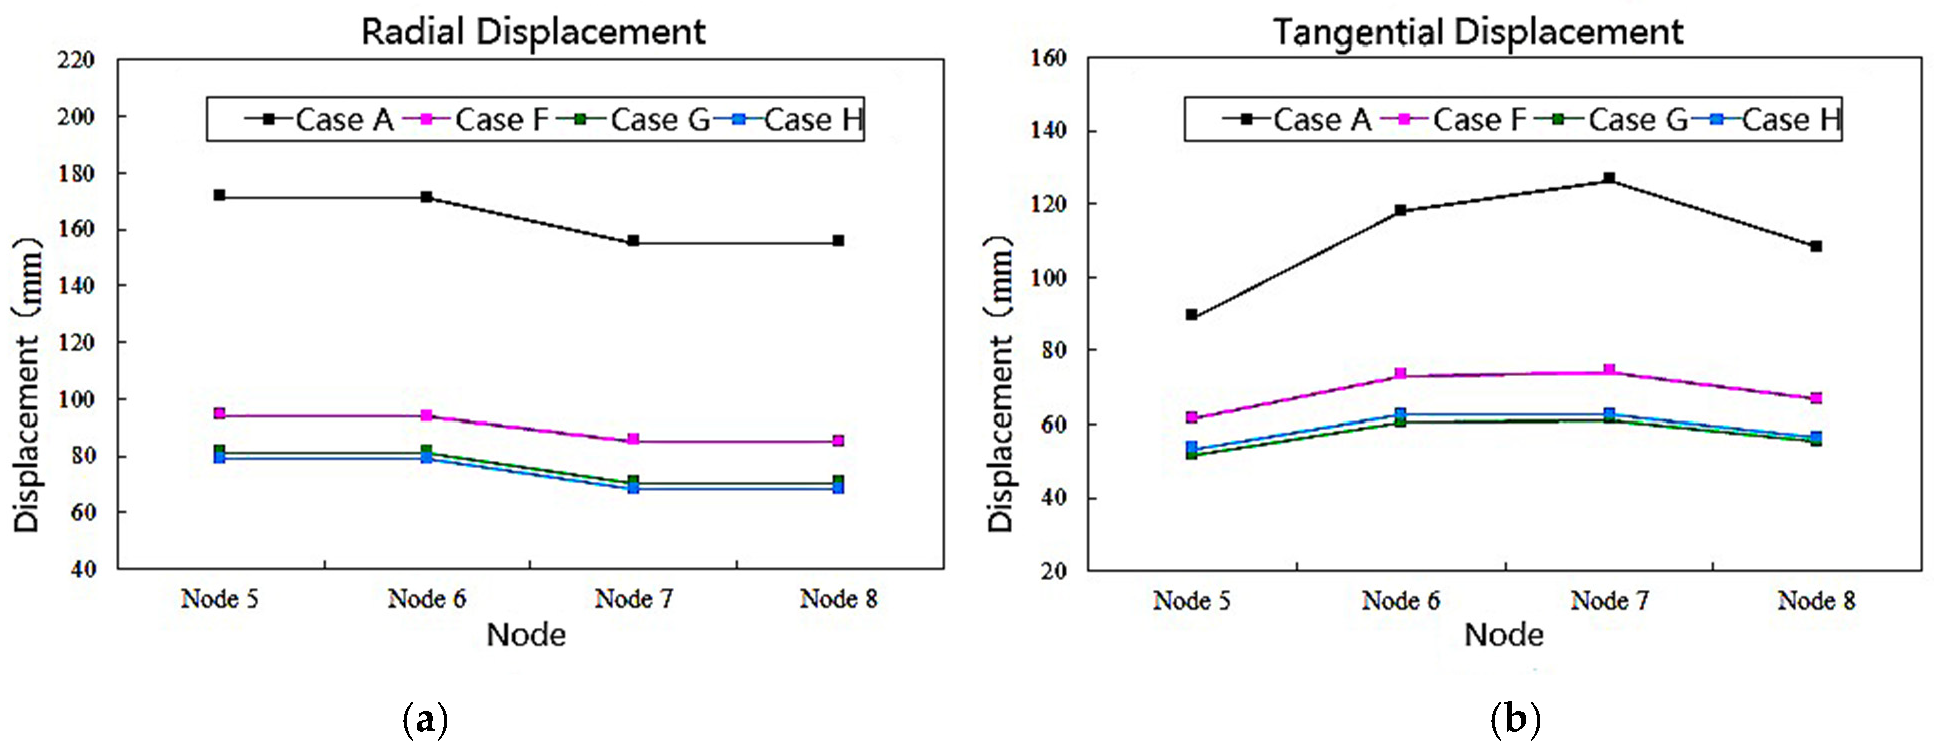
4.5.2. Displacement at the Middle Expansion Joint

We extracted the peak radial and tangential displacement of the four inner and outer nodes of the middle expansion joint under several combined cases, as shown in Figure 20.
Figure 20 shows that the peak seismic mitigation ratio of the radial tangential displacement of each node at the edge of the expansion joint in each combined case also reached more than 40%, and that the damping effect of cases G and H was the greatest. From Figure 20b, it can be seen that the peak tangential displacement of nodes 5,6, 7, and 8 of case A are quite different, mainly due to the torsion of the girder. However, the corresponding peak displacements of the joints in the three combined damping cases F, G and H are all effectively reduced and the difference is not significant. This shows, once again, that through the combined damping optimization design, the torsion of the girder is effectively reduced.

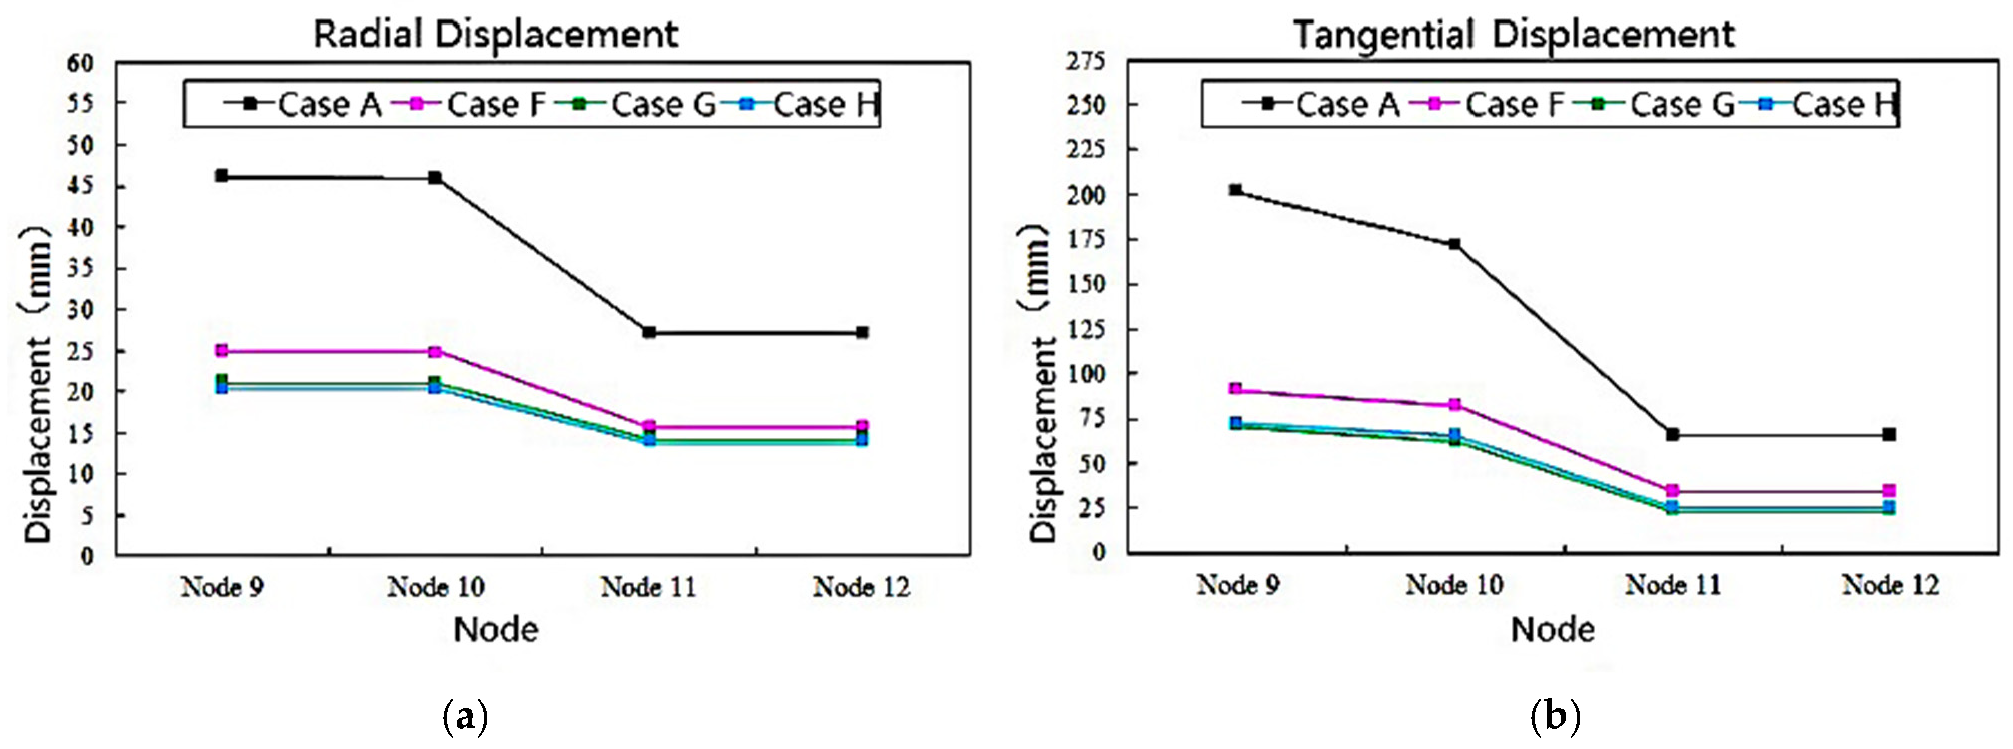
4.5.3. Displacement at Long Unit Expansion Joint

We extracted the peak radial and tangential displacement of the four nodes on the inner and outer edges of the long unit expansion joint, as shown in Figure 21.
Figure 21 shows that the long unit expansion joints are similar to the short unit expansion joints. The peak radial and tangential displacements of the joints are effectively reduced, as well as the torsion effect of the girder. The seismic mitigation ratio to the peak tangential displacement is greater than that ofthe peak radial displacement.

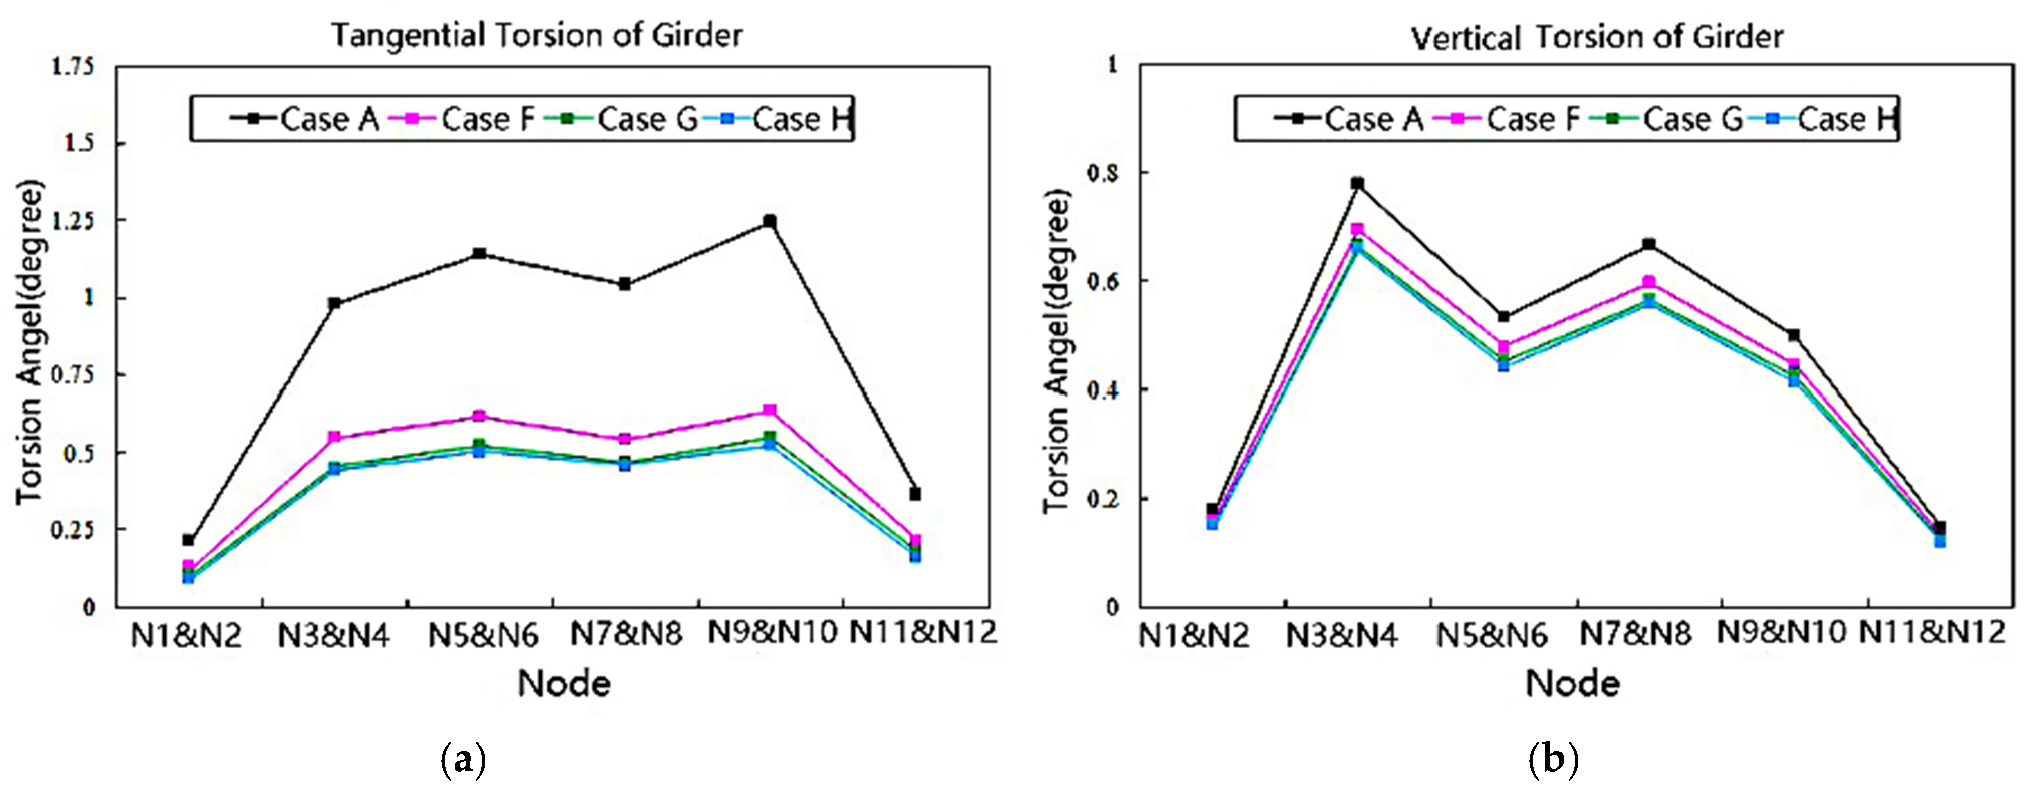
4.5.4. Torsion of Girder

The girder or abutment features torsion in both the tangential and vertical directions. In this paper, the torsion angle is used to indicate thedegree of torsion. The calculation formula is as follows:
φ = | u i u j | m a x l i j × 180 π
where ui and uj is the tangential displacement or vertical displacement of the inner and outer nodes of the girder or abutment,
lij is the distance between the inner and outer nodes of the main girder (bridge abutment), where the bridge deck width is 7.2 m.
Calculate the tangential and radial torsion angle of the girder or abutment in the combined case according to the above formula. The specific values are shown in Figure 22.
It was found that there is a torsion phenomenon in curved bridgesduring earthquakes. After installing seismic mitigation and unseating prevention devices, the tangential torsion of the curved bridge is effectively reduced, but the reduction in the vertical torsion is not large because, for vertical torsion, a certain reduction effect can only be obtained through the overall energy dissipation.
When seismic shock is input along the direction of piers ② and ③, it mainly causes the tangential torsion of the beam. When the seismic mitigation and unseating prevention device is installed, the tangential torsion is effectively reduced. To clarify this point, take the outward twist (the short unit is twisted counterclockwise around the Z axis, and the long unit is twisted clockwise around the Z axis) as an example. When the beam is twisted, for SCRB, the outer cable is in a relaxed state, and the inner cable is in a tensioned state, which can provide a large pulling force to the inside of the beam, thereby restricting the torsion of the beam.For case F (the combination of VED and SCRB), not only can the inner SCRB can provide the restraining force to pull the beam together, but the outer VED can also provide the opposite restraining force to push the beam apart.At the same time, it also dissipates part of the seismic energy; therefore, it can effectively reduce the torsion.For case G (the combination of VFD and SCRB), theprinciple is similar to VED.For CASE H (the combination of LRB and SCRB), in addition to SCRB, which can provide constraining force, the horizontal rigidity and damping of the lead rubber bearing can also provide a certain constraining force on the inside and outside, reducing the torsion of the beam. Among several damping devices, LRB and VFD exertstrongereffects on the dissipation ifseismic energy; hence, theyoffer more effective seismic mitigation and unseating prevention.

5. Conclusions

In this paper, usinga curved bridge with double-column piers as an engineering example, weestablished a three-dimensional finite element solid unit model of acurved bridge. The collision response analysis of the curved bridge was performedthrough a nonlinear dynamic time history analysis. According to the response characteristics of the curved bridge, the damping device and unseating restrainer were used for the combination optimization to analyze the seismic mitigation and unseating prevention of the curved bridge. The analysis led to the following conclusions:
(1)
During earthquakes, the bending–torsion coupling phenomenon inthe girders of curved continuous girder bridges is serious, and the displacement magnitude and direction of the inside and outside of the contact surface of the expansion joints of each bridge span are inconsistent, which can easily cause uneven local collisions at the contact surfaces. The high contact stress causes local compressive and tensile damage to reinforced concrete. At the same time, the increase in the relative radial and tangential displacement caused by the torsion of the girder could lead to the unseating of the girder.
(2)
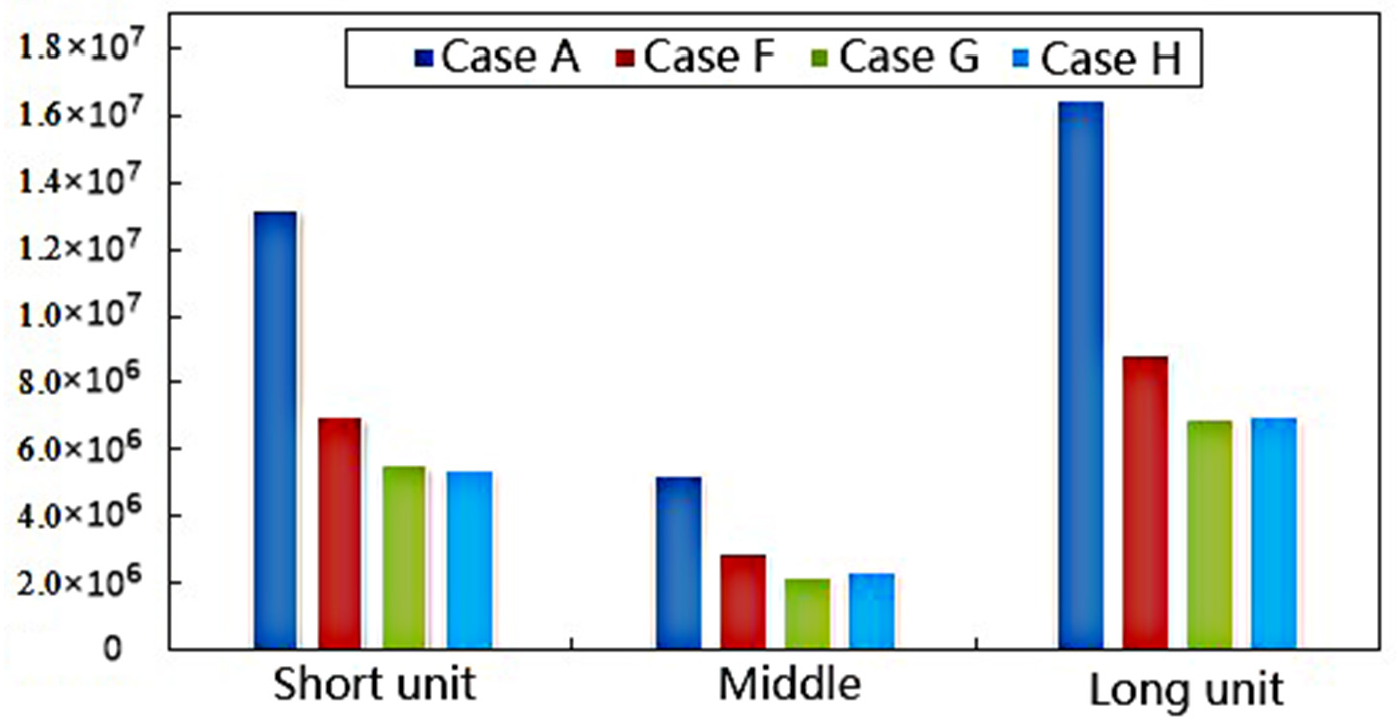
Based on the principle of energy dissipation combined with constraints, considering the combination of seismic mitigation and unseating prevention devices, three seismic mitigation cases were obtained, including the combination of VED and SCRB, the combination of VFD and SCRB, and the combination of LRB and SCRB. The results indicated that the three kinds of combined seismic mitigation cases were effective atreducing the response to collision force, stress, damage, girder torsion, and displacement, and achieved the goals of seismic mitigation and unseating prevention.
(3)
The three kinds of combined device can effectively reduce the contact force, stress, and damage between adjacent structures, as well as the torsion and displacement of the beam. Among these, the pounding and unseating prevention effects of case G (the combination of VFD and SCRB) and case H (the combination of LRB and SCRB) are superior to those of case E (viscoelastic damper and steel strand cable-rubber pad combination). The performance of viscoelastic energy dampers is obviously affected by temperature, vibration frequency, and strain, while viscous dampers offer a strong energy dissipation capacity and dissipate energy under small deformations, which are also widely used in practical engineering. Therefore, it is recommended that the design of seismic mitigation and unseating prevention for curved bridges consider the combination of VFD or LRB and SCRB.

Author Contributions

Data curation and methodology, Z.L.; Formal analysis, C.Y.; Writing—review & editing, S.K. All authors have read and agreed to the published version of the manuscript.

Funding

This research was funded by the Chongqing Natural Science Foundation of China (cstc2018jcyjAX0001).

Institutional Review Board Statement

Not applicable.

Informed Consent Statement

Not applicable.

Data Availability Statement

Some data, or models used during the study are available from the corresponding author by request.

Conflicts of Interest

The authors declare no conflict of interest.

References

  1. Kaleybar, R.S.; Tehrani, P. Investigating seismic behavior of horizontally curved RC bridges withdifferent types of irregularity in comparison with equivalentstraight bridges. Structures 2021, 33, 2570–2586. [Google Scholar] [CrossRef]
  2. Wieser, J. Experimental and Analytical Investigation of Seismic Bridge-Abutment Interaction in a Curved Highway Bridge. Ph.D. Thesis, Department of Civil and Environmental Engineering, University of Nevada, Reno, NV, USA, 2014. [Google Scholar]
  3. Wilson, T.; Mahmoud, H.; Chen, S. Seismic performance of skewed and curvedreinforced concrete bridges in mountainous states. Eng. Struct. 2014, 70, 158–167. [Google Scholar] [CrossRef]
  4. Li, Z.Y.; Liu, B.; Yang, Y.W. Seismic pounding analysis of curved continuous girder bridge under strong earthquake. J. Build. Struct. 2016, 37, 349–355. [Google Scholar]
  5. Jeon, J.S.; DesRoches, R.; Kim, T.; Choi, E. Geometric parameters affecting seismicfragilities of curved multi-frame concrete box-girder bridges with integralabutments. Eng. Struct. 2016, 122, 121–143. [Google Scholar] [CrossRef]
  6. Jiao, C.; Liu, W.; Wu, S.; Gui, X.; Huang, J.; Long, P.; Li, W. Shake table experimental study of curved bridges with consideration ofgirder-to-girder collision. Eng. Struct. 2021, 237, 112216. [Google Scholar] [CrossRef]
  7. Wang, Z.; Lee, G.C. A comparative study of bridge damage due to the Wenchuan, Northridge, Loma Prieta and San Fernando earthquakes. Earthq. Eng. Eng. Vib. 2009, 8, 251–261. [Google Scholar] [CrossRef]
  8. Comartin, C.D.; Greene, M.; Tubbesing, S.K. (Eds.) The Hyogo-ken NanbuEarthquake January 17, 1995, EERI. Preliminary Reconnaissance Report; EERI-95-04; EERI: Oakland, CA, USA, 1995. [Google Scholar]
  9. Jain, S.K.; Lettis, W.R.; Murty, C.V.R.; Barder, J.P. Bhuj, India, Earthquake of January 26, 2001 Reconnaissance Report, Publication No. 02-01; EERI: Oakland, CA, USA, 2002. [Google Scholar]
  10. Du, X.; Han, Q.; Li, Z.X.; Li, L.Y.; Chen, S.F.; Zhang, J.F. The seismic damage of bridges in the 2008 Wenchuan earthquake and lessons from its damage. J. Beijing Univ. Technol. 2008, 34, 1270–1279. [Google Scholar]
  11. Kawashima, K.; Unjoh, S.; Hoshikuma, J.; Kosa, K. Damages of bridges due to the2010 Maule, Chile, Earthquake. J. Earthq. Eng. 2011, 15, 1036–1068. [Google Scholar] [CrossRef]
  12. Chouw, N.; Hao, H. Pounding damage to buildings and bridges in the 22 February2011 Christchurch earthquake. Int. J. Protect.Struct. 2012, 3, 123–140. [Google Scholar] [CrossRef]
  13. Ijima, K.; Obiya, H.; Aramaki, G.; Kawasaki, N. A study on preventing the fall of skewand curved bridge decks by using rubber bearings. Struct. Eng. Mech. 2001, 12, 347–362. [Google Scholar] [CrossRef]
  14. Wei, C. Seismic Analysis and Response of Highway Bridges with Hybrid Isolation. Ph.D. Thesis, Department of Civil and Environmental Engineering, University of Nevada, Reno, NV, USA, 2013. [Google Scholar]
  15. Mendez Galindo, C.; Gil Belda, J.; Hayashikawa, T. Non-linear seismic dynamicresponse of curved steel bridges equipped with LRB supports. Steel Constr. 2010, 3, 34–41. [Google Scholar] [CrossRef]
  16. Mohamed, W.A.; Hayashikawa, T.; Aly, A.G.; Hussien, M.H. Study on seismicresponse of curved viaduct systems with different isolation conditions undergreat earthquake ground motion. JSCE J. Struct. Eng. 2003, 49, 563–572. [Google Scholar]
  17. Julian, F.D.R.; Hayashikawa, T.; Obata, T. Seismic performance of isolated curved steel viaducts equipped with deck unseating prevention cable restrainers. J. Constr. Steel Res. 2007, 63, 237–253. [Google Scholar] [CrossRef]
  18. Andrawes, B.; DesRoches, R. Unseating prevention for multiple frames bridges using super elastic devices. Smart Mater. Struct. 2005, 14, 60–67. [Google Scholar] [CrossRef]
  19. Raheem, S.E.A. Pounding mitigation and unseating prevention at expansion joints ofisolated multi-span bridges. Eng. Struct. 2009, 31, 2345–2356. [Google Scholar] [CrossRef]
  20. Tian, Q.; Hayashikawa, T.; Ren, W.-X. Effectiveness of shock absorber device for damage mitigation of curvedviaduct with steel bearing supports. Eng. Struct. 2016, 109, 61–74. [Google Scholar] [CrossRef]
  21. Jiao, C.; Liu, Y.; Wu, S.; Ma, Y.; Huang, J.; Liu, W. Influence of pounding buffer zone for mitigation of seismic response ofcurved bridges. Structures 2021, 32, 137–148. [Google Scholar] [CrossRef]
  22. Shresth, B.; Hao, H.; Bi, K. Effectiveness of using rubber bumper and restrainer on mitigatingpounding and unseating damage of bridge structures subjectedto spatially varying ground motions. Eng. Struct. 2014, 79, 195–210. [Google Scholar] [CrossRef]
  23. Chen, L.; Sun, L.; Xu, Y.; Di, F.; Xu, Y.; Wang, L. A comparative study of multi-mode cable vibration control using viscousand viscoelastic dampers through field tests on the Sutong Bridge. Eng. Struct. 2020, 224, 111226. [Google Scholar] [CrossRef]
  24. Ruangrassamee, A.; Kawashima, K. Control of nonlinear bridge response withpounding effect by variable dampers. Eng. Struct. 2003, 25, 593–606. [Google Scholar] [CrossRef]
  25. Hwang, J.-S.; Tseng, Y.-S. Design formulations for supplemental viscous dampersto highway bridges. Earthq. Eng. Struct. Dyn. 2005, 34, 1627–1642. [Google Scholar] [CrossRef]
  26. Fujino, Y.; Kimura, K.; Tanaka, H. Wind Resistant Design of Bridges in Japan: Developments and Practices; Springer: Tokyo, Japan, 2012. [Google Scholar]
  27. Symans, M.D.; Constantinou, M.C. Passive fluid viscous damping systems for seismicenergy dissipation. ISET J. Eartheq. Tech. 1998, 35, 185–206. [Google Scholar]
  28. Wang, Y.Y. Abaqus Analysis User’s Guide: Prescribed Conditions, Constraints & Interactions Volume; China Machine Press: Beijing, China, 2019. [Google Scholar]
  29. Li, H.N.; Wang, D.D. Multi-scale finite element modeling and numerical analysis of reinforced concrete structure. J. Archit. Civ. Eng. 2014, 31, 20–25. [Google Scholar]
  30. Zhu, B.F. The Finite Element Method Theory and Applications; China Water & Power Press: Beijing, China, 2018. [Google Scholar]
  31. Schweizerhof, K.; Nilsson, L.; Hallquist, J.O. Crachworthiness analysis in the automotive industry. Int. J. Comput. Appl. Technol. 1992, 5, 134–156. [Google Scholar]
  32. Jankowski, R. Non-linear FEM analysis of pounding-involved response of buildings under non-uniform earthquake excitation. Eng. Struct. 2012, 37, 99–105. [Google Scholar] [CrossRef]
  33. Li, L.F.; Wu, W.P.; Huang, J.M.; Wang, L.H. Research on the seismic vulnerability analysis of laminated rubber bearing. J. Hunan Univ. 2011, 38, 1–6. [Google Scholar]
  34. Ministry of Transport of the People’s Republic of China. Lead Rubber Bearing Isolator for Highway Bridge; JT/T 822-2011; China Communications Press: Beijing, China, 2011.
  35. Ge, S.P.; Li, A.Q. Redevelopment of velocity-depended damper elements based on ABAQUS. Earthq. Resist. Eng. Retrofit. 2014, 36, 198–217. [Google Scholar]
  36. Zhou, Y. Design of Structure with Viscous Damping; Wuhan University of Technology Press: Wuhan, China, 2006. [Google Scholar]
  37. Ma, J.X. Advanced Structural Dynamics; Xi’an Jiaotong University Press: Xi’an, China, 2019. [Google Scholar]
Figure 1. Plan of the curved bridge (unit: m).
Symmetry 14 00129 g001
Figure 2. Cross-sectional dimensions of curved bridge (unit: mm). (a) Transverse profile. (b) Longitudinal elevation.
Symmetry 14 00129 g002
Figure 3. Constitutive model of reinforcement bar.
Symmetry 14 00129 g003
Figure 4. Finite element model of curved bridge. (a) Overall structure model. (b) Double-column pier. (c) Abutment and bearing.
Symmetry 14 00129 g004
Figure 5. The name and node number of expansion joints. (a) Short unit expansion joints. (b) Middle expansion joints. (c) Long unit expansion joints.
Symmetry 14 00129 g005
Figure 6. Steel wire rope-rubber mat device.
Symmetry 14 00129 g006
Figure 7. The location of rubber pads.
Symmetry 14 00129 g007
Figure 8. MEX00003 ground motion. (a) Fourier spectrum of ground motion. (b) Acceleration of the ground motion.
Symmetry 14 00129 g008
Figure 9. The maximumnormal contact force of expansion joints adjacent structures of every case (unit:N).
Symmetry 14 00129 g009
Figure 10. The normal contact force time-histories of expansion joints adjacent structures of case A (time:s). (a) Short unit expansion joints (b) Middle expansion joints (c) Long unit expansion joints.
Symmetry 14 00129 g010aSymmetry 14 00129 g010b
Figure 11. The normal contact force timehistories of expansion joints adjacent structures of case G (time:s). (a) Short unit expansion joints. (b) Middle expansion joints. (c) Long unit expansion joints.
Symmetry 14 00129 g011aSymmetry 14 00129 g011b
Figure 12. The maximum normal contact stress of adjacent surface at expansion joints in every case (unit:N/m2).
Symmetry 14 00129 g012
Figure 13. The normal contact stress of adjacent surface at expansion joints in case A(unit: N/m2). (a) The contact surface of the short unit expansion joint at the abutment position (t = 23.95 s). (b) The contact surface of the short unit expansion joint in the middle position (t = 20.16 s). (c) The contact surface of the long unit expansion joint at the abutment position in the middle position (t = 20.16 s). (d) The contact surface of the long unit expansion joint at the abutment position (t = 10.26 s).
Symmetry 14 00129 g013
Figure 14. The normal contact stress of adjacent surface at expansion joints in case G(unit: N/m2). (a) The contact surface of the short unit expansion joint at the abutment position (t = 23.83 s). (b) The contact surface of the short unit expansion joint in the middle position (t = 20.01 s). (c) The contact surface of the long unit expansion joint at the abutment position in the middle position (t = 20.01 s). (d) The contact surface of the long unit expansion joint at the abutment position (t = 10.11 s).
Symmetry 14 00129 g014
Figure 15. The cumulative damage of expansion joints adjacent surface of every case.
Symmetry 14 00129 g015
Figure 16. Damage of girder in expansion joints of case A. (a) Compression damage at abutment position of short unit expansion joint. (b) Compression damage in the middle of the short unit expansion joint. (c) Compression damage in the middle of long unit expansion joint. (d) Compression damage at abutment position of the long unit expansion joint.
Symmetry 14 00129 g016
Figure 17. Damage of girder in expansion joints of case G. (a) Compression damage at abutment position of short unit expansion joint. (b) Compression damage in the middle of the short unit expansion joint. (c) Compression damage in the middle of long unit expansion joint. (d) Compression damage at abutment position of the long unit expansion joint.
Symmetry 14 00129 g017
Figure 18. The contact number of node at the edge of expansion joints of every case.
Symmetry 14 00129 g018
Figure 19. Nodal peak displacement of short expansion joints in every case. (a) Radial diaplacement (b) Tangential displacement.
Symmetry 14 00129 g019
Figure 20. Nodal peak displacement of middle expansion joints of every case. (a) Radial diaplacement (b) Tangential displacement.
Symmetry 14 00129 g020
Figure 21. Nodal peak displacement of long expansion joints in every case. (a) Radial diaplacement (b) Tangential displacement.
Symmetry 14 00129 g021
Figure 22. Torsion of the girders. (a) Tangential torsion (b) Vertical torsion.
Symmetry 14 00129 g022
Table 1. Calculation parameters of concrete damage plasticity model.
Compressive Strength (N/mm2)Inelastic StrainCompressive Damage FactorTensile Strength (N/mm2)Cracking StrainTensile Damage Factor
15.59340.0000000.00003.00420.0000000.0000
17.64590.0000170.01511.24760.0001960.5901
19.54360.0000400.03050.74190.000330.7419
23.11600.0001040.06430.54060.0004540.8092
24.31170.0001360.07780.43260.0005750.8473
25.59440.0001770.09410.36460.0006950.8721
27.70230.0002750.12740.31760.0008140.8895
29.20350.0003930.16200.28290.0009330.9024
29.53600.0004310.17260.25610.0010510.9125
30.10150.0005290.19780.23470.001170.9205
30.40000.0006840.23520.20260.0014060.9326
30.02180.0008610.27540.17940.0016430.9413
29.05790.0010570.31750.13650.002350.9571
27.73900.0012630.35930.04780.0100060.9877
26.24400.0014750.39950.03740.0141260.9908
24.69660.0016890.43720.03360.0164810.9920
23.17480.0019020.47210.01800.0400280.9962
21.72380.0021130.50420.01780.0406160.9963
Table 2. The arrangement of various cases.
CaseSupport TypeVEDVFDSCRB
GJZLRB
A
F
G
H
Note: ● means setting, ○ means not setting.
Table 3. The parameters of the devices.
DeviceParameter Value
GJZ Support   length   and   width :   l 1 × l 2 × t = 600 × 480 × 100 mm
Elastic   modulus :   E = 38.4 Mpa
Shear   modulus :   G = 1 Mpa
VED Equivalent   stiffness :   K = 4000 KN/m
Equivalent   damping   coefficient :   C = 600 KN/m/s
VFD Damping   coefficient :   C = 600 KN/(m/s)0.3
Speed   index :   α = 0.3
SCRB Pre yield   stiffness :   K 1 = 254238 KN/m
Post yield   stiffness :   K 2 = 12711.9 KN/m
Yield force: Fy = 2605.7 KN
Rubber   pad   length   and   width :   l 1 × l 2 × t = 360 × 180(360) × 30 mm
Elastic   modulus :   E = 7.84 Mpa
LRB Piers     and   :   Pre yield   stiffness :   K u = 21.97 KN/mm
Post yield   stiffness :   K d = 3.38 KN/mm
Vertical   stiffness :   K l = 7350 KN/mm
Yield force: Fy = 209 KN
Pier   :   Pre yield   stiffness :   K u = 17.75 KN/mm
Post yield   stiffness :   K d = 2.73 KN/mm
Vertical   stiffness :   K l = 6000 KN/mm
Publisher’s Note: MDPI stays neutral with regard to jurisdictional claims in published maps and institutional affiliations.

