1. Introduction
The purpose of surgery is to completely remove malignant tumors with high dislocation rate and strong invasiveness [
1]. Numerous blood vessels are distributed inside the tumor. Because the color of the tumor and blood vessels are similar, it is often difficult to visually observe the tumor removal status. Therefore, a yellow-dye (530–560 nm) fluorescence contrast medium is injected into the body to distinguish blood vessels from tumors, and the surgical area is exposed to an external light source (405 nm) to induce fluorescence emission from the tumor [
2].
The wavelength and color images that fluoresce in the tumor can be observed on an external monitor through the camera of a surgical microscope [
3]. However, since the surgical microscope captures the fluorescence color image of the tumor and the color image of the external light source together through the camera, the external monitor observes the color image of the external light source and the fluorescence color image of the tumor mixed. Therefore, it is impossible to accurately observe the tumor on the monitor. To overcome this problem, a long-pass filter is applied to the surgical microscope. Therefore, the long-pass filter passes the fluorescence wavelength for the tumor and blocks the wavelength for the external light source, so that only the fluorescence-expressing tumor is shown when observed on an external monitor. An off-the-shelf product must be used to mount the filter on a surgical microscope. As for the filter, it is important to have a sharp wavelength blocking, symmetry pass rate and cut rate. However, it is not easy to produce a ready-made filter suitable for a surgical microscope. The long-pass filter (FELH 0500) provided by Thorlabs (city, state abbrev if USA, country) has a transmission efficiency and blocking rate of 80% and 0.01% at 500 nm, respectively. At this time, since the blocking efficiency of the long-pass filter is 0.01% but the transmission efficiency is 80%, the image quality for diagnosing a tumor in the fluorescent state is reduced by 20%, thereby preventing accurate diagnosis. Therefore, the filter has 100% asymmetry in pass and cut efficiency. For this reason, studies are being conducted to design a filter suitable for a surgical microscope. Among them, the optical filter using CMOS has an efficiency of 50% [
4]. Filters using S
iO
2 and T
iO
2 have an efficiency of 80% at 510–550 nm [
5]. A filter using silicon photomultipliers has a transmission efficiency of 95% [
6]. The transmission efficiency of the optical filter using silicon is 90% [
7]. As a result of analyzing the efficiency, the transmission efficiency of the filter for application to a surgical microscope must have a symmetry between 98–100%. The reason is that when the transmission (T) efficiency is 98% or more, the reflection (OD) efficiency approaches 0%. Therefore, when the pass efficiency of the filter is 100% in theory, the reflection efficiency is 0%, so it has symmetry.
In addition, if the transmittance and reflectance are asymmetric, the surgical diagnosis image is blurred in the surgical microscope, and if the reflectance is low the wavelength irradiated from the light source and the fluorescence wavelength are mixed and the image is broken. Therefore, applying a long-pass filter having high transmission efficiency and low reflection efficiency can provide symmetrical image efficiency. For this, the transmission efficiency and reflection efficiency of the long-pass filter must be 98% or more and within 0.2%. In this paper, we propose a symmetric long-pass filter design with high transmittance that can pass only fluorescence wavelengths.
2. Materials and Design Methods
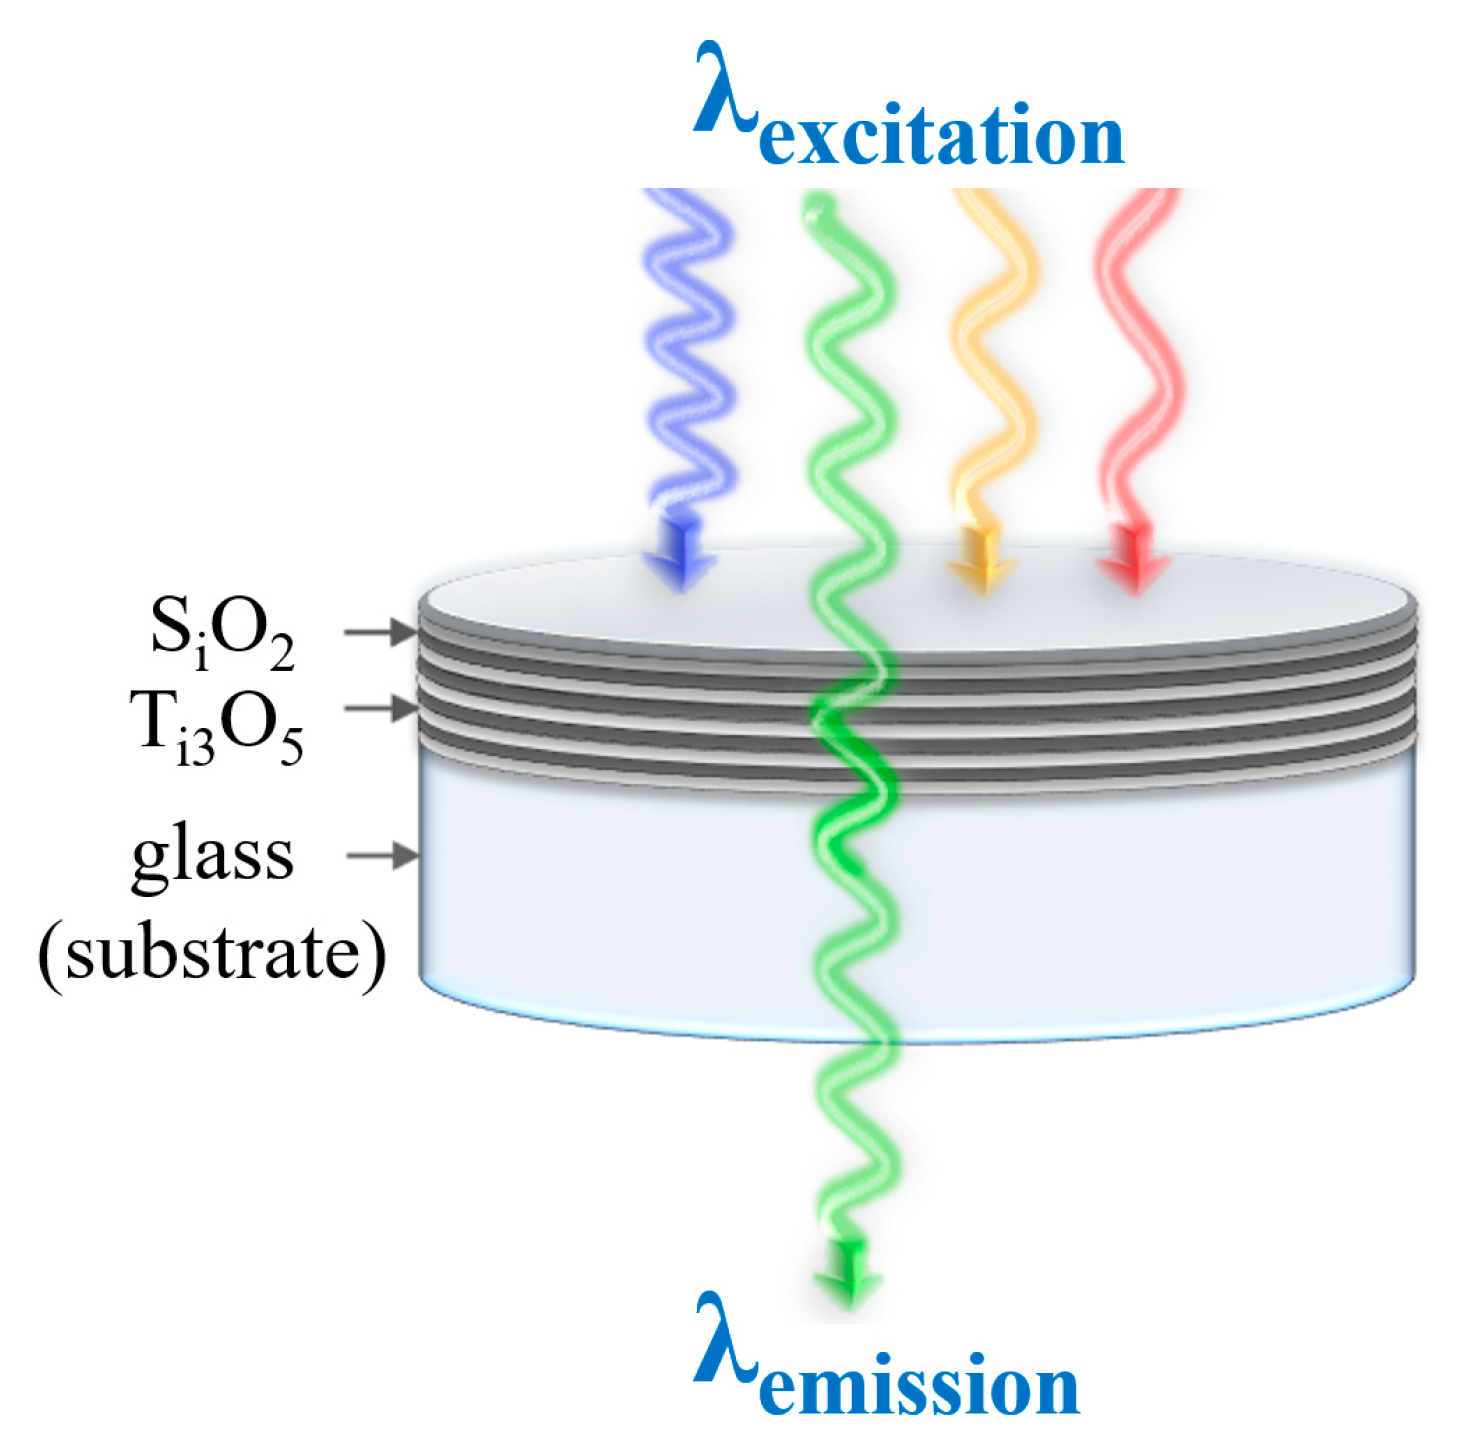
As shown in
Figure 1, an optical filter, which is a micro-disk type, is an asymmetrical multilayered structure, each with different materials. Such materials include S
iO
2 and T
i3O
5, which are deposited on top of a glass substrate.
An optical filter can block an undesired region of wavelength. However, when light passes through the filter, the light intensity is distributed asymmetrically due to energy (power) loss [
8]. This power loss (PL) is caused by the parasitic resistance of each material comprising the filter and can be calculated by using Equation (1). Equation (2) shows that parasitic resistance (
R) is directly proportional to the specific resistance (ρ) of the material. The parasitic values for glass, S
iO
2, and T
i3O
5 are 10 × 10
11 (to 10
15) Ω·m, 2.3 × 10
3 Ω·m, and 4.7 × 10
−3 Ω·m [
9,
10,
11,
12]:
where
lm represents the amount of energy lost due to the parasitic resistance:
where
ρ,
l, and
A are specific resistance, length, and dimension of the material, respectively.
The essential parameters of a filter are wavelength, transmittance (T), and optical density (OD), and the latter two can be measured by using Equations (3) and (4). Theoretically speaking, a filter should have T of 100% and OD and PL of 0:
where
Io and
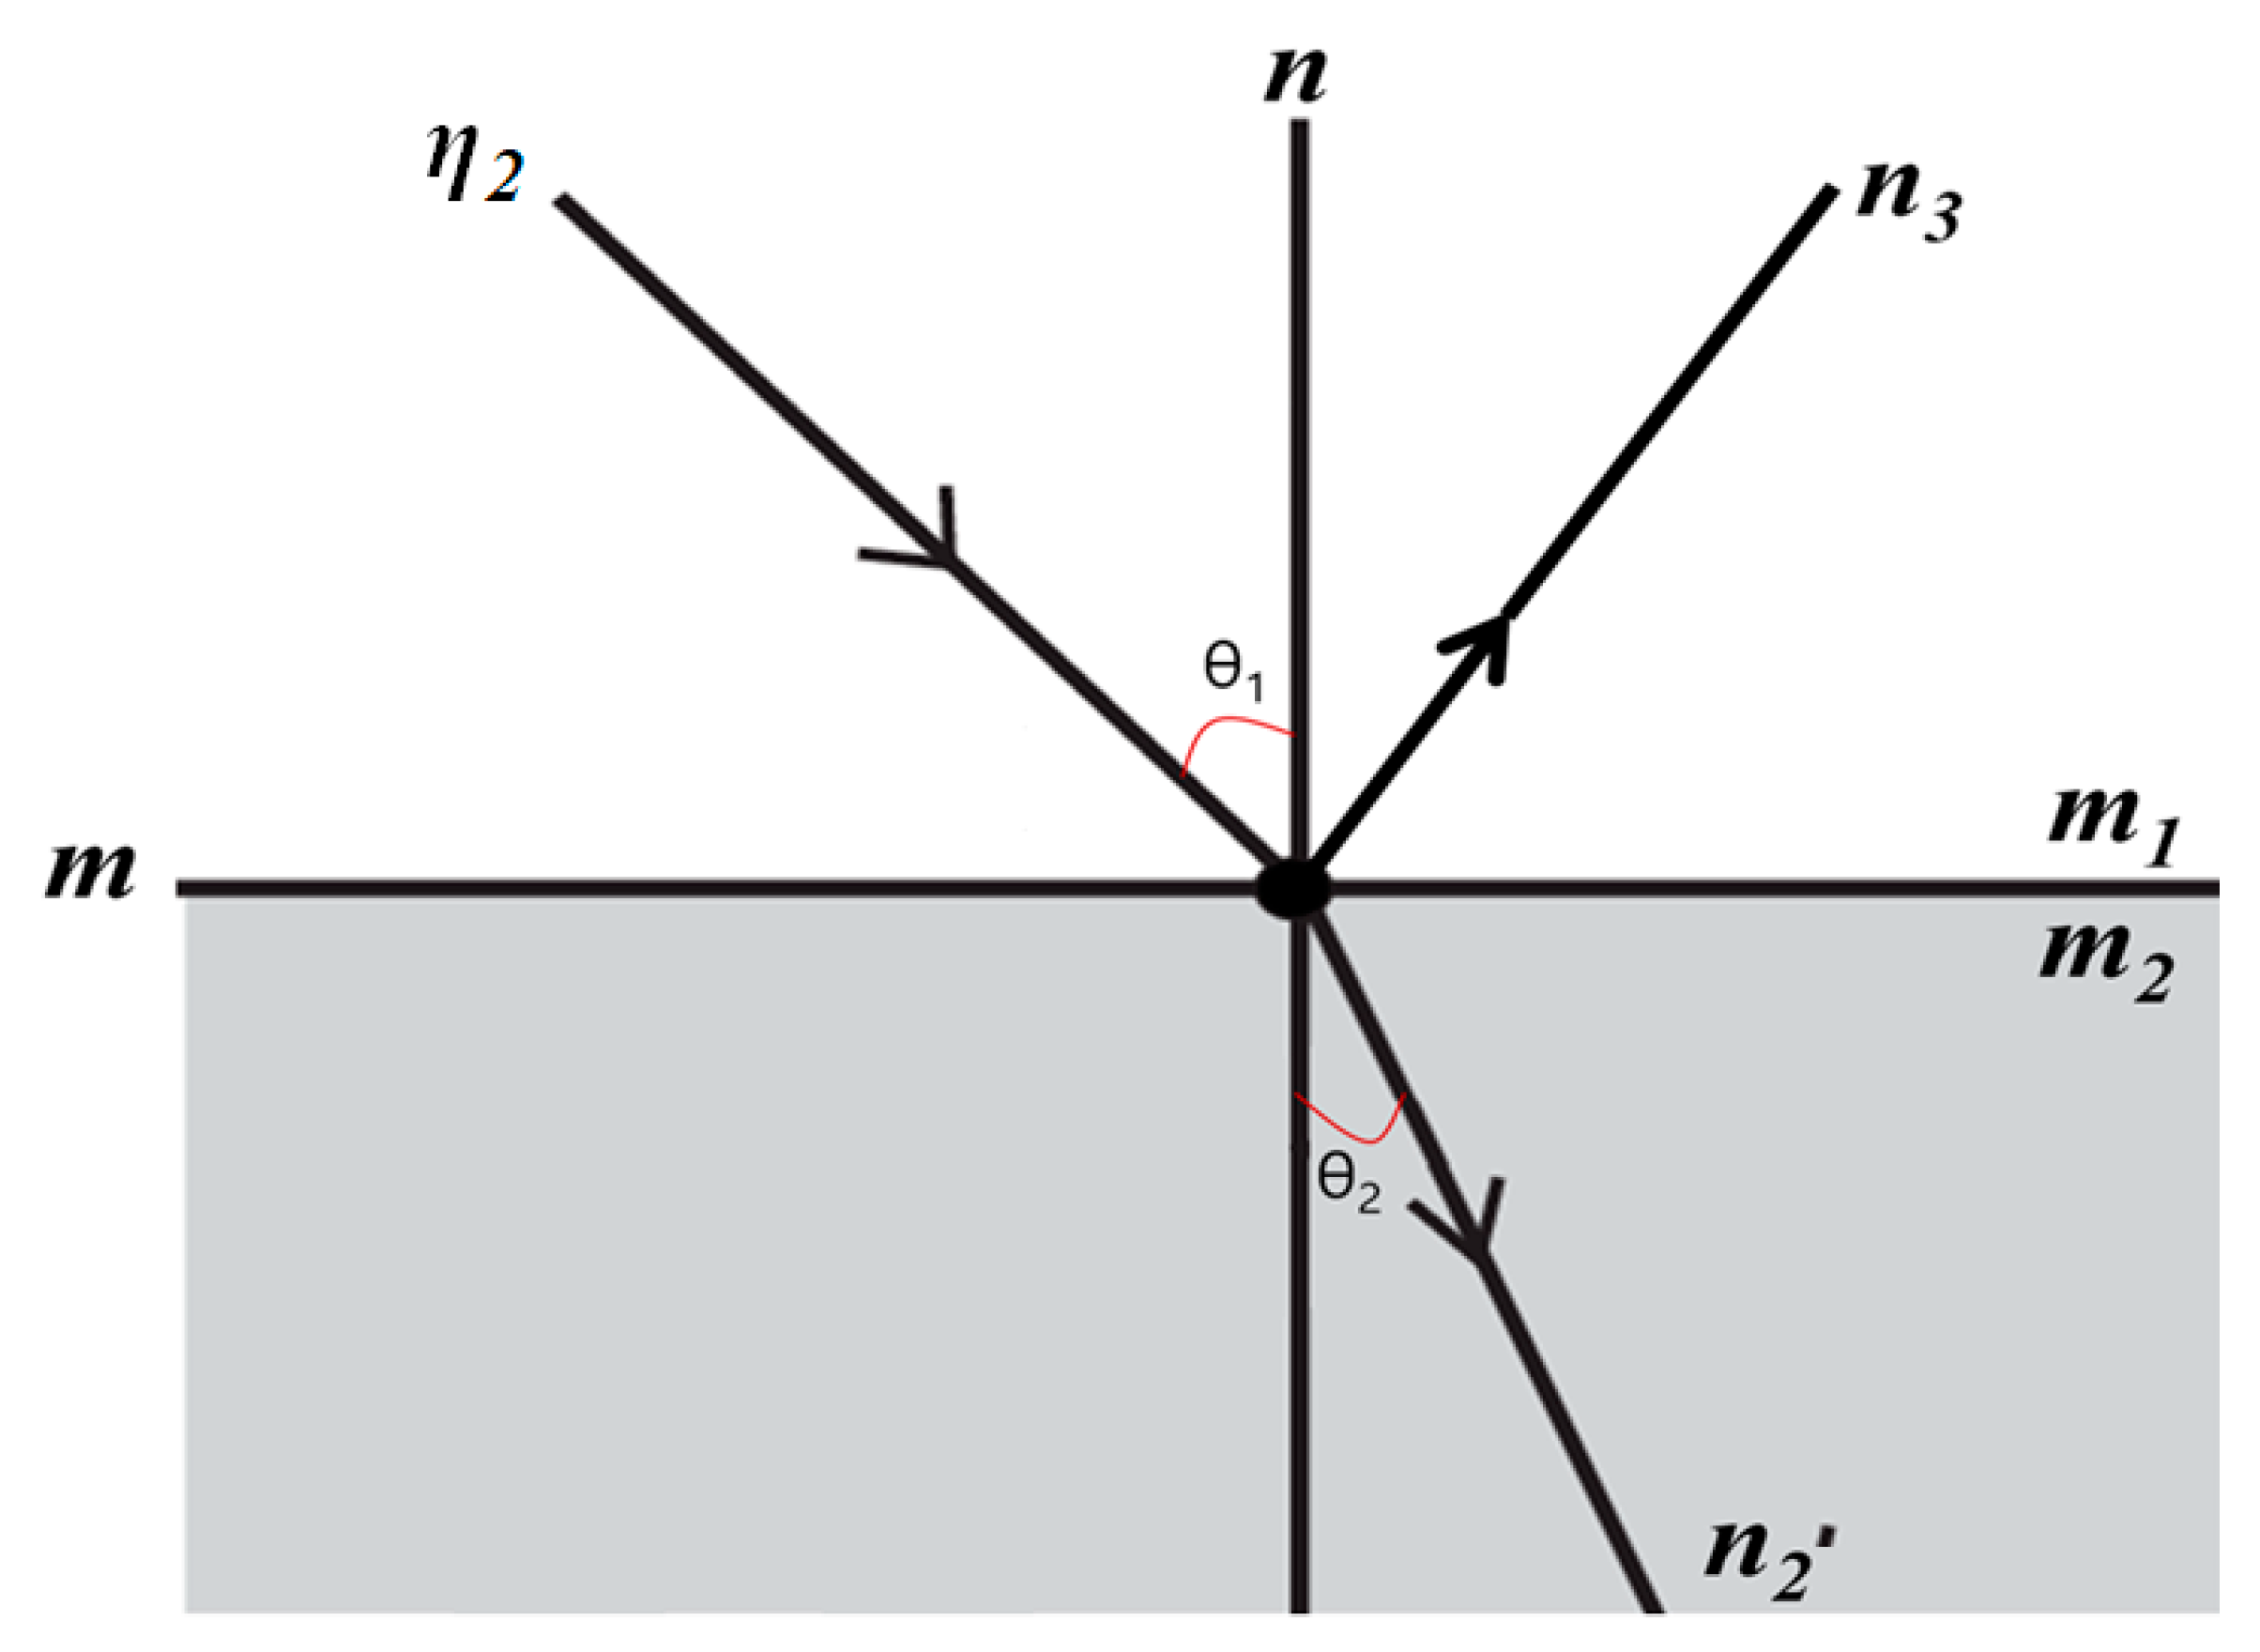
Ip are the intensity of incident light and transmitted light, respectively. However, as shown in
Figure 2, when light passes through a layer, it loses additional energy (
lT).
Equation (5) shows the way to calculate the extent of energy loss. It is caused by asymmetrical changes in refractive index (
η), light reflection (
Γ), and light absorption (α) of any part. They can be calculated by using Equations (6)–(8). Epically, the Equation (6) represents the Snell’s law, which can be used to calculate changes in
η.
where
k is the extinction coefficient, which is 1 × 10
−5, and
λ is a wavelength of light.
Consequently, the efficiency of a filter (
nef) decreases as a result of asymmetrical multiple PL and can be calculated by using Equation (9). Equation (10) shows a way to calculate the overall PL:
where
Pin and
Pout are input power and output power, respectively.
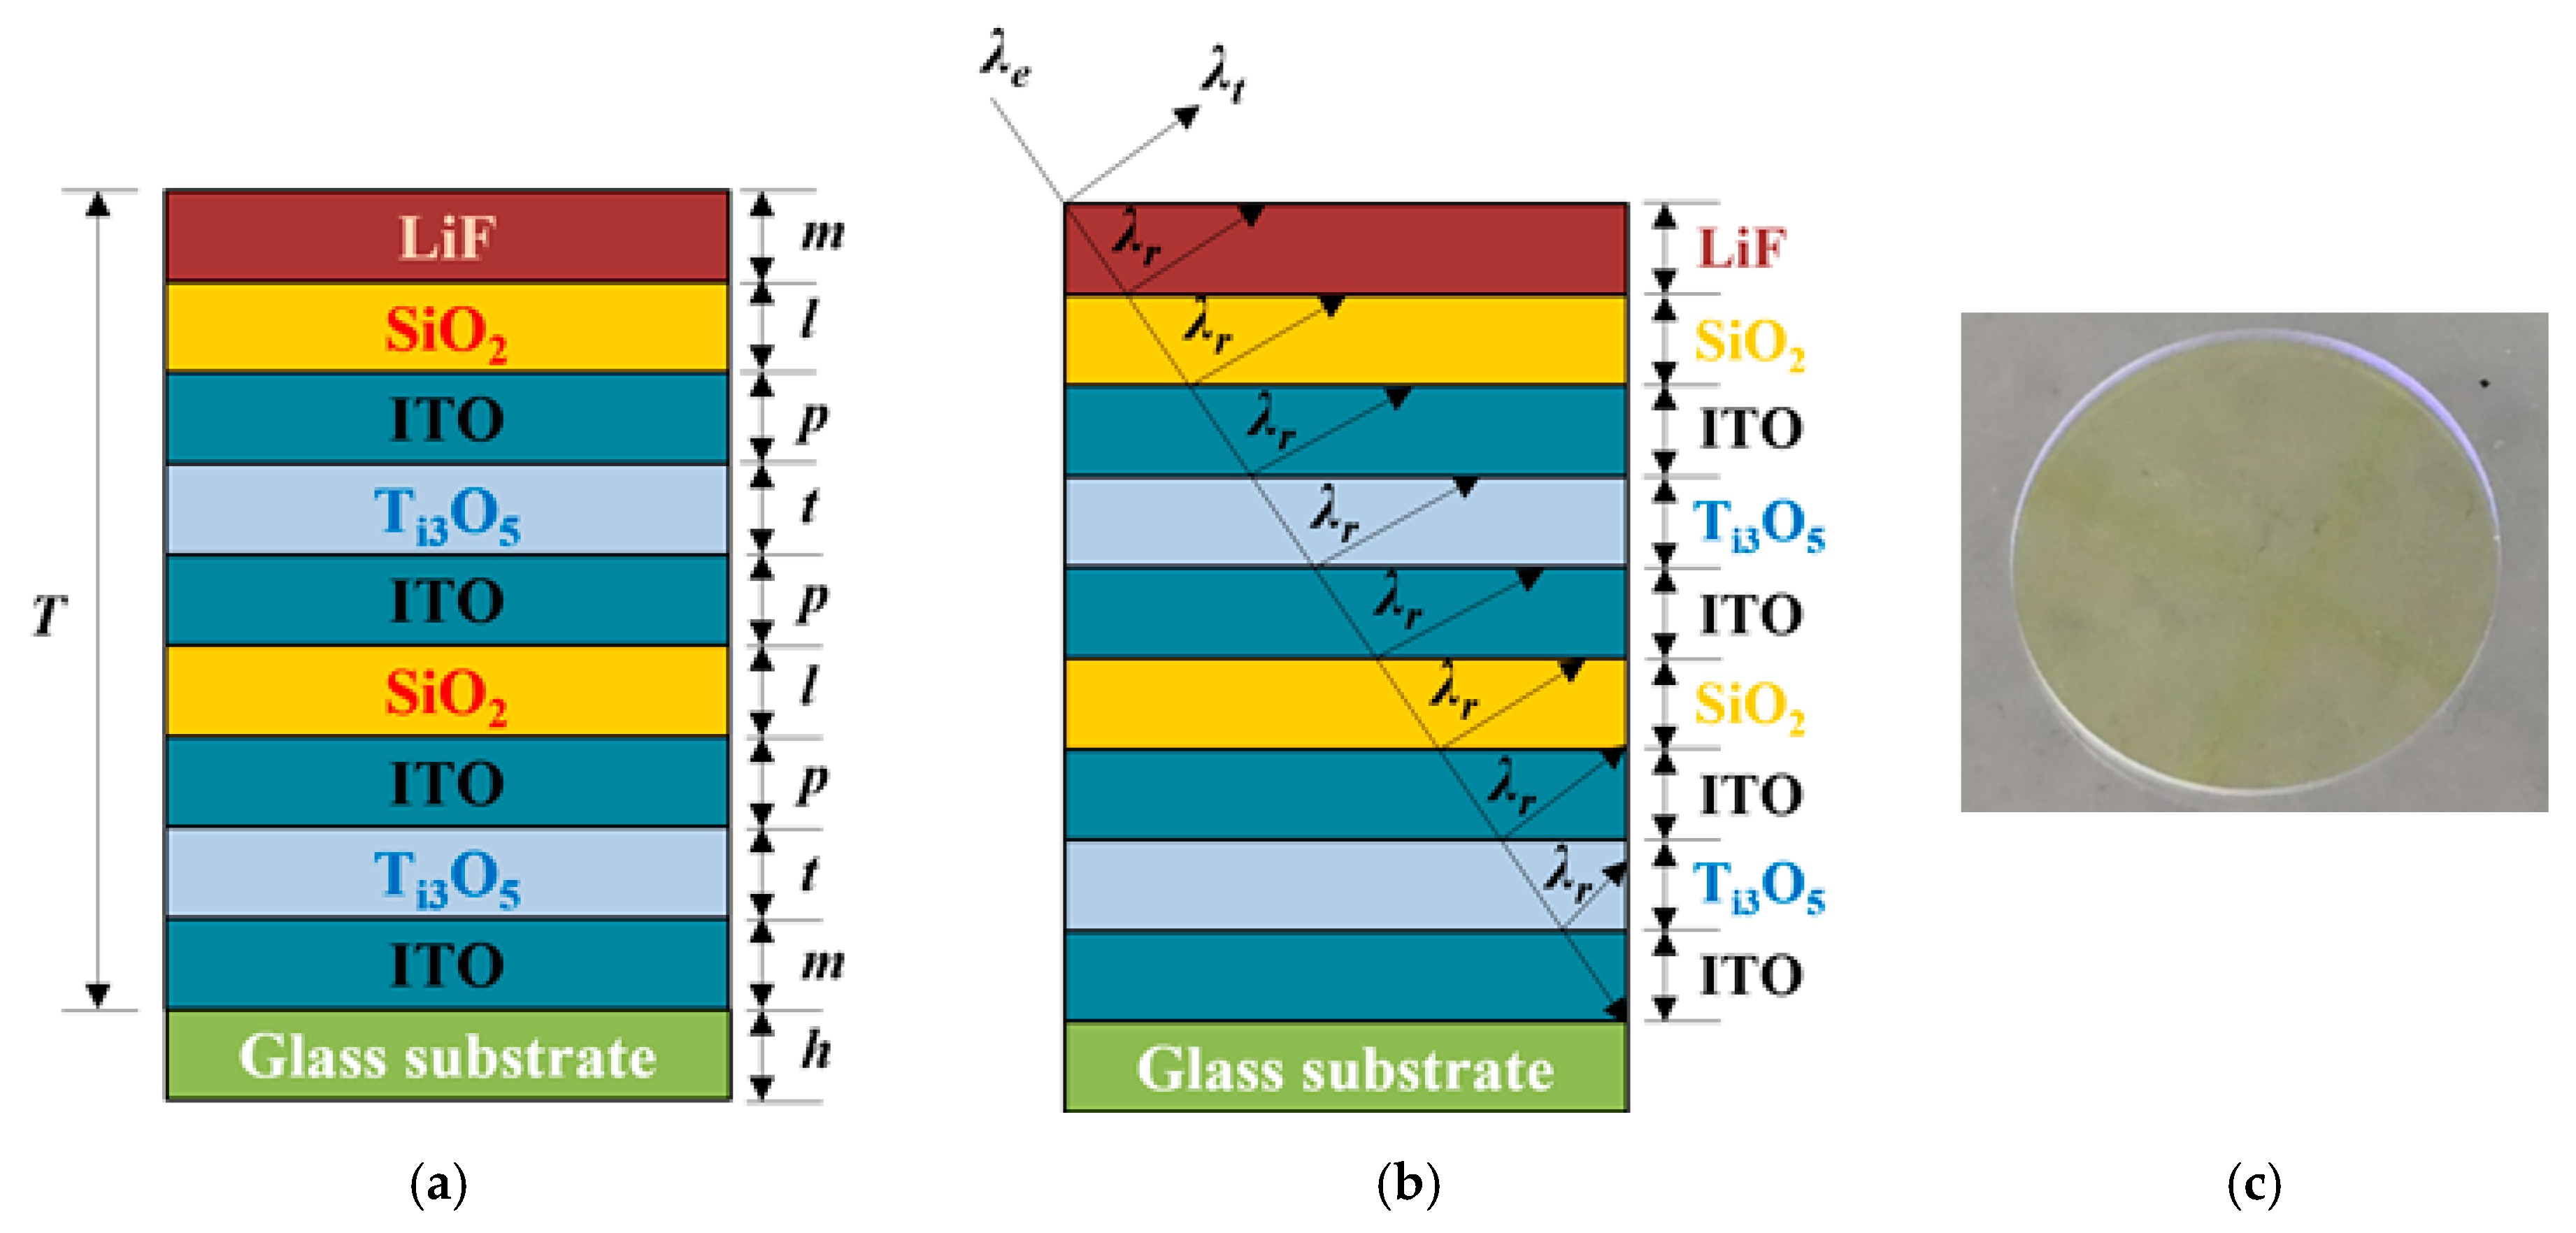
As shown in
Figure 3a, the long-pass filter fabricated for this study is made up of a glass substrate, S
iO
2, T
i3O
5, L
iF, and I
TO. Each material is deposited on top of each other through physical vapor deposition (P
VD). The
η of S
iO
2 and T
i3O
5 are 2.3 and 1.5, respectively. In addition,
m,
l,
p,
t, and
h represent the height of each layer, with each letter corresponding to 1.2, 4, 1, 2 μm, and 0.2 mm, respectively.
Figure 3b shows the passage of light when it passes through this filter. In this figure,
λr and
λt are the reflected and transmitted light, respectively. By adjusting the heights of each layer excluding the glass substrate, the refraction, reflection, and transmission of light can be controlled. Finally,
Figure 3c displays the image of the fabricated filter.
3. Experimental Results
The purpose of this experiment is to find out the effects of a long-pass filter on the quality (symmetrical distribution of light) of a fluorescence image. For fluorescence image analysis, 0.0102 mM of FL solution was prepared in a vial by adding 0.5 mL of saline and 0.02 mL of FL (FLUORESCITE® Injection 10%/Alcon Korea, Korea Alcon. Co. Ltd. Seoul, Republic of Korea). For fluorescence excitation, a 405 nm light emitting diode (LED, M405L2-C1/Thorlabs) was used. Its irradiation wavelength, forward voltage, and bandwidth are 405 nm, 3.8 V, and 13 nm, respectively. The power intensity emitted from this LED was 10 mW, which was measured by using a power meter (PM100D/Thorlabs). The distance from the light source to the sample was fixed to 5 cm, and the angle of incidence was 45°. The beam angle was measured to be 2.44°. For fluorescence observation, a near-infrared (NIR) camera (Lt-225c, Teledyne Lumenera. Co. Ltd. Ottawa, Canada) was used. This camera has a pixel size of 5.5 μm, resolution 2048 × 1088 pixels, and a frame rate of 170 fps.
Based on this setup, three different fluorescence images were recorded. The first image was taken without a filter. Another image was taken with a conventional long-pass filter (FELH0500/Thorlabs) that has a diameter of 25 mm and a thickness of 3.5 mm. The other image was taken with a fabricated long-pass filter that has a diameter of 25 mm and a thickness of 1.0 mm.
Lastly, the intensity of fluorescence light that passed through a filter was measured by using a spectrometer (FLAME-S-VIS-NIR-ES/Ocean Insight, Orlando, FL, USA). The filter was positioned between the sample and the spectrometer.
Fluorescent contrast medium (0.8 mL) diluted with fluorescent dye and normal saline was injected into a 1 mL vial as shown in
Figure 4. There were three vials into which the fluorescent contrast agent was injected, and the vials were divided into unfiltered vials and filter-applied vials. The applied filters were a conventional filter and a newly designed filter, and all three vials were irradiated with an external light source of 405 nm.
In the first vial (see
Figure 4a) irradiated with an external light source of 405 nm, the fluorescence color was blurred, and the color was changed. Therefore, the light did not match and changed to an asymmetric intensity. When diagnosing an actual lesion, it will be difficult to distinguish and observe tumors and blood vessels with similar colors. In the second vial (conventional filter) (see
Figure 4b) irradiated with an external light source of 405 nm, the fluorescence color was accurately displayed. However, the fluorescent color is slightly dimmed, the light is not clear as a whole, and the light intensity is not symmetrical as a whole. That is, since the left side is bright and the right side is dark, the brightness of the light is asymmetric. In the third vial (designed a filter) (see
Figure 4c) irradiated with an external light source of 405 nm, the fluorescence color was accurately displayed, and the color was also clearly displayed. In addition, the light intensity was symmetrically and uniformly distributed.
The emission wavelength compared to the excitation wavelength was measured when an external light source (405 nm) was irradiated on a vial without a filter and a vial with a filter (conventional filter and designed a filter). At this time, separate observations were made for the peak wavelength when no filter was applied and when the filter was applied.
In
Figure 4a, the left side of the vial is blurry, and the right side has dark shadows. In addition, a blue background is observed outside the vial because the wavelength of ambient light sources at 405 nm was unblocked. Therefore, at 15°–345° of
Figure 4d, slight bending was observed, making the image asymmetrical.
Figure 4b is more vivid than
Figure 4a, but the right side of the vial is darker than the left side. Although the 405 nm wavelength was blocked by the filter, materials used in this filter failed to reduce transmission loss, and therefore a dark image was produced. In
Figure 4c, the image looks clear and symmetric. That is, the filter used to observe this image successfully reflected ambient light sources. In addition, this filter reduced transmission loss, producing a clear fluorescence image. At 15°–345° in
Figure 4d, flatness was formed, and no bending occurred.
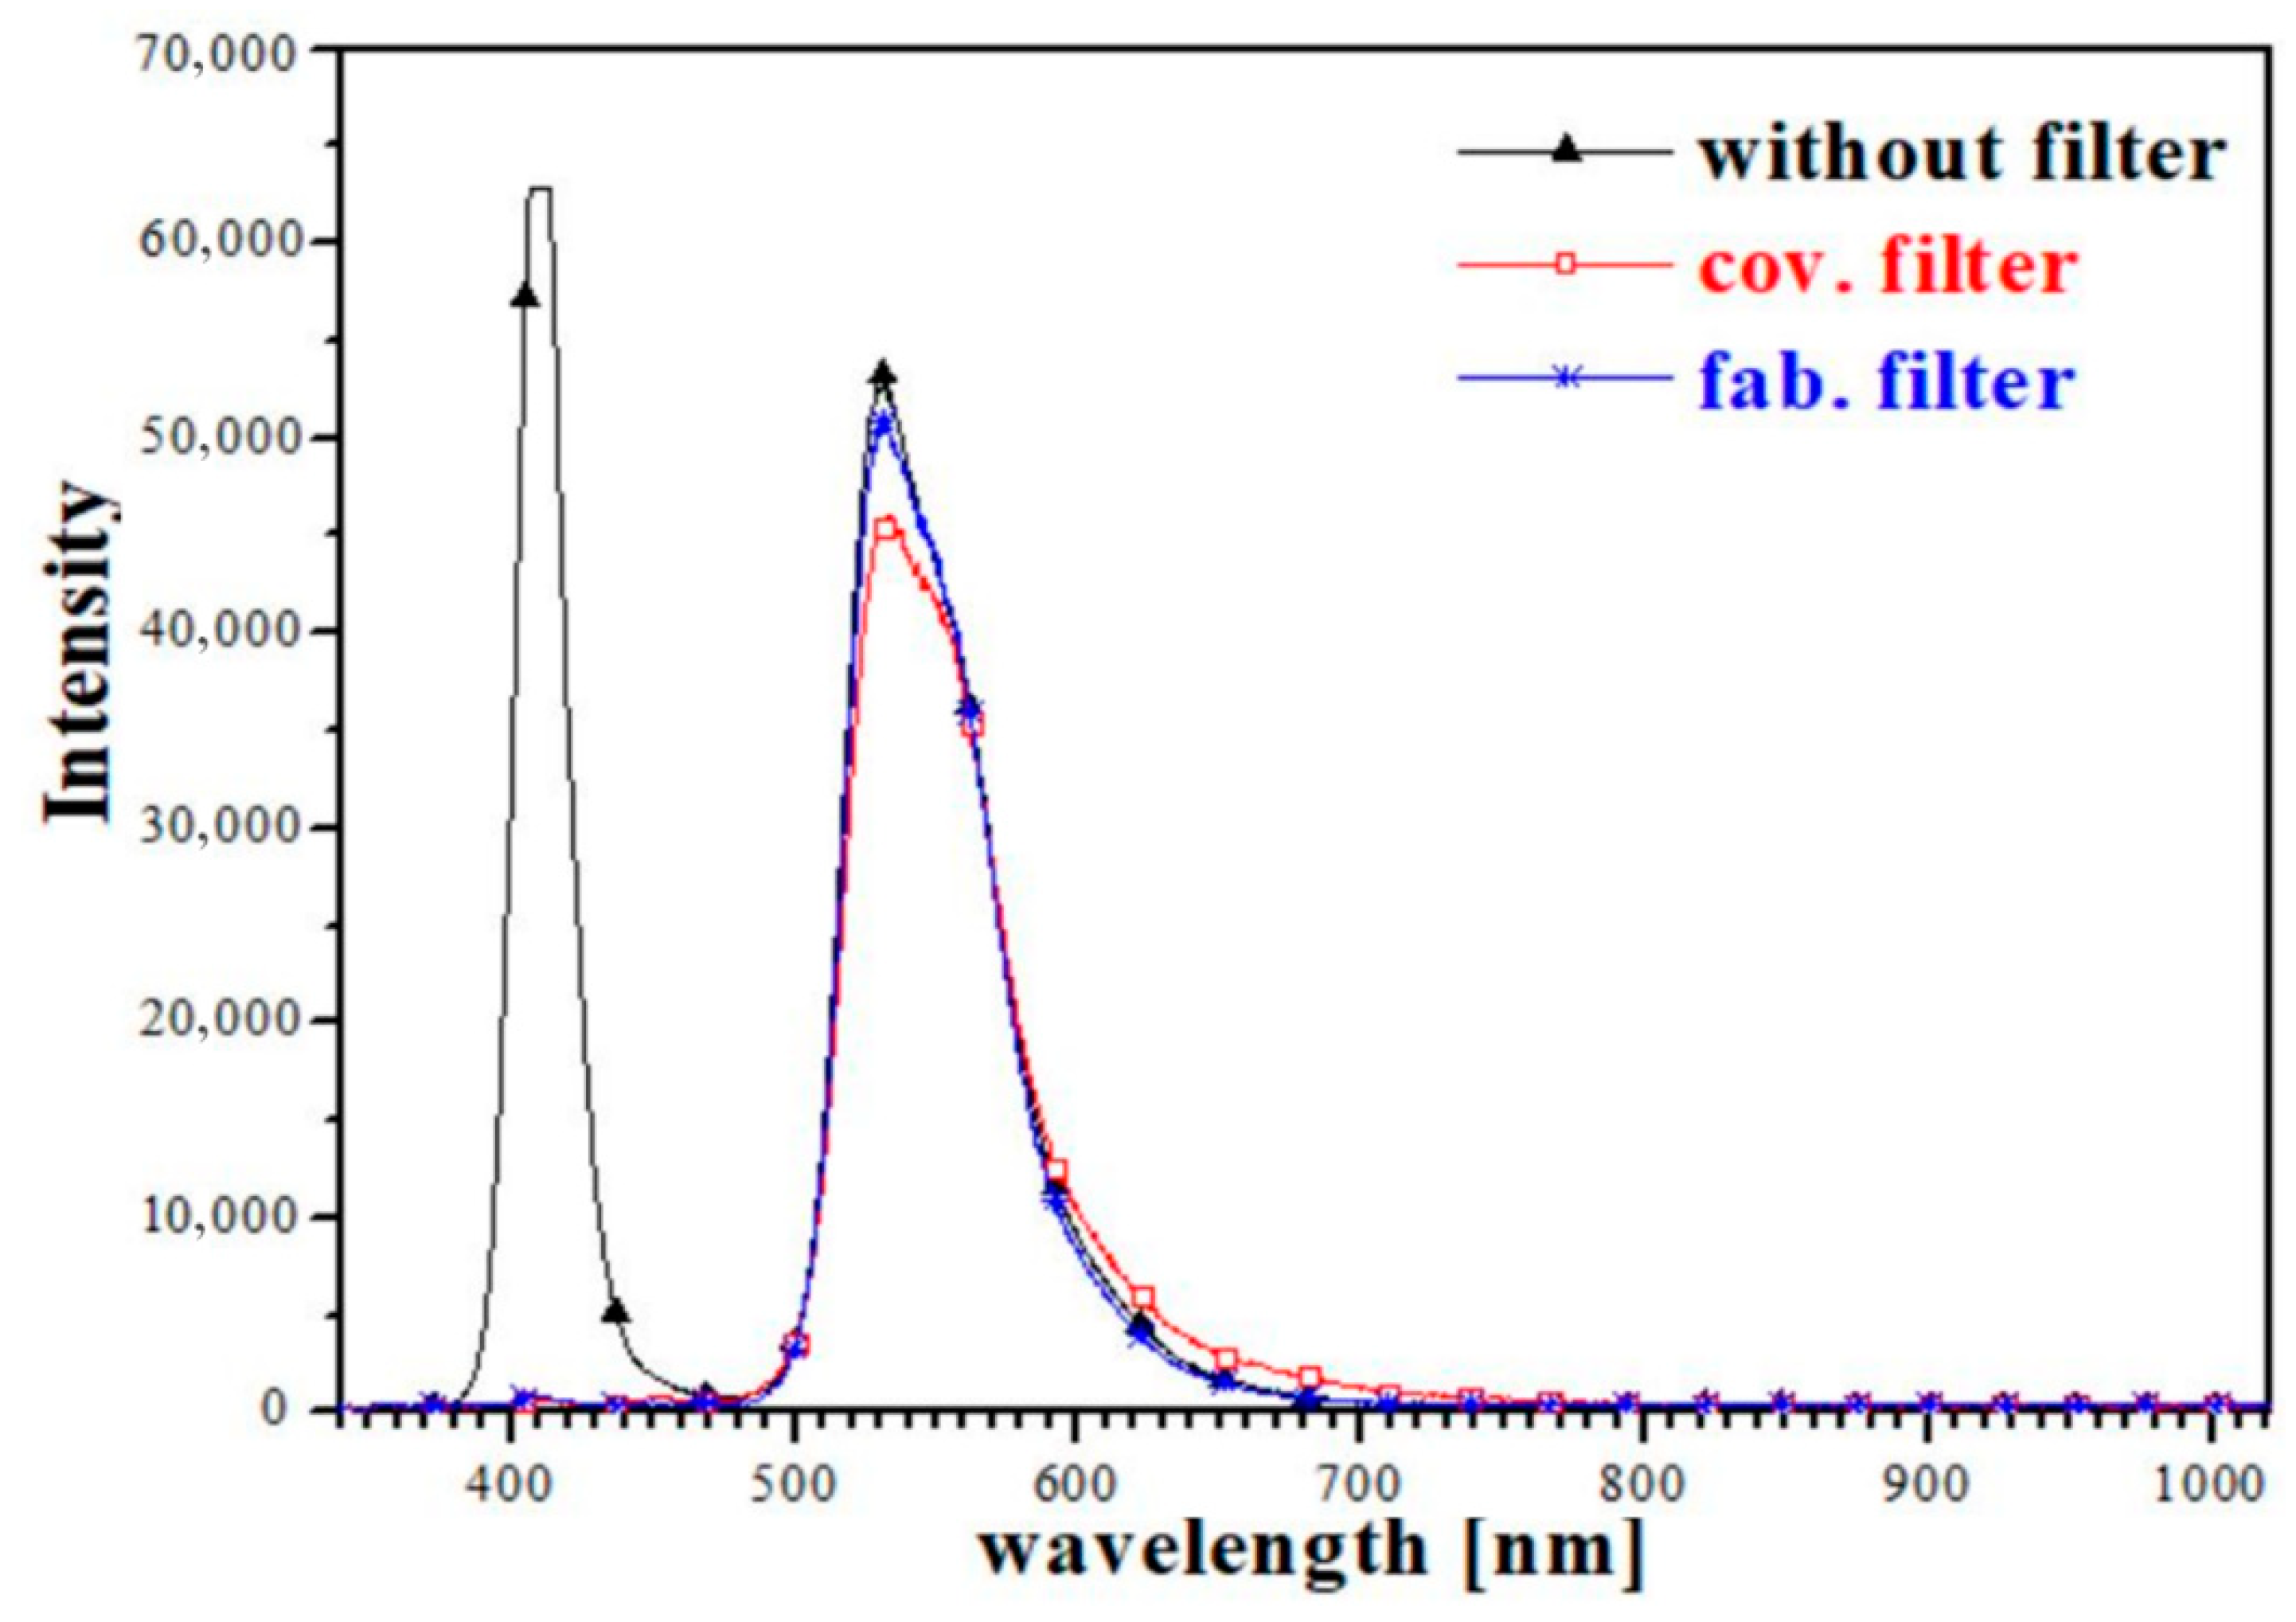
Figure 5 shows fluorescence emission from the sample. The peak intensity values, along with the corresponding wavelengths, are recorded in
Table 1. The average peak intensity was obtained at wavelengths of 531.89 nm (±1.19 nm). The peak intensity achieved by the fabricated filter was 50,483.45 in counts, whereas that achieved by the conventional filter was 46,103.17 in counts. Considering that the quality of an image increases along with an increase in peak intensity, it is determined that the image quality of
Figure 4c is higher than that of
Figure 4b [
13].
Then, by plugging the peak intensity values into Equations (3), (4) and (10), PL, OD, and T, which are the essential parameters of a filter, were calculated and displayed in
Table 1.
Referring to the table, it was possible to confirm that the PL and OD were lower, and the T value was higher in the filter manufactured to obtain a fluorescence image with uniform light intensity and symmetrical high clarity compared to the conventional filter. Since PL, OD, and T have a correlation with symmetry, it was found that the lower the PL of the filter, the clearer the fluorescence image and the symmetrical change in light intensity.
4. Discussion
The proposed filter is made up of a glass substrate, SiO2, Ti3O5, Tif, and ITO. The materials used in the proposed filter are inexpensive and are readily available on the market. By adjusting the thickness of each material, the filter’s performance can be significantly improved. Although there exist many different types of filters on the market, their wavelength bands are not suitable for use in diagnostic devices. In addition, such filters are not designed to reduce the loss of transmitted light. As a result, the blurry images are produced, making it difficult to observe the lesion. Therefore, we decided to make our own filter. The main advantages this filter has are low unit price and excellent image processing.
In
Figure 3, T (total thickness) must be within 1/4 wavelength. The types of materials and the thickness of the filter are related to the refractive index (incident, reflection, refraction, interference, etc.) [
10]. For example, the refractive indices of S
iO
2 and T
i3O
5 are 2.3 and 1.5, which are optimal for the filter. These refractive indices are achieved by adjusting the thickness ratio of S
iO
2 and T
i3O
5 to 2:1. In this study, the thickness of S
iO
2 and T
i3O
5 were 4 μm and 2 μm, respectively. Similarly, the thickness of ITO was fixed at 1.2 μm to reduce interference, and that of absorber (Lif) was fixed at 1 um to increase the incident light. These characteristics allow the total (T) thickness to be 1/4 of the wavelength (by definition, a 1:1 ratio).
The refractive index and reflectance of the filter depend on the properties of materials (SiO2 and Ti3O5), such as their thickness. Therefore, the types and thickness of materials are carefully selected and controlled to minimize the refraction and reflection. As mentioned above, it can be achieved by adjusting the entire thickness of the filter to be 1/4 of wavelength. Therefore, the filter should be carefully designed to make the entire filter (T) in a 1:1 ratio.
Fluorescence-guided surgery or diagnosis is widely performed in real life. In this technique, a surgical fluorescence microscope must produce a high-quality image for better diagnosis or treatment. Throughout this study, a long-pass filter proved to be the major contributor to the production of a clear fluorescence symmetrical image as it blocks unwanted light. In addition, the results of this study indicate that for better fluorescence observation, a filter with low OD and PL and high T need to be used. In fact, it is not an exaggeration to argue that a surgical camera whose performance is phenomenal is of no use without an appropriate filter. Thus, it can be assumed that the case studies mentioned above used inappropriate filters, resulting in the production of obscure fluorescence images [
14,
15,
16,
17]. For research studies to produce high-quality fluorescence images, researchers need to either use a filter with low PL or fabricate a filter with materials that can reduce PL.
One possible reason surgeons having never raised an issue regarding unclear fluorescence images is that they are simply used to performing surgery with such images. However, this is a serious problem because, with obscure images, surgeons will not be able to easily distinguish tumors from blood vessels. In addition, looking at unclear images for a long period of time will cause eye strain on them, which may lead to a disturbance in their concentration. Hence, introducing a filter with low PL will likely increase the success rate of tumor resection.
FL fluoresces even with a small droplet of saline. Since the main purpose of this study is to investigate the effects of a long-pass filter on a fluorescence image, this paper is premised on the assumption that the peak fluorescence emission intensity is reached at the concentration of 0.0102 mM. In a clinical trial, however, the concentration of FL solution should be adjusted according to the type of subject being tested on. Additionally, a further clinical trial needs to be performed on living subjects to validate that PL, OD, and T of a filter have effects on the quality of a fluorescence image.
As a result of analyzing the application fields, the analysis shows that the proposed filter is applicable to not just tumor diagnosis but also in other fields. Reference [
18] describes tumor-associated macrophages (M1/M2), whose fluorescence excitation wavelength and emission wavelength are 488 nm and 509–620 nm (peak emission 560 nm), respectively. These data show that the proposed filter corresponds to the wavelength band of [
18] and therefore can be used for [
19].
In addition, the emission wavelength of fibroblasts [
20] is 520–560 nm [
21]. In the fluorescent wavelength of pericytes [
22], the excitation wavelength is 405 nm and the emission wavelengths are 488 nm, 543 nm, and 633 nm, respectively [
23]. Therefore, the proposed filter is applicable to tumor observation of macrophages, fibroblasts, and pericytes.
In general, tumors are located near blood vessels [
24] but it is difficult to observe tumors with naked eye because of similarity of colors of the tumor and blood vessels. Therefore, for better diagnosis, a fluorescent contrast agent is administered to patients to highlight blood vessels, allowing for clear distinction between the two areas. The resulting fluorescence is then viewed under the surgical fluorescence microscope [
24]. Considering that this fluorescence-based approach contributes to better diagnosis of diseases, we suggest providing training programs for medical students and staffs.
In another application analysis, it is expected that the proposed filter can be used not only for fluorescence-guided tumor diagnosis but also in forensic fields (fingerprint: 505–610 nm) [
25,
26].
5. Conclusions
In this paper, a high-efficiency long-pass filter was designed, and the designed filter was used to observe the image and measure the waveform of the fluorescence contrast medium.
In this study, the effect of long-pass filter on fluorescence image observation was investigated because the current surgical fluorescence microscope cannot produce clear images due to asymmetric light distribution. In the study, fluorescence images were taken both in the absence and the presence of a long-pass filter. By comparing the fluorescence images taken with and without a filter, it was revealed that a filter is a necessary component as it blocks most of the undesired light.
To discover characteristic sets a filter should possess for clear fluorescence image production, this study introduced a fabricated long-pass filter and compared its performance with a conventional filter’s performance. By measuring the fluorescence emission intensity after passing through each filter, OD, PL, and T of each filter were calculated. The results indicated that a filter with lower OD and PL and higher T transmitted a greater amount of light. Given that the more light transmitted through, the sharper the image, we conclude that filters with low OD and PL and high T produce sharp images due to the symmetrical distribution of light. By using a filter with low OD and PL and high T, surgeons will be able to acquire a clear fluorescence image and thus better perform tumor-resection. Furthermore, such filters will allow researchers to better interpret their results in their research studies.


