Article

Higher Number of Yeast-like Fungi in the Air in 2018 after an Emergency Discharge of Raw Sewage to the Gulf of Gdańsk—Use of Contingency Tables

1
Department of Immunobiology and Environment Microbiology, Faculty of Health Sciences with Institute of Maritime and Tropical Medicine, Medical University of Gdańsk, 80-210 Gdańsk, Poland
2
Department of Nuclear Medicine, Faculty of Health Sciences with Institute of Maritime and Tropical Medicine, Medical University of Gdańsk, 80-210 Gdańsk, Poland
3
Institute of Marine and Environmental Sciences, University of Szczecin, 70-383 Szczecin, Poland
*
Authors to whom correspondence should be addressed.
Symmetry 2021, 13(8), 1522; https://doi.org/10.3390/sym13081522
Submission received: 24 May 2021 / Revised: 30 July 2021 / Accepted: 3 August 2021 / Published: 19 August 2021
(This article belongs to the Section Life Sciences)

Abstract

:
This study aimed to investigate the differences between the number of yeast-like fungi and molds in the coastal air of five coastal towns of the Gulf of Gdańsk in 2014–2017 vs. 2018, which saw an emergency discharge of sewage. In 2014–2017, a total of 62 duplicate samples were collected in the coastal towns of Hel, Puck, Gdynia, Sopot, and Gdańsk-Brzeźno. In 2018, after the emergency disposal of raw sewage, 26 air samples were collected. A Pearson chi-squared test of independence showed that during 2018 in Hel and Sopot, the mean number of molds and yeast-like fungi was higher than in 2014–2017. The result was significantly positive, p ≤ 2.22 × 10⁻¹⁶. The analysis of the General Asymptotic Symmetry Test showed that in Puck and Gdańsk-Brzeźno, the average number of Aspergillus sp. mold fungi was higher in 2018 after an emergency discharge of sewage into the Gulf of Gdańsk compared to the period 2014–2017. The result was not statistically significant. In addition, the average number of Penicillium sp. molds in 2018 in Gdańsk-Brzeźno was higher than in 2014–2017, but statistically insignificant (p = 0.9593). In 2018, the average number of Cladosporium sp. molds in Sopot was higher, but also statistically insignificant (p = 0.2114) compared to 2014–2017. Our results indicate that the study of the number of yeast-like fungi in the air may indicate coastal areas that may be particularly at risk of bacterial or mycological pathogens, e.g., after an emergency discharge of raw sewage.

1. Introduction

In light of research, it has been shown that chemical and biological factors, including bacteria, mold spores, and viruses, have a significant impact on the quality of atmospheric air (including human health) [1,2,3,4,5]. The presence of yeast-like fungi and mold spores can be the etiological cause of many diseases, including allergies, pneumonia, bronchitis, and neoplastic diseases, as well as type 1 diabetes (T1D) [6,7,8,9,10,11].
The intensity of the spread of mold spores depends on the species of fungus and weather conditions [9,10,12]. Typically, higher spore concentrations are found in windy, dry, and sunny weather. The increase in the concentration of spores in the air is observed with increasing ambient temperature [5,6,7,8]. There are hygrophilous species of the class Ascomycetes sp. that produce spores in wet weather, often in rainfall at night [10]. For many years, our team has been researching the spread of bacteria, mold and yeast-like fungi in the air, with particular emphasis on the air over the Gulf of Gdańsk [5,13,14,15,16,17]. Previous studies have shown that the spores of mold fungi are transported with air masses from above land areas to the Gulf of Gdańsk [15]. Moreover, it has also been shown that processes of bioaerosol emission into atmospheric air have the greatest intensity in the area of the mouth of the Vistula River to the Gulf of Gdańsk [5,15]. A greater number of potentially pathogenic mesophilic bacteria were found in marine bioaerosol compared to the number of psychrophilic bacteria [5]. Exposure to bacterial or fungal bioaerosol may lead to asthma, allergic rhinitis, allergic pneumonia, and many other diseases [3,8,18,19,20,21].
Mycotoxins, by-products of fungal metabolism, which may cause pain, dizziness, or immunosuppression, are an additional threat related to the presence of mold fungi in the air [22]. Previous studies have shown that fungal spores, bacteria, their endotoxins, and even viruses can be transported over long distances, where meteorological factors play a large role [3,23,24]. It is also known that in the coastal region, the strength and direction of the wind are the greatest factors influencing the microbiological quality of air [15,25,26,27,28]. Wind speed has a large impact on the process of breaking water waves, causing the formation of bubbles on the water surface and thus contributing to the transport of water pollutants to the atmosphere [5,29,30,31,32]. A special feature of bubbles is their ability to selectively accumulate hydrophobic matter and microorganisms, which are transported to the water surface and partially emitted into the air [29,30,31]. The research carried out by Michaud et al. showed a clear tendency to enrich marine aerosols in Actinobacteria, certain Gamma-proteobacteria, and lipid-enveloped viruses [32]. Experimental studies showed a high emission of aerosol enrichment with viruses (250×) and Prokaryotes (45×) [30]. On the other hand, Marks et al., in his research carried out in the Gulf of Gdańsk at the mouth of the Vistula River, showed a 12-fold higher coefficient of enrichment of sea aerosol in mesophilic bacteria, potentially pathogenic compared to psychrophilic bacteria [5]. Recent studies have also shown that airborne microorganisms can influence physical and chemical processes in the atmosphere. They affect the Earth’s radiation balance, the scattering and absorption of solar radiation directly or through condensation in clouds, and the formation of nuclei (CCN) and ice-nucleating particles (INPs) [30,32]. In our recent research, we searched for hidden relationships and regularities between meteorological factors and the number of mold and yeast-like fungi in the air of five coastal towns of the Gulf of Gdańsk [33]. For this purpose, the Principal Component Analysis (PCA) model was applied, which is one of the numerous methods of factor analysis that has been used for many years in the analysis of environmental samples [34,35,36,37,38,39]. The PCA analysis showed a significant correlation between meteorological factors and the number of molds and yeast-like fungi in the air of five coastal towns in 2014–2017 and in 2018, which saw an emergency discharge of sewage into the Gulf of Gdańsk [33]. However, the PCA model is a relatively simple graphical interpretation of results. The analysis of multivariate PCA data assumes their initial exploration and tries to explain relationships in a large dataset using a smaller set of orthogonal variables, called principal components (PCs), with the minimal loss of original information [40,41]. Therefore, the aim of this study was to assess whether there are differences in the number of mold fungi in different sampling periods, i.e., 2014–2017 vs. 2018 in five coastal towns on the Gulf of Gdansk. The use of contingency tables provided a new interpretation of the results.

2. Materials and Methods

2.1. Air Sampling Methods

Atmospheric air sampling performed in five coastal towns of the Gulf of Gdańsk (Hel, Puck, Gdynia, Sopot, and Gdańsk-Brzeźno) (Figure 1) as well as mycological analysis have been described in detail in the study conducted by Michalska et al. [33]. In short, they can be presented in the following manner: in 2014–2018, air monitoring was carried out in 5 towns of the Gulf of Gdańsk (Hel, Puck, Gdynia, Sopot, and Gdańsk-Brzeźno). All samples were collected for 10 min approximately 100 cm from the waterline at a height of 50 cm. The air samples were collected by impingement with a SAS Super ISO 100 probe (Milan, Italy). The extracted air was then transported through small holes to a head with a Petri dish containing a Sabouraud dextrose agar medium. The maximum efficiency of the collection was for particulate matter of d50 = 2–4 μm. The flow rate was 90 Lpm. All removable parts of the air sampler were sterilized by autoclaving before sampling, and the sterilized sampler head was cleaned between samples with 70% ethanol. In 2014–2017, a total of 62 duplicate samples were collected in the coastal towns of Hel, Puck, Gdynia, Sopot, and Gdańsk-Brzeźno, while in 2018, 26 duplicate samples were taken [33].

2.2. Meteorological Conditions

In each year, the samples were always collected from May to July. The air temperature in 2014–2017 ranged from 26 °C to 3 °C in the spring and from 20 °C to 16 °C in the summer. Relative humidity was between 30% and 88% (spring), and from 59% to 82% (summer). Wind speed was between 0 and 31 km/h in the spring and between 7 and 25 km/h in the summer. Air temperature in 2018 fluctuated between 27 °C and 10 °C (spring) and between 27 °C and 15 °C (summer). Relative humidity was between 39% and 93% (spring), and from 44% to 70% (summer). Wind speed varied between 0 and 15 km/h (spring) and between 2.6 and 32 km/h (summer). They were not collected during rain and heavy rainfall [33].

2.3. Analysis and Identification of the Mold and Yeast-Like Fungi

Mold and yeast-like fungi were counted after a 120-h incubation at 28 °C on Sabouraud dextrose agar medium by Merck (Germany). Yeast-like fungi were identified by CHROMagar Candida, Graso Biotech (Poland). Mold and yeast-like fungi colonies were identified on the basis of color, texture, topography of the culture surface, smell of the colony, color of the reverse of the colony and the presence of the diffuse pigment. Microscopic features of the fungal colonies were identified based on their microscopic features using the Nikon Eclipse E2000 microscope at magnification 400, 600, 1000× and a fungus identification key [33,42,43].
The number of colonies of fungi was expressed as a colony-forming unit (CFU) per 1 m3 of the air (CFU/m3). When applying the impact method, we used the Feller table attached to the manual of the air sampler [33,44].
The colonies collected should be revised by the equation:
Pr = N[1/N + 1/N − 1 + 1/N − 2 + 1/N − r + 1]
where Pr is the revised colony in stage, N is the number of sieve pores, and r is the number of viable particles counted on the agar plate.
The number of colonies of fungi (CFU/m3) was calculated using the following equation:
C(CFU/m3) = T × 1000 t(min) × F(L/min)
where C—airborne fungi concentration; CFU—colony-forming unit; T—total colonies after application of the Pr statistical correction; t—sampling time; and F—airflow rate.

2.4. Statistical Analysis

Statistical analysis of the results was carried out using R software [45,46], and for the symmetry, the test using the coin [47].
The non-parametric Friedman rank-sum test was used to analyze the difference between the mean number of mold and yeast-like fungi in the air in 2014–2017 and 2018. For the analysis using the χ2 test, contingency tables were prepared for the qualitative variable “Years of sampling” (two subgroups; “2014–2017” and “2018”) and the qualitative variable “Place” (five subgroups: Hel, Puck, Gdynia, Sopot, and Gdańsk-Brzeźno). The average number of mold and yeast-like fungi is responsible for the presence or absence of correlation between the qualitative variables. The expected values for individual cells (from the row i and column j) were calculated based on the following formula:
E i j = r i c j n
where ri is the sum of the values from row i, cj is the sum of the values from column j, and n is the sum of all values from the contingency table. The formula shows that the appearance of large values in the cells of the contingency tables has an impact on the expected values. It also affects the share of each cell in the total value χ2, which is calculated using the following formula:
χ i j 2 = O i j E i j 2 E i j
where Oij is the cell value from the contingency table (average number of fungi). The scripts took into account the fact that the χ2 test may present difficulties with contingency tables if the numbers in individual cells of the tables are too small. In the event of a warning message, the algorithm automatically decides to use an exact probability, such as Fisher’s exact test. We have also calculated the measure of dependence between the factors placed in lines and columns (Pearson’s χ2):
χ 2 = i = 1 w j = 1 k χ i j 2
(where w is the number of rows, and k is the number of columns), which—in combination with the results determined from the previous formulas—allowed the figures corresponding to the contingency tables to be created (Figure 2, Figure 3, Figure 4 and Figure 5). The bars on the plot represent the Pearson residuals, the color code and the height of the bars denote the significance level and magnitude of the residuals, and their widths are proportional to the sample size. In each of the association figures, the blue color indicates that the observed value is higher than the expected value if the data were random. The red color specifies that the observed value is lower than the expected value if the data were random. The grey color represents the data where the concentrations are similar to observations under the null hypothesis where a test of independence is true.

3. Results

3.1. The Number of Molds and Yeast-Like Fungi in the Air of Seaside Towns in the Gulf of Gdańsk in 2014–2017 and 2018

The study conducted in 2018, which saw an emergency disposal of untreated sewage into the Motława River, which flows into the Gulf of Gdańsk, showed a higher number of mold and yeast-like fungi in the air of Hel, Puck, Sopot, and Gdańsk-Brzeźno. The average number of mold and yeast-like fungi in the seaside town of Hel was 260 ± 494 CFU/m3 compared to 17 ± 19 CFU/m3 in 2014–2017, when there was no emergency sewage disposal. The average number of mold and yeast-like fungi in Puck was 194 ± 90 CFU/m3 compared to 36 ± 18 CFU/m3 reported in 2014–2017. In 2018, the average number of mold and yeast-like fungi in Sopot was 228 ± 195 CFU/m3 compared to 16 ± 8 CFU/m3 in 2014–2017. In Gdańsk-Brzeźno, the average number of mold and yeast-like fungi was 205 ± 180 CFU/m3 compared to 20 ± 10 CFU/m3 in 2014 to 2017. In 2018, in Gdynia, mold and yeast-like fungi were not detected (0 ± 0 CFU/m3) compared to 34 ± 35 CFU/m3 in 2014–2017. The results are shown in Table 1.

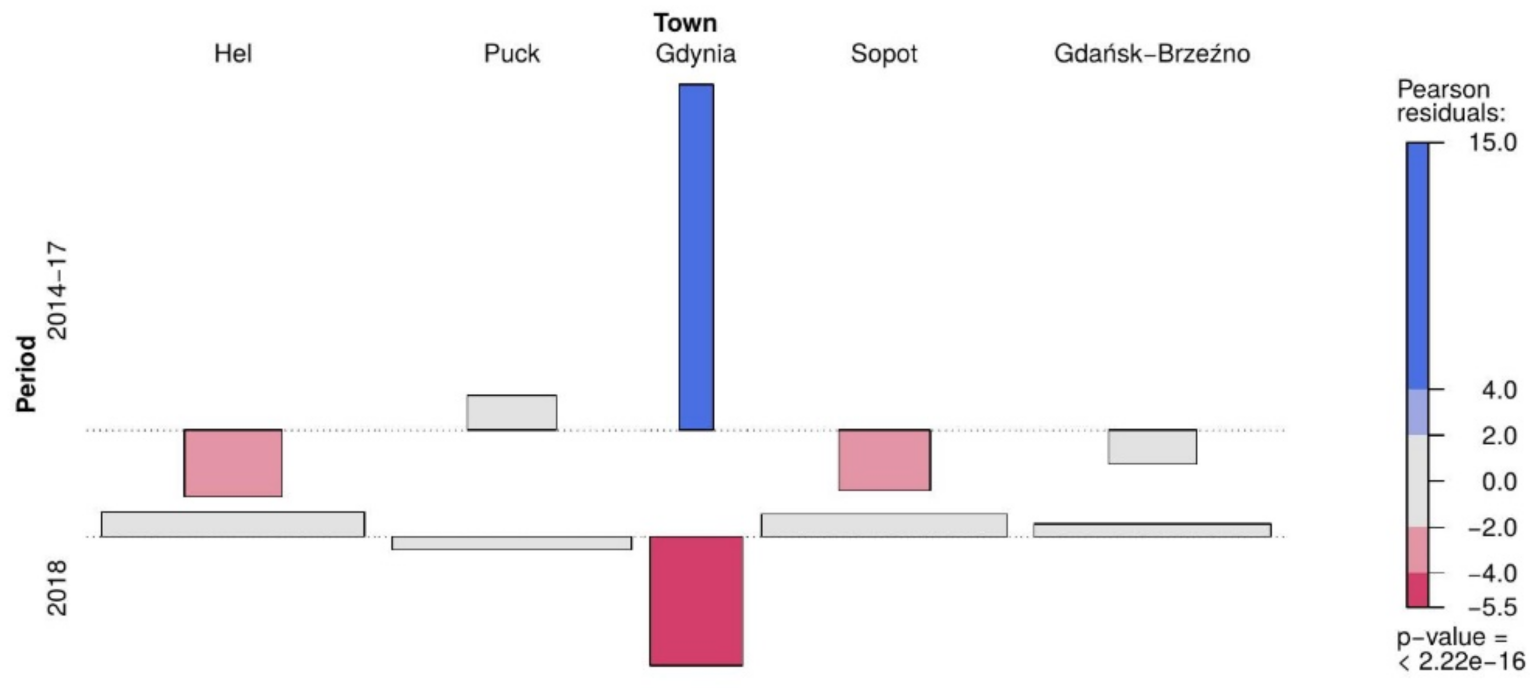
3.2. The Relationship between the Number of Molds and Yeast-Like Fungi in the Air of Coastal Towns and the Research Period of 2014–2017 and 2018

A Pearson chi-squared test of independence showed that during 2018 in Hel and Sopot, the mean number of molds and yeast-like fungi was higher than in the years 2014–2017. The result was significantly positive, p ≤ 2.22 × 10⁻¹⁶ (Figure 2).

3.3. The Relationship between the Number of Mold Fungi Aspergillus sp., Penicillium sp., Cladosporium sp. in the Research Period of 2014–2017 vs. 2018

In our study, statistical analysis based on contingency tables was used to evaluate the number of mold fungi Aspergillus sp. (Figure 3), Penicillium sp. (Figure 4), and Cladosporium sp. (Figure 5) in 2014–2017 and in 2018.
In 2018 in Puck and Gdańsk-Brzeźno, the number of Aspergillus sp. mold fungi was higher compared to 2014–2017. The result was statistically significantly positive, p ≤ 2.22 × 10⁻¹⁶ (Figure 3).
The analysis of contingency tables demonstrated that in 2018, which saw the emergency disposal, the number of mold fungi Penicillium sp. in the coastal town of Gdańsk-Brzeźno was significantly higher than in 2014–2017 (p = 8.9631 × 10⁻¹⁴) (Figure 4).
Moreover, in Sopot, also in 2018, the number of mold fungi Cladosporium sp. was significantly higher compared to 2014–2017 (p ≤ 2.22 × 10⁻¹⁶) (Figure 5).
An Asymptotic General Symmetry Test was used and we checked how the average number of mold and yeast-like fungi changed in the two studied groups. These groups were “2014–2017” and “2018”, and the binding element has five coastal towns located on the Gulf of Gdańsk. In 2014–2017 in the coastal towns Hel and Sopot, the number of molds and yeast-like fungi decreased, and in 2018 it increased compared to the expected value. In Gdynia, the number of molds and yeast-like fungi in 2018 decreased and was lower than in 2014–2017. The result was not statistically significant, p = 0.05957.
In 2018, the average number of Aspergillus sp. molds in Hel and Gdynia was lower compared to 2014–2017. On the other hand, in Puck and Gdańsk-Brzeźno it was higher compared to 2014–2017. However, the result was not statistically significant, p = 0.1346. The average number of Penicillium sp. in 2018 in Puck and Gdynia was lower than that reported in 2014–2017, and in Gdańsk-Brzeźno the number was higher than in 2014–2017. The result obtained using the Asymptotic General Symmetry Test was also not statistically significant, p = 0.9593. In 2018, a lower average number of Cladosporium sp. was detected in Gdynia and a higher number in Sopot, but not statistically significant, p = 0.2114 (in both towns) compared to the number of Cladosporium sp. in 2014–2017.

3.4. The Influence of Meteorological Parameters on the Number of Mold and Yeast-Like Fungi in the Air of the Towns Located in the Gulf of Gdańsk

The research into the number of mold and yeast-like fungi in the air of seaside towns in the Gulf of Gdańsk (Hel, Puck, Gdynia, Sopot, and Gdańsk-Brzeźno) included relative air humidity, air temperature, wind speed, and direction. The analysis based on Spearman’s correlation coefficient showed a statistically significant relationship between the relative air humidity in the Gulf of Gdańsk and the number of mold and yeast-like fungi (p = 0.009). However, no relationship was found between air temperature and the number of mold and yeast-like fungi (p = 0.526).
On the other hand, a statistically significant relationship was found between the wind speed in the seaside towns in the Gulf of Gdańsk (Hel, Puck, Gdynia, Sopot, and Gdańsk-Brzeźno) and the number of mold and yeast-like fungi (p = 0.002). The analysis conducted based on the Kruskal–Wallis test demonstrated a statistically significant relationship between the wind direction and the number of mold and yeast-like fungi (p = 0.007).

4. Discussion

There are many environmental studies in which multivariate statistical methods were used, for instance, physicochemical analysis of surface waters [34,37,39], waters in retention reservoirs [36], bottom sediments [48,49] and atmospheric air [31,50], as well as the assessment of the microbiological quality of air [3,33,38]. In our current study, the multivariate data analysis with the use of contingency tables showed a statistically significant relationship between the number of molds and yeast-like fungi in the coastal towns in 2014–2017 and 2018. In 2018, a statistically significantly higher total number of mold and yeast-like fungi was detected in the atmospheric air of the seaside town of Hel and Sopot, compared to the period 2014–2017. Moreover, in 2018, there was a higher, statistically significant (p ≤ 2.22 × 10⁻¹⁶) number of mold fungi Aspergillus sp. in Puck and Gdańsk-Brzeźno. Furthermore, in 2018, in the seaside town of Gdańsk-Brzeźno, a statistically significantly higher number of Penicillium sp. mold fungi was detected (p ≤ 8.9631 × 10⁻¹⁴). On the other hand, in the seaside town of Sopot, a higher, statistically significant (p ≤ 2.22 × 10⁻¹⁶) number of mold fungi of Cladosporium sp. was identified. According to research conducted so far, the spores of the mold fungi Aspergillus sp., Penicillium sp., Cladosporium sp. and their mycotoxins contribute to the development of allergic bronchopulmonary aspergillosis (ABPA), aspergilloma, chronic necrotic aspergillosis (CNA), invasive pulmonary aspergillosis (IPA), asthma and anemia [6,10,51]. Therefore, seasonal monitoring of the microbiological quality of atmospheric air should be carried out in seaside towns as an important tool to estimate the exposure to allergens. Current studies on air pollution focused on monitoring the concentrations of plant pollen, PM2.5, PM10 dust, and gases do not reflect the actual situation [50]. The authors of this study are also convinced that these determinations can be used to develop a prognostic model for the concentration of mold spores in the coastal region.
We also know that the spread of mold fungi is influenced by atmospheric conditions, especially relative humidity, wind speed, temperature, and insolation [18,24,52]. Our research also attempted to assess the impact of meteorological conditions on the presence of mold and yeast-like fungi in the seaside air of the towns of Hel, Puck, Gdynia, Sopot, and Gdańsk-Brzeźno. The results of our study indicate a statistically significant relationship between the relative air humidity (p = 0.009) and the number of mold and yeast-like fungi. We have also shown a statistically significant relationship between the wind direction (p = 0.097), wind speed (p = 0.002), and the number of mold and yeast-like fungi. Recent bioaerosol studies confirm that the number of mold fungi depends on air temperature, relative humidity, and wind speed [18,53,54,55]. In 2018, the maximum number of mold and yeast-like fungi was detected in the atmospheric air of the seaside town of Hel, when the relative humidity was 60% and the wind from the Gulf of Gdańsk was blowing at a speed of 3 ms−1. On the other hand, in the seaside town of Sopot, a significantly higher number of mold fungi Cladosporium sp. was observed when the relative air humidity was 53% and the wind was blowing along the shore at a speed of 4.5 ms−1. In addition, in 2018, we detected a significantly higher number of mold fungi Aspergillus sp. and Penicillium sp. in the seaside town of Gdańsk-Brzeźno. The maximum number of Aspergillus sp. was detected in the atmospheric air, at a relative humidity of 55%, and when the wind was blowing along the shore with a speed of 4.2 ms−1. The maximum number of Penicillium sp. was detected in the atmospheric air when the relative humidity was 65% and the wind from the Gulf of Gdańsk was blowing at the speed of 8.9 ms−1. Our previous research results [8,33] and the present study outcomes confirm the influence of atmospheric conditions on the number of yeast-like fungi in coastal bioaerosol.

5. Conclusions

The higher number of mold and yeast fungi in 2018 due to the failure of the sewage treatment plant may pose a risk to people visiting seaside bathing areas. Therefore, we suggest air monitoring in coastal towns to quickly detect higher concentrations of potentially pathogenic microorganisms.

Author Contributions

Conceptualization, M.M. and P.W.; methodology, M.M. and M.K.; validation, R.M., P.W. and K.Z.; formal analysis, M.M. and P.W.; investigation, M.M.; software, P.W.; data curation, K.Z.; R.M. and P.W.; writing—original draft preparation, M.M. and K.Z.; writing—review and editing, K.Z., M.M., M.K., R.M. and P.W.; supervision, K.Z., P.W. and R.M. All authors have read and agreed to the published version of the manuscript.

Funding

This research was funded by the Medical University of Gdańsk, grant number ST-02-0108/07/780.

Institutional Review Board Statement

Not applicable.

Informed Consent Statement

Not applicable.

Data Availability Statement

The data supporting reported results can be in Department of Immunobiology and Environment Microbiology.

Conflicts of Interest

The authors declare no conflict of interest.

References

  1. Michalska, M.; Zorena, K.; Wąż, P.; Bartoszewicz, M.; Brandt-Varma, A.; Ślęzak, D.; Robakowska, M. Gaseous Pollutants, and Particulate Matter (PM) in Ambient Air and the Number of New Cases of Type 1 Diabetes in Children and Adolescents in the Pomeranian Voivodeship, Poland. BioMed Res. Int. 2020, 2020, 1648264. [Google Scholar] [CrossRef] [PubMed] [Green Version]
  2. Xin, T.K.; Azman, N.M.; Firdaus, R.B.R.; Ismail, N.A.; Rosli, H. Airborne fungi in Universiti Sains Malaysia: Knowledge, density and diversity. Environ. Monit. Assess. 2021, 193, 504. [Google Scholar] [CrossRef]
  3. Petrikkos, G.; Skiada, A.; Drogari-Apiranthitou, M. Epidemiology of mucormycosis in Europe. Clin. Microbiol. Infect. 2014, 20, 67–73. [Google Scholar] [CrossRef] [Green Version]
  4. Cordero, J.M.; Núñez, A.; García, A.M.; Borge, R. Assessment and statistical modeling of airborne microorganisms in Madrid. Environ. Pollut. 2021, 269, 116124. [Google Scholar] [CrossRef]
  5. Marks, R.; Kruczalak, K.; Jankowska, K.; Michalska, M. Bacteria and fungi in air over the Gulf of Gdansk and Baltic Sea. J. Aerosol Sci. 2001, 32, 43–56. [Google Scholar] [CrossRef]
  6. Kallawicha, K.; Chuang, Y.C.; Lung, S.C.C.; Wu, C.F.; Han, B.C.; Ting, Y.F.; Chao, H.J. Outpatient visits for allergic diseases are associated with exposure to ambient fungal spores in the greater Taipei area. Aerosol Air Qual. Res. 2018, 18, 2077–2085. [Google Scholar] [CrossRef]
  7. Michałkiewicz, M. Comparison of wastewater treatment plants based on the emissions of microbiological contaminants. Environ. Monit. Assess. 2018, 190, 640. [Google Scholar] [CrossRef] [PubMed] [Green Version]
  8. Michalska, M.; Wąż, P.; Zorena, K.; Bartoszewicz, M.; Korzeniowska, K.; Krawczyk, S.; Beń-Skowronek, I.; Myśliwiec, M. Potential effects of microbial air quality on the number of new cases of diabetes type 1 in children in two regions of Poland: A pilot study. Infect. Drug Resist. 2019, 12, 2323–2334. [Google Scholar] [CrossRef] [PubMed] [Green Version]
  9. Jakubiak-Lasocka, J.; Lasocki, J.; Badyda, A.J. The Influence of Particulate Matter on Respiratory Morbidity and Mortality in Children and Infants. Environmental Biomedicine. Adv. Exp. Med. Biol. 2014, 849, 39–48. [Google Scholar]
  10. Fröhlich-Nowoisky, J.; Kampf, C.J.; Weber, B.; Huffman, J.A.; Pöhlker, C.; Andreae, M.O.; Lang-Yona, N.; Burrows, S.M.; Gunthe, S.S.; Elbert, W.; et al. Bioaerosols in the Earth system: Climate, health, and ecosystem interactions. Atmos. Res. 2016, 182, 346–376. [Google Scholar] [CrossRef] [Green Version]
  11. Gładka, A.; Rymaszewska, J.; Zatonski, T. Impact of air pollution on depression and suicide. Int. J. Occup. Med. Environ. Health 2018, 31, 711–721. [Google Scholar] [CrossRef] [PubMed]
  12. Chen, X.; Kumari, D.; Achal, V. A review on airborne microbes: The characteristics of sources, pathogenicity, and geography. Atmosphere 2020, 11, 919. [Google Scholar] [CrossRef]
  13. Schlosser, O.; Robert, S.; Debeaupuis, C. Aspergillus fumigatus and mesophilic moulds in air in the surrounding environment downwind of non-hazardous waste landfill sites. Int. J. Hyg. Environ. Health 2016, 219, 239–251. [Google Scholar] [CrossRef]
  14. Michalska, M.; Królska, M. Surface distribution of the coliform bacteria in the Gdańsk Bay. Bull. Inst. Marit. Trop. Med. Gdynia 1995, 46, 67–70. [Google Scholar] [PubMed]
  15. Michalska, M.; Bartoszewicz, M.; Cieszyńska, M.; Nowacki, J. Bioaerosols on Tri-city (Gdańsk-Sopot-Gdynia) beaches. Int. Marit. Health 2010, 61, 41–43. [Google Scholar] [PubMed]
  16. Michalska, M.; Bartoszewicz, M.; Cieszyńska, M.; Nowacki, J. Bioaerozol morski w rejonie Zatoki Gdańskiej. Med. Srod. 2011, 14, 24–28. [Google Scholar]
  17. Michalska, M.; Zorena, K.; Bartoszewicz, M. Analysis of faecal bacteria isolated from air and sweater samples following an emergency sewage discharge into the Gulf of Gdansk in 2018—Preliminary study. Int. Marit. Health 2019, 70, 239–243. [Google Scholar] [CrossRef]
  18. Hameed, A.A.; Khoder, M.I.; Ibrahim, Y.H.; Saeed, Y.; Osman, M.E.; Ghanem, S. Study on some factors affecting survivability of airborne fungi. Sci. Total Environ. 2012, 414, 696–700. [Google Scholar] [CrossRef]
  19. Kowalewska, B.; Zorena, K.; Szmigiero-Kawko, M.; Wąż, P.; Myśliwiec, M. Higher diversity in fungal species discriminates children with type 1 diabetes mellitus from healthy control. Patient Prefer. Adherence 2016, 10, 591–599. [Google Scholar]
  20. Michalska, M.; Bartoszewicz, M.; Wąż, P.; Kozaczuk, S.; Beń-Skowronek, I.; Zorena, K. PM10 concentration and microbiological assessment of air in relation to the number of acute cases of type 1 diabetes mellitus in the Lubelskie Voivodeship. Preliminary report. Pediatr. Endocrinol. Diabetes Metab. 2017, 23, 70–76. [Google Scholar] [CrossRef]
  21. Madhwal, S.; Prabhu, V.; Sundriyal, S.; Shridhar, V. Ambient bioaerosol distribution and associated health risks at a high traffic density junction at Dehradun city, India. Environ. Monit. Assess. 2020, 192, 196. [Google Scholar] [CrossRef] [Green Version]
  22. Schlosser, O. Bioaerosols and health: Current knowledge and gaps in the field of waste management. Detritus 2018, 5, 111–125. [Google Scholar] [CrossRef]
  23. Rowe, B.R.; Canosa, A.; Drouffe, J.M.; Mitchell, J.B.A. Simple quantitative assessment of the outdoor versus indoor airborne transmission of viruses and COVID-19. Environ. Res. 2021, 198, 111189. [Google Scholar] [CrossRef]
  24. Xie, W.; Li, Y.; Bai, W.; Hou, J.; Ma, T.; Zeng, X.; Zhang, L.; An, T. The source and transport of bioaerosols in the air: A review. Front. Environ. Sci. Eng. 2021, 15, 44. [Google Scholar] [CrossRef]
  25. Lewandowska, A.; Falkowska, L.; Jóźwik, J. Factors determining the fluctuation of fluoride concentrations in PM10 aerosols in the urbanized coastal area of the Baltic Sea (Gdynia, Poland). Environ. Sci. Pollut. Res. Int. 2013, 20, 6109–6118. [Google Scholar] [CrossRef] [Green Version]
  26. Grythe, H.; Ström, J.; Krejci, R.; Quinn, P.; Stohl, A. A review of sea-spray aerosol source functions using a large global set of sea salt aerosol concentration measurements. Atmos. Chem. Phys. 2014, 14, 1277–1297. [Google Scholar] [CrossRef] [Green Version]
  27. Pakpour, S.; Li, D.W.; Klironomos, J. Relationships of fungal spore concentrations in the air and meteorological factors. Fungal Ecol. 2015, 13, 130–134. [Google Scholar] [CrossRef]
  28. Ma, M.; Zhen, Y.; Mi, T. Characterization of bacterial communities in bioaerosols over Northern Chinese Marginal Seas and the Northwestern Pacific Ocean in spring. J. Appl. Meteorol. Climatol. 2019, 58, 903–917. [Google Scholar] [CrossRef]
  29. Nakajima, R.; Tsuchiya, K.; Nakatomi, N.; Yoshida, T.; Tada, Y.; Konno, F.; Toda, T.; Kuwahara, V.S.; Hamasaki, K.; Othman, B.H.R.; et al. Enrichment of microbial abundance in the sea-surface microlayer over a coral reef: Implications for biogeochemical cycles in reef ecosystems. Mar. Ecol. Prog. Ser. 2013, 490, 11–22. [Google Scholar] [CrossRef] [Green Version]
  30. Rastelli, E.; Corinaldesi, C.; Dell’Anno, A.; Martire, M.L.; Greco, S.; Facchini, M.C.; Rinaldi, M.; O’Dowd, C.; Ceburnis, D.; Danovaro, R. Transfer of labile organic matter and microbes from the ocean surface to the marine aerosol: An experimental approach. Sci. Rep. 2017, 7, 11475. [Google Scholar] [CrossRef]
  31. Marks, R.; Górecka, E.; McCartney, K.; Borkowski, W. Rising bubbles as mechanism for scavenging and aerosolization of diatoms. J. Aerosol Sci. 2019, 128, 79–88. [Google Scholar] [CrossRef]
  32. Michaud, J.M.; Thompson, L.R.; Kaul, D.; Espinoza, J.L.; Richter, R.A.; Xu, Z.Z.; Lee, C.; Pham, K.M.; Beall, C.M.; Malfatti, F.; et al. Taxon-specific aerosolization of bacteria and viruses in an experimental ocean-atmosphere mesocosm. Nat. Commun. 2018, 9, 1–10. [Google Scholar] [CrossRef]
  33. Michalska, M.; Kurpas, M.; Zorena, K.; Wąż, P.; Marks, R. Mold and Yeast-Like Fungi in the Seaside Air of the Gulf of Gdansk (Southern Baltic) after an Emergency Disposal of Raw Sewage. J. Fungi 2021, 7, 219. [Google Scholar] [CrossRef]
  34. Cieszyńska, M.; Wesołowski, M.; Bartoszewicz, M.; Michalska, M. Assessment of river water quality in the South Baltic coast by multivariate techniques. Cent. Eur. J. Chem. 2011, 9, 265–274. [Google Scholar] [CrossRef]
  35. Staniszewska, M.; Graca, B.; Bełdowska, M.; Saniewska, D. Factors controlling benzo(a)pyrene concentration in aerosols in the urbanized coastal zone. A case study: Gdynia, Poland (Southern Baltic Sea). Environ. Sci. Pollut. Res. 2013, 20, 4154–4163. [Google Scholar] [CrossRef] [Green Version]
  36. Przybyła, C.; Kozdrój, P.; Sojka, M. Wykorzystanie wielowymiarowych metod statystycznych w analizie stanu fizykochemicznego wód w systemie rzeka—Zbiornik retencyjny na przykładzie zbiorników retencyjnych Pakosław i Jutrosin położonych w zlewni rzeki Orli. Rocz. Ochr. Sr. 2015, 17, 1125–1141. [Google Scholar]
  37. Banda, T.D.; Kumarasamy, M. Application of Multivariate Statistical Analysis in the Development of a Surrogate Water Quality Index (WQI) for South African Watersheds. Water 2020, 12, 1584. [Google Scholar] [CrossRef]
  38. Wei, M.; Li, M.; Xu, C.; Xu, P.; Liu, H. Pollution characteristics of bioaerosols in PM2.5 during the winter heating season in a coastal city of northern China. Environ. Sci. Pollut. Res. 2020, 27, 27750–27761. [Google Scholar] [CrossRef]
  39. Liu, J.; Zhang, D.; Tang, Q.; Xu, H.; Huang, S.; Shang, D.; Liu, R. Water quality assessment and source identification of the Shuangji River (China) using multivariate statistical methods. PLoS ONE 2021, 16, e0245525. [Google Scholar]
  40. Stanisz, A. Przystępny Kurs Statystyki z Zastosowaniem Statistica PL na Przykładach z Medycyny: Analizy Wielowymiarowe, 2nd ed.; StatSoft Polska: Kraków, Poland, 2007; pp. 5–293. [Google Scholar]
  41. Jolliffe, I.T.; Cadima, J. Principal component analysis: A review and recent developments. Phil. Trans. R. Soc. A 2016, 374, 20150202. [Google Scholar] [CrossRef]
  42. Käärik, A.; Keller, J.; Kiffer, E.; Perreau, J.; Reisinger, O.; Nilsson, S. Atlas of Airborne Fungal Spores in Europe, 1st ed.; Springer: Berlin, Germany, 1983. [Google Scholar]
  43. Campbell, C.K.; Johnson, E.M.; Warnock, D.W. Identification of Pathogenic Fungi; Wiley-Blackwell: Hoboken, NJ, USA, 2013. [Google Scholar]
  44. Feller, W. An Introduction to Probability Theory and Its Applications; John Wiley and Sous Inc.: Hoboken, NJ, USA, 1950; Volume II. [Google Scholar]
  45. R Core Team. R: A Language and Environment for Statistical Computing; R Foundation for Statistical Computing: Vienna, Austria, 2018; Available online: https://www.R-project.org/ (accessed on 31 July 2021).
  46. Friendly, M.; Turner, H.; Zeileis, A.; Murdoch, D.; Firth, D. vcdExtra: “vcd” Extensions and Additions; R Package Version 0.7–1; R Package: Vienna, Austria, 2017; Available online: https://cran.r-project.org/package=vcdExtra%0A%0A (accessed on 13 June 2018).
  47. Hothorn, T.; Hornik, K.; van de Wiel, M.A.; Zeileis, A. Implementing a class of permutation tests The coin package. J. Stat. Softw. 2008, 28, 13794. [Google Scholar] [CrossRef]
  48. Sojka, M.; Siepak, M.; Gnojska, E. Ocena zawartości metali ciężkich w osadach dennych wstępnej części zbiornika retencyjnego Stare Miasto na rzece Powie. Rocz. Ochr. Sr. 2013, 15, 1916–1928. [Google Scholar]
  49. Gałęzowska, G.; Rogowska, J.; Olkowska, E.; Ratajczyk, W.; Wolska, L. Environmental Risk Assessment Resulting from Sediment Contamination with Perfluoroalkyl Substances. Molecules 2020, 26, 116. [Google Scholar] [CrossRef]
  50. Levei, L.; Hoaghia, M.-A.; Roman, M.; Marmureanu, L.; Moisa, C.; Levei, E.A.; Ozunu, A.; Cadar, O. Temporal Trend of PM10 and Associated Human Health Risk over the Past Decade in Cluj-Napoca City, Romania. Appl. Sci. 2020, 10, 5331. [Google Scholar] [CrossRef]
  51. Egbuta, M.A.; Mwanza, M.; Babalola, O.O. Health Risks Associated with Exposure to Filamentous Fungi. Int. J. Environ. Res. Public Health 2017, 14, 719. [Google Scholar] [CrossRef] [PubMed] [Green Version]
  52. Smilanick, J.L.; Mansour, M.F. Influence of temperature and humidity on survival of Penicillium digitatum and Geotrichum citri-aurantii. Plant Dis. 2007, 91, 990–996. [Google Scholar] [CrossRef] [Green Version]
  53. Rodrigez-Rajo, F.; Iglesias, I.; Jato, V. Variation assessment of airborne Alternaria and Cladosporium spores at different bioclimatical conditions. Mycol. Res. 2005, 109, 497–507. [Google Scholar] [CrossRef]
  54. Quintero, E.; Rivera-Merani, F.; Bolaños, B. Analysis of environmental factors and their effects on fungal spores in the atmosphere of a tropical urban area (San Juan, Puerto Rico). Aerobiología 2010, 26, 113–124. [Google Scholar] [CrossRef]
  55. Haskouri, F.E.; Bouziane, H.; del Mar Trigo, M.; Kadiri, M.; Kazzaz, M. Airborne ascospores in Tetouan (NW Morocco) and meteorological parameters. Aerobiologia 2016, 32, 669–681. [Google Scholar] [CrossRef]
Figure 1. The map shows the sampling points in 5 coastal towns, Hel, Puck, Gdynia, Sopot, Gdańsk-Brzeźno, on the Gulf of Gdańsk.
Symmetry 13 01522 g001
Figure 2. The relationship between the number of mold fungi in air of the coastal towns (Hel, Puck, Gdynia, Sopot, Gdańsk-Brzeźno) in 2014–2017 vs. 2018. The blue color indicates that the observed value is higher than the expected value if the data were random. The red color specifies that the observed value is lower than the expected value if the data were random. The grey color represents the data where the concentrations are similar to observations under the null hypothesis where a test of independence is true.
Symmetry 13 01522 g002
Figure 3. The relationship between the number of mold fungi Aspergillus sp. in air of the coastal towns (Hel, Puck, Gdynia, Sopot, Gdańsk-Brzeźno) in 2014–2017 vs. 2018 was presented using the contingency tables. The blue color indicates that the observed value is higher than the expected value if the data were random. The red color specifies that the observed value is lower than the expected value if the data were random. The grey color represents the data where the concentrations are similar to observations under the null hypothesis where a test of independence is true.
Symmetry 13 01522 g003
Figure 4. The relationship between the number of mold fungi Penicillium sp. in air of the coastal towns (Hel, Puck, Gdynia, Sopot, Gdańsk-Brzeźno) in 2014–2017 vs. 2018 was presented using the contingency tables. The blue color indicates that the observed value is higher than the expected value if the data were random. The red color specifies that the observed value is lower than the expected value if the data were random. The grey color represents the data where the concentrations are similar to observations under the null hypothesis where a test of independence is true.
Symmetry 13 01522 g004
Figure 5. The relationship between the number of mold fungi Cladosporium sp. in air of the coastal towns (Hel, Puck, Gdynia, Sopot, Gdańsk-Brzeźno) in 2014–2017 vs. 2018. The blue color indicates that the observed value is higher than the expected value if the data were random. The red color specifies that the observed value is lower than the expected value if the data were random. The grey color represents the data where the concentrations are similar to observations under the null hypothesis where a test of independence is true.
Symmetry 13 01522 g005
Table 1. The number of molds and yeast-like fungi (CFU/m3) in the air of coastal towns in the Gulf of Gdańsk in the years 2014–2017 and 2018.
The Number of Molds and Yeast-Like Fungi (CFU/m3) in the Seaside Air over the Gulf of Gdańsk
Location2014–20172018p-Value
Hel17 ± 19
12 (0–66) a
260 ± 494
20 (0–1000) a
>0.05
Puck36 ± 18
(8–60) a
194 ± 90
(105–285) a
Gdynia34 ± 35
18 (2–100) a
0.00
Sopot16 ± 8
(6–22) a
228 ± 195
(48–661) a
Gdańsk-Brzeźno20 ± 10
(2–42) a
205 ± 180
(32–511) a
a—the results are presented as mean ± SD; in case of a higher standard deviation than the mean, the median and range (min-max) were calculated.
Publisher’s Note: MDPI stays neutral with regard to jurisdictional claims in published maps and institutional affiliations.

