Article

Automatic Unsupervised Texture Recognition Framework Using Anisotropic Diffusion-Based Multi-Scale Analysis and Weight-Connected Graph Clustering

Institute of Computer Science, Romanian Academy—Iași Branch, 700481 Iași, Romania
Symmetry 2021, 13(6), 925; https://doi.org/10.3390/sym13060925
Submission received: 10 May 2021 / Revised: 17 May 2021 / Accepted: 21 May 2021 / Published: 23 May 2021
(This article belongs to the Special Issue Graph Algorithms and Graph Theory)

Abstract

:
A novel unsupervised texture classification technique is proposed in this research work. The proposed method clusters automatically the textures of an image collection in similarity classes whose number is not a priori known. A nonlinear diffusion-based multi-scale texture analysis approach is introduced first. It creates an effective scale-space by using a well-posed anisotropic diffusion filtering model that is proposed and approximated numerically here. A feature extraction process using a bank of circularly symmetric 2D filters is applied at each scale, then a rotation-invariant texture feature vector is achieved for the current image by combining the feature vectors computed at all these scales. Next, a weighted similarity graph, whose vertices correspond to the texture feature vectors and the weights of its edges are obtained from the distances computed between these vectors, is created. A novel weighted graph clustering technique is then applied to this similarity graph, to determine the texture classes. Numerical simulations and method comparisons illustrating the effectiveness of the described framework are also discussed in this work.

1. Introduction

The image textures represent sets of primitives, known as texels, in some regular or repeated patterns. Texture analysis is an important and still challenging image analysis field that include various sub-domains, such as texture recognition, segmentation, synthesis and retrieval. It has been applied in some well-known image processing and computer vision domains, such as image and video object detection, recognition and tracking, image and video indexing and retrieval, medical imaging, remote sensing and product quality diagnosis.
A texture recognition process consists of texture feature extraction and texture categories classification. The texture feature extraction methods could be divided into statistics-based, structure-based, model-based and transformation-based schemes. The statistical techniques include histogram-based approaches [1], moment-based algorithms [2], Gray Level Co-occurrence Matrices (GLCM) [3,4], Binary Gabor Patterns (BGP) [5], Local Binary Patterns (LBP) [6] and energy variation-based approaches [7]. The structural techniques include edge-based methods [8], morphological operators [9] and SIFT descriptors [10]. The model-based techniques include fractal texture models [11], Markov random field texture models [12] and auto-regressive models [13], while the transformation-based schemes include texture-featuring algorithms using 2D Gabor filters [14], 2D Wavelet transforms [15], Gabor Wavelets [16] and Curvelet transforms [17]. Other feature extraction approaches combine these texture descriptors [18].
The texture recognition may have either a supervised or an unsupervised character, depending on the character of its classification process. Hence, the supervised machine learning algorithms that can be applied to the texture classification task include the minimum distance classifier, K-Nearest Neighbor (K-NN), Artificial Neural Networks (ANN), Support Vector Machines (SVM) and Hidden Markov Models (HMMs) [19].
The unsupervised classification methods include the well-known K-means, hierarchical clustering, Self-Organizing Maps (SOM) and Dynamic Time Warping (DTW) techniques [19]. Additionally, the deep learning models and graph clustering algorithms represent effective unsupervised classification solutions that can be applied successfully to texture recognition [20,21,22].
A graph clustering-based unsupervised texture recognition framework, which can be applied successfully in the texture indexing and retrieval domain, is also proposed in this article. Its feature extraction component is based on a partial differential equation (PDE)-based multi-scale image analysis approach that is more effective than single-scale and Gaussian filter-based multi-scale texture analysis schemes. Thus, the scale-space is created by applying the finite difference-based approximation algorithm that solves numerically the well-posed nonlinear fourth-order anisotropic diffusion model introduced in the following section.
Next, the texture recognition process is described in the third section. A texture feature extraction process is performed at each scale and the final texture descriptor is achieved by concatenating the feature vectors computed at multiple scales. Since these vectors are modeled using a combination of circularly symmetric 2D filters, the final texture feature vector provides a rotation-invariant texture recognition. The second stage of this unsupervised recognition procedure represents a graph clustering-based texture classification process. The graph clustering algorithms have been used successfully in a closely related field, namely texture segmentation [23]. Here, we use the graph theory to develop a novel texture feature vector clustering approach that does not make any prior assumptions on the number of the clusters. Thus, a similarity graph is constructed for the set of image textures to be classified. Its vertices correspond to their feature vectors, while its edges are weighted with some similarity values that are related to the distances between those vectors. Then, a weighted graph connectivity-based clustering technique inspired by the Highly Connected Subgraphs (HCS) clustering algorithm is applied to this similarity graph, in order to detect the texture classes.
Some texture recognition simulations and method comparisons that illustrate the effectiveness of the proposed technique are described in the fourth section. The fifth section is dedicated to the main conclusions of this research work that ends with a section of references.

2. Nonlinear Anisotropic Diffusion-Based Model for Multi-Scale Analysis

The texture recognition technique proposed here uses a multi-scale image analysis based on nonlinear anisotropic diffusion. The multi-scale and multi-resolution analysis techniques have been used successfully in various image analysis areas, since they provide much better results than the traditional mono-scale approaches.
While many multi-scale texture analysis methods use scale spaces based on 2D Gaussian kernels [24], we create here a more effective scale-space representation by using a nonlinear PDE-based filtering model that combines second- and fourth-order anisotropic diffusions. The proposed fourth-order PDE model is described in the following subsection and its numerical approximation scheme, which is further used in the scale-space creation process, is presented in Section 2.2.

2.1. A Combined Fourth-Order PDE-Based Filtering Model

We have performed a lot of research in the PDE-based image processing and analysis field in the last decade, developing numerous PDE and variational models for image restoration and inpainting [25], segmentation [26] and compression [27] and video processing [28]. Now, we consider a nonlinear parabolic fourth-order partial differential equation-based model that combines second and fourth order anisotropic diffusions, for the multi-scale texture analysis. It is composed of the next PDE and some boundary conditions:
u t + α φ u 2 ψ Δ u σ 2 u β φ Δ u d i v ψ u σ u + λ u u 0 = 0 u 0 , x , y = u 0 x , y , x , y Ω u t , x , y = 0 , x , y Ω ;  
where α , β 0.5 , 1.5 , λ 0 , 0.2 , Ω R 2 is the image domain, the observed image is u 0 L 2 Ω and u σ = u K σ , where K σ x , y = 1 2 π σ 2 e x 2 + y 2 2 σ 2 , represents a 2D Gaussian filter kernel.
We consider the following diffusivity function, which is properly chosen for an efficient filtering [25], being positive, monotonic decreasing and convergent to 0, for both diffusion components of the PDE-based model (1):
ψ : 0 , 0 , : ψ s = γ η ξ s 2 + δ 1 3
where ξ 0 , 1 , δ 5 , γ 1 and η 10 .
The terms φ u and φ Δ u in (1) have been introduced to control the speed of the fourth-order and second-order diffusion processes. The positive function used by both of them has the next form:
φ : 0 , 0 , :   φ s = ν ζ s τ + ε 1 τ + 1
where ε , ζ 1 , 4 , ν 1 , 1.5 and τ 0 , 1 .
Since this compound PDE-based model (1) combines nonlinear second- and fourth-order diffusion-based components, it would enjoy the filtering advantages of both of them. Hence, the second-order PDE-based term assures that the diffusion process is performed along the gradient direction [25], which means the undesired blurring effect is avoided and the essential image features are preserved. The fourth-order diffusion term provides more natural restored images and overcomes the unintended staircasing. The behavior of this system is controlled by varying the α , β coefficient values. Hence, it provides a better deblurring when β is increased and α is decreased, and a better staircase effect removal otherwise.
Additionally, the proposed nonlinear PDE model combines the anisotropic diffusion with a 2D Gaussian filter kernel to achieve a more effective additive Gaussian noise (AWGN) removal, which works properly in noisy conditions too. This fourth-order nonlinear diffusion-based model has a non-variational character, since it cannot be obtained from the minimization of an energy functional. It is also well-posed, since there exists a unique variational, or weak, solution, for it. That solution is computed numerically by using a stable approximation scheme of (1) that converges to it. This discretization algorithm that solves numerically the differential model and is applied in the scale-space creation process is presented in the following subsection.

2.2. Finite Difference-Based Numerical Approximation Algorithm

The proposed fourth-order nonlinear diffusion-based filtering model is solved numerically by applying a finite difference-based numerical approximation algorithm [29]. Thus, the space and the time coordinates will be quantized as following: x = i h , y = j h , i 1 , , I , j 1 , , J and t = n Δ t , n 0 , , N , where h is the space siz, Δ t represents the time step of the considered grid and I h × J h is the support image’s dimension. Thus, the nonlinear fourth-order equation in (1) can be expressed as:
u t + λ u u 0 = β φ Δ u x ψ u σ u x + y ψ u σ u y α φ u 2 ψ Δ u σ 2 u
The left component in (4) is discretized using the central finite differences [29], as follows:
u i , j n + Δ t u i , j n Δ t + λ u i , j n u i , j 0 = u i , j n + Δ t 1 Δ t + u i , j n α 1 Δ t u i , j 0 λ
Then, the right term of (4) is approximated. The component α φ u is approximated as α φ u i , j , and one also computes ψ i , j = ψ K σ u i , j , where u i , j = u i + h , j u i h , j 2 h 2 + u i , j + h u i , j h 2 h 2 . Then, x ψ u σ u x is discretized spatially as ψ i + h 2 , j K σ u i + h , j K σ u i , j ψ i h 2 , j K σ u i , j K σ u i h , j and y ψ u σ u y is approximated as ψ i , j + h 2 K σ u i , j + h K σ u i , j ψ i , j h 2 K σ u i , j K σ u i , j h , where:
ψ i ± h 2 , j = ψ i ± h , j + ψ i , j 2 , ψ i , j ± h 2 = ψ i , j ± h + ψ i , j 2
Next, the fourth-order diffusion term 2 ψ Δ u σ 2 u is discretized using the finite difference-based Laplacian approximation [29] as:
Δ ψ i , j = ψ i + h , j + ψ i h , j + ψ i , j + h + ψ i , j h 4 ψ i , j h 2
where ψ i , j = ψ Δ G σ u i , j 2 u i , j and Δ u i , j = 2 u i , j = u i + h , j n + u i h , j n + u i , j + h n + u i , j h n 4 u i , j h 2 .
The other Laplacian-based term, β φ Δ u , is approximated as β Δ u i , j .
We may consider here the parameter values h = Δ t = 1 . Then, by using all the above finite difference-based approximation results, the next explicit iterative numerical approximation algorithm is obtained:
u i , j n + 1 = u i , j n 1 λ + u i , j 0 λ α φ u i , j ψ i + 1 , j + ψ i 1 , j + ψ i , j + 1 + ψ i , j 1 4 ψ i , j + β Δ u i , j ψ i + 1 2 , j K σ u i + 1 , j n K σ u i , j n ψ i h 2 , j K σ u i , j n K σ u i 1 , j n + ψ i , j + 1 2 K σ u i , j + 1 n K σ u i , j n ψ i , j 1 2 K σ u i , j n K σ u i , j 1 n
The numerical approximation scheme (8) is stable and consistent to the fourth-order anisotropic diffusion-based model (1) and converges in N iterations to its weak solution that represents the filtering output. This numerical procedure that solves the nonlinear PDE-based model has a polynomial time complexity and has been successfully used to create the effective scale-space representation for texture analysis that is detailed in the following section.

3. Unsupervised Multi-Scale Texture Recognition Technique

The following unsupervised texture recognition task is considered here: the image textures from the set T = T 1 , , T M must be grouped automatically in similarity classes whose number is not a priori known, on the basis of their extracted characteristics. Additionally, one supposes there are no isolated textures in this set, which means that for each texture, there is at least another texture from T that is similar to it.
The novel texture recognition framework developed here uses the described anisotropic diffusion-based model and a graph theory-based clustering scheme. Thus, a multi-scale texture feature extraction approach that uses a scale-space created by applying the numerical approximation scheme described in the previous section is proposed first, in the next subsection. Then, an automatic unsupervised texture feature vector classification method that is based on a new graph clustering algorithm is described in Section 3.2.

3.1. Multi-Scale Texture Feature Extraction Approach

The numerical characteristics of each texture T i , where i 1 , , M , are extracted using an effective multi-scale texture feature extraction technique. First, the proposed approach constructs a proper scale-space representation by applying the nonlinear PDE-based filter (1) on that image texture until various moments of time t, and differencing the successive filtered textures.
Thus, the finite difference-based numerical approximation algorithm (8) is applied on the current texture that becomes the discrete observed image, u 0 = T i . One considers the filtering output achieved by (8) at the iteration moments 4k, where k 0 , , S , S 3 . Then, the absolute differences between consecutive filtering results are computed and a scale-space representation with S scales is obtained as u 0 u 4 , u 4 u 8 , , u 4 S 1 u 4 S .
The image at each scale r 1 , , S is denoted U r = u 4 r 1 u 4 r and represents the textural component of the PDE-based decomposition of u 4 r 1 . It contains some contours of T i . A feature extraction process is then performed on U r by combining some two-dimension circular filters. These filtering models that we consider for this task are inspired by those using a 2D Gabor function that is modified into a circularly symmetric version [30]. Because of their rotation-invariant character, the circularly symmetric Gabor filters provide a more performant texture analysis than the traditional Gabor filters [30]. Similarly, the frequency response of the considered 2D band-pass circularly symmetric filter is modeled as:
F σ ω x , ω y = e ω x 2 + ω y 2 π σ μ σ 2 2
where π σ represents the central frequency and the product of the mean and standard deviation, and μσ represents the filter bandwidth [31].
Hence, a bank of Q filters with circular frequency responses provided by (9) is applied to U r . Each of these 2D filters is characterized by a standard deviation value σ = υ q , q 1 , , Q , where υ > 1. Some proper values for the mean μ and the parameter υ were selected in order to provide optimal texture analysis results. The image at each rth scale, U r , is mean-normalized first and next convolved to each 2D circular filter of that set. The L2 norm of each filtered image is then computed. Hence, a Q-dimensional feature vector composed of these norm values, V U r , is obtained at each scale. Then, the final texture feature vector of the observed image (current texture) is determined by concatenating the feature vectors computed at multiple scales of the scale-space, as follows:
V T i = V u 0 : = V U 1   V U 2     V U S
The QS-dimensional feature vector given by (10) represents a noise-insensitive invariant texture descriptor. Given the anisotropic diffusion-based denoising model its multi-scale creation is based on, it works properly in both clean and noisy conditions, and, because of the 2D circular filters used in its construction, it describes properly both normal and rotated textures.

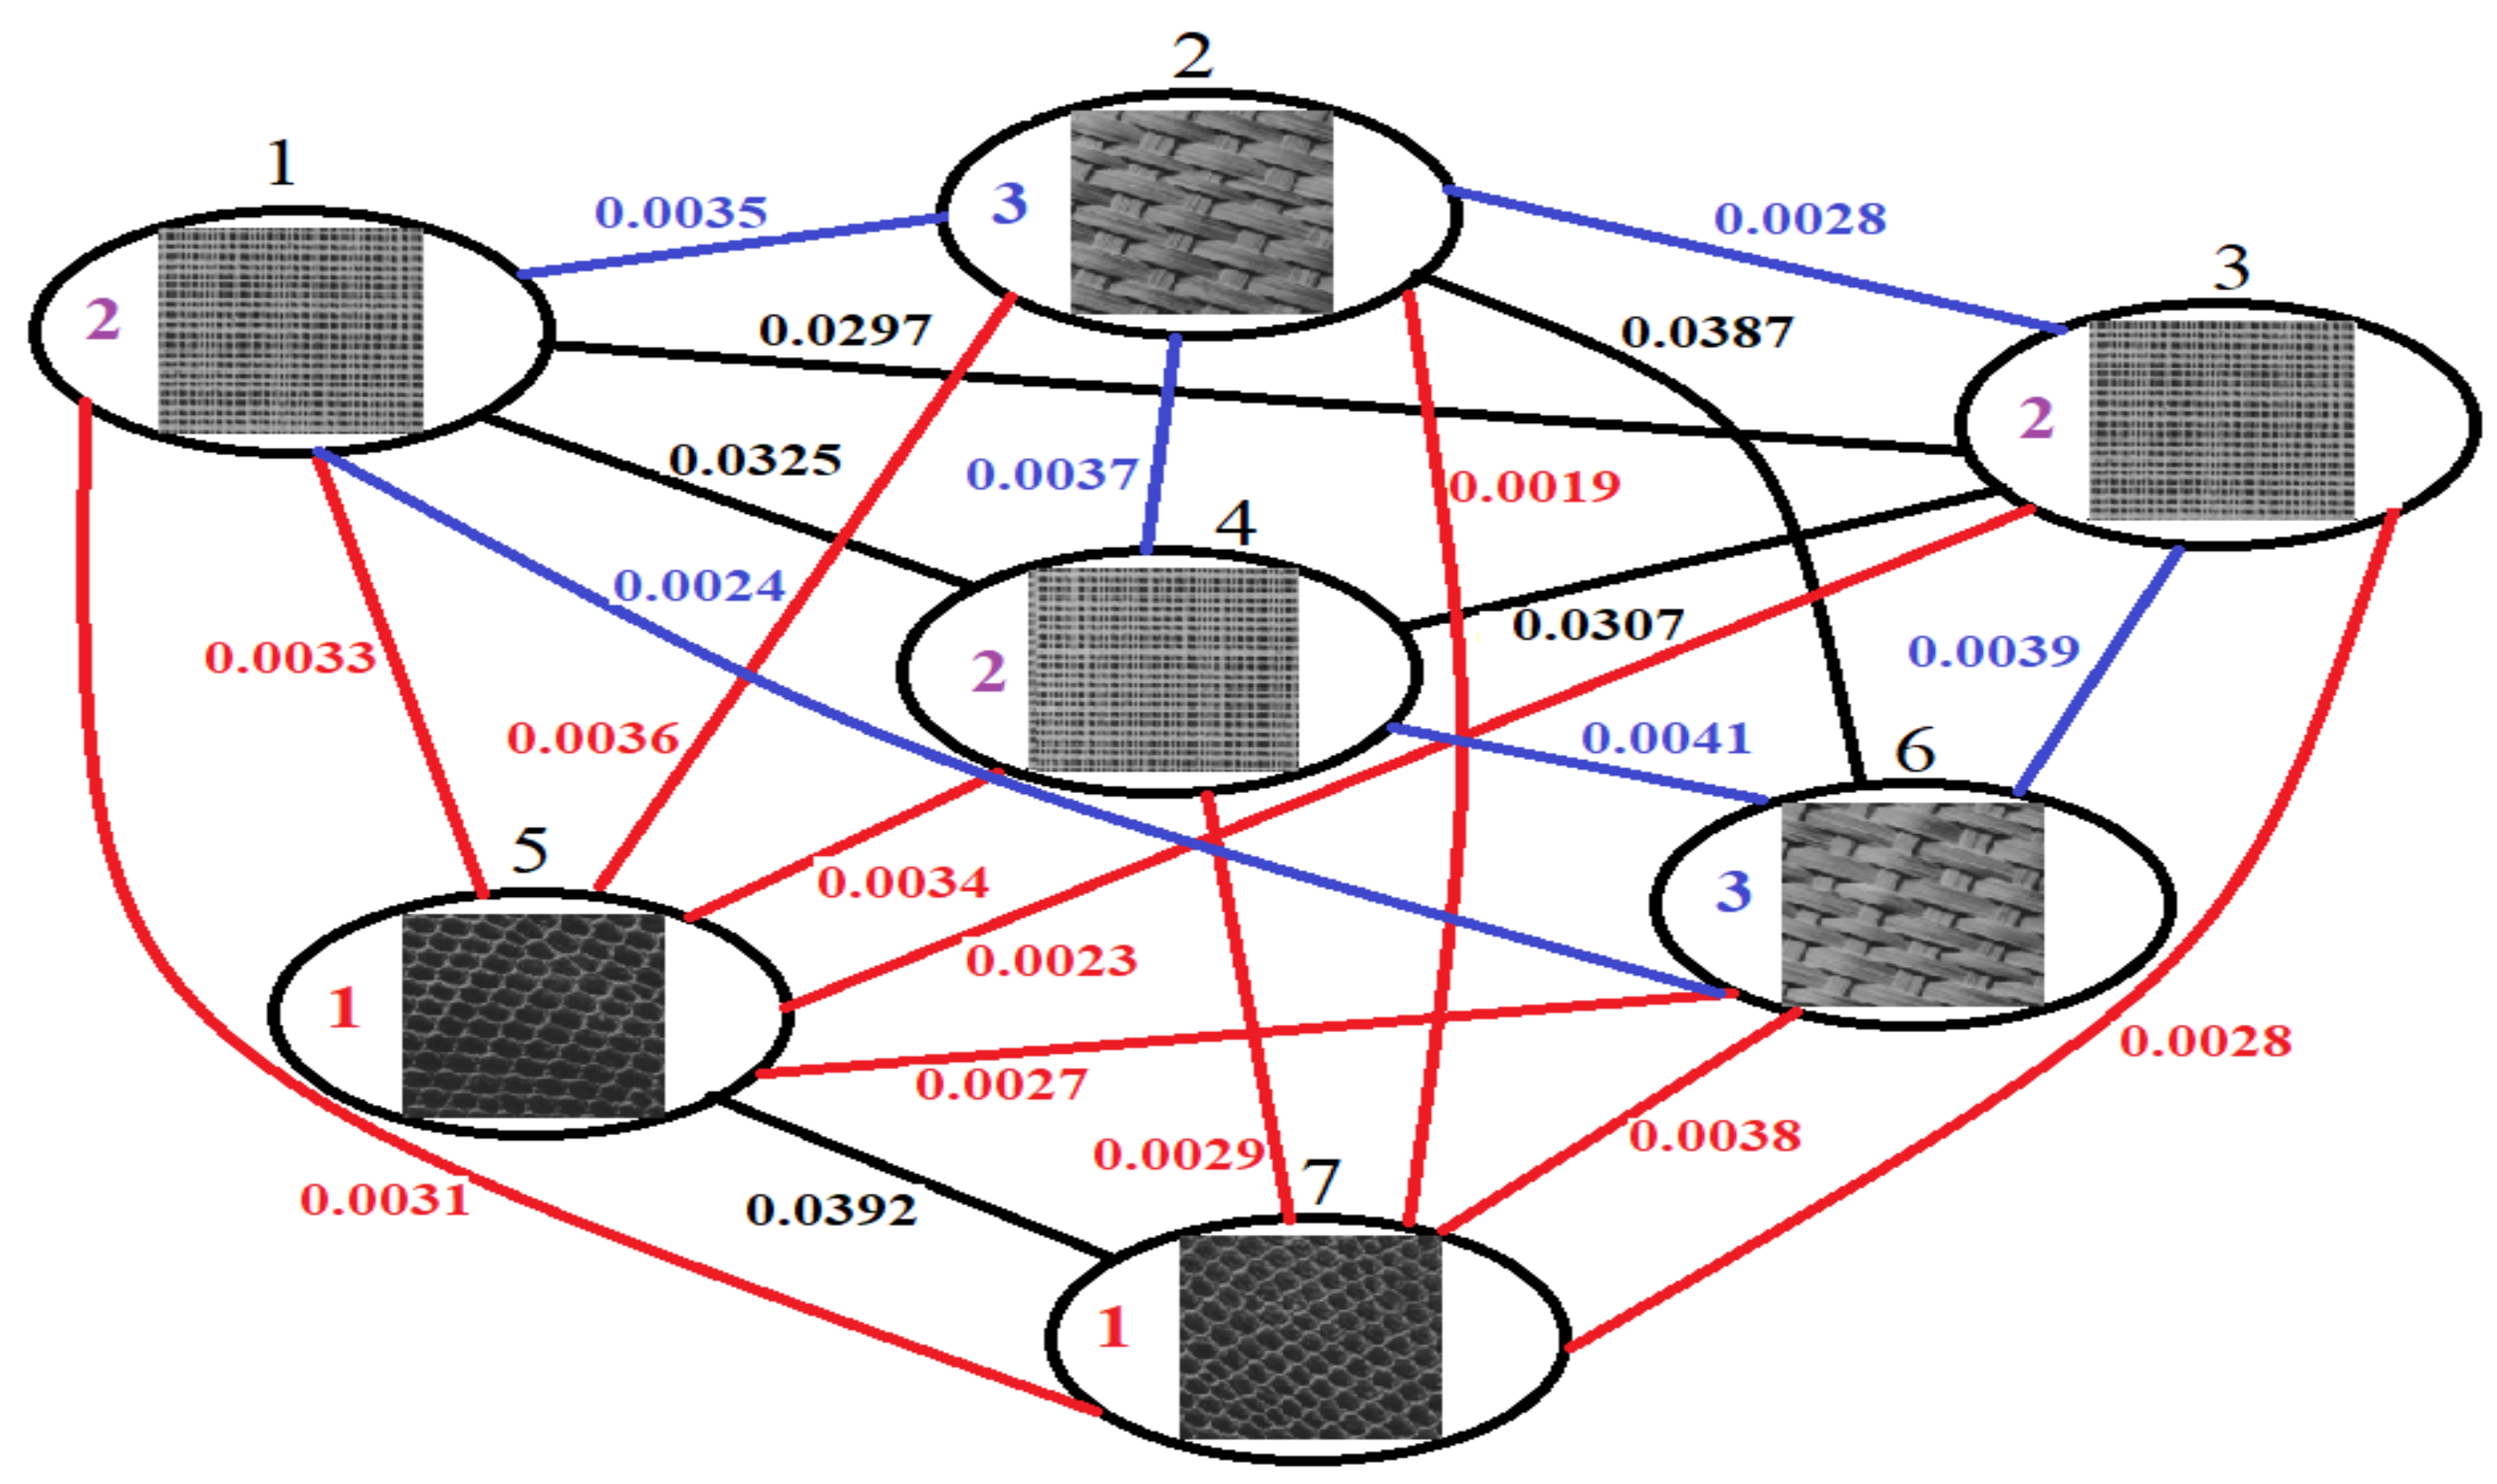
3.2. Graph Clustering-Based Automatic Texture Feature Vector Classification Technique

The invariant texture feature vector set determined in the previous subsection, V T 1 , , V T M , has to be clustered automatically into an unknown number of similarity classes. We have performed some research in the unsupervised machine learning domain. Several effective unsupervised classification techniques have been introduced in our past works [32,33]. They could be applied in this texture feature vector clustering case, but here we propose a more performant automatic unsupervised feature vector classification algorithm that uses the graph theory [34], to solve this task.
The graph theory has been successfully applied in the data clustering domain, since the similarity could be expressed easily by a graph. Clustering with graphs means considering the entire clustering problem as a graph, whose vertices represent the entities to be classified, and the weights of its edges are related to the distances between those entities. A graph clustering algorithm separates the sparsely connected dense subgraphs from each other. The entities within a cluster are connected to each other but have no connection to those outside the cluster.
Hence, various graph-based cluster models have been developed in the last decades. Some clustering algorithms, such as the HCS scheme, are based on graph connectivity [35], while other graph clustering approaches represent SOM extensions for graph-based clustering [36], random walk-based clustering algorithms [37], Function-Described Graph (FDG)-based clustering methods [38], tree-based clustering solutions [39], graph-based K-means clustering models [40], spectral clustering approaches [41], Graph Neural Networks [42] and the signed-graph clustering schemes [43].
The graph clustering techniques have been successfully applied in some important domains, such as image segmentation, content-based image retrieval, computer vision, network routing and analysis of social networks. The texture segmentation field, which is closely related to the texture recognition area, has been approached successfully using graph-based clustering algorithms [23]. Here, we consider such a graph clustering solution for unsupervised texture recognition.
Thus, the proposed technique creates a similarity-weighted graph for our texture feature vector set, first. Then, a graph connectivity-based clustering algorithm is proposed and applied to the undirected weighted graph.
Therefore, let us consider G = V , E , an undirected graph whose vertex set V contains M vertices, or nodes, corresponding to the textures T i , or their V T i feature vectors, and E V × V represents its set of undirected linking edges. Then, these edges are weighted with some node similarity values.
The similarity of two vertices of V is inversely proportional to the value of the distance between the feature vectors corresponding to them. Therefore, one computes all the distances between the texture feature vectors and defines the following weighting function for G:
w : E R ,   w i j = w i , j = 1 d V T i , V T j , i , j 1 , , M , i j
where d represent the Euclidian distance, but some other metrics could be applied here as well.
By assigning these w i j weights to E, one obtains a fully connected similarity-weighted graph G, since any two nodes of the vertex set V are linked by a weighted edge in its structure. Since the texture feature vectors computed by (10) represent powerful texture descriptors, the distances between feature vectors of textures from the same similarity class have much lower values than the distances between feature vectors of textures belonging to different classes. Obviously, that means the weights corresponding to nodes of the same cluster are much higher than the weights of the edges linking nodes of different graph clusters. Therefore, we have:
i , j 1 , , M : min C ( i ) C ( j ) d V T i , V T j max C ( i ) = C ( j ) d V T i , V T j max C ( i ) C ( j ) w i j min C ( i ) = C ( j ) w i j
where C (i) returns the index of the similarity class (cluster) where the texture T i should be inserted.
Next, a weighted graph partitioning process will be performed on G. Thus, we propose a novel connectivity-based clustering technique adapted for undirected weighted graphs, which is inspired by the Highly Connected Subgraphs (HCS) clustering algorithm [34].
The HCS method searches for highly connected subgraphs, by using the minimum cut of the graph. Hence, it checks if the graph G is highly connected, which means its total edge connectivity (minimum number of edges whose deletion from a graph disconnects it) satisfies the property k G > V 2 , where V represents the cardinal of the vertex set. If so, the algorithm returns that graph, otherwise it partitions the graph into two subgraphs, by using its minimum cut, then applies recursively on them.
The weighted graph clustering algorithm proposed for our partitioning task does not search for highly connected graphs in the classical sense, since G is even fully connected. It will search for highly weight-connected graphs, a term that we define here. While a highly connected graph has very few missing edges, a highly weight-connected graph should be characterized by very few low-weight edges, preferably none. Given the graph weight property given by (12) and the definition of T, we may introduce an even stronger condition for this type of graph, which says that the lowest weight of an edge cannot be much lower than the highest weight of an edge of that graph. Hence, we may define a highly weight-connected graph as a weighted fully connected graph having the property:
min w i j max w i j κ , i , j 1 , , M , i j
where κ 0.5 , 1 represents a properly selected threshold that must be exceeded by the ratio between the minimum and maximum values of the weighted adjacency matrix of G.
Therefore, the proposed algorithm returns G as clustering output if the graph satisfies the property (12). Otherwise, it divides G into the subgraphs G 1 and G 2 , by applying the minimum cut of this weighted graph.
While the HCS-based clustering approach determines the minimum cut as the minimum set of edges without which the graph will become disconnected, our weight-based graph clustering algorithm computes the minimum cut of G as the minimum sum of weights of edges that when removed from G, divides it into two subgraphs. The minimum cut of this weighted graph is determined by applying the Max-Flow/Min-Cut Theorem that states that the amount of the maximum flow through any network from a given source to a given sink is equal to the weight of the minimum cut. Therefore, one could find the minimum cut of the graph by calculating the network’s maximum flow, using the Ford–Fulkerson (FFA) algorithm [44].
Next, this weighted graph clustering procedure is executed recursively on G 1 and G 2 . Thus, it determines all the subgraphs of the similarity graph G that satisfy the condition (13). These highly weight-connected subgraphs determine the similarity clusters of the vertex set, V . Each time such a subgraph is detected by the recursive scheme, all its vertices are labeled with its index. For example, the vertices v 1 , , v p V of the ith detected subgraph are labeled as C v 1 = = C v p : = i . The detected graph node clusters represent the unsupervised texture classification, since the vertices of each cluster represent similar textures, or closed feature vectors. The final texture recognition result can be expressed as {C(1), …, C(M)}. The time complexity of this clustering procedure is bounded by 2 C f V , E , where the number of detected classes C = c a r d C ( 1 ) , , C ( M ) , and f V , E , representing the time complexity of determining a minimum cut of the graph G, is bounded by an O V E 2 execution time.
The weight-connected graph-based texture clustering technique proposed here outperforms other unsupervised classification approaches that can be applied to texture analysis, such as the K-means model, SOM and the hierarchical agglomerative or divisive clustering algorithms [18]. Its main advantage over them is that it does not require any prior knowledge about the optimal number of texture clusters.
A simple unsupervised weighted graph-based texture classification example is described in Figure 1. The seven texture images to be recognized are displayed in the numbered nodes of a weighted graph. The graph does not satisfy (13), so the proposed clustering approach disconnects it by detecting the minimum cut that is represented by the red edges and has a maximum flow (sum of red weights) of 0.0298. The subgraph composed of nodes 5 and 7 is highly weight-connected, so it represents the first cluster. The other subgraph is not, so it is divided by the next minimum cut, marked by blue edges and having a maximum flow of 0.0204. The obtained subgraphs, composed of nodes {1, 3, 4} and {2, 6}, are highly weight-connected, so they represent the second and the third similarity clusters. The cluster number is displayed in red, blue or purple inside each vertex. Hence, three clusters are obtained and the texture classification result is [2 3 2 3 1 3 1].

4. Discussion

The automatic graph clustering-based unsupervised texture recognition technique proposed here was tested successfully on thousands of images from various texture databases. Some important and voluminous texture collections, such as the Kylberg database [45] and the Brodatz album [46], were used in our texture recognition experiments.
These texture recognition tests were conducted on an Intel (R) Core (TM) i7-6700HQ CPU 2.60 GHz processor on 64 bits that operated Windows 10. We determined empirically the parameters of the proposed framework that provide optimal recognition output, applying the trial and error method. Those optimal parameter values are the following: the number of scales S = 4, the number of circular filters Q = 6, the mean μ = 1.4 , υ = 1.2 and the graph-related threshold κ = 0.66 .
The experiments were performed on numerous textures, rotated at various orientations, from the mentioned databases. Thus, we considered 16 texture classes from each database, which are displayed in Figure 2. Each texture category of the Brodatz collection contains 25 [128 × 128] textures for each of the orientations: 0°, 20°, 30°, 45°, 60°, 70°, 90° and 120°. Each texture category of the Kylberg database contains 20 [576 × 576] textures for each of those angles.
Various forms of the texture set T were created using these texture datasets. A large texture set, characterized by a high |T| = M value, would lead to a high execution time, because of the high computational complexity of the proposed framework. Hence, most of our experiments used testing sets with the number of textures M < 100 and containing images of various orientations and from various texture categories of the mentioned databases.
The described method properly classifies textures rotated by any angle, because of its rotation-invariant multi-scale texture feature extraction approach. It achieves a high texture recognition rate, its effectiveness being assessed by using several performance metrics, such as precision, recall, F1 score and accuracy [47]. Our technique obtains high values of these measures that are adapted for pairs of data points, since it produces very few misclassifications representing false positives and negatives.
Method comparisons were also performed. This texture recognition framework outperforms many existing mono- and multi-scale unsupervised recognition techniques, such as those using texture features based on image moments [2], LBP [4], GLCM [3], circular 2D Gabor filters [30] and Gabor Wavelet Transforms [16] in combination with K-means, SOM or hierarchical clustering schemes, in both clean and noisy conditions. Both the nonlinear anisotropic diffusion-based multi-scale texture feature extraction approach and the weighted graph-based texture clustering solution proposed here provide better results than other texture analysis and classification methods, as shown by the performance metrics values displayed in Table 1. The proposed approach achieves higher precision, recall, F1 and accuracy scores than the methods using the mentioned features with K-means or hierarchical agglomerative clustering schemes.
We also calculated and included in this table the performance measure values obtained by the PDE-based multi-scale texture feature extraction proposed here in combination with the two clustering algorithms, in order to assess our feature extraction and graph clustering techniques. As it results from Table 1, the two combinations achieve performance metric values that are somewhat lower than those of the described recognition framework, but higher than those of the other texture analysis models. That means our multi-scale feature extraction technique provides better texture descriptors than moment-based, LBP-based, GLCM-based and multi-scale circularly symmetric 2D Gabor filter-based featuring methods. The moment-based method tested here uses sequences of nine invariant area moments as feature vectors; the LBP-based approach uses a number of neighbors of eight and radius values from 1 to 5; the GLCM-based scheme uses eight offsets; and the circularly symmetric Gabor filters use center frequencies F, taking values from 2 to 8. Only the multi-scale 2D Gabor Wavelet-based feature extraction approach gets slightly better values than our featuring scheme when applied with those clustering models.
The values from that table also mean that the weighted graph-based texture clustering technique proposed here represents a better unsupervised texture classification solution than K-means and hierarchical agglomerative clustering schemes. Unlike our fully automatic graph clustering algorithm, those clustering models (and many others also) require knowledge of the number of texture classes, so they need some cluster validity indexes in order to become automatic.
Thus, the two main components of this texture recognition framework operate together very well. Its multi-scale circular filter-based feature extractor produces powerful texture descriptors that determine dense texture clusters, which can be separated successfully by its weighted graph-based unsupervised classifier that was specially created for this type of cluster.

5. Conclusions

The novel automatic unsupervised rotation-invariant texture recognition technique introduced in this work brings together several important research domains, such as image processing and analysis, partial differential equations, numerical analysis and graph theory. It also brings some original contributions in both stages of the recognition process.
Thus, the feature extraction component of the recognition framework is based on a new multi-scale texture analysis approach that is an important contribution of our research. It uses a fast-converging finite difference-based numerical approximation algorithm proposed by us that is consistent with a novel well-posed PDE-based model combining second- and fourth-order anisotropic diffusions and 2D Gaussian filter kernels, to create the scale-space representation. A new 2D circular filter-based texture feature extraction solution is applied at each scale, determining strong rotation-invariant feature vectors.
The unsupervised texture classification is performed by applying a novel graph clustering technique that is another contribution of this work. The automatic texture clustering approach, proposed here, which uses a fully connected weighted similarity graph corresponding to the texture feature vector set, determines the optimal texture clusters without a priori knowledge about their number.
Additionally, the proposed texture recognition framework achieves high values of the performance metrics and outperforms many other unsupervised texture recognition techniques. Unfortunately, our technique may require higher execution times than other recognition methods, because of the higher time complexity of its multi-scale texture feature extraction process.
We may try to further improve it by transforming the multi-scale texture analysis part into a multi-resolution analysis approach. Our recognition method can be applied successfully in other image analysis and computer vision domains, such as texture indexing and retrieval, where the cluster-based texture indexes could be obtained using this method, texture segmentation and image and video object detection. Further applications and improvements of the proposed texture recognition framework will represent the focus of our future research.

Funding

This research received no external funding.

Conflicts of Interest

The author declares no conflict of interest.

References

  1. Fernandez, A.; Alvarez, M.X.; Bianconi, F. Texture description through histograms of equivalent patterns. J. Math. Imaging Vis. 2013, 45, 76–102. [Google Scholar] [CrossRef] [Green Version]
  2. Tuceryan, M. Moment-based texture segmentation. Pattern Recognit. Lett. 1994, 15, 659–668. [Google Scholar] [CrossRef]
  3. Haralick, R.M.; Shanmugam, K. Textural features for image classification. IEEE Trans. Syst. Man Cybern. 1973, 6, 610–621. [Google Scholar] [CrossRef] [Green Version]
  4. Aouat, S.; Ait-hammi, I.; Hamouchene, I. A new approach for texture segmentation based on the Gray level co-occurrence Matrix. Multimed. Tools Appl. 2021, 1–26. [Google Scholar] [CrossRef]
  5. Zhang, L.; Zhou, Z.; Li, H. Binary gabor pattern: An efficient and robust descriptor for texture classification. In Proceedings of the 19th IEEE International Conference on Image Processing, Taipei, Taiwan, 22–29 September 2012; pp. 81–84. [Google Scholar]
  6. Ojala, T.; Pietikainen, M.; Harwood, D. A comparative study of texture measures with classification based on featured distributions. Pattern Recognit. 1996, 29, 51–59. [Google Scholar] [CrossRef]
  7. Fekri-Ershad, S. Texture classification approach based on energy variation. Int. J. Multimed. Technol. 2012, 2, 52–55. [Google Scholar]
  8. Liang, H.; Weller, D.S. Edge-based texture granularity detection. In Proceedings of the 2016 IEEE International Conference on Image Processing (ICIP), Phoenix, AZ, USA, 25–28 September 2016; pp. 3563–3567. [Google Scholar]
  9. Epifanio, I.; Soille, P. Morphological texture features for unsupervised and supervised segmentations of natural landscapes. IEEE Trans. Geosci. Remote Sens. 2007, 45, 1074–1083. [Google Scholar] [CrossRef]
  10. Lowe, D.G. Distinctive image features from scale-invariant keypoints. Int. J. Comput. Vis. 2004, 60, 91–110. [Google Scholar] [CrossRef]
  11. Xu, Y.; Yang, X.; Ling, H.; Ji, H. A new texture descriptor using multifractal analysis in multi-orientation wavelet pyramid. In Proceedings of the IEEE Computer Society Conference on Computer Vision and Pattern Recognition, San Francisco, CA, USA, 13–18 June 2010; pp. 161–168. [Google Scholar]
  12. Cross, G.R.; Jain, A.K. Markov random field texture models. IEEE Trans. Pattern Anal. Mach. Intell. 1983, 1, 25–39. [Google Scholar] [CrossRef]
  13. Mao, J.; Jain, A.K. Texture classification and segmentation using multiresolution simultaneous autoregressive models. Pattern Recognit. 1992, 25, 173–188. [Google Scholar] [CrossRef]
  14. Jain, A.K.; Faraokhnia, F. Unsupervised texture segmentation using Gabor filters. Pattern Recognit. 1991, 24, 1167–1186. [Google Scholar] [CrossRef] [Green Version]
  15. Livens, S.; Scheunders, P.; Wouver, G.; van Dyck, D. Wavelets for texture analysis, an overview. In Proceedings of the 6th International Conference on Image Processing and Its Applications, Dublin, Ireland, 14–17 July 1997; pp. 581–585. [Google Scholar]
  16. Arivazhagan, S.; Ganesan, L.; Priyal, S.P. Texture classification using Gabor wavelets based rotation invariant features. Pattern Recognit. Lett. 2006, 27, 1976–1982. [Google Scholar] [CrossRef]
  17. Shen, L.; Yin, Q. Texture classification using curvelet transform. In Proceedings of the 2009 International Symposium on Information Processing, (ISIP), San Francisco, CA, USA, 13–16 April 2009. [Google Scholar]
  18. Yang, P.; Yang, G. Feature extraction using dual-tree complex wavelet transform and gray level co-occurrence matrix. Neurocomputing 2016, 197, 212–220. [Google Scholar] [CrossRef]
  19. Bishop, C.M. Pattern Recognition and Machine Learning; Springer: New York, NY, USA, 2006. [Google Scholar]
  20. Zhu, G.; Li, B.; Hong, S.; Mao, B. Texture recognition and classification based on deep learning. In Proceedings of the 6th International Conference on Advanced Cloud and Big Data (CBD), Lanzhou, China, 12–15 August 2018; pp. 344–348. [Google Scholar]
  21. Yan, L.; Chang, K. A new super resolution framework based on multi-task learning for remote sensing images. Sensors 2021, 21, 1743. [Google Scholar] [CrossRef]
  22. Schaeffer, S.E. Graph clustering. Comput. Sci. Rev. 2007, 1, 27–64. [Google Scholar] [CrossRef]
  23. Du, H.; Wang, Y.; Dong, X.; Cheung, Y. Texture image segmentation using spectral clustering. In HCI International 2015—Posters’ Extended Abstracts, HCI 2015; Stephanidis, C., Ed.; Communications in Computer and Information Science; Springer: Cham, Switzerland, 2015; Volume 528. [Google Scholar]
  24. Boulkenafet, Z.; Komulainen, J.; Feng, X.; Hadid, A. Scale space texture analysis for face anti-spoofing. In Proceedings of the International Conference on Biometrics (ICB), Halmstad, Sweden, 13–16 June 2016; pp. 1–6. [Google Scholar]
  25. Barbu, T. Novel Diffusion-Based Models for Image Restoration and Interpolation; Book Series: Signals and Communication Technology; Springer International Publishing: Cham, Switzerland, 2019; 126p. [Google Scholar]
  26. Barbu, T. Robust contour tracking model using a variational level-set algorithm. Numer. Funct. Anal. Optim. 2014, 35, 263–274. [Google Scholar] [CrossRef]
  27. Barbu, T. Feature keypoint-based image compression technique using a well-posed nonlinear fourth-order PDE-based model. Mathematics 2020, 8, 930. [Google Scholar] [CrossRef]
  28. Barbu, T. A PDE Based Model for Sonar Image and Video Denoising. In Analele Științifice ale Universității Ovidius Constanța, Seria Matematică; Ovidius University: Constanța, Romania, 2011; Volume 19, pp. 51–58. [Google Scholar]
  29. Johnson, P. Finite Difference for PDEs; School of Mathematics, University of Manchester: Manchester, UK, 2008. [Google Scholar]
  30. Porter, R.; Canagarajah, N. Gabor filters for rotation invariant texture classification. In Proceedings of the IEEE International Symposium on Circuits and Systems, Hong Kong, China, 9–12 June 1997; pp. 1193–1196. [Google Scholar]
  31. Barbu, T.; Ungureanu, P.; Goraș, L. Multiscale Texture Recognition using Anisotropic Diffusion-based Scale Space and Combined Rotation-invariant Feature Descriptors. Proc. Rom. Acad. Ser. A 2020, 21, 385–393. [Google Scholar]
  32. Barbu, T. An automatic unsupervised pattern recognition approach. Proc. Rom. Acad. Ser. A 2006, 7, 73–78. [Google Scholar]
  33. Barbu, T. Unsupervised SIFT-based face recognition using an automatic hierarchical agglomerative clustering solution. Procedia Comput. Sci. 2013, 22, 385–394. [Google Scholar] [CrossRef] [Green Version]
  34. Bollobás, B. Modern Graph Theory; Springer: Berlin/Heidelberg, Germany, 2013; Volume 184. [Google Scholar]
  35. Hartuv, E.; Shamir, R. A clustering algorithm based on graph connectivity. Inf. Process. Lett. 2000, 76, 175–181. [Google Scholar] [CrossRef]
  36. Günter, S.; Bunke, H. Self-organizing map for clustering in the graph domain. Pattern Recognit. Lett. 2002, 23, 405–417. [Google Scholar] [CrossRef]
  37. Yen, L.; Vanvyve, D.; Wouters, F.; Fouss, F.; Verleysen, M.; Saerens, M. Clustering using a random walk based distance measure. In Proceedings of the 13th European Symposium on Artificial Neural Networks, Bruges, Belgium, 27–29 April 2005; pp. 317–324. [Google Scholar]
  38. Serratosa, F.; Sanfeliu, A. Function-described graphs. Pattern Recognit. Image Anal. 1997, 1, 37–42. [Google Scholar]
  39. Jothi, R.; Mohanty, S.K.; Ojha, A. Fast approximate minimum spanning tree based clustering algorithm. Neurocomputing 2018, 272, 542–557. [Google Scholar] [CrossRef]
  40. Galluccio, L.; Michel, O.; Comon, P.; Hero, A.O., III. Graph based k-means clustering. Signal Process. 2012, 92, 1970–1984. [Google Scholar] [CrossRef] [Green Version]
  41. Liu, J.; Han, J. Spectral clustering. Adv. Neural Inf. Process. Syst. 2004, 17, 1601–1608. [Google Scholar]
  42. Tsitsulin, A.; Palowitch, J.; Perozzi, B.; Müller, E. Graph clustering with graph neural networks. arXiv 2020, arXiv:2006.16904. [Google Scholar]
  43. Kunegis, J.; Schmidt, S.; Lommatzsch, A.; Lerner, J.; De Luca, E.W.; Albayrak, S. Spectral analysis of signed graphs for clustering, prediction and visualization. In Proceedings of the SIAM International Conference on Data Mining, Columbus, OH, USA, 29 April–1 May 2010; pp. 559–570. [Google Scholar]
  44. Ford, L.R.; Fulkerson, D.R. Maximal flow through a network. Can. J. Math. 1956, 8, 399–404. [Google Scholar] [CrossRef]
  45. Kylberg, G.; Sintorin, I. On the influence of interpolation method on rotation invariance in texture recognition. J. Image Video Process. 2016, 17. [Google Scholar] [CrossRef] [Green Version]
  46. Brodatz, P. Textures: A Photographic Album for Artists and Designers; Dover Publication: Mineola, NY, USA, 1966. [Google Scholar]
  47. Powers, D.M. Evaluation: From precision, recall and F-measure to ROC, informedness, markedness and correlation. arXiv 2020, arXiv:2010.16061. [Google Scholar]
Figure 1. Weight-connected graph-based texture clustering example.
Symmetry 13 00925 g001
Figure 2. Representative images of the texture classes used in the recognition tests: (a) Brodatz; (b) Kylberg.
Symmetry 13 00925 g002
Table 1. Method comparison results: performance metric values achieved by several texture recognition models.
PrecisionRecallF1Accuracy
The proposed technique0.97080.97520.97300.9745
Proposed multi-scale feature extraction +K-means0.96520.96170.96340.9657
Proposed multi-scale feature extraction + hierarchical agglomerative clustering0.96380.96240.96310.9652
Moment-based feature extraction +K-means0.92680.91630.92150.9205
Moment-based feature extraction + hierarchical agglomerative clustering0.91740.91970.91850.9143
LBP features +K-means0.93450.93670.93560.9375
LBP + hierarchical agglomerative clustering0.94590.94220.94400.9378
GLCM +K-means0.95050.95740.95390.9547
GLCM + hierarchical agglomerative clustering0.95780.96030.95900.9603
Circularly symmetric 2D Gabor filter +K-means0.96470.96120.96290.9651
Circularly symmetric 2D Gabor filter + hierarchical agglomerative clustering0.96350.96230.96290.9638
2D Gabor Wavelets +K-means0.97060.97360.97210.9739
2D Gabor Wavelets + hierarchical agglomerative clustering0.97030.97310.97170.9734
Publisher’s Note: MDPI stays neutral with regard to jurisdictional claims in published maps and institutional affiliations.

