Article

Protein Helical Structures: Defining Handedness and Localization Features

by
Alla E. Sidorova
*,†,
Ekaterina V. Malyshko
*,†,
Aleksey O. Lutsenko
,
Denis K. Shpigun
and
Olga E. Bagrova
Faculty of Physics, Lomonosov Moscow State University, Leninskie gory 1-2, 119234 Moscow, Russia
*
Authors to whom correspondence should be addressed.
Alla E. Sidorova and Ekaterina V. Malyshko contributed equally to this work as first authors.
Symmetry 2021, 13(5), 879; https://doi.org/10.3390/sym13050879
Submission received: 14 April 2021 / Revised: 9 May 2021 / Accepted: 11 May 2021 / Published: 15 May 2021
(This article belongs to the Special Issue Symmetry in Biophysics)

Abstract

:
The quantitative evaluation of the chirality of macromolecule structures remains one of the exciting issues in biophysics. In this paper, we propose methods for quantitative analysis of the chirality of protein helical and superhelical structures. The analysis of the chirality sign of the protein helical structures (α-helices and 310-helices) is based on determining the mixed product of every three consecutive vectors between neighboring reference points—α-carbons atoms. The method for evaluating the chirality sign of coiled-coil structures is based on determining the direction and value of the angle between the coiled-coil axis and the α-helices axes. The chirality sign of the coiled coil is calculated by averaging the value of the cosine of the corresponding angle for all helices forming the superhelix. Chirality maps of helical and superhelical protein structures are presented. Furthermore, we propose an analysis of the distributions of helical and superhelical structures in polypeptide chains of several protein classes. The features common to all studied classes and typical for each protein class are revealed. The data obtained, in all likelihood, can reflect considerations about molecular machines as chiral formations.

1. Introduction

Since the time of Louis Pasteur, one of the key categories in the triad of “symmetry—dissymmetry—asymmetry” in living systems has been considered chirality—the property of objects or systems to be non-superimposable with their mirror images in any combination of translations and rotations in three-dimensional space [1]. It is well-known that proteins synthesized in ribosomes contain only L-amino acids, and nucleic acids contain D-ribose and D-deoxyribose. For more than 100 years, the attention of researchers has been attracted to the mystery of the origin and evolutionary fixation of chiral dissymmetry in living nature. There is no generally accepted answer to this question, although there are numerous hypotheses [2,3,4,5,6,7,8,9]. However, we are interested in what unique or simply beneficial living nature has acquired on Earth, having taken the path of consistent symmetry breaking in its development.
In previously published works, relying on numerous sources, we developed and substantiated the tendency according to which the hierarchies of the structures of proteins and nucleic acids are characterized by a change in the type of symmetry and chirality sign. Starting from the level of asymmetric carbon in the amino acids of the primary structure of proteins, there is a tendency to alternate the chirality sign of the structural levels of proteins L-D-L-D [10,11,12].
If we talk about the general trend, then the primary structure (polypeptide chain) is characterized by completely left-handed chirality of amino acid residues. Higher levels are represented by helical structures of various types (in this work, we do not consider β-structures). Secondary structures are represented mainly by right-handed α-helices [13,14,15,16]. This conformation is energetically more preferred [17,18]. The next most common helical secondary structure of proteins is 3 10 -helices. They account for up to 15–20% of all protein helices [19]. Although left-handed helices are rare, they also have structural or functional significance [18,20,21]. At the next level of the hierarchical organization of protein structures, there are superhelical structures—coiled coil composed of α-helices [22,23,24]. In addition to well-known coiled-coil structures with a heptade sequence, there are also nontrivial ones. In the case of nonheptad sequence repeats, the heterochiral structure of L- and D-polypeptides contains large and likely more stable interfaces [25]. In this paper, the authors expect the heterochiral oligomers would be incompatible with α-helical supercoiling.
To date, there is a significant number of works that offer various methods for assessing chirality [26,27,28,29,30,31,32,33,34,35]. The Ramachandran plot is a significant tool for describing a peptide backbone in the context of the backbone dihedral angles [36,37]. One of the concepts associated with the Ramachandran plot is a metric for backbone handedness [38]. It is based on interpreting a peptide backbone as a helix with axial and angular displacement. Every region handedness of the Ramachandran plot could be characterized by this metric for cis and trans backbones. The most comprehensive theoretical approach to assessing the chirality of helical structures was developed by M. Petitjean. Following this concept, the measure of chirality should be a continuous characteristic and be determined for a space of any dimension, and the chirality index should not depend on the method of choosing the mirror image [39,40,41]. The above methods are either highly specialized or rather complicated to implement, so it is impossible to determine the sign and measure of chirality of helical protein structures for large data sets.
Since the discovery of coiled-coil structures, several approaches have been proposed to describe them as chiral objects. In [42], the authors proposed to relate the pitch and radius of the coiled coil with a change in the twist angle and a shift along the coiled-coil axis per amino acid. In another work [43], the calculation of the pitch of the double-helical coiled coil was made, taking into account the Cartesian vector coordinates of the average atomic positions of the core atoms of the N- and C-terminus. It should be noted that both methods presented do not allow one to reveal the chirality of coiled coils. Furthermore, the possibility of the formation of a right-handed structure is not taken into account. In work [44], it is proposed to determine the sign of the chirality (τ) of the surface curve for a classical coiled coil using the periodicity of the helix, the angle between adjacent residues, and the shift along the axis per amino acid: for right-handed structures, τ is positive, for left-handed ones—negative. However, the authors note that it is not obvious that at negative τ the superhelix is left-handed.
In this work, we present our methods for the quantitative evaluation of the protein helical structure chirality. A necessary and sufficient condition is the mutual arrangement of α-carbons, which allows a reduction in the amount of processed information and is a clear advantage when processing large data arrays. To determine the chirality sign of coiled-coil structures, the twisting direction of each individual α-helix relative to the entire superhelix axis is taken into account. Based on the methods, computer programs in Python 3.7 are implemented. Chirality maps of helical and coiled-coil structures of proteins are obtained. The accuracy of the maps is confirmed by the analysis of real structures.
Another aspect of this work is the regularity identification of the protein “chiral” structure using the example of helical and superhelical structures and their functions. The protein structure determines its function and role in the biological system. However, despite the abundant data on the functions of various proteins, the functions of some of them remain unclear. One of the methods for determining the correspondence of the protein structure and function and its role in metabolism is the method of comparison with already known proteins with similar structures. In the present work, the regularities in the distribution of helices and coiled coils along the polypeptide chain, which form a dynamic backbone of protein molecules, are considered. Research on patterns and relationships between the chiral protein structure and its functions could be used to develop the concept of a protein as a molecular machine.

2. Computational Methodology

The object of research is helical and coiled-coil structures from the PDB, CC+ databases [45,46].

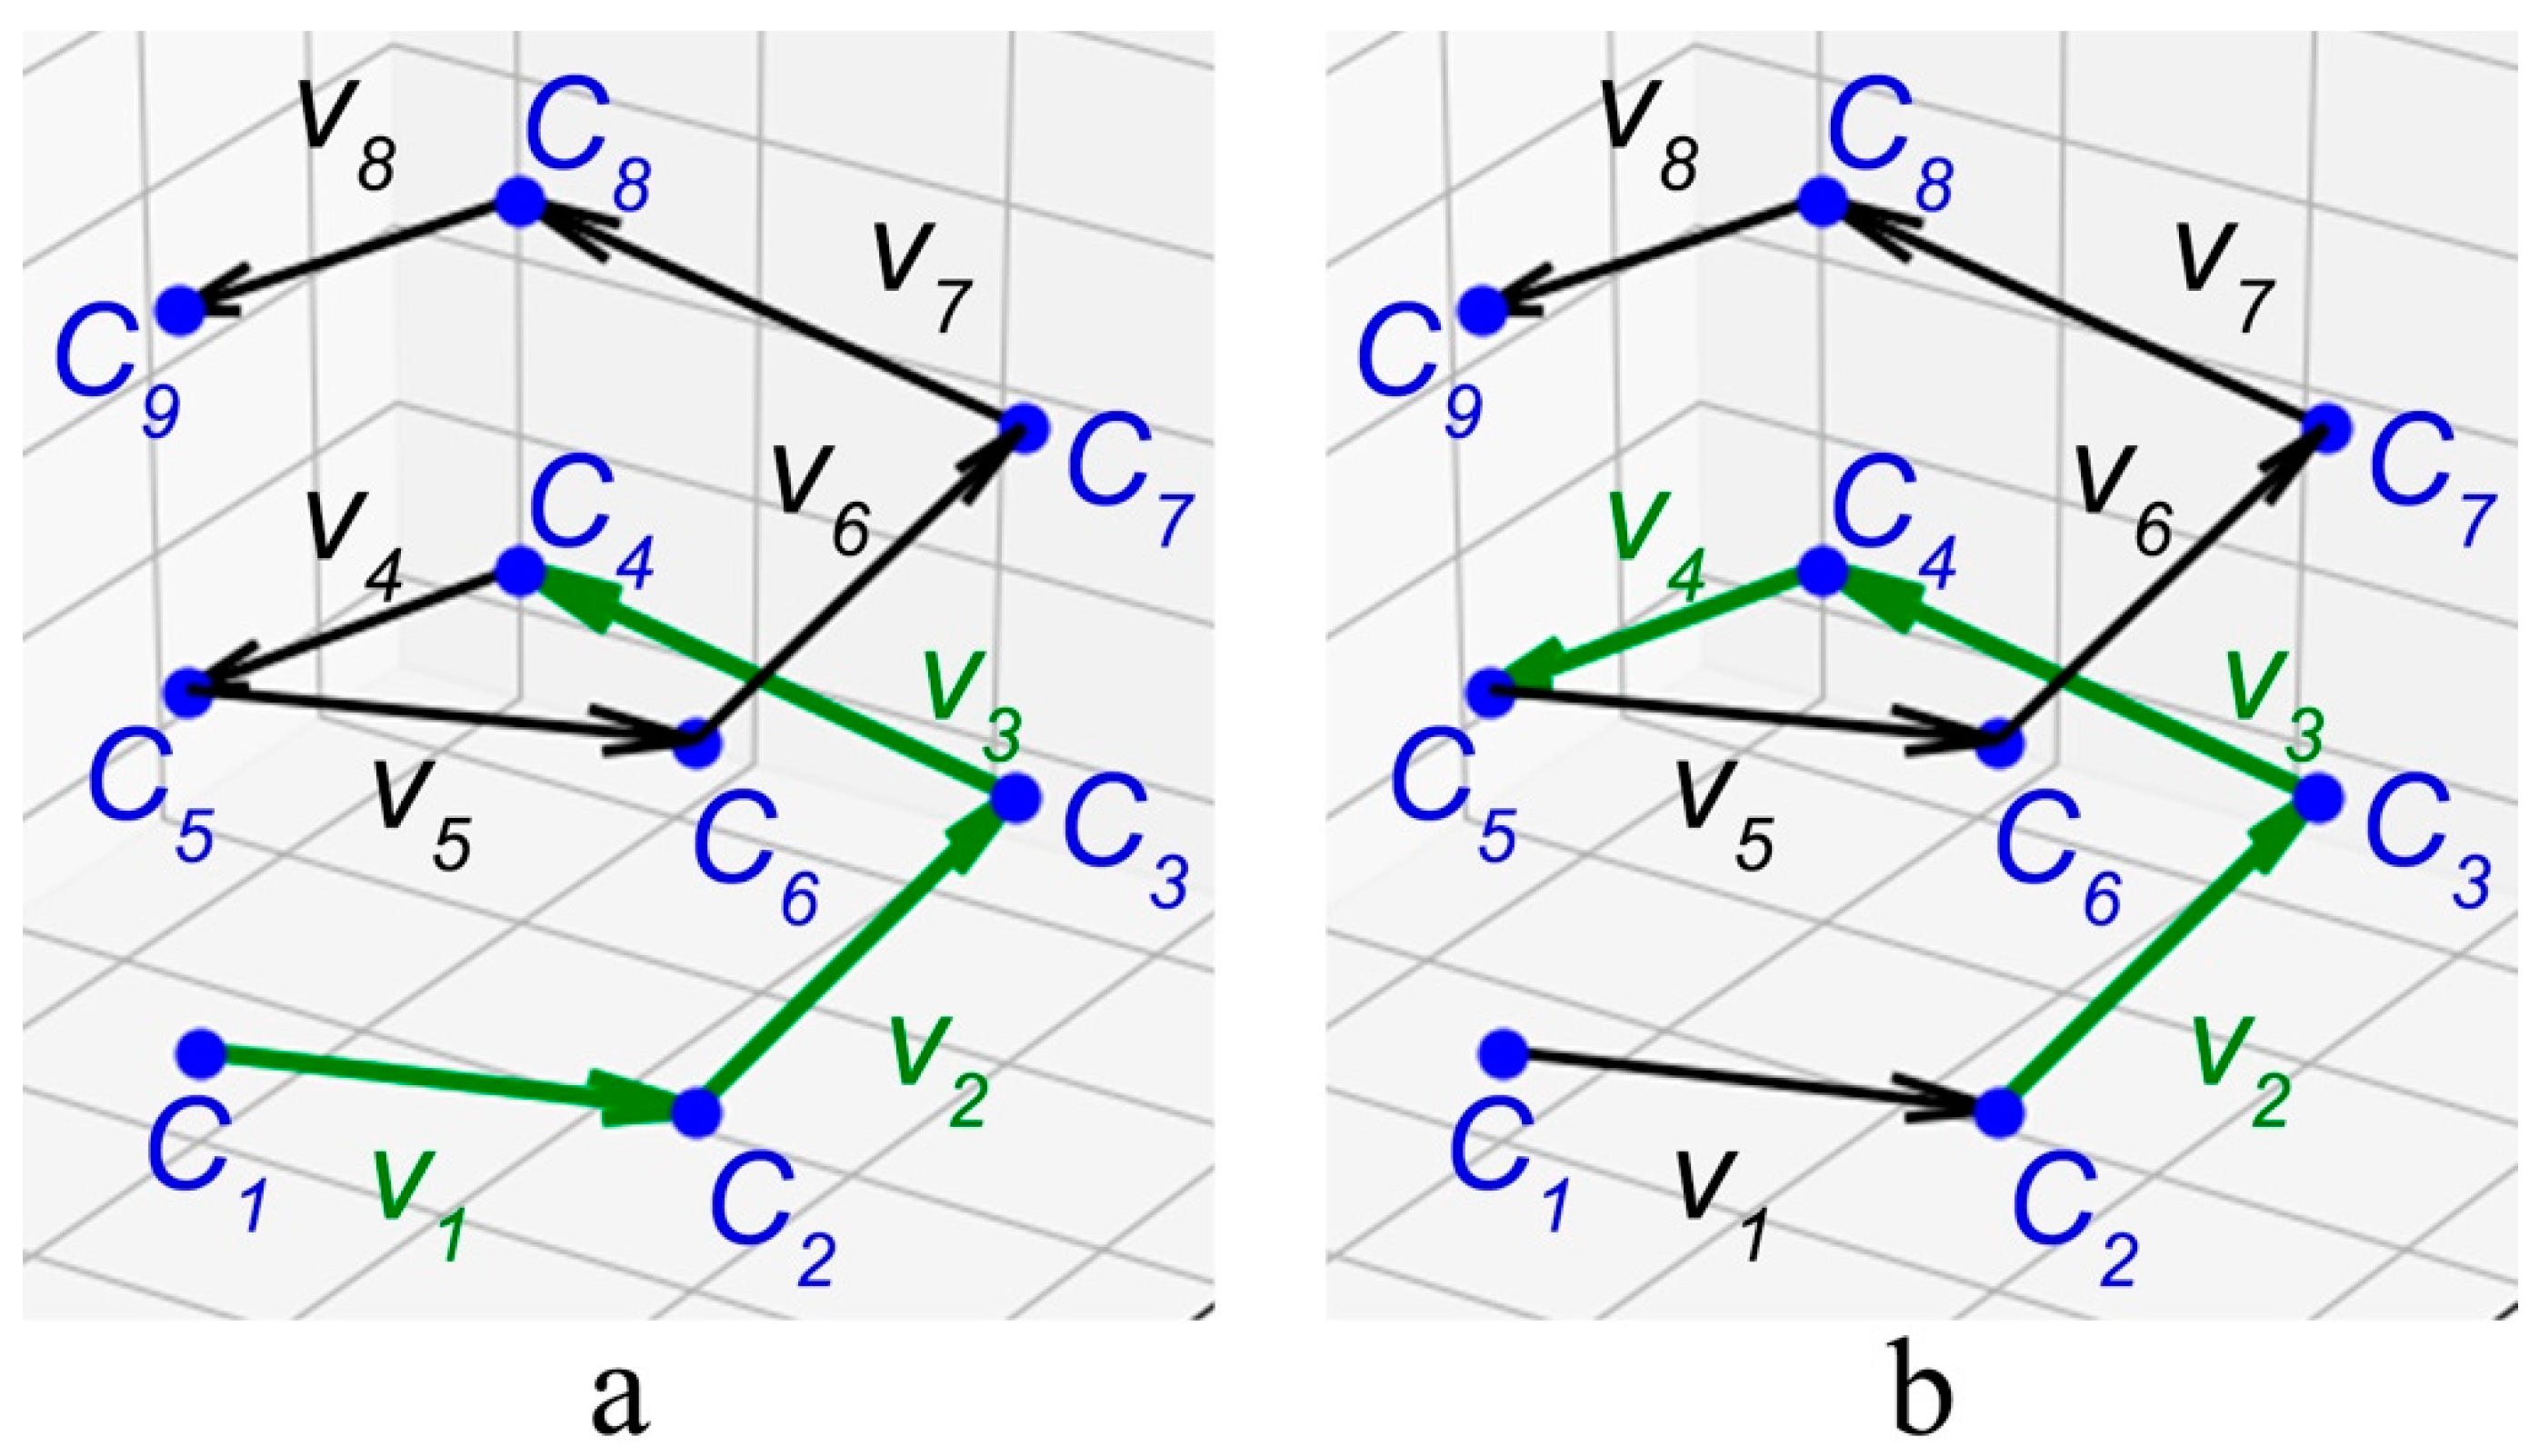
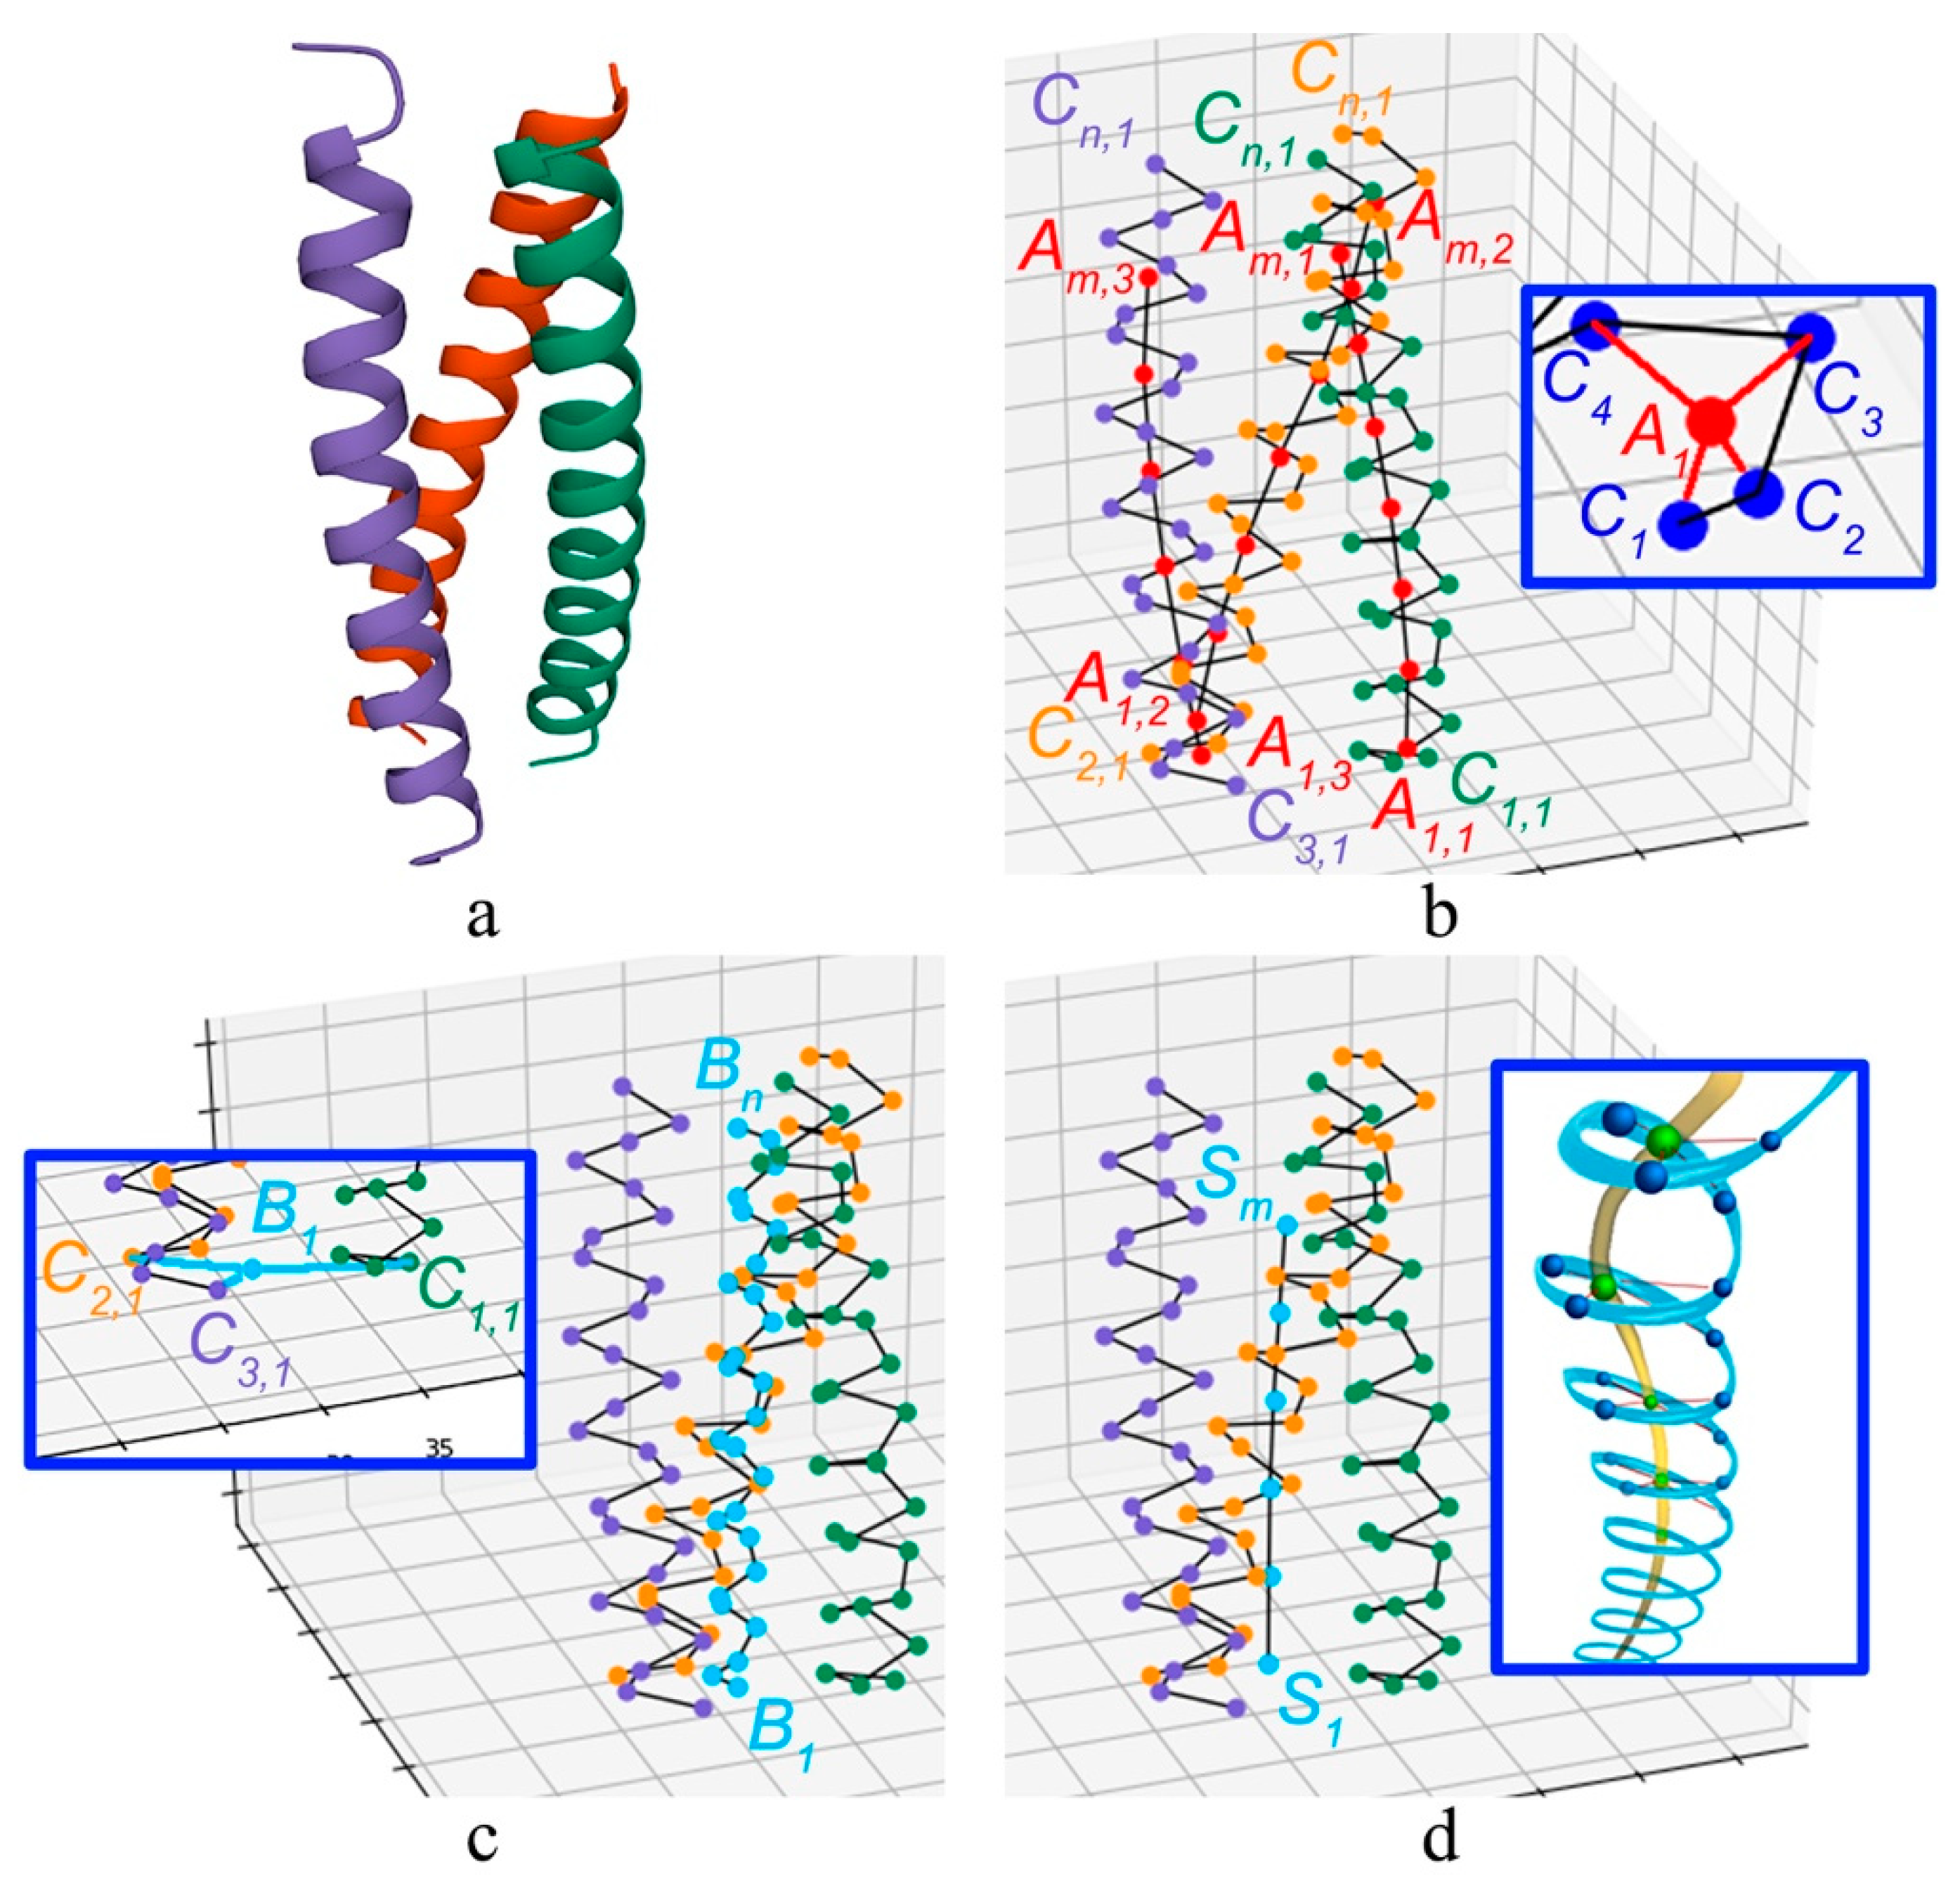
2.1. Method for Quantitative Analysis of the Chirality of Protein Helical Structures

Previously, we proposed a method for quantitative analysis of the chirality of protein helical structures, based on the construction of consecutive vectors between neighboring carbons in the chain and determination of their vector product [47]. The method is based on the mutual arrangement of α-carbons (Cα) atoms in the amino acid chain—the reference points in the model. The skeleton of α-carbons and the helix axis are directed from the C-terminus to the N- terminus. As a result of constructing vectors between neighboring atoms (from the previous to the subsequent) for n atoms (Cα1…Cαn), the direction vector d and the sum of the vector products s were determined. The sign of the cosine of the angle between these vectors determines the chirality sign: in the case of cos∠(d, s) < 0—D; in the case of cos∠(d, s) > 0—L. The length of the product vector was used as an index of chirality, which in some cases led to an incorrect estimate of chirality. For example, for two successive right-handed helices connected in different ways, radically different results were obtained. Further, the above method was developed and improved by us.
Let us consider a model of a polypeptide chain consisting of n amino acid residues and having n Cα atoms as reference points. We construct a vector v i between each two neighboring control points. For n reference points, there are (n-1) vectors (Figure 1).
For every three consecutive vectors, their mixed product is calculated (taking into account their coordinates in three-dimensional space):
( [ v 1 , v 2 ] , v 3 ) = ( y 1 z 2 y 2 z 1 ) x 3 + ( z 1 x 2 z 2 x 1 ) y 3 + ( x 1 y 2 x 2 y 1 ) z 3
The sum of all mixed products can be represented as a characteristic of the helical structure chirality, and the equation for its description can be presented as follows:
χ t o t a l = i = 1 n 3 ( [ v i , v i + 1 ] ,   v i + 2 ) ,
The sign of the mixed product determines the chirality sign of the protein helical structure.

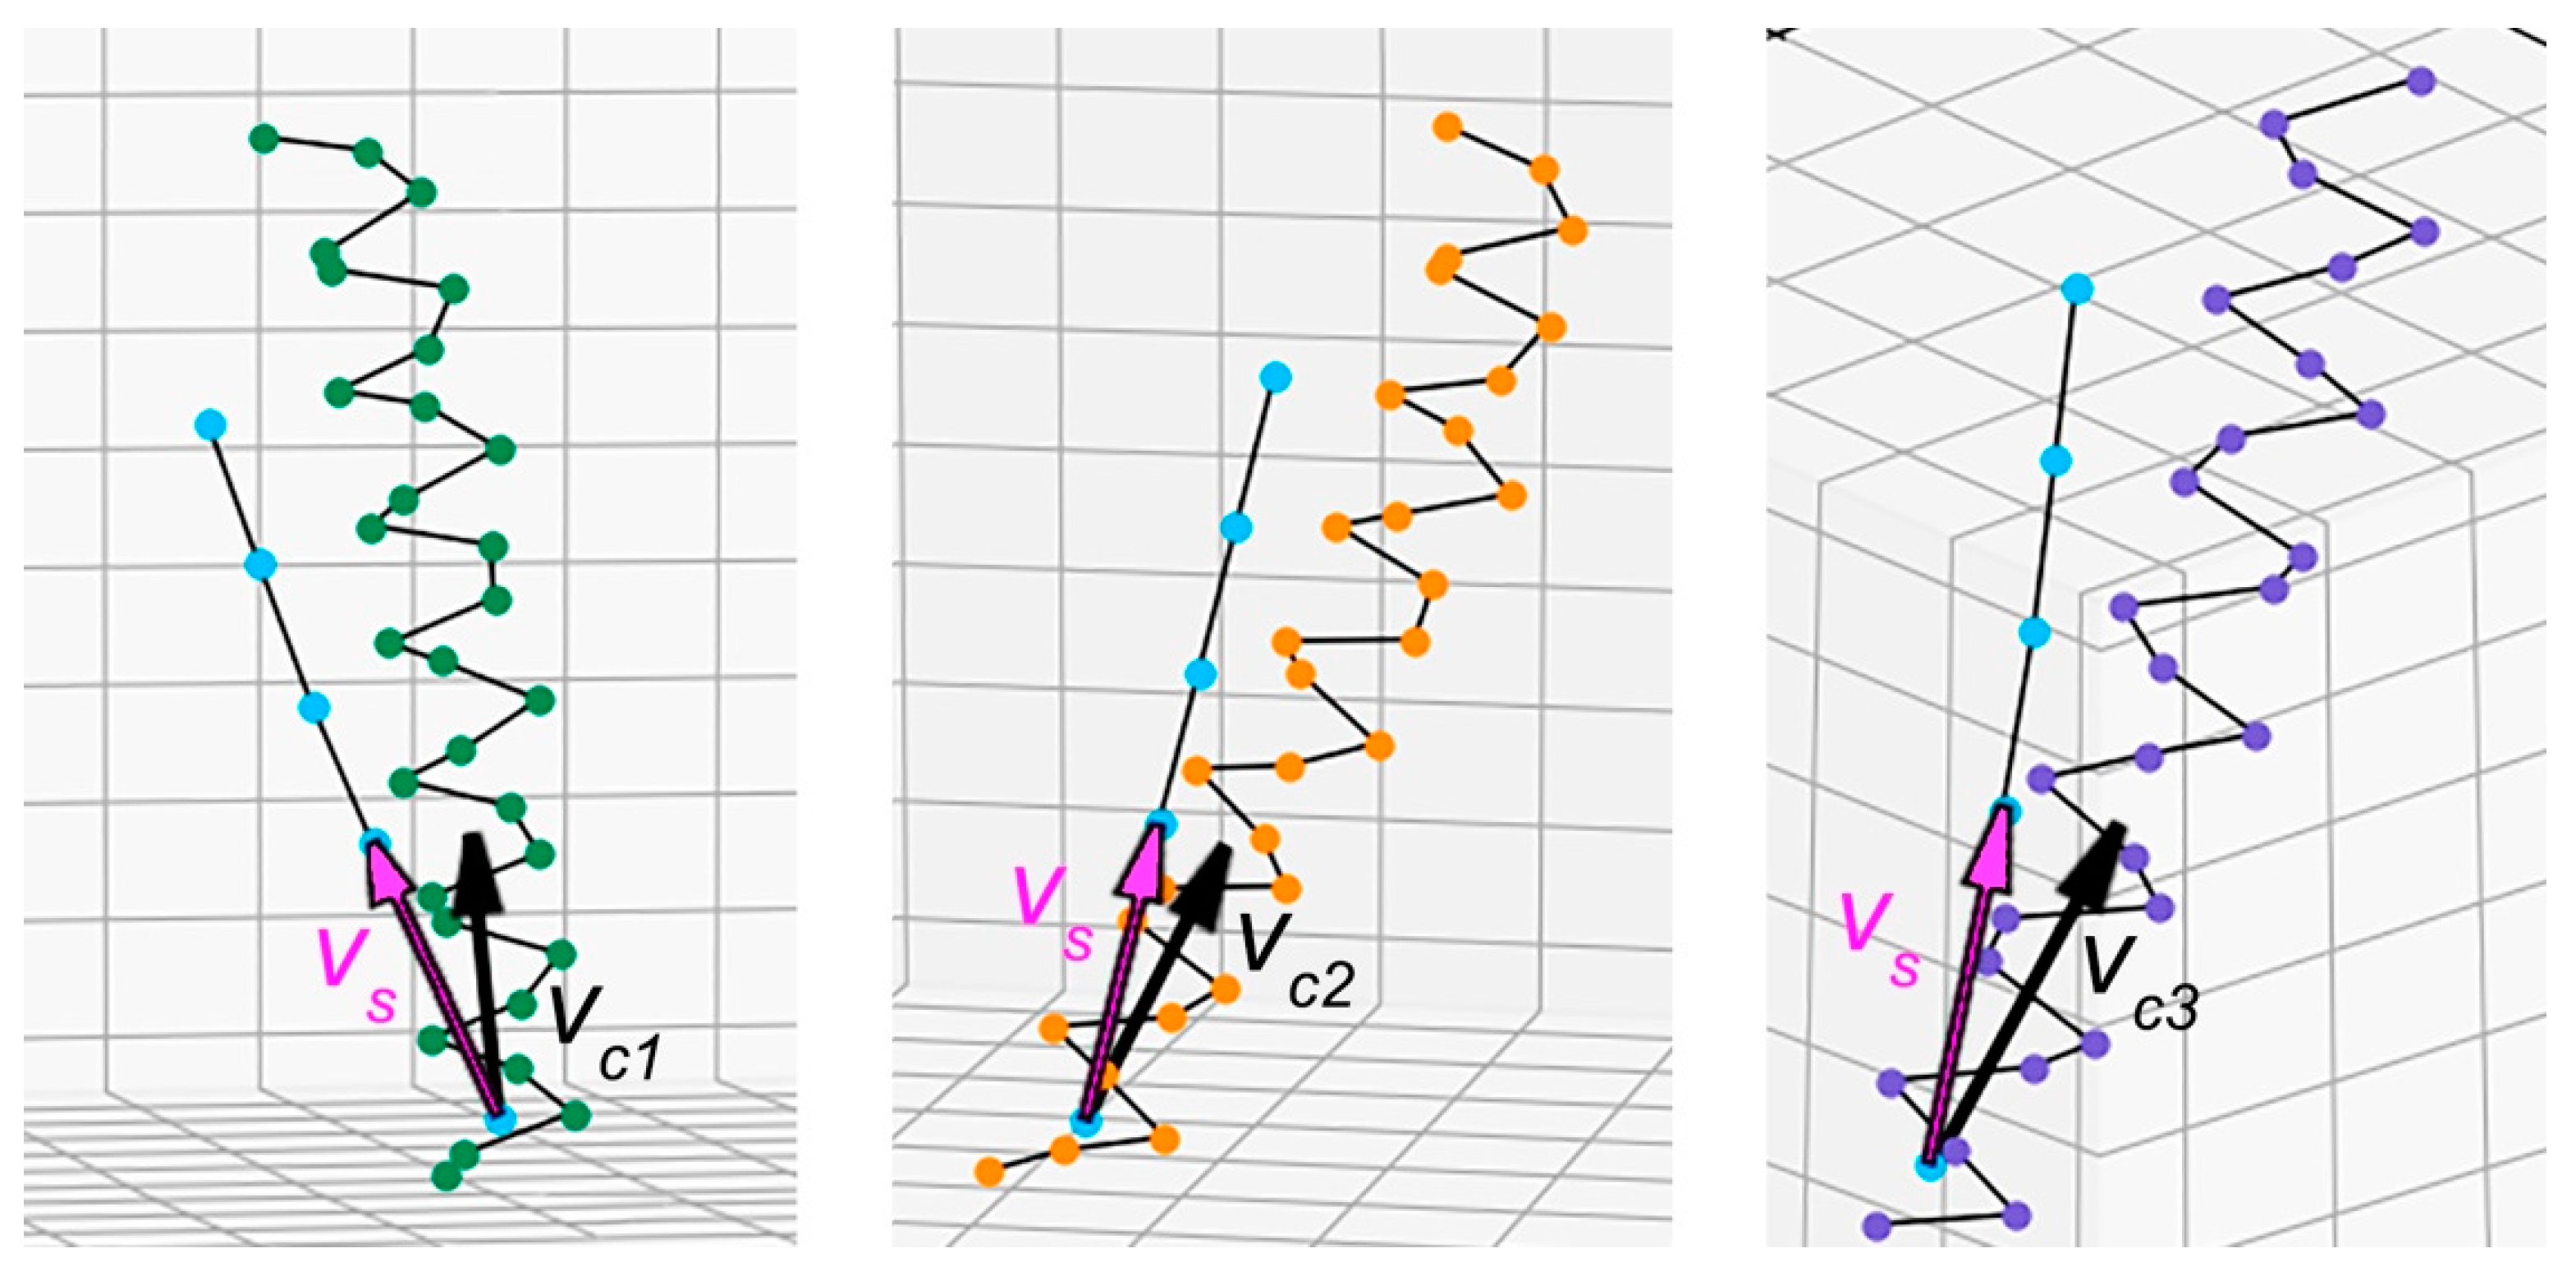
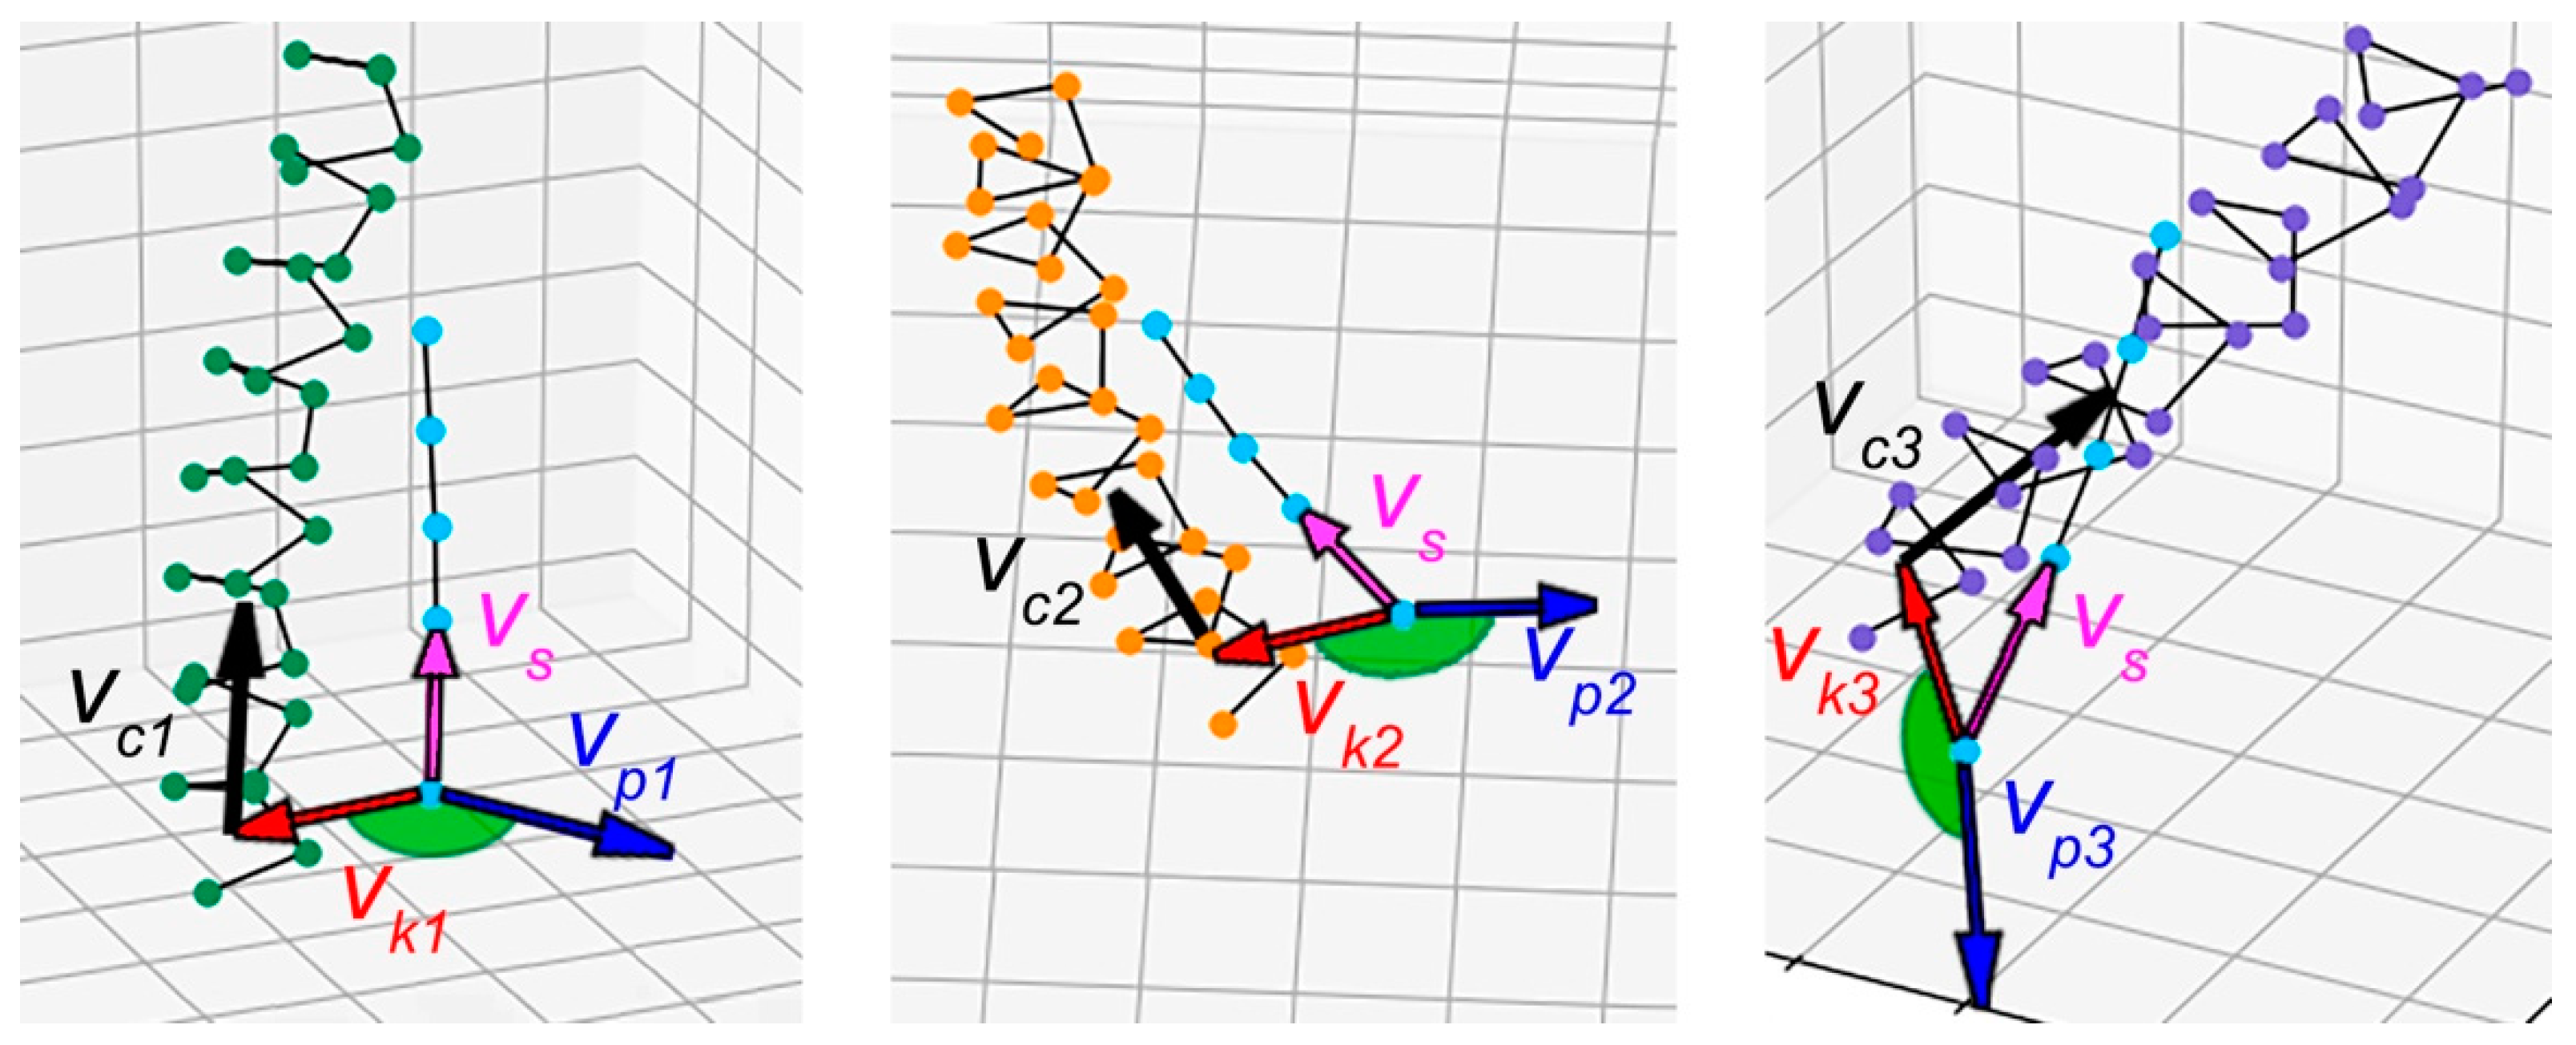
2.2. Method for Quantitative Analysis of the Chirality of Protein Superhelical Structures

We propose the method for the quantitative analysis of the coiled-coil chirality. Similar to the above method for helical structures, information on the mutual arrangement of the α-carbons of the amino acid residues is used as the initial conditions. The method is based on the determination of the twisting direction of each individual α-helix relative to the entire superhelix axis. The angle between the superhelix axis and the helices axes was chosen as a criterion for determining this direction. The clockwise or counterclockwise orientation of this angle relative to the superhelix axis serves as an indicator for determining the chirality sign of the superhelix.
As an example, a thermostable, heterotrimeric coiled coil (PDB ID: 1BB1 [48]) is considered (Figure 2a). Since the α-helix has an average of 3.6 amino acid residues per turn, the geometric center of 4 consecutive atoms (for the first turn—points C1, C2, C3, C4, etc.) is taken as the conditional center of the helix turn. They are the points of the helix axes—A1, A2, …, An, through which the axis of the α-helix is drawn (Figure 2b). At the next stage, the “middle helix” is constructed, which does not carry a physical meaning but is necessary for further constructions: the geometric centers of the first (C1,1, C2,1, C3,1), etc., of the atoms of the α-helices, are the points of the “middle helix” (B1 … Bn in the inset in Figure 2c). For the “middle helix”, the axis is constructed according to the above method. The axis of the middle helix is defined as the superhelix axis (Figure 2d). Both the axis of the middle helix and the axes of the α-helices are curved lines in three-dimensional space (insert in Figure 2d), but for the minimum number of atoms, the curve can be considered as a straight line.
For the left-handed superhelix, helices forming it will be deflected to the right side relative to the superhelix axis. The angle between the vs. and vci vectors will be counted counterclockwise (Figure 3).
The angle between the direction of the superhelical axis (vs vector) and the directions of the constituent helices axes (vc1, vc2, vc3 vectors) determines the chirality sign of the superhelix (Figure 4). Let us denote the vector from the axis of the superhelix to the axis of the i-th spiral as vki and the vector product of the vci and vs. vectors as vpi. If the vector vci deviates from the vector vs. to the right (clockwise), the superhelix is left-handed, and the vki and vpi vectors are counter-directed. If the vci vector deviates from the vs. vector to the left, the superhelix is right-handed, and the vki and vpi vectors will be co-directed.
The angle between vki and vpi is determined using the dot product:
( v k i , v p i ) = | v k i | * | v p i | * cos ( v k i , v p i )
where vki is the vector from the superhelix axis to the k-axis of the helix; vp-cross product of vci and vs. vectors.
The estimate of the chirality sign of the superhelix is calculated by averaging the value of the cosine of the corresponding angle for all helices forming the superhelix:
χ n o r m = 1 q i = 1 q c o s ( β i ) ,
where βi is the angle between the direction of the i-th α-helix axis and the direction of the superhelix axis (that is, between the vectors vki and vpi); q is the number of helices in the superhelix.
Based on the methods, computer programs in Python 3.7 are implemented. The graphical interface is implemented using the tkinter library. The programs allow to load a model from a file, display a list of helical structures, determine the sign of their chirality, and display a three-dimensional image using the matplotlib library. Input data are files with.pdb or.txt extension. The average time for calculating a helix is 50 ms. The average time for calculating the superhelix is 20 ms. The methods are based on a small amount of initial data. That makes it possible to reduce the amount of processed information and is a significant advantage when processing large amounts of data.

3. Results

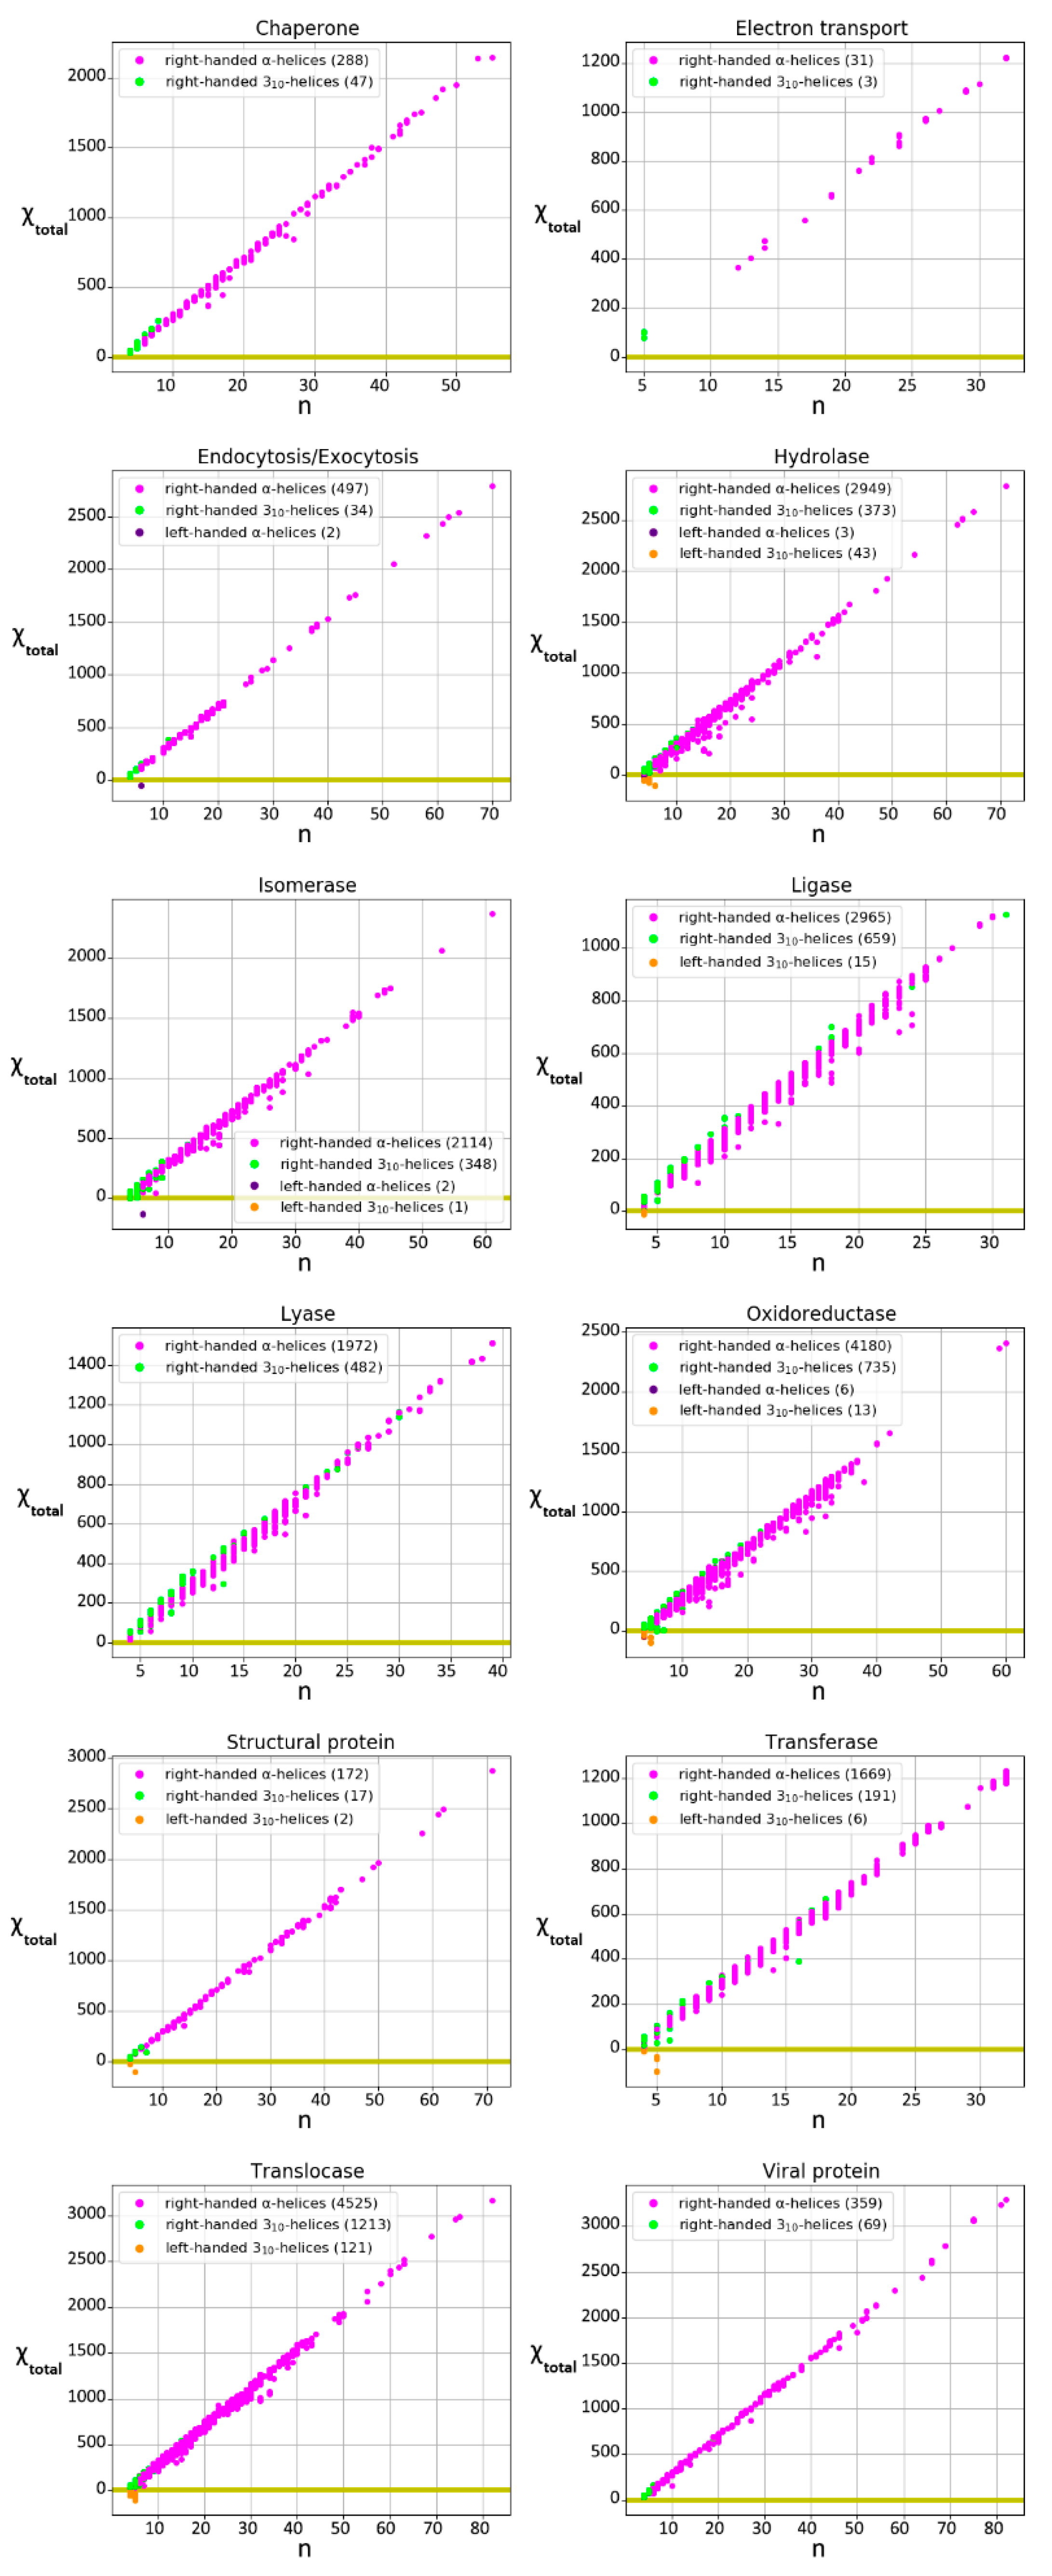
3.1. Characterization of the Chirality of Protein Helical Structures

Using the developed method for quantitative analysis of protein helical structure chirality, the following proteins were considered: enzymes of seven classes (oxidoreductase—189, transferase—86, hydrolase—182, lyase—131, isomerase—113, ligase—89, translocase—130), chaperone—15, viral protein—26, structural protein—13, endo- and exocytosis protein—7, electron transport protein—4 (Table 1). Chirality maps were obtained for the considered protein helical structures (Figure 5).
For all studied proteins, α-helices and 3 10 -helices are mainly right-handed: left-handed α-helices make up 0.06% of the total number of α-helices, and left-handed 3 10 -helices—4.6% of the total number of 3 10 -helices. Thus, no left-handed helices were found in the structures of lyases, viral proteins, chaperones, and electron transport proteins. In hydrolases, translocases, and structural proteins, the percentage of left-handed 3 10 -helices is 10.34%, 9.07%, and 10.52%, respectively. These results significantly differ from other studied protein classes. The highest percentage of left-handed α-helices was found in the structures of endo- and exocytosis proteins (0.4%). The data are presented in Table 2.

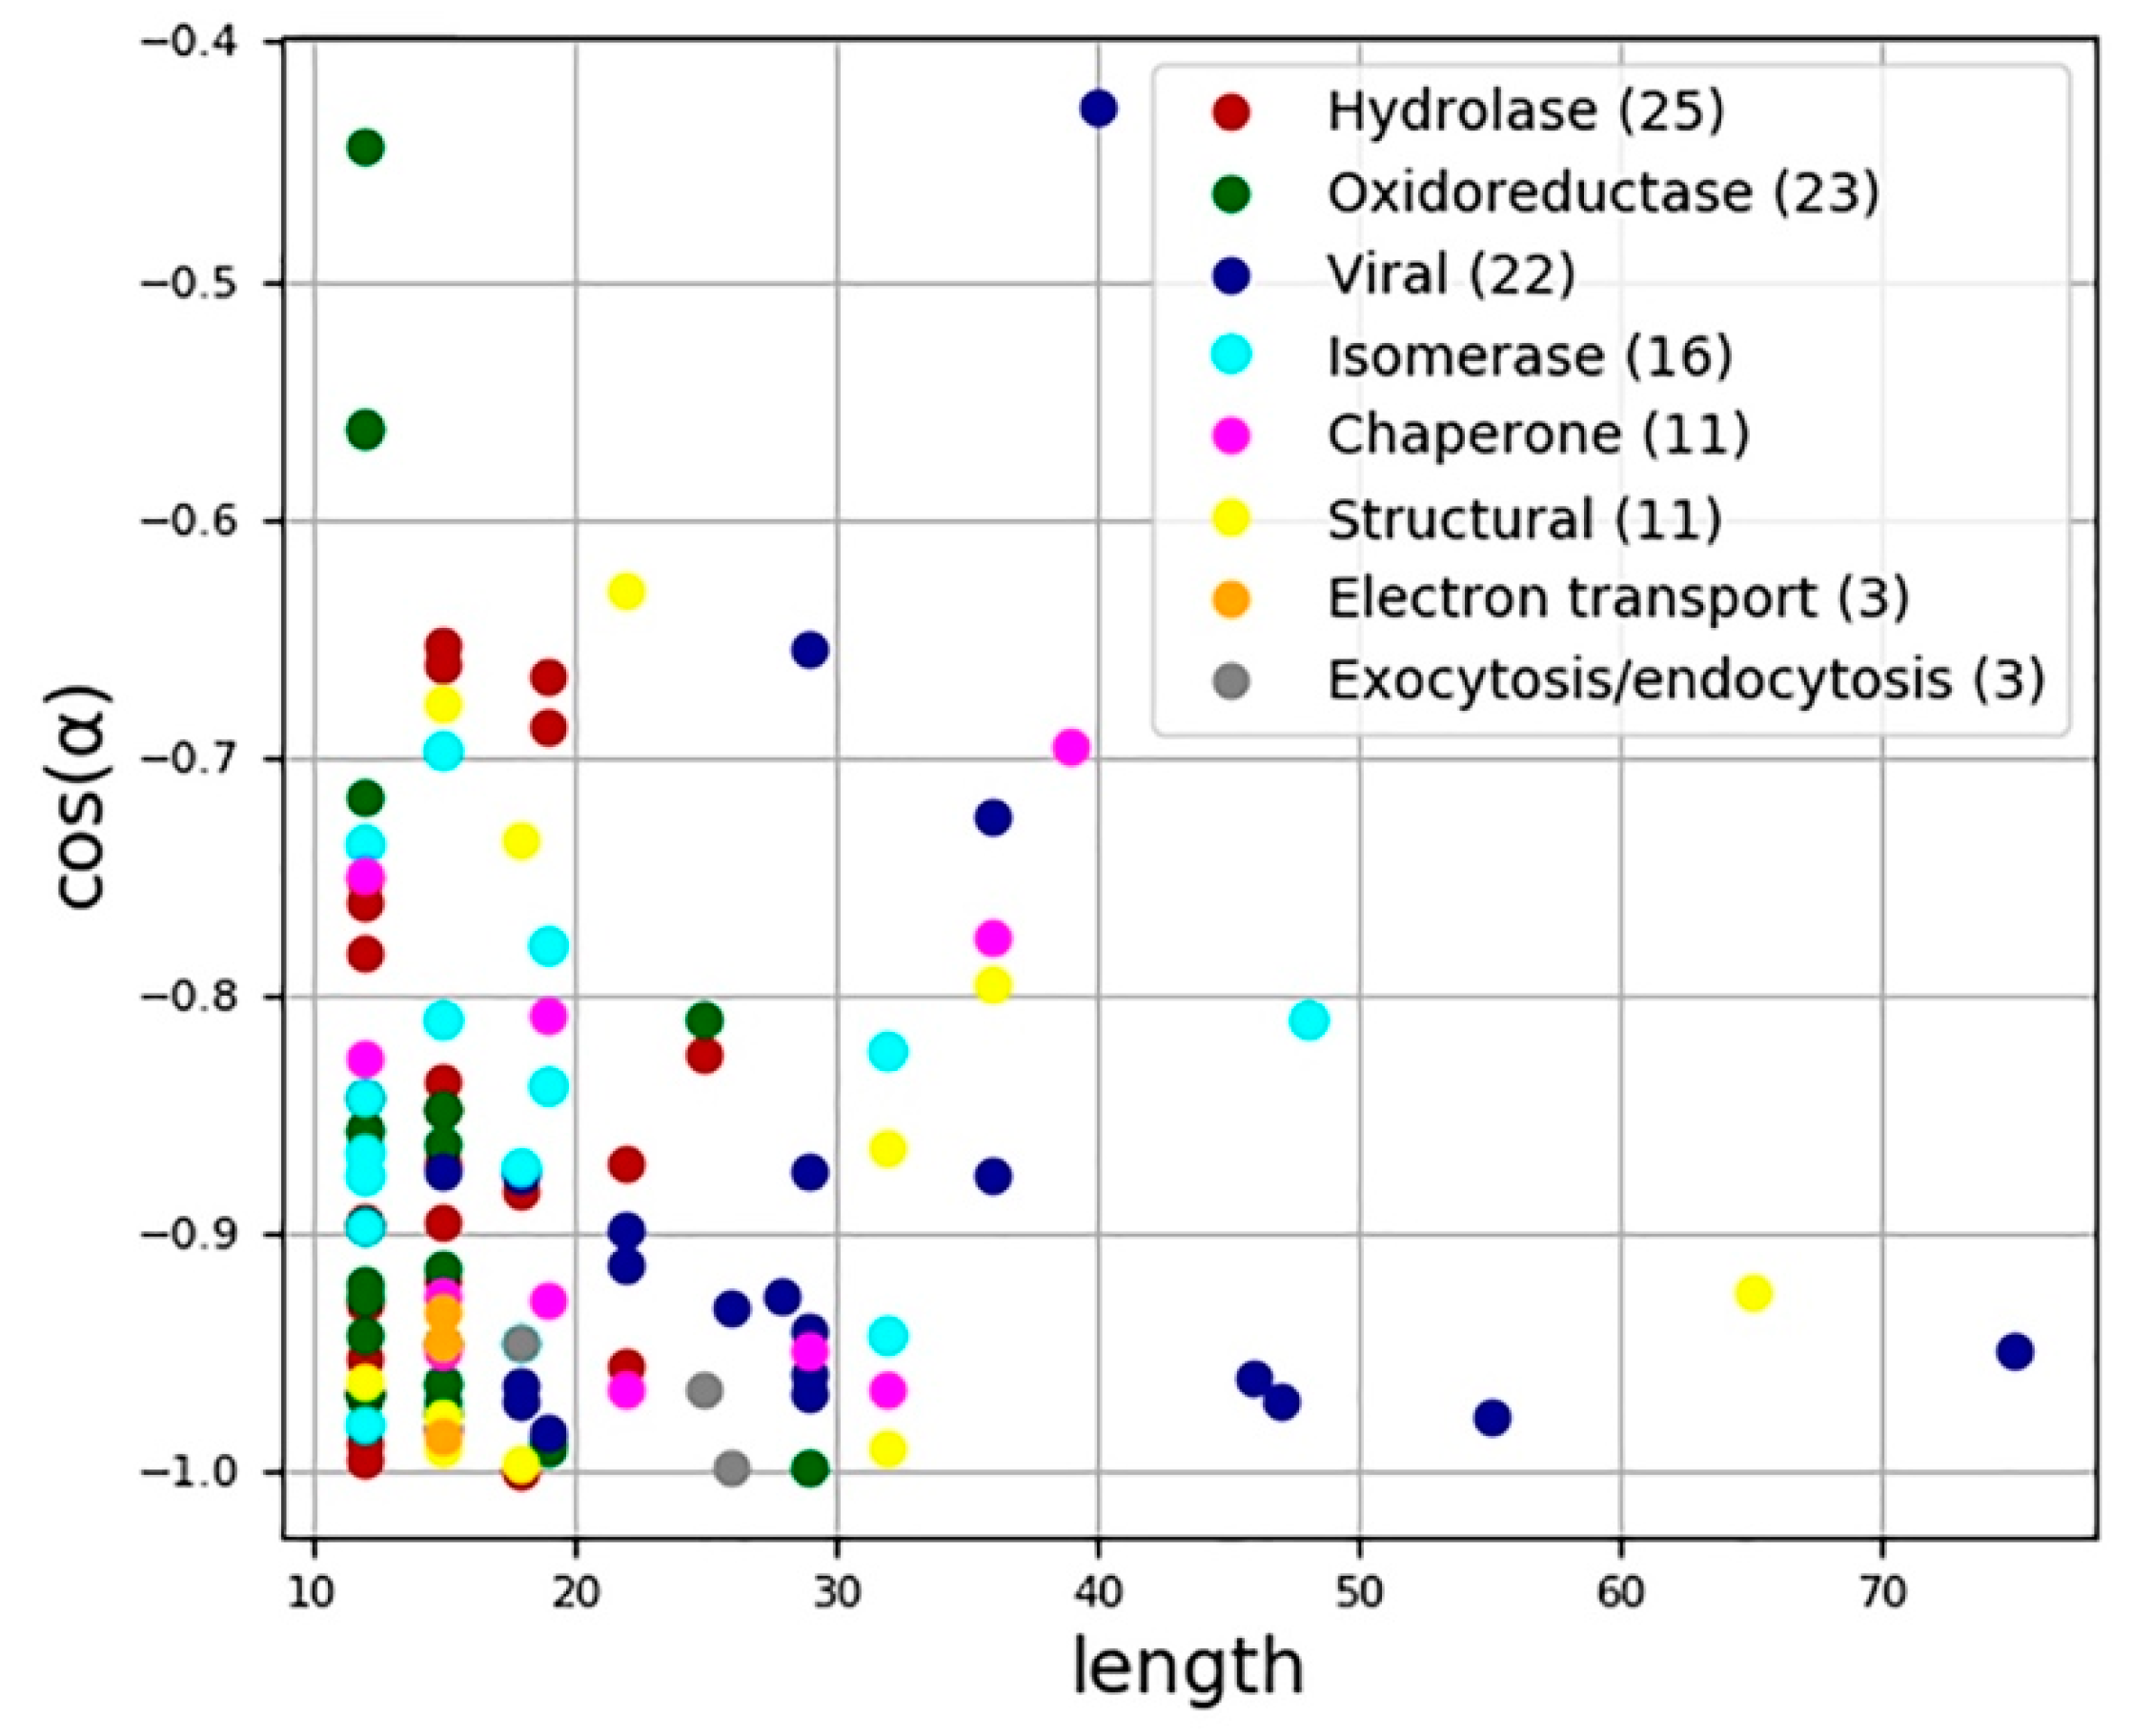
3.2. Characterization of the Chirality of Protein Superhelical Structures

The calculated parameters for estimating the chirality of coiled-coil structures are shown in Table A1 in Appendix A.
The coiled-coil chirality map is shown in Figure 6.
The method was tested on 114 coiled-coil structures from the CC+ database [46]. All coiled-coil structures are defined as left-handed. Thus, the results obtained adequately reflect the data presented in the scientific literature.

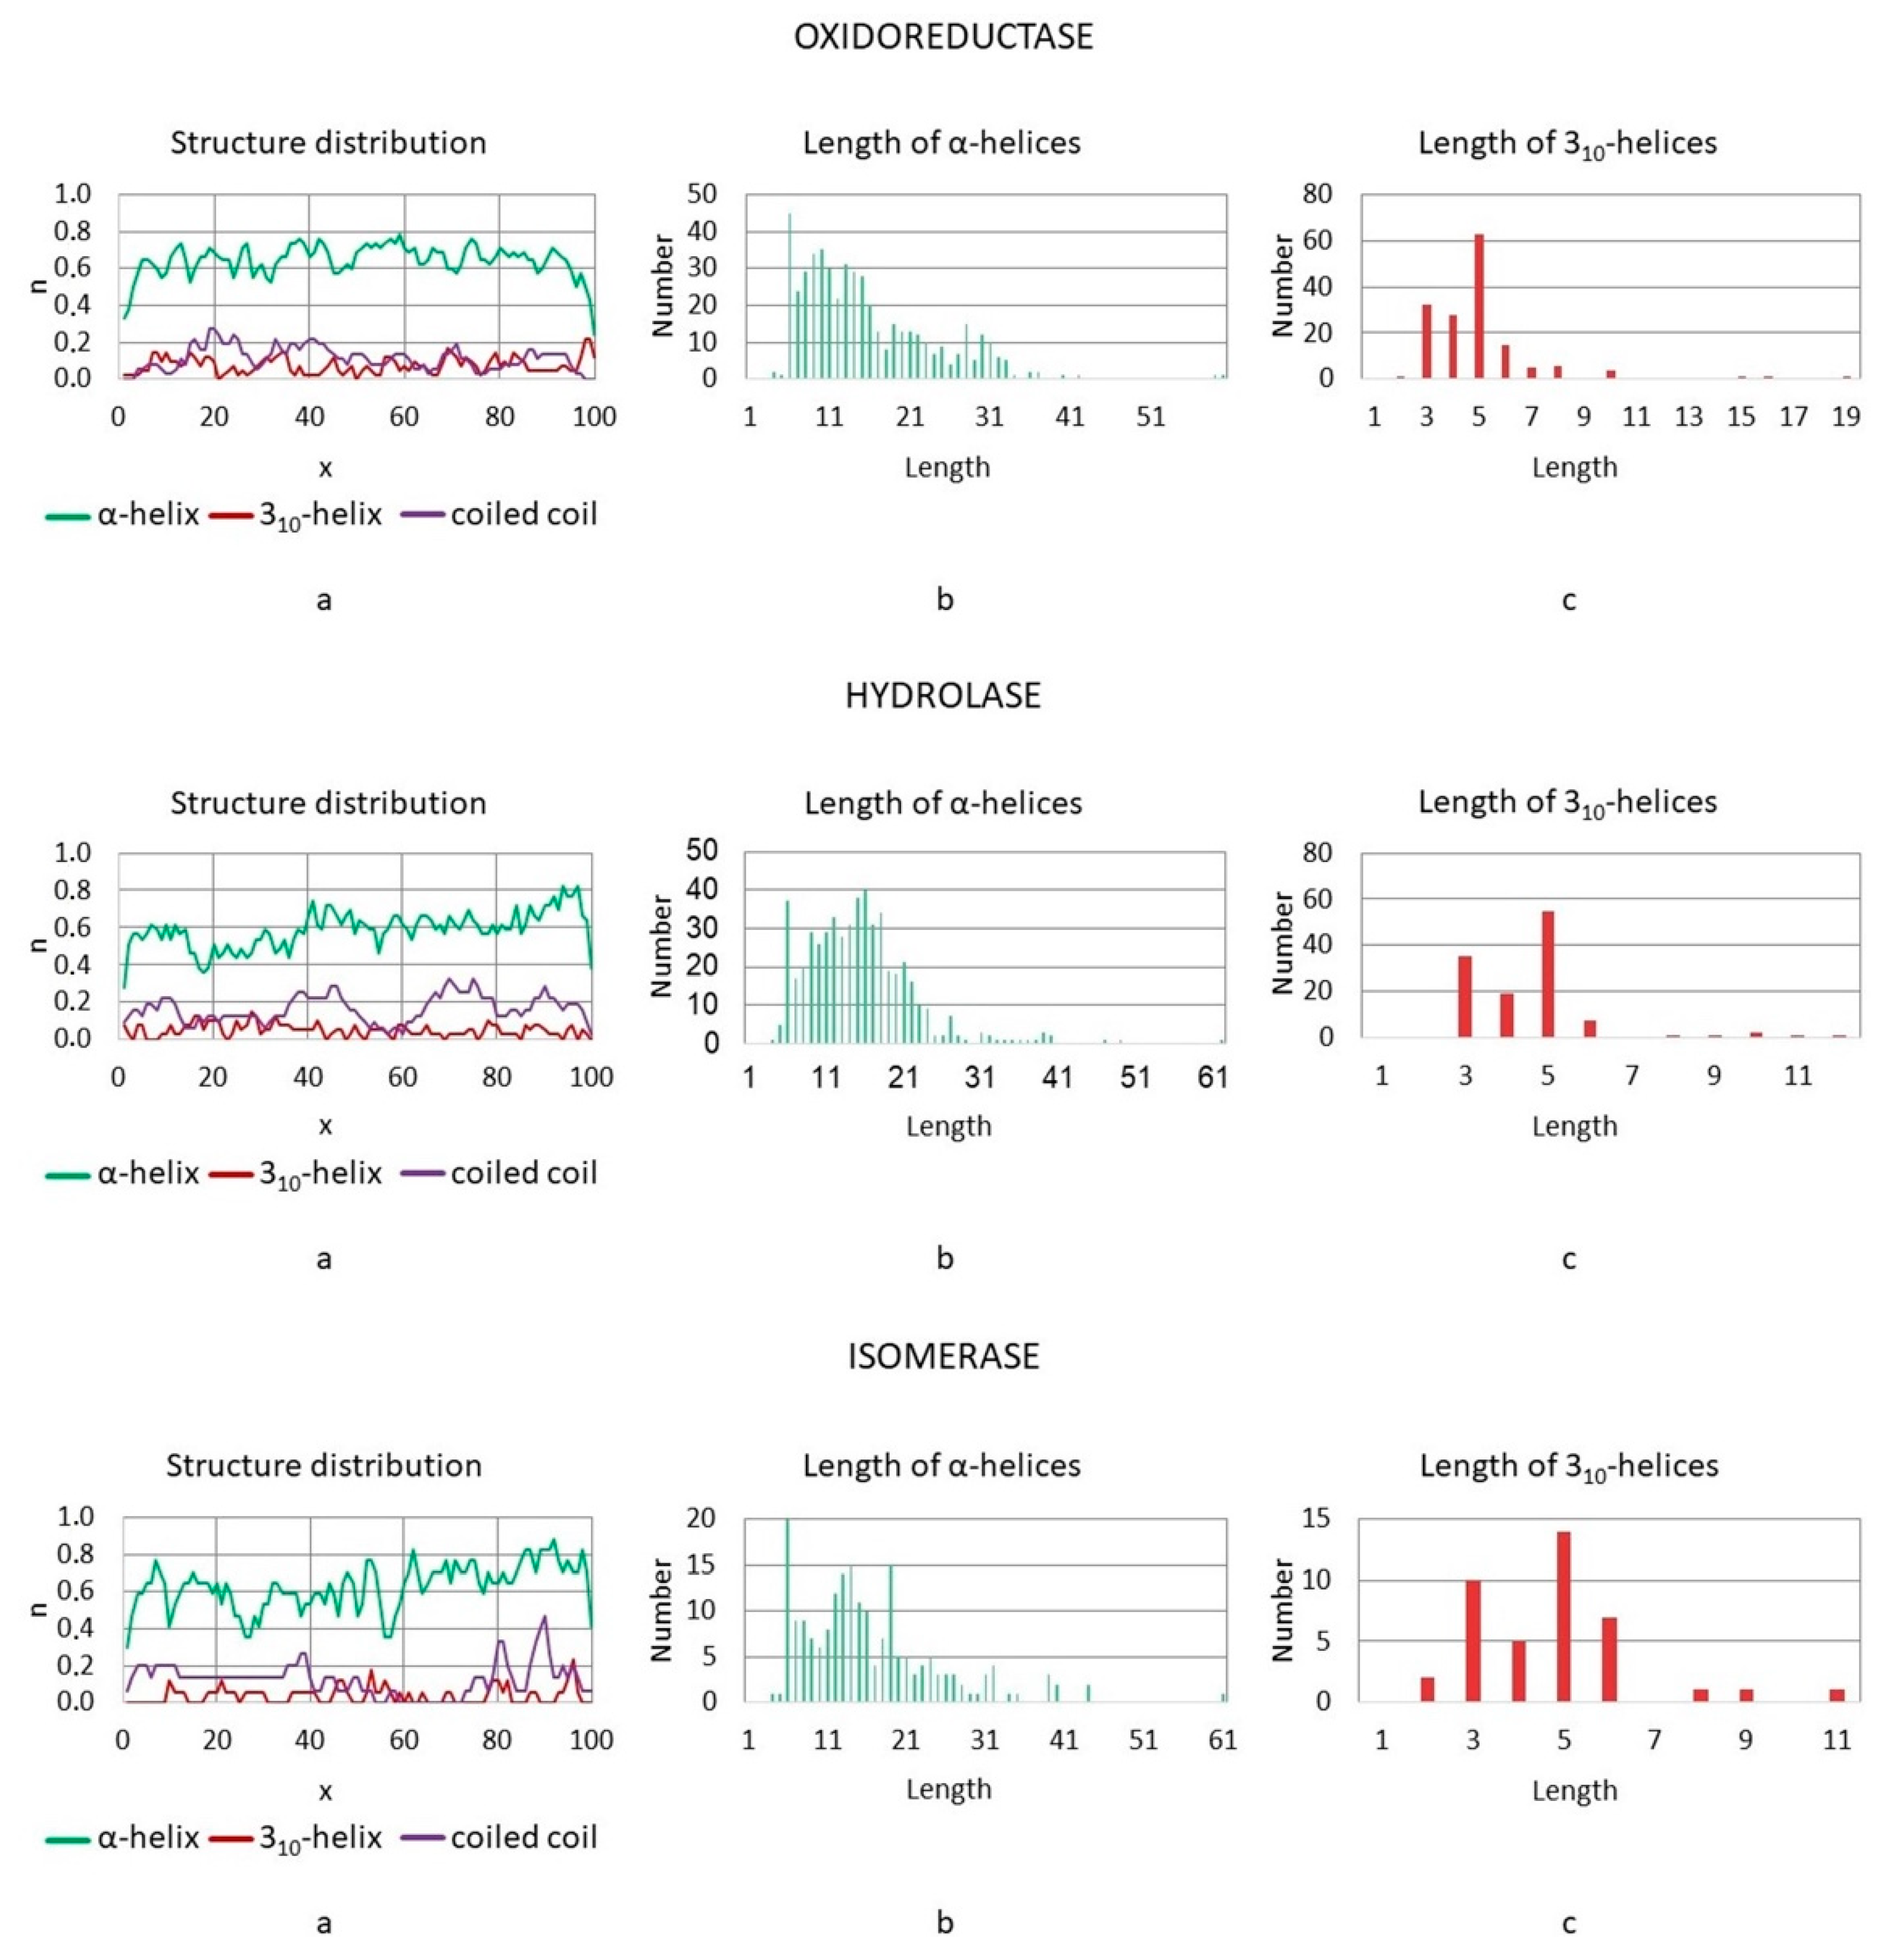
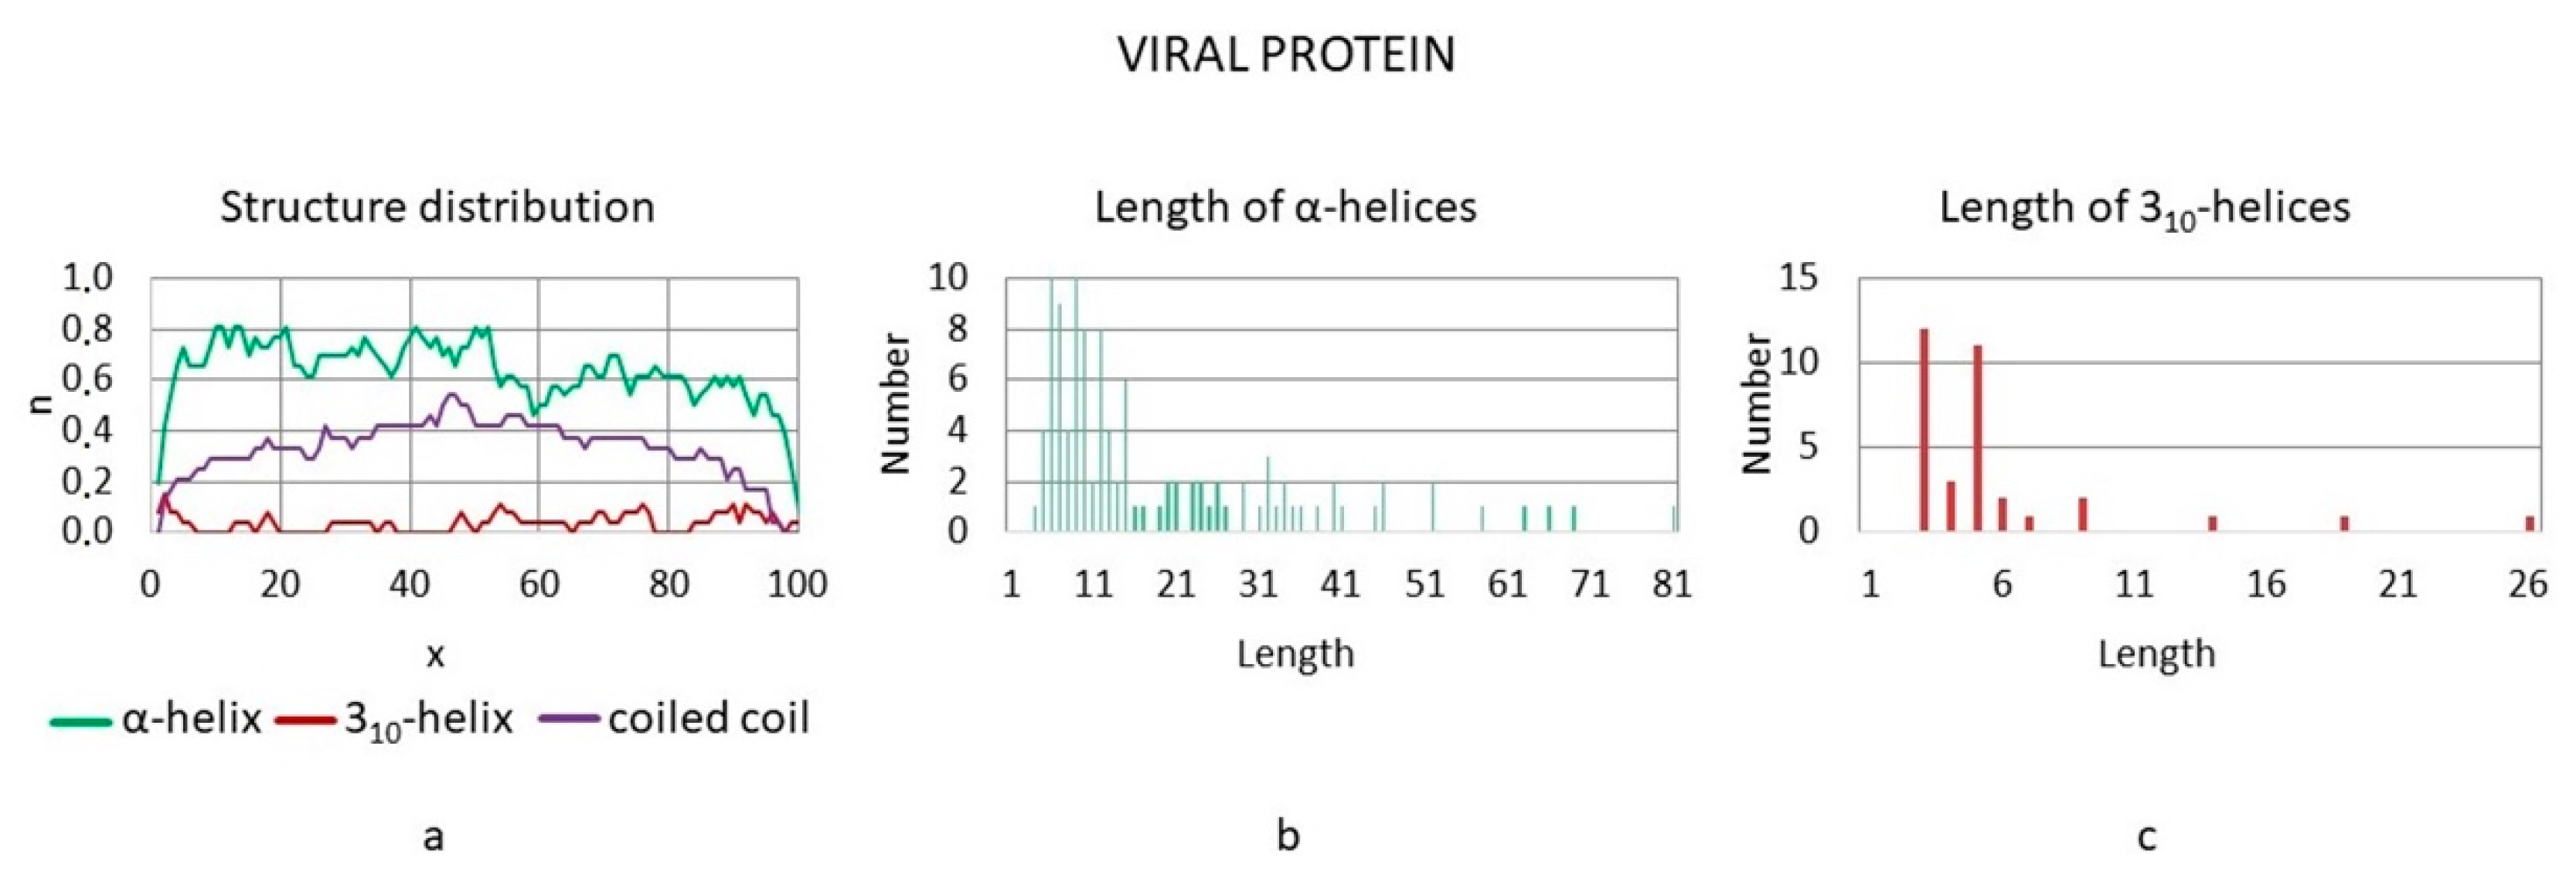
3.3. Distributions of Helical and Superhelical Structures in Polypeptide Chains

In addition to the previously obtained results [49], the distribution of secondary helical structures and coiled coils in the polypeptide chains of proteins of eight functional classes: virus protein, chaperone, oxidoreductase, hydrolase, structural proteins, exocytosis/endocytosis proteins, and electron transport proteins were analyzed. Proteins were selected using the PDB [45] and CC+ [46] databases. We considered the proteins with the presence of the coiled-coil structures according to the CC+ database. The number of structures considered in each class was determined by the number and availability of structures in the mentioned databases. For processing files in the (.pdb) format, a special algorithm was developed and implemented as a program in the C++ language. The results of the analysis are presented as charts of secondary structure and coiled-coil structure distribution along the protein chain.

3.3.1. Enzymes

To identify patterns in the distribution of helices and coiled coils along the polypeptide chain, 141 polypeptide chains of oxidoreductases, 90 polypeptide chains of hydrolases, and 39 polypeptide chains of isomerases were considered. The distribution of helical and superhelical structures along the polypeptide chain, as well as the distribution of the lengths of α-helices and 3 10 -helices are shown in Figure 7.
In the class of oxidoreductases, no clear patterns were found in the distribution of helical secondary structures along the polypeptide chain. The α-helices are distributed evenly. The probability of observing these structures belongs to the range from 0.52 to 0.79 (here and below, the values are given for the chains excluding the ends). Coiled-coil structures in this class are not numerous, and they are distributed evenly. This is probably due to the functional features of these proteins: perhaps they do not require the mechanical strength that coiled coils provide.
In the studied hydrolases, the probability of observing α-helices increases as they approach the C-terminus, and it reaches a value of 0.82. Coiled coils are more common in this class than in oxidoreductases. It is possible to distinguish sections of the chain where the probability of detecting superhelical structures is higher. The lack of clear patterns in the distribution of helices in this class may be due to the specificity of the interaction between the enzyme and the substrate. The presence of regions with a relatively high concentration of supercoiled structures can determine the local demand of the molecule for rigid structures.
In the considered isomerases, the probability of detecting α-helices also increases as the C-terminus of the polypeptide chain is approached. The percentage of α-helices in the studied isomerases is the highest among the considered enzyme classes. The probability of their observation lies in the range from 0.35 to 0.88. There are few coiled-coil structures in isomerases, and their distribution along the polypeptide chain shows long-term minima. The maxima of the probability of the appearance of coiled coils coincide with the places of noticeable accumulation of α-helices, especially at the C-terminus of the chain. Probably, this distribution indicates their binding to the active center at one of the ends.
Thus, no clear patterns in the distribution of α-helices were found in enzymes, and there are few coiled-coil structures in these classes. This is probably since the enzymes must ensure the specificity of the reactions and not have the same structure for the entire class.

3.3.2. Viral Proteins
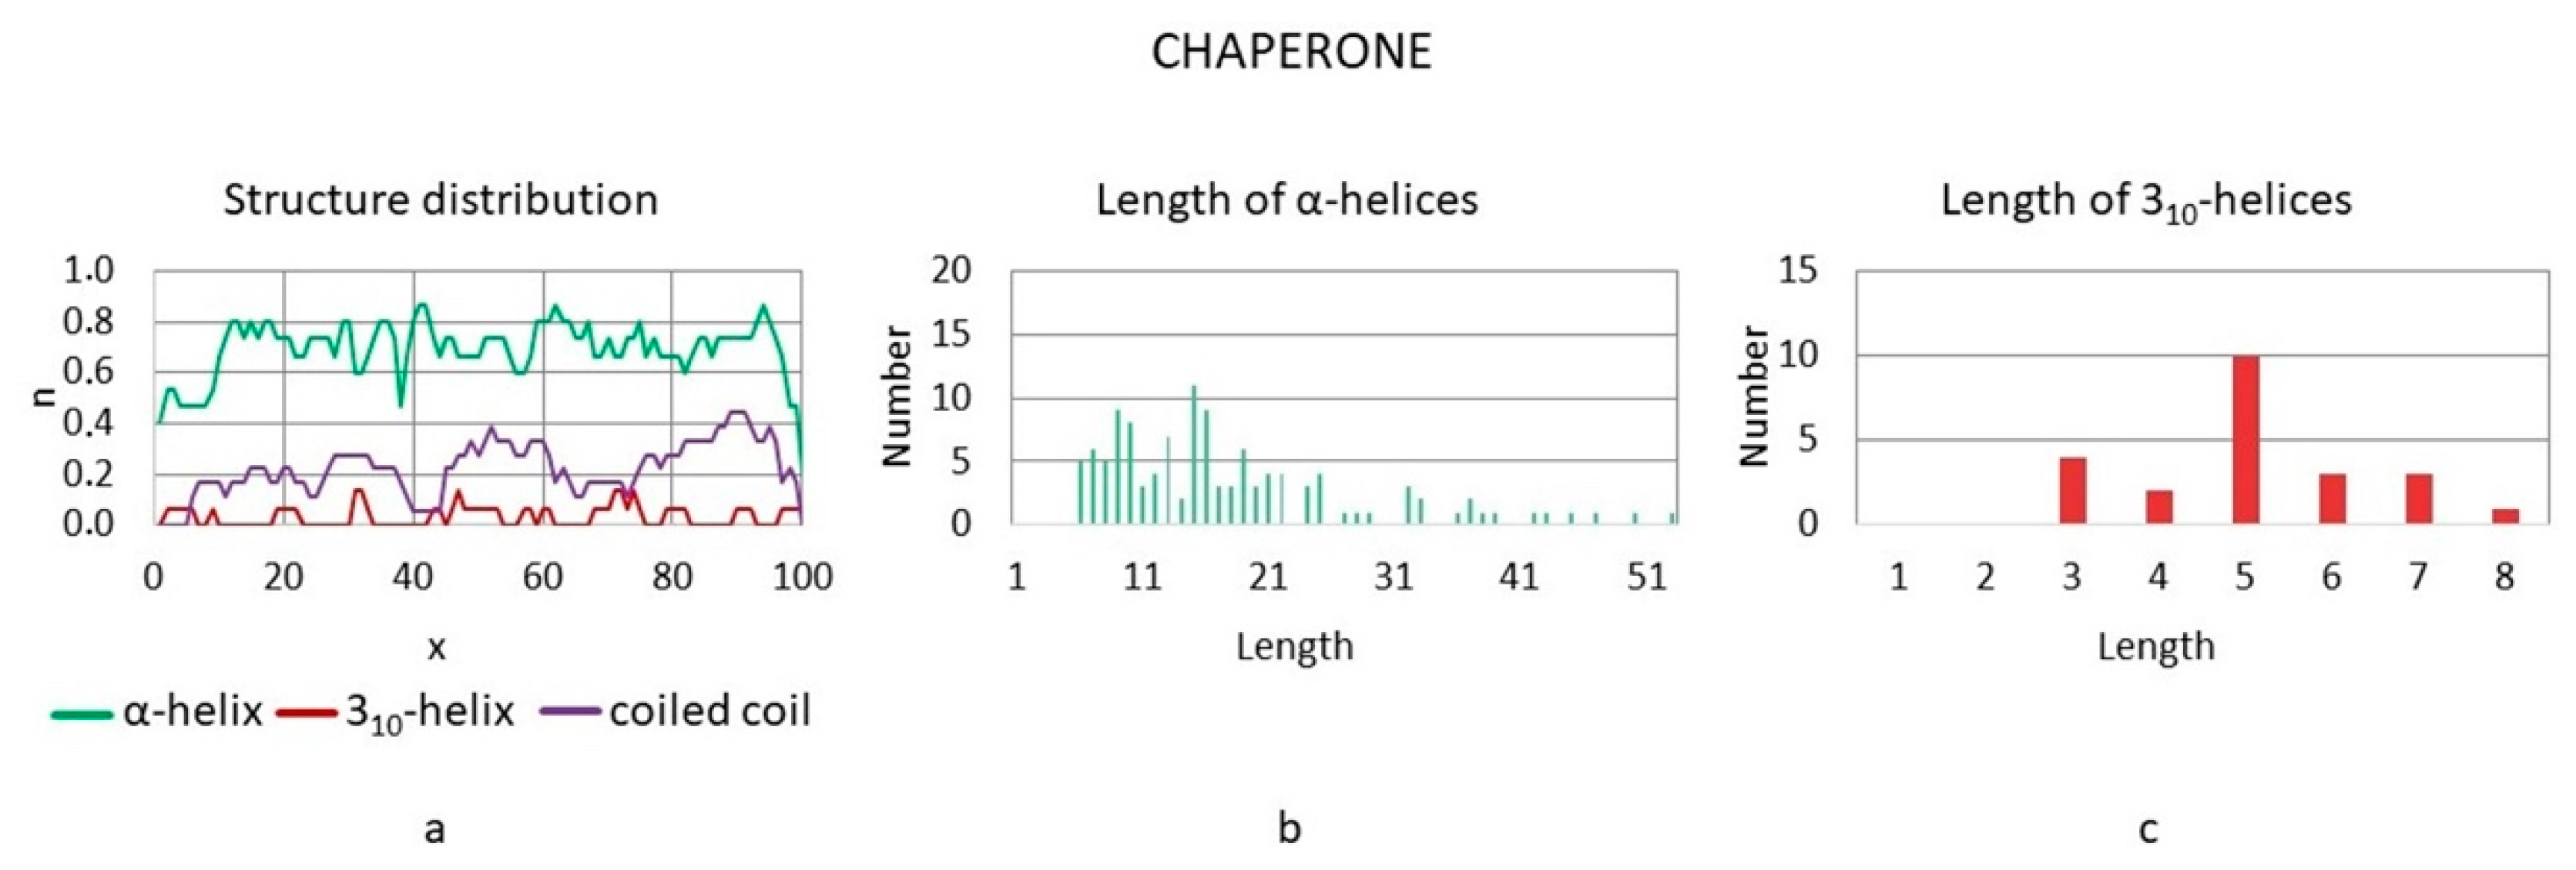
A total of 109 polypeptide chains of viral proteins were considered. The distribution of helical and superhelical structures along the polypeptide chain of viral proteins, as well as the distribution of the lengths of α-helices and 3 10 -helices are shown in Figure 8.
In this class, a high percentage of α-helices was found throughout the entire primary protein chain. The probability of observing α-helical structures lies in the range from 0.46 to 0.81. The proteins studied are rod-shaped molecules. The abundance of α-helices distributed along the primary chain may explain the rod-like structure of many molecules, which determines their strength for the rigid capsid formation. The viral proteins also showed a high content of coiled-coil structures along the entire chain, while the probability of detection increases closer to the center of the chain and reaches a maximum of 0.54. The formation of coiled coils often involves α-helices belonging to different polypeptide chains. Therefore, such coiled-coil structures can be classified as belonging to the protein quaternary structure. A large number of α-helices and coiled coils may reflect the peculiarities of interaction with an infected cell.

3.3.3. Chaperones

A total of 40 polypeptide chains of viral proteins were considered. The distribution of helical and superhelical structures along the polypeptide chain of chaperones, as well as the distribution of the lengths of α-helices and 3 10 -helices are shown in Figure 9.
The probability of observing α-helical structures in chaperones lies in the range from 0.47 to 0.87 (at the ends of the polypeptide chain, the minimum probability value is 0.2), and the median value is 0.73.
The probability of detecting coiled-coil structures increases closer to the C-terminus. In this class, coiled-coil structures are distributed by domains throughout the entire chain, which can provide fragmentary local rigidity of molecules that essentially have the functions and features of transformer constructs.

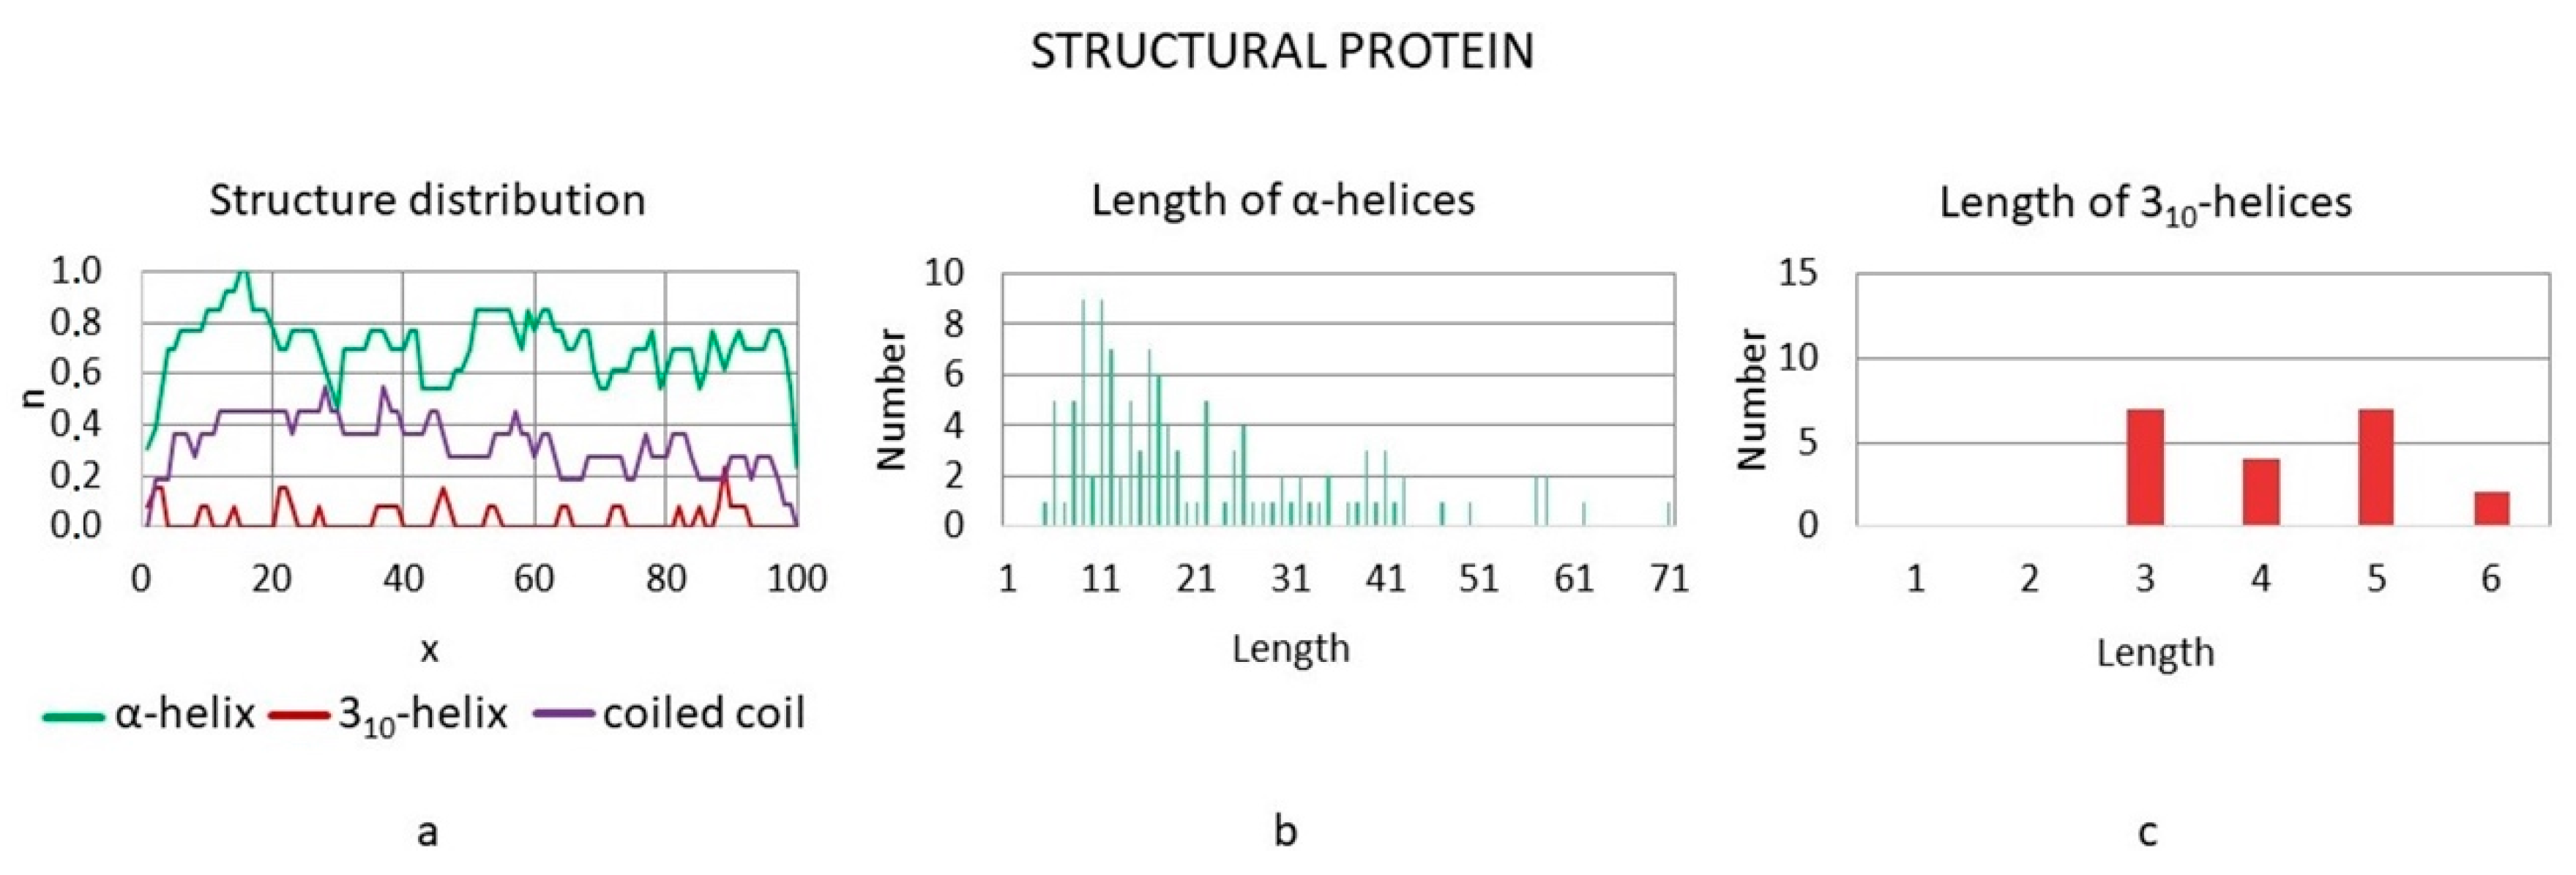
3.3.4. Structural Proteins

To identify patterns in the distribution of helices and coiled coils along the polypeptide chain, 29 polypeptide chains of structural proteins were considered. The distribution of helical and superhelical structures along the polypeptide chain of structural proteins, as well as the distribution of the lengths of α-helices and 3 10 -helices are shown in Figure 10.
In structural proteins, a high percentage of α-helices was found throughout the entire primary protein chain. The probability of observing α-helical structures lies in the range from 0.46 to 1 (at the ends of the polypeptide chain, the minimum probability value is 0.23). The presence of rather long α-helices is naturally consistent with functional features. A large number of helices provides a rigid structure for the entire molecule, which is certainly important for structural proteins responsible for the mechanical strength of the cell. Several minima of the probability of detecting α-helices, coinciding with the maxima of the probability of detecting irregular structures, can provide mechanical mobility of the molecule in certain places. Structural proteins are characterized by a uniform distribution of coiled coils throughout the entire chain. However, the probability of the appearance of such a structure gradually decreases toward the C-terminus.

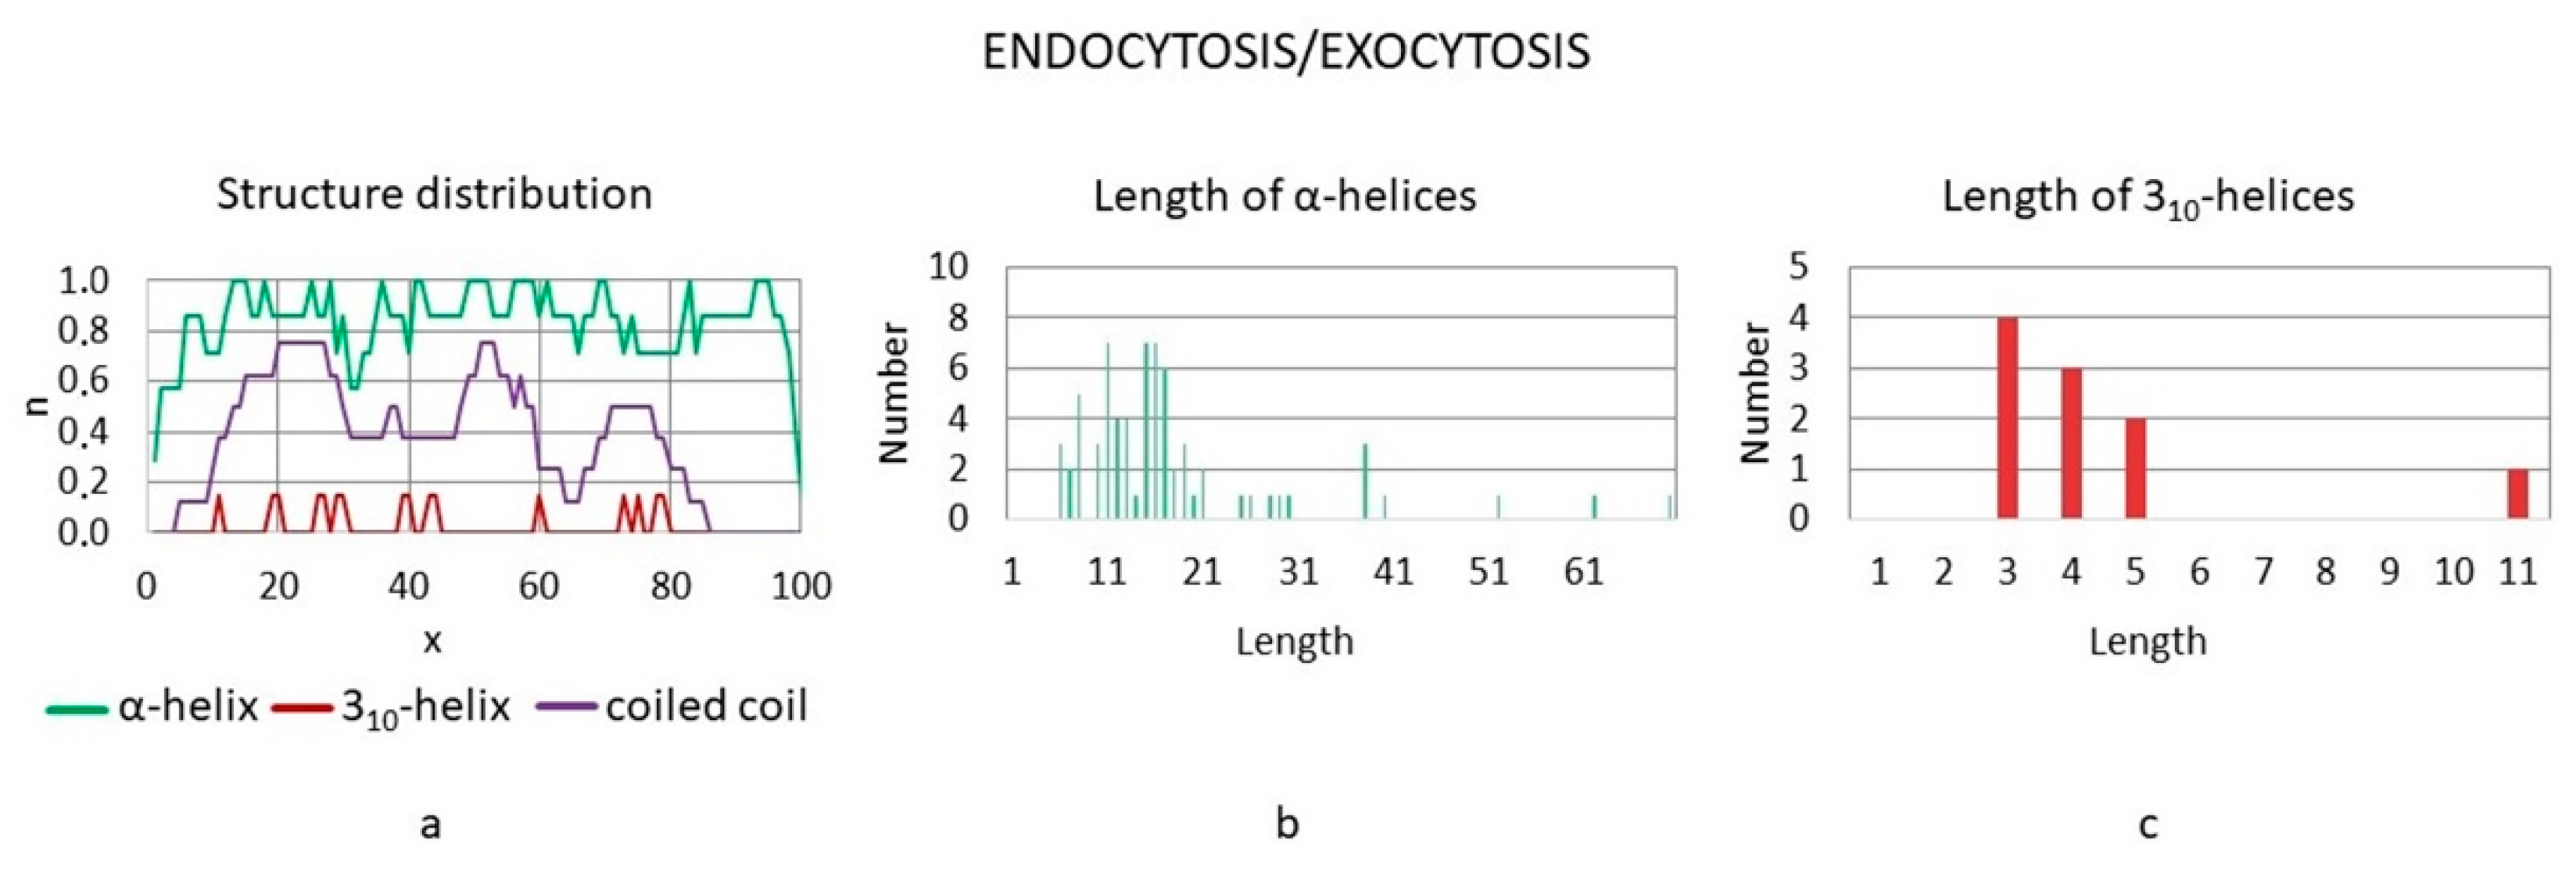
3.3.5. Exocytosis/Endocytosis Proteins

To identify patterns in the distribution of helices and coiled coils along the polypeptide chain, nine polypeptide chains of exocytosis/endocytosis proteins were considered. The distribution of helical and superhelical structures along the polypeptide chain of structural proteins, as well as the distribution of the lengths of α-helices and 3 10 -helices are shown in Figure 11.
In the considered exocytosis/endocytosis proteins, regions of the polypeptide chain were detected where the probability of detecting an α-helix is equal to 1. That is, α-helices are present in all studied proteins in this region of the polypeptide chain. The minimum value of the probability of observing α-helical structures is 0.57, and the median value is 0.86. The coiled-coil structures in exocytosis/endocytosis proteins are located in three large domains and are completely absent at both ends of the molecules. Such structure distribution can provide local rigidity of molecules as elements of mechanical structures, which is necessary for the formation of vesicles. Among the structures considered are t-SNAREs and v-SNAREs, in which helices play a crucial role in functioning.

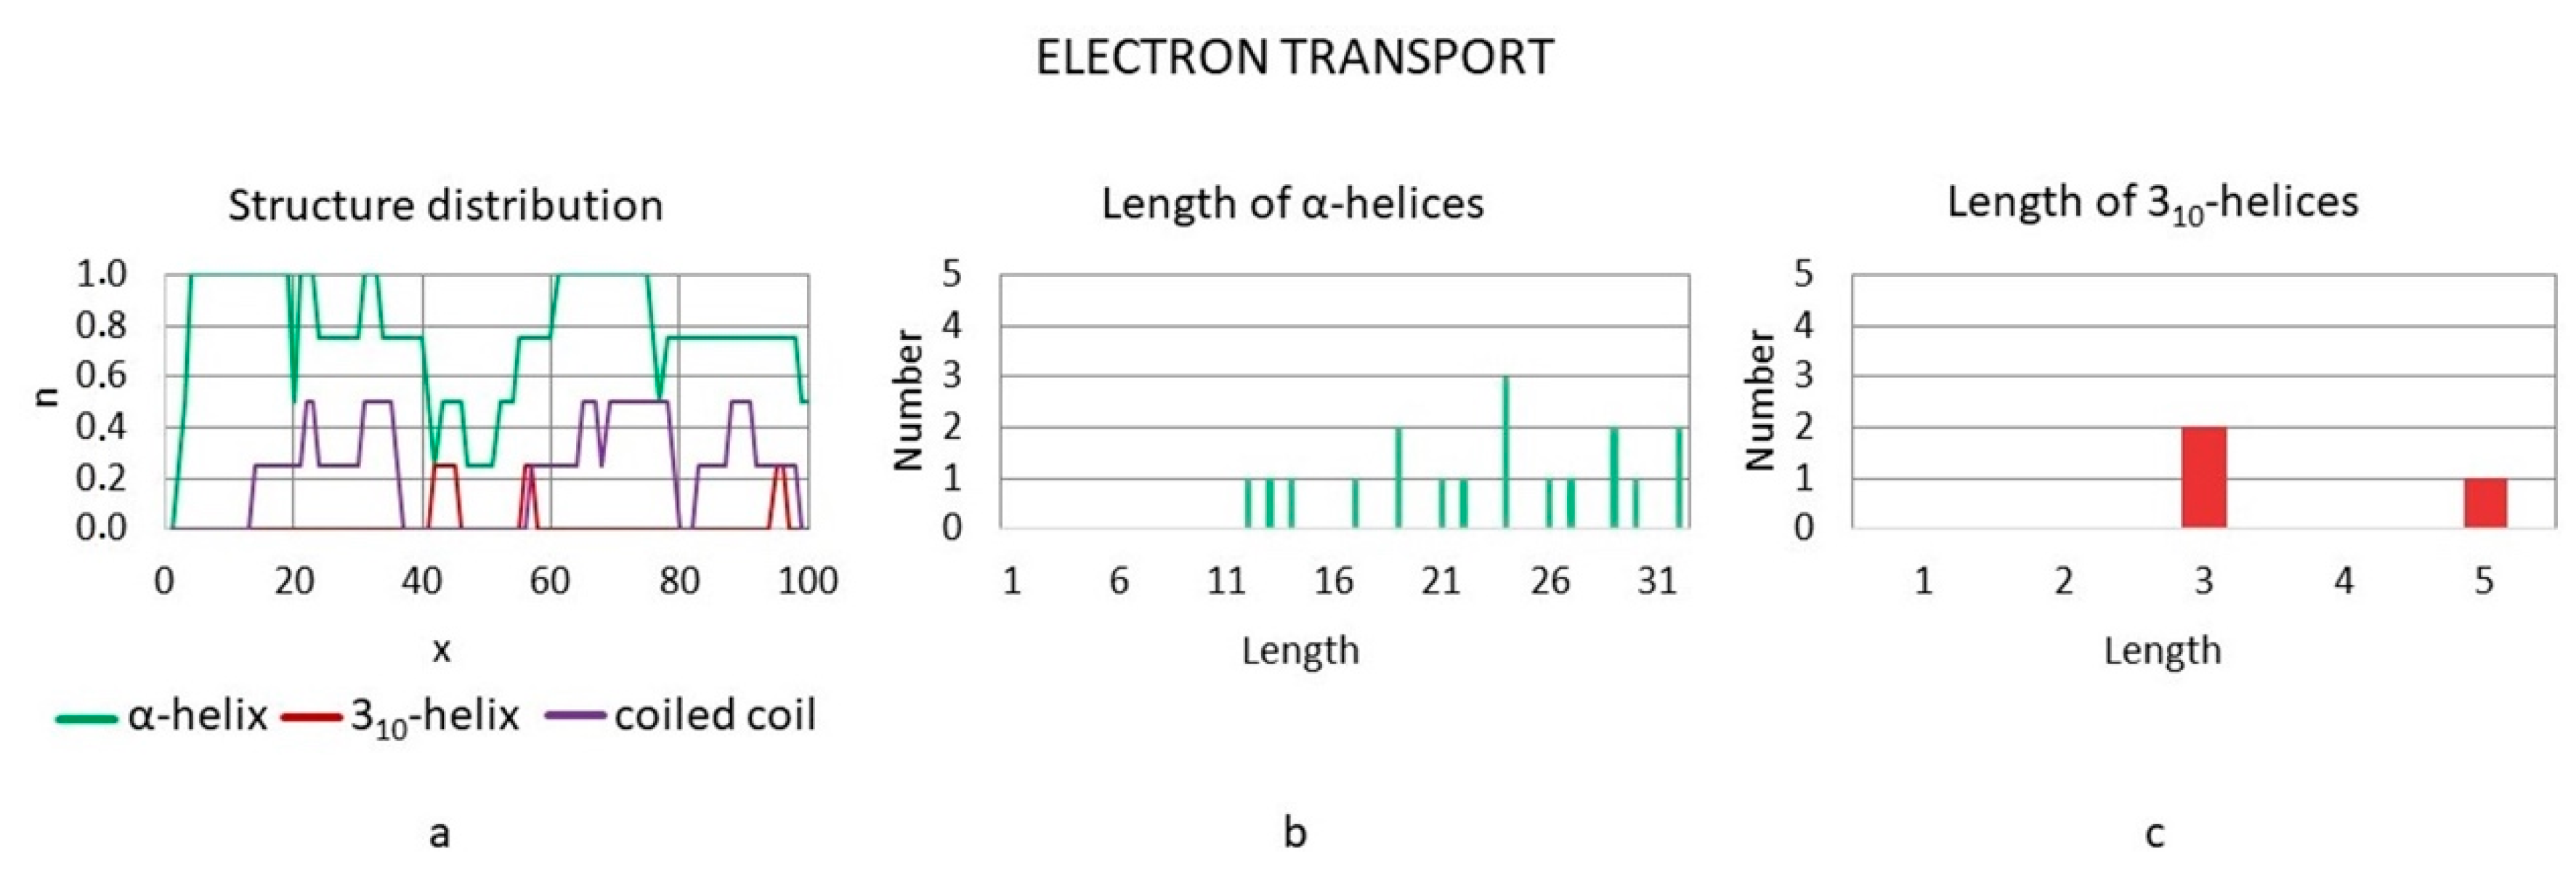
3.3.6. Electron Transport Proteins

To identify patterns in the distribution of helices and coiled coils along the polypeptide chain, eight polypeptide chains of electron transport proteins were considered. The distribution of helical and superhelical structures along the polypeptide chain of structural proteins, as well as the distribution of the lengths of α-helices and 3 10 -helices are shown in Figure 12.
As in exocytosis/endocytosis proteins, a plateau of α-helices can be observed in electron transport proteins, where the probability of detecting an α-helix is 1. The presence of regions rich in α-helices is probably associated with their location in the membrane. In this class, there are regions with a minimal probability of detecting coiled coils at the N-terminus, as well as in the middle of the polypeptide chain. Perhaps this feature allows proteins to change conformation.
It should be noted that, in all studied classes, the maxima of the probability of appearance of 3 10 -helices coincide with the minima of the probability of α-helices appearance. In general, the percentage of 3 10 -helices in the considered protein classes are low. Only in a few classes, the probability of their detection is more than 0.2. In general, 3 10 -helices are found in the form of rather short structures, but in some classes (isomerases, hydrolases, oxidoreductases), helices of more than 10 amino acid residues are found. Based on the presented charts, a common property observed in proteins of the studied groups was revealed: the predominance of irregular regions at the beginning and at the end of polypeptide chains, which is consistent with the simplified concept of a protein globule as a hydrophobic nucleus in a hydrophilic envelope.

4. Discussion

A topical issue in the field of molecular biophysics is the question of the quantitative evaluation of chiral transformations not only in the named helical and superhelical structures but also in the irregular structures connecting them, as well as the quantitative evaluation of the protein globule chirality [50,51,52,53,54]. The presented methods for quantitative analysis of the chirality of protein helical and superhelical structures are distinguished by the small amount of information required for its use, as well as by the relative simplicity of calculations. For all proteins studied, α-helices and 3 10 -helices are mainly represented by right-handed structures: left-handed α-helices make up 0.06% of the total number of α-helices, and left-handed 3 10 -helices—4.6% of the total number of 3 10 -helices. The obtained results of the analysis of the α-helices and 3 10 -helices axes made it possible to confirm the general trend of the chirality sign of the right-handed and left-handed secondary structures of proteins. All studied coiled-coil structures were left-handed. The results obtained fully confirm the concept of a change in the symmetry types associated with the chirality sign-alternation during the transition to the next hierarchical level from helical to superhelical structures [11,12].
Apparently, among the models known from the scientific literature [26,27,28,29,30,31,32,33,34,35,36,37,38,39,40,41,42,43,44], the presented approaches most adequately describe the features of helical structures as chiral formations. These approaches, tested on protein regular helical structures, are planned to be further developed for the analysis of β-structures and irregular secondary structures.
Also, in this work, we analyzed the location of secondary helical structures (α-helices and 310-helices) and coiled-coil structures along the polypeptide chains. The features common to all studied classes and typical for each protein class are revealed. A quantitative description of the spatial characteristics and locations of regular chiral intra- and supramolecular structures of proteins is significant for understanding the mechanisms of specific functioning of proteins of different classes and is also a necessary stage in the development of the general theory of molecular machines as chiral hierarchical structures.

5. Patents

Patent resulting from the work reported in this manuscript: ECPHS RU2021613546 (to A.E.S., A.O.L., D.K.S.)

Author Contributions

Conceptualization, A.E.S. and E.V.M.; methodology, A.E.S. and E.V.M.; software, A.O.L., D.K.S., and O.E.B.; validation, A.O.L., D.K.S., and O.E.B.; investigation, A.O.L., D.K.S., and O.E.B.; writing, A.E.S. and E.V.M.; visualization, A.O.L., D.K.S., and O.E.B.; supervision, A.E.S. and E.V.M. All authors have read and agreed to the published version of the manuscript.

Funding

This work was supported in part by the Russian Science Foundation, grant no. 19-74-00082 (to E.V.M.) and the Interdisciplinary Scientific and Educational School of Moscow University “Fundamental and Applied Space Research”.

Institutional Review Board Statement

Not applicable.

Informed Consent Statement

Not applicable.

Data Availability Statement

Publicly available datasets were analyzed in this study. This data can be found here: http://www.rcsb.org (accessed on 13 May 2021); http://coiledcoils.chm.bris.ac.uk/ccplus/search/ (accessed on 13 May 2021).

Acknowledgments

We are grateful to V.A. Tverdislov for useful discussions.

Conflicts of Interest

The authors declare no conflict of interest.

Appendix A

Table A1. The calculated parameters of coiled-coil structures.
Protein ClassProtein PDB IDHelix QuantityLengths of Helixes (A.a.)Av. CosineAv. AngleChirality Sign (L–Left-Handed, R–Right-Handed)
Hydrolase1AQT215−0.653130.762L
1AYX215−0.836146.684L
1FS0225−0.825145.588L
1H12212−0.968165.455L
1HUF212−0.896153.688L
1K46212−0.895153.535L
1KS8212−0.989171.387L
1L1Y212−0.995174.296L
1LF9215−0.662131.436L
1S4B218−0.882151.825L
1WCH212−0.752138.743L
1WP9215−0.849148.050L
1XZQ219−0.666131.735L
1XZQ215−0.920156.955L
1YVW218−0.999177.619L
1YXB215−0.870150.500L
2A8Z212−0.783141.528L
2A9U212−0.761139.538L
2C6F215−0.895153.452L
2CBJ219−0.687133.432L
2CFU212−0.930158.467L
2CLY212−0.953162.345L
2EWF222−0.955162.815L
2GTQ212−0.843147.444L
2HLD222−0.870150.451L
Oxidoreductase1AFR212−0.564124.312L
1EZV215−0.965164.724L
1FYZ215−0.863149.661L
1GU2212−0.942160.418L
1H0O215−0.975167.093L
1IS2212−0.857149.013L
1JKU219−0.987170.838L
1MHY215−0.963164.298L
1NG3212−0.855148.812L
1OTK215−0.848148.023L
1PHZ212−0.921157.041L
1R2F212−0.561124.148L
1U6I212−0.969165.689L
1YQ9212−0.967165.141L
1YUX225−0.810144.082L
1ZA0219−0.991172.268L
1ZOY212−0.718135.855L
2B0T212−0.444116.333L
2C2X215−0.971166.152L
2CWL212−0.927157.969L
2F1K215−0.946161.114L
2FYN215−0.915156.240L
2HKO229−0.998176.265L
Viral1EBO322−0.914157.015L
1EBO336−0.726136.569L
1EIA218−0.964164.508L
1EZJ440−0.426115.268L
1G2C329−0.960164.582L
1G5G347−0.970169.015L
1HTM355−0.977168.418L
1LJ2218−0.970165.910L
1LJ2219−0.984169.846L
1MG1329−0.941162.021L
1MOF329−0.967166.447L
1NO4236−0.876151.169L
1SFK218−0.875151.088L
1SLQ315−0.983170.282L
1SVF346−0.960165.161L
1WYY375−0.950165.976L
1ZTM329−0.874153.034L
1ZVB322−0.899155.777L
2BEQ326−0.931161.373L
2C9L229−0.655130.887L
2FXP328−0.927161.728L
2GUM315−0.874152.780L
Isomerase1A36218−0.946161.033L
1FP3218−0.872150.673L
1IHG212−0.843147.459L
1IIP248−0.811144.150L
1N1B212−0.897153.793L
1P5Q219−0.838146.898L
1P5Q212−0.736137.413L
1QZ2219−0.808143.890L
1QZ2212−0.866150.011L
1 × 94212−0.980168.509L
1XRS212−0.876151.123L
1YBZ232−0.824145.444L
1ZVU215−0.698134.264L
2D8E232−0.943160.643L
2FEL215−0.811144.154L
2NOV219−0.780141.220L
Chaperone1ELR212−0.826145.686L
1FXK236−0.775140.815L
1FXK239−0.696134.088L
1I6Z222−0.966165.006L
1ORJ219−0.927158.032L
1OX3332−0.966167.239L
1QVR215−0.949161.707L
1QZ2219−0.808143.890L
1SG2215−0.927157.908L
1XOU229−0.950161.774L
1YT1212−0.750138.560L
Structural1DEB236−0.796142.716L
1IO1232−0.865149.854L
1LUJ215−0.677132.604L
1R0D215−0.977167.644L
1U89218−0.997175.819L
1U89212−0.962164.187L
1WU9232−0.989171.630L
1 × 8Y265−0.925157.610L
2D4Y222−0.630129.025L
2D4Y215−0.990171.794L
2F6H218−0.735137.274L
Electron transport1B71215−0.946161.105L
1J30215−0.985169.947L
1LM3215−0.932158.825L
Exocytosis/endocytosis1HVV226−0.999177.304L
1L4A225−0.966164.976L
1URU218−0.946161.156L

References

  1. Pasteur, L. Recherches sur les relations qui peuvent exister entre la forme crystalline, la composition chimique et le sens de la polarisation rotatoire. Ann. Chim. Phys. 1848, 24, 442–459. [Google Scholar]
  2. Schwartz, A.W. Origin of life. The origin of macromolecular chirality. Curr. Biol. 1994, 4, 758–760. [Google Scholar] [CrossRef]
  3. Podlech, J. Origin of organic molecules and biomolecular homochirality. Cell Mol. Life Sci. 2001, 58, 44–60. [Google Scholar] [CrossRef] [PubMed]
  4. Hein, J.E.; Blackmond, D.G.; On Kojić-Prodić, B.; Štefanić, Z. Symmetry versus Asymmetry in the Molecules of Life: Homomeric Protein Assemblies. Symmetry 2010, 2, 884–906. [Google Scholar] [CrossRef] [Green Version]
  5. Hein, J.E.; Blackmond, D.G. On the origin of single chirality of amino acids and sugars in biogenesis. Acc. Chem. Res. 2012, 45, 2045–2054. [Google Scholar] [CrossRef] [PubMed]
  6. Inaki, M.; Liu, J.; Matsuno, K. Cell chirality: Its origin and roles in left-right asymmetric development. Philos. Trans. R. Soc. Lond. B Biol. Sci. 2016, 371, 20150403. [Google Scholar] [CrossRef] [PubMed] [Green Version]
  7. Dorta-Urra, A.; Bargueño, P. Homochirality: A Perspective from Fundamental Physics. Symmetry 2019, 11, 661. [Google Scholar] [CrossRef] [Green Version]
  8. Blackmond, D.G. The Origin of Biological Homochirality. Cold Spring Harb. Perspect. Biol. 2019, 11, a032540. [Google Scholar] [CrossRef] [Green Version]
  9. Famiano, M.; Boyd, R.; Kajino, T.; Onaka, T.; Mo, Y. Astrophysical Sites that Can Produce Enantiomeric Amino Acids. Symmetry 2019, 11, 23. [Google Scholar] [CrossRef] [Green Version]
  10. Tverdislov, V.A. Chirality as a primary switch of hierarchical levels in molecular biological systems. Biophysics 2013, 58, 128–132. [Google Scholar] [CrossRef]
  11. Tverdislov, V.A.; Malyshko, E.V. On regularities of spontaneous formation of structural hierarchies in chiral systems of non-living and living nature. Phys. Uspekhi. 2019, 189, 375–385. [Google Scholar] [CrossRef]
  12. Tverdislov, V.A.; Malyshko, E.V. Chiral Dualism as an Instrument of Hierarchical Structure Formation in Molecular Biology. Symmetry 2020, 12, 587. [Google Scholar] [CrossRef] [Green Version]
  13. Pauling, L.; Corey, R.B. Two hydrogen-bonded spiral configurations of the polypeptide chain. J. Am. Chem. Soc. 1950, 72, 5349. [Google Scholar] [CrossRef]
  14. Pauling, L.; Corey, R.B. The structure of synthetic polypeptides. Proc. Natl. Acad. Sci. USA 1951, 37, 241–250. [Google Scholar] [CrossRef] [PubMed] [Green Version]
  15. Pauling, L.; Corey, R.B. A proposed structure for the nucleic acids. Proc. Natl. Acad. Sci. USA 1953, 39, 84–97. [Google Scholar] [CrossRef] [PubMed] [Green Version]
  16. Pauling, L.; Corey, R.B. The pleated sheet, a new layer configuration of polypeptide chains. Proc. Natl. Acad. Sci. USA 1951, 37, 2451–2456. [Google Scholar] [CrossRef] [Green Version]
  17. Branden, C.; Tooze, J. Introduction to Protein Structure, 2nd ed.; Garland Publishing: New York, NY, USA, 1999; 410p. [Google Scholar]
  18. Novotny, M.; Kleywegt, G.J. A Survey of Left-handed Helices in Protein Structures. J. Mol. Biol. 2005, 347, 231–241. [Google Scholar] [CrossRef] [PubMed]
  19. Barlow, D.J.; Thornton, J.M. Helix geometry in proteins. J. Mol. Biol. 1988, 201, 601–619. [Google Scholar] [CrossRef]
  20. Herzberg, O.; Moult, J. Analysis of steric strain in the polypeptide backbone of protein models. Proteins 1991, 11, 223–229. [Google Scholar] [CrossRef]
  21. Petock, J.M.; Torshin, I.Y.; Weber, I.T.; Harrison, R.W. Analysis of protein structures reveals regions of rare backbone conformation at functional sites. Proteins 2003, 53, 872–879. [Google Scholar] [CrossRef]
  22. Crick, F.H.C. The packing of α-helices: Simple coiled-coils. Acta Cryst. 1953, 6, 689–697. [Google Scholar] [CrossRef] [Green Version]
  23. Lupas, A.; Gruber, M. The structure of alpha-helical coiled coils. Adv. Protein. Chem. 2005, 70, 37–78. [Google Scholar] [CrossRef] [PubMed]
  24. Hartmann, M.D.; Mendler, C.T.; Bassler, J.; Karamichali, I.; Ridderbusch, O.; Lupas, A.N.; Alvarez, B.H. α/β Coiled coils. eLife 2016, 5, e11861. [Google Scholar] [CrossRef] [Green Version]
  25. Mortenson, D.E.; Steinkruger, J.D.; Kreitler, D.F.; Perroni, D.V.; Sorenson, G.P.; Huang, L.; Mittal, R.; Yun, H.G.; Travis, B.R.; Mahanthappa, M.K.; et al. High-resolution structures of a heterochiral coiled coil. Proc. Natl. Acad. Sci. USA 2015, 112, 13144–13149. [Google Scholar] [CrossRef] [Green Version]
  26. Mezey, P. Chirality Measures and Graph Representations. Comput. Math. Appl. 1997, 34, 105–112. [Google Scholar] [CrossRef] [Green Version]
  27. Zabrodsky, H.; Peleg, S.; Avnir, D. Continuous symmetry measures. J. Am. Chem. Soc. 1992, 114, 7843–7851. [Google Scholar] [CrossRef]
  28. Zabrodsky, H.; Peleg, S.; Avnir, D. Symmetry as a Continuous Feature. IEEE Trans. Pattern Anal. 1995, 17, 1154–1166. [Google Scholar] [CrossRef] [Green Version]
  29. Pinsky, M.; Dryzun, C.; Casanova, D.; Alemany, P.; Avnir, D. Analytical methods for calculating continuous symmetry measures and the chirality measure. J. Comput. Chem. 2008, 29, 2712–2721. [Google Scholar] [CrossRef]
  30. Luzanov, A.V. Simple one-electron invariants of molecular chirality. J. Math. Chem. 2006, 41, 417–435. [Google Scholar] [CrossRef]
  31. Randic, M.; Razinger, M. Molecular shapes and chirality. J. Chem. Inf. Comp. Sci. 1996, 36, 429–441. [Google Scholar] [CrossRef]
  32. Randic;, M. Graph theoretical descriptors of two-dimensional chirality with possible extension to three-dimensional chirality. J. Chem. Inf. Comput. Sci. 2001, 41, 639–649. [Google Scholar] [CrossRef] [PubMed]
  33. Zhao, T.; Zhang, Q.; Long, H.; Xu, L. Graph theoretical representation of atomic asymmetry and molecular chirality of benzenoids in two-dimensional space. PLoS ONE 2014, 9, e102043. [Google Scholar] [CrossRef]
  34. Gilat, G. Chiral coefficient-a measure of the amount of structural chirality. J. Phys. A Math. Gen. 1989, 22, L545–L550. [Google Scholar] [CrossRef]
  35. Kuz’min, V.E.; Stel’makh, B.; Bekker, M.B.; Pozigun, D.V. Quantitative aspects of chirality. I. Method of dissymmetry function. J. Phys. Org. Chem. 1992, 5, 295–298. [Google Scholar] [CrossRef]
  36. Ramachandran, G.N.; Ramakrishnan, C.; Sasisekharan, V. Stereochemistry of polypeptide chain configurations. J. Mol. Biol. 1963, 7, 95–99. [Google Scholar] [CrossRef]
  37. Ramachandran, G.N.; Sasiskharan, V. Conformation of polypeptides and proteins. Adv. Protein Chem. 1968, 23, 283–437. [Google Scholar] [CrossRef] [PubMed]
  38. Mannige, R. An exhaustive survey of regular peptide conformations using a new metric for backbone handedness (h). PeerJournal 2017, 5, e3327. [Google Scholar] [CrossRef]
  39. Petitjean, M. Chirality and Symmetry Measures: A Transdisciplinary Review. Entropy 2003, 5, 271–312. [Google Scholar] [CrossRef]
  40. Petitjean, M. On the root mean square quantitative chirality and quantitative symmetry measures. J. Math. Phys. 1999, 40, 4587–4595. [Google Scholar] [CrossRef] [Green Version]
  41. Petitjean, M. Chiral mixtures. J. Math. Phys. 2002, 43, 4147–4157. [Google Scholar] [CrossRef] [Green Version]
  42. Fraser, R.D.B.; MacRae, T.P. Conformation in Fibrous Proteins and Related Synthetic Polypeptides, 1st ed.; Academic Press: New York, NY, USA, 1973; 628p. [Google Scholar]
  43. Phillips, G.N. What is the pitch of the α-helical coiled coil? Proteins 1992, 14, 425–429. [Google Scholar] [CrossRef]
  44. Neukirch, S.; Goriely, A.; Hausrath, A.C. Chirality of coiled-coils: Elasticity matters. Phys. Rev. Lett. 2008, 100, 038105. [Google Scholar] [CrossRef] [PubMed] [Green Version]
  45. RCSB PDB. Available online: http://www.rcsb.org (accessed on 1 March 2021).
  46. CC+ Database. Available online: http://coiledcoils.chm.bris.ac.uk/ccplus/search/ (accessed on 1 March 2021).
  47. Sidorova, A.E.; Malyshko, E.V.; Kotov, A.R.; Tverdislov, V.A.; Ustinin, M.N. Quantitative Criteria of Chirality in Hierarchical Protein Structures. Biophysics 2019, 64, 155–166. [Google Scholar] [CrossRef]
  48. Nautiyal, S.; Alber, T. Crystal structure of a designed, thermostable, heterotrimeric coiled coil. Protein Sci. 1999, 8, 84–90. [Google Scholar] [CrossRef] [PubMed]
  49. Malyshko, E.V.; Bagrova, O.E.; Tverdislov, V.A. The relationship between hierarchical chiral structures of proteins and their functions. Biophysics 2020, 65, 368–373. [Google Scholar] [CrossRef]
  50. Efimov, A. Chirality and Handedness of Protein Structures. Biochemistry 2018, 83, S103–S110. [Google Scholar] [CrossRef]
  51. Zayit, A.; Pinsky, M.; Elgavi, H.; Dryzun, C.; Avnir, D. A web site for calculating the degree of chirality. Chirality 2011, 23, 17–23. [Google Scholar] [CrossRef]
  52. Plazinska, A.; Plazinski, W. Chirality Effects in Biomolecular Systems: Calculation of the Relative Free Energies by Molecular Dynamics Simulations. J. Chem. Inf. Model. 2020, 60, 5424–5436. [Google Scholar] [CrossRef] [PubMed]
  53. Partovi, T. Calculation of the Chirality in Solutions. Chem. Lett. 2012, 41, 760–762. [Google Scholar] [CrossRef]
  54. Fowler, P. Quantification of chirality: Attempting the impossible. Symmetry Cult. Sci. 2003, 16, 321–334. [Google Scholar]
Figure 1. Stages of graphical construction of triplets of vectors for calculating a mixed vector product. C—Cα atoms in the helix, used in the model as reference points; v1, v2—vectors between two neighboring reference points. Construction stages 1 and 2 are marked in green: (a) vectors v1, v2, v3; (b) vectors v2, v3, v4.
Symmetry 13 00879 g001
Figure 2. Schematic representation of the steps of the method for determining the chirality sign of the coiled-coil structure: (a) heterotrimeric coiled coil (PDB ID: 1BB1 [48]); (b) model structure of helices and helix axes; (c) middle helix; (d) superhelix axis.
Symmetry 13 00879 g002
Figure 3. Determination of the chirality sign of the coiled-coil structure by the angle between vectors vs. and vci.
Symmetry 13 00879 g003
Figure 4. Determination of the chirality sign of the coiled-coil structure.
Symmetry 13 00879 g004
Figure 5. Chirality map of protein helical structures. The horizontal axis is the chirality value. The vertical axis is the length of the secondary structure in amino acid residues. The yellow line (zero) is the dividing line of the helices according to the chirality sign: right-handed helices are above the yellow line; left-handed helices are below the line. All obtained values of chirality are non-zero.
Symmetry 13 00879 g005
Figure 6. Chirality map of protein superhelical structures.
Symmetry 13 00879 g006
Figure 7. (a) Distribution of helical and coiled-coil structures along the polypeptide chain of enzymes: abscissa—normalized coordinates, ordinate—the number of structures normalized to the total number of chains; (b) distribution of lengths of α-helices; (c) distribution of lengths of 3 10 -helices.
Symmetry 13 00879 g007
Figure 8. (a) Distribution of helical and coiled-coil structures along the polypeptide chain of viral protein: abscissa—normalized coordinates, ordinate—the number of structures normalized to the total number of chains; (b) distribution of lengths of α-helices; (c) distribution of lengths of 3 10 -helices.
Symmetry 13 00879 g008
Figure 9. (a) Distribution of helical and coiled-coil structures along the polypeptide chain of chaperone: abscissa—normalized coordinates, ordinate—the number of structures normalized to the total number of chains; (b) distribution of lengths of α-helices; (c) distribution of lengths of 3 10 -helices.
Symmetry 13 00879 g009
Figure 10. (a) Distribution of helical and coiled-coil structures along the polypeptide chain of structural proteins: abscissa—normalized coordinates, ordinate—the number of structures normalized to the total number of chains; (b) distribution of lengths of α-helices; (c) distribution of lengths of 3 10 -helices.
Symmetry 13 00879 g010
Figure 11. (a) Distribution of helical and coiled-coil structures along the polypeptide chain of exocytosis/endocytosis proteins: abscissa—normalized coordinates, ordinate—the number of structures normalized to the total number of chains; (b) distribution of lengths of α-helices; (c) distribution of lengths of 3 10 -helices.
Symmetry 13 00879 g011
Figure 12. (a) Distribution of helical and coiled-coil structures along the polypeptide chain of electron transport proteins: abscissa—normalized coordinates, ordinate—the number of structures normalized to the total number of chains; (b) distribution of lengths of α-helices; (c) distribution of lengths of 3 10 -helices.
Symmetry 13 00879 g012
Table 1. Parameters of helical structures in the considered subset.
Proteinsα-helices 3 10 - helices
Number of Right-Handed α-helices χ n o r m Number of Left-Handed α-helices χ n o r m Number   of   Right - Handed   3 10 - helices χ n o r m Number   of   Left - Handed   3 10 -helices χ n o r m
Oxidoreductase41800.02–3.0056(−0.054)–
(−0.046)
7350.008–1.72513(−0.115)–
(−0.005)
Transferase16690.015–1.559--1910.025–0.8816(−0.122)–
(−0.010)
Hydrolase29490.026–3.5283(−0.047)–
(−0.008)
3730.034–0.77343(−0.132)–
(−0.003)
Lyase19720.018–1.870--4820.038–1.454--
Isomerase21140.030–2.9912(−0.162)–
(−0.161)
3480.004–1.2631(−0.001)
Ligase29650.007–1.425--6590.002–1.42015(−0.015)–
(−0.002)
Translocase45250.009–4.019--12130.012–1.258121(−0.128)–
(−0.005)
Chaperone2880.122–2.708--470.042–0.324--
Viral protein3590.043–4.137--690.038–1.227--
Structural protein1720.097–3.532--170.044–0.1802(−0.118),
(−0.035)
Endo/exocytosis protein4970.135–3.4802(−0.067)–
(−0.066)
340.043–0.479--
Electron transport protein310.468–1.550--30.1–0.122--
Table 2. Percentage of left-handed helical structures in the considered subset.
Protein Class Total   Number   of   α - helices / 3 10 - helices Number   of   Left - Handed   α - helices / Left - Handed   3 10 - helices Percentage of Left-Handed α-helices Percentage   of   Left - Handed   3 10 - helices
Oxidoreductase4186/7486/130.141.74
Transferase1669/197-/6-3.04
Hydrolase2952/4163/430.110.34
Lyase1972/482-/---
Isomerase2116/3492/10.090.29
Ligase2965/674-/15-2.23
Translocase4525/1334-/121-9.07
Chaperone288/47-/---
Viral protein359/69-/---
Structural protein172/19-/2-10.53
Endo/exocytosis protein499/342/-0.4-
Electron transport protein31/3-/---
Total21374/437213/2010.064.6
Publisher’s Note: MDPI stays neutral with regard to jurisdictional claims in published maps and institutional affiliations.

