Article

Kinematic Analysis of Lower Limb Joint Asymmetry During Gait in People with Multiple Sclerosis

1
Department of Mechanical, Chemical and Materials Engineering, University of Cagliari, 09124 Cagliari, Italy
2
Multiple Sclerosis Centre, Department of Medical Sciences and Public Health, University of Cagliari, 09124 Cagliari, Italy
*
Author to whom correspondence should be addressed.
Symmetry 2021, 13(4), 598; https://doi.org/10.3390/sym13040598
Submission received: 10 March 2021 / Revised: 29 March 2021 / Accepted: 1 April 2021 / Published: 3 April 2021
(This article belongs to the Special Issue Neuroscience, Neurophysiology and Symmetry)

Abstract

:
The majority of people with Multiple Sclerosis (pwMS), report lower limb motor dysfunctions, which may relevantly affect postural control, gait and a wide range of activities of daily living. While it is quite common to observe a different impact of the disease on the two limbs (i.e., one of them is more affected), less clear are the effects of such asymmetry on gait performance. The present retrospective cross-sectional study aimed to characterize the magnitude of interlimb asymmetry in pwMS, particularly as regards the joint kinematics, using parameters derived from angle-angle diagrams. To this end, we analyzed gait patterns of 101 pwMS (55 women, 46 men, mean age 46.3, average Expanded Disability Status Scale (EDSS) score 3.5, range 1–6.5) and 81 unaffected individuals age- and sex-matched who underwent 3D computerized gait analysis carried out using an eight-camera motion capture system. Spatio-temporal parameters and kinematics in the sagittal plane at hip, knee and ankle joints were considered for the analysis. The angular trends of left and right sides were processed to build synchronized angle–angle diagrams (cyclograms) for each joint, and symmetry was assessed by computing several geometrical features such as area, orientation and Trend Symmetry. Based on cyclogram orientation and Trend Symmetry, the results show that pwMS exhibit significantly greater asymmetry in all three joints with respect to unaffected individuals. In particular, orientation values were as follows: 5.1 of pwMS vs. 1.6 of unaffected individuals at hip joint, 7.0 vs. 1.5 at knee and 6.4 vs. 3.0 at ankle (p < 0.001 in all cases), while for Trend Symmetry we obtained at hip 1.7 of pwMS vs. 0.3 of unaffected individuals, 4.2 vs. 0.5 at knee and 8.5 vs. 1.5 at ankle (p < 0.001 in all cases). Moreover, the same parameters were sensitive enough to discriminate individuals of different disability levels. With few exceptions, all the calculated symmetry parameters were found significantly correlated with the main spatio-temporal parameters of gait and the EDSS score. In particular, large correlations were detected between Trend Symmetry and gait speed (with rho values in the range of −0.58 to −0.63 depending on the considered joint, p < 0.001) and between Trend Symmetry and EDSS score (rho = 0.62 to 0.69, p < 0.001). Such results suggest not only that MS is associated with significantly marked interlimb asymmetry during gait but also that such asymmetry worsens as the disease progresses and that it has a relevant impact on gait performances.

1. Introduction

Multiple Sclerosis (MS) is a chronic immunomediated and neurodegenerative disease of the central nervous system, which represents the most frequent cause of disability among young adults [1,2,3]. Being characterized by symptoms such as weakness, fatigue and spasticity, MS can significantly compromise the efficient performance of several basic motor functions, including postural control [4], locomotion [5], upper extremity capabilities [6] and, in general, several common activities of daily living (ADL [7]). In people with MS (pwMS), lower limb motor dysfunctions, although present in both limbs, are usually asymmetrical in magnitude. This is especially true regarding self-perceived weakness, muscular strength and activity, power and limb loading [8,9], but spasticity is also characterized by unilateral presentation in a non-negligible percentage (estimated between 10 and 16%) of pwMS [10].
Since pwMS primarily complain about weakness, a relevant number of studies have attempted to objectively quantify the existence of actual interlimb muscle strength asymmetries. These were indeed almost unanimously found, especially at knee level [11,12,13,14,15]. However, it remains unclear how, and to what extent, they impact motor tasks that rely on optimal bilateral coordination such as balance and gait. As pointed out in the recent review by Rudroff and Proessl [9], although some studies report significant associations between muscle function asymmetries, postural stability and walking performance, others do not. It has been suggested that such inconsistencies are due to wide variability in asymmetry assessment methods [9] but it is also to be considered that in many cases, asymmetry assessment is separately performed with respect to the specific motor task that is supposedly affected by it. Thus, the role of muscle function cannot be analyzed in a true ecological context.
In contrast, less explored appears the effect of the disease in terms of joint kinematics asymmetry as, to the best of our knowledge, only a few studies have explicitly investigated the existence of possible differences in mobility of lower limb joints. Daunoraviciene et al. [16] employed inertial sensors to assess asymmetry of lower limb joints in pwMS who carried out the heel-to-shin test, while Filli et al. [17] analyzed the existence of interlimb differences in the range of motion (ROM) at hip, knee and ankle joints during a gait analysis using an optical motion capture system in a study aimed to profile walking dysfunctions on pwMS. Crenshaw et al. [18] employed the angular trend waveforms in the sagittal plane for hip, knee, and ankle joints during gait to determine several gait symmetry measures (i.e., trend similarity, phase shift, minimum trend similarity, range amplitude ratio, and range offset) using an eigenvector approach. They reported that pwMS were generally more asymmetrical than unaffected individuals and that asymmetry parameters worsened in the fatigued condition. Since knowledge of lower limb kinematics has been recognized as an essential factor in better understanding the underlying mechanisms of walking disability in MS, [18], it is reasonable to hypothesize that the availability of data on joint movement asymmetry would be extremely pertinent to quantify the magnitude of its impact on walking performance.

1.1. Characterization of Gait Asymmetry in PwMS: Methods Based on Discrete Values

The study of gait asymmetry in pwMS is usually performed through analysis of differences between more affected and less affected limbs in terms of spatio-temporal parameters. To this end, symmetry is quantified by means of several parameters, among which the most used is represented by the Symmetry Index (SI, originally proposed by Robinson et al. [19]), which is expressed by the following equation:
S I = 2 × V l a V m a V l a + V m a × 100
where Vla and Vma represent the values of the gait variable of interest (usually step time, step length, or duration of stance, swing and single and double support phases), calculated, respectively, for the less affected and the more affected limb or, in a more general formulation, for the left and right side. When no differences are measured between the two limbs, SI becomes null and gait is considered perfectly symmetric, while as SI increases, asymmetry increases. The original formulation by Robinson has been subsequently modified by other authors (see the review by Viteckova et al. [20] for details) to adapt it to different gait variables. Values of SI during gait for pwMS have been reported as regards studies on the characterization of gait pattern for different MS phenotypes [21] and as outcome of rehabilitative treatments [22].
It is noteworthy that other sophisticated approaches, such as nonlinear ones based on either multiresolution entropy [23] or cross-fuzzy entropy [24], have been proposed to investigate lower limb symmetry in individuals affected by neurologic conditions. Like discrete methods, nonlinear methods are based on the calculation of discrete variables extracted from a continuous signal to perform the assessment of symmetry, through evaluation of the evolution of a discrete variable over a set of consecutive gait cycles [20].

1.2. Waveform-Based Methods to Assess Interlimb Symmetry During Gait

Since discrete approaches previously described focus on a single or a limited set of events, they are unable to provide information on the way a certain kinematic variable (and thus asymmetry) evolves over time. This drawback can be overcome by using waveform-based methods that exploit all kinematic information contained in the curve of variation of the lower limb joint angles with time during a complete gait cycle. However, this increase in information content and accuracy comes at a cost: waveform-based techniques are more complex to implement and time-consuming. Moreover, interpretation of the parameters they provide is not so straightforward as occurs with classic symmetry indexes. However, several studies carried out in the last decade on individuals affected by neurologic (neuropathies, stroke, Parkinson’s disease [25,26,27]) and orthopedic conditions [28,29,30] demonstrated that such an approach is versatile and allows a more accurate and thorough analysis of gait symmetry, thus proving to be of great relevance in all conditions characterized by subtle, not easily detectable alteration of gait with the conventional discrete indices.
One of the best-known and most widespread methods for investigating symmetry either between the same joint of left and right lower limb or between two joints of the same limb is based on analysis of angle–angle diagrams, also known as “cyclograms”. Originally proposed by Grieve in 1968 [31], they rapidly attracted the interest of researchers and clinicians, since symmetry was graphically and mathematically expressed through simple geometrical properties of the figures generated by the angle–angle comparison such as area, perimeter, etc. In the last two decades, more refined mathematical approaches have been formulated to make the method sensitive to even relatively low asymmetries.
Surprisingly, although the impact of asymmetry issues associated with MS is extremely relevant, the literature reports only one study (carried out on a small sample of 13 pwMS) in which angle–angle diagrams and associated summary parameters were used [32]. Its major findings were a more marked asymmetry of pwMS with respect to unaffected individuals and the absence of significant relationships between the level of disability and the symmetry parameters. Considering the informative potential of this approach and the substantial lack of data, we propose here a retrospective study performed on a large cohort of pwMS who underwent a computerized 3D gait analysis during a 5-year period. In particular, the main purposes of the research are as follows: (1) to employ waveform-based methods to assess lower-limb joint kinematics asymmetry during gait in a cohort of pwMS and verify whether the values of the calculated symmetry parameters are significantly different from those of unaffected individuals or not; (2) to assess the existence of possible differences in asymmetry between pwMS characterized by different levels of disability; and (3) to verify the existence of possible relationships between asymmetry parameters and spatio-temporal parameters of gait and disability level. A secondary goal of the study is to compare the ability of different indicators associated with angle–angle diagrams to correctly discriminate pwMS from unaffected individuals and pwMS between them depending on their level of disability.

2. Materials and Methods

2.1. Participants

In the period May 2014 February 2020, 236 pwMS followed at the Regional Multiple Sclerosis Center of Sardinia (Cagliari, Italy) underwent a computerized three-dimensional gait analysis at the Laboratory of Biomechanics and Industrial Ergonomics of the University of Cagliari (Cagliari, Italy). They had previously been diagnosed with MS by a neurologist expert in MS (E.C., G.C.) according to the 2010 revised criteria [33,34] and tested in the laboratory to either characterize and monitor alterations of gait associated with the disease progression or assess the effect of pharmacologic and rehabilitative treatments [35,36,37]. For the purposes of the present study, only pwMS able to ambulate autonomously (i.e., without the support of canes, crutches or walking frames) for at least 100 m and free from any other condition potentially able to severely affect gait or balance were considered. Such a selection, which resulted in a sub-group composed of 101 unique pwMS (55 women, 46 men, mean age 46.3 years) was carried out to remove any possible confounding effects on gait kinematics associated with the presence of walking aids [38,39]. In the case of pwMS who were recruited for interventional studies, the test condition considered for the present analysis was the “pre-intervention”.
Participants were stratified into two groups depending on their disability level assessed through the Expanded Disability Status Scale (EDSS) score as follows:
  • Low-mild disability (EDSS ≤ 3.5, n = 59)
  • Moderate-severe disability (EDSS > 3.5, n = 42)
Eighty-one unaffected individuals age- and sex-matched recruited among nurses and staff of the MS Center and the University of Cagliari served as the control group. The main anthropometric and clinical features of all participants are reported in Table 1.
All data presented here wer obtained within several studies conducted according to the principles expressed in the World Medical Association Declaration of Helsinki and formally approved by the local Ethics Committee (authorization numbers 180/2014, 102/2018 and 198/2019). In all cases, participants signed an informed consent agreeing to participate.

2.2. Spatio-Temporal and Kinematic Data Collection and Processing

An optical motion-capture system (Smart-D, BTS Bioengineering, Italy) composed of 8 infrared cameras set at 120 Hz frequency was employed to acquire the trajectories of 22 spherical retro-reflective passive markers (14 mm diameter) placed on the skin of participants’ lower limbs and trunk at specific landmarks according to the protocol described by Davis et al. [40]. After the acquisition of main anthropometric data (i.e., height, weight, anterior superior iliac spine (ASIS) distance, pelvis thickness, knee and ankle width and leg length) and the markers’ placement, participants walked at a self-selected speed in the most natural manner possible on a 10 m walkway at least 6 times, interspersed with suitable rest times.
The raw data were first processed with the dedicated Smart Analyzer software (BTS Bioengineering, Italy) to calculate the main spatio-temporal parameters of gait (speed, stride length, cadence, step width, stance, swing and duration of double support phases) and derive the mean value of the angles at hip, knee and ankle joint during the gait cycle calculated on the basis of the six trials. Such curves were then exported as ASCII files for further processing with a custom routine developed under Matlab ® environment (see Appendix A), which calculated interlimb symmetry as described later in detail.

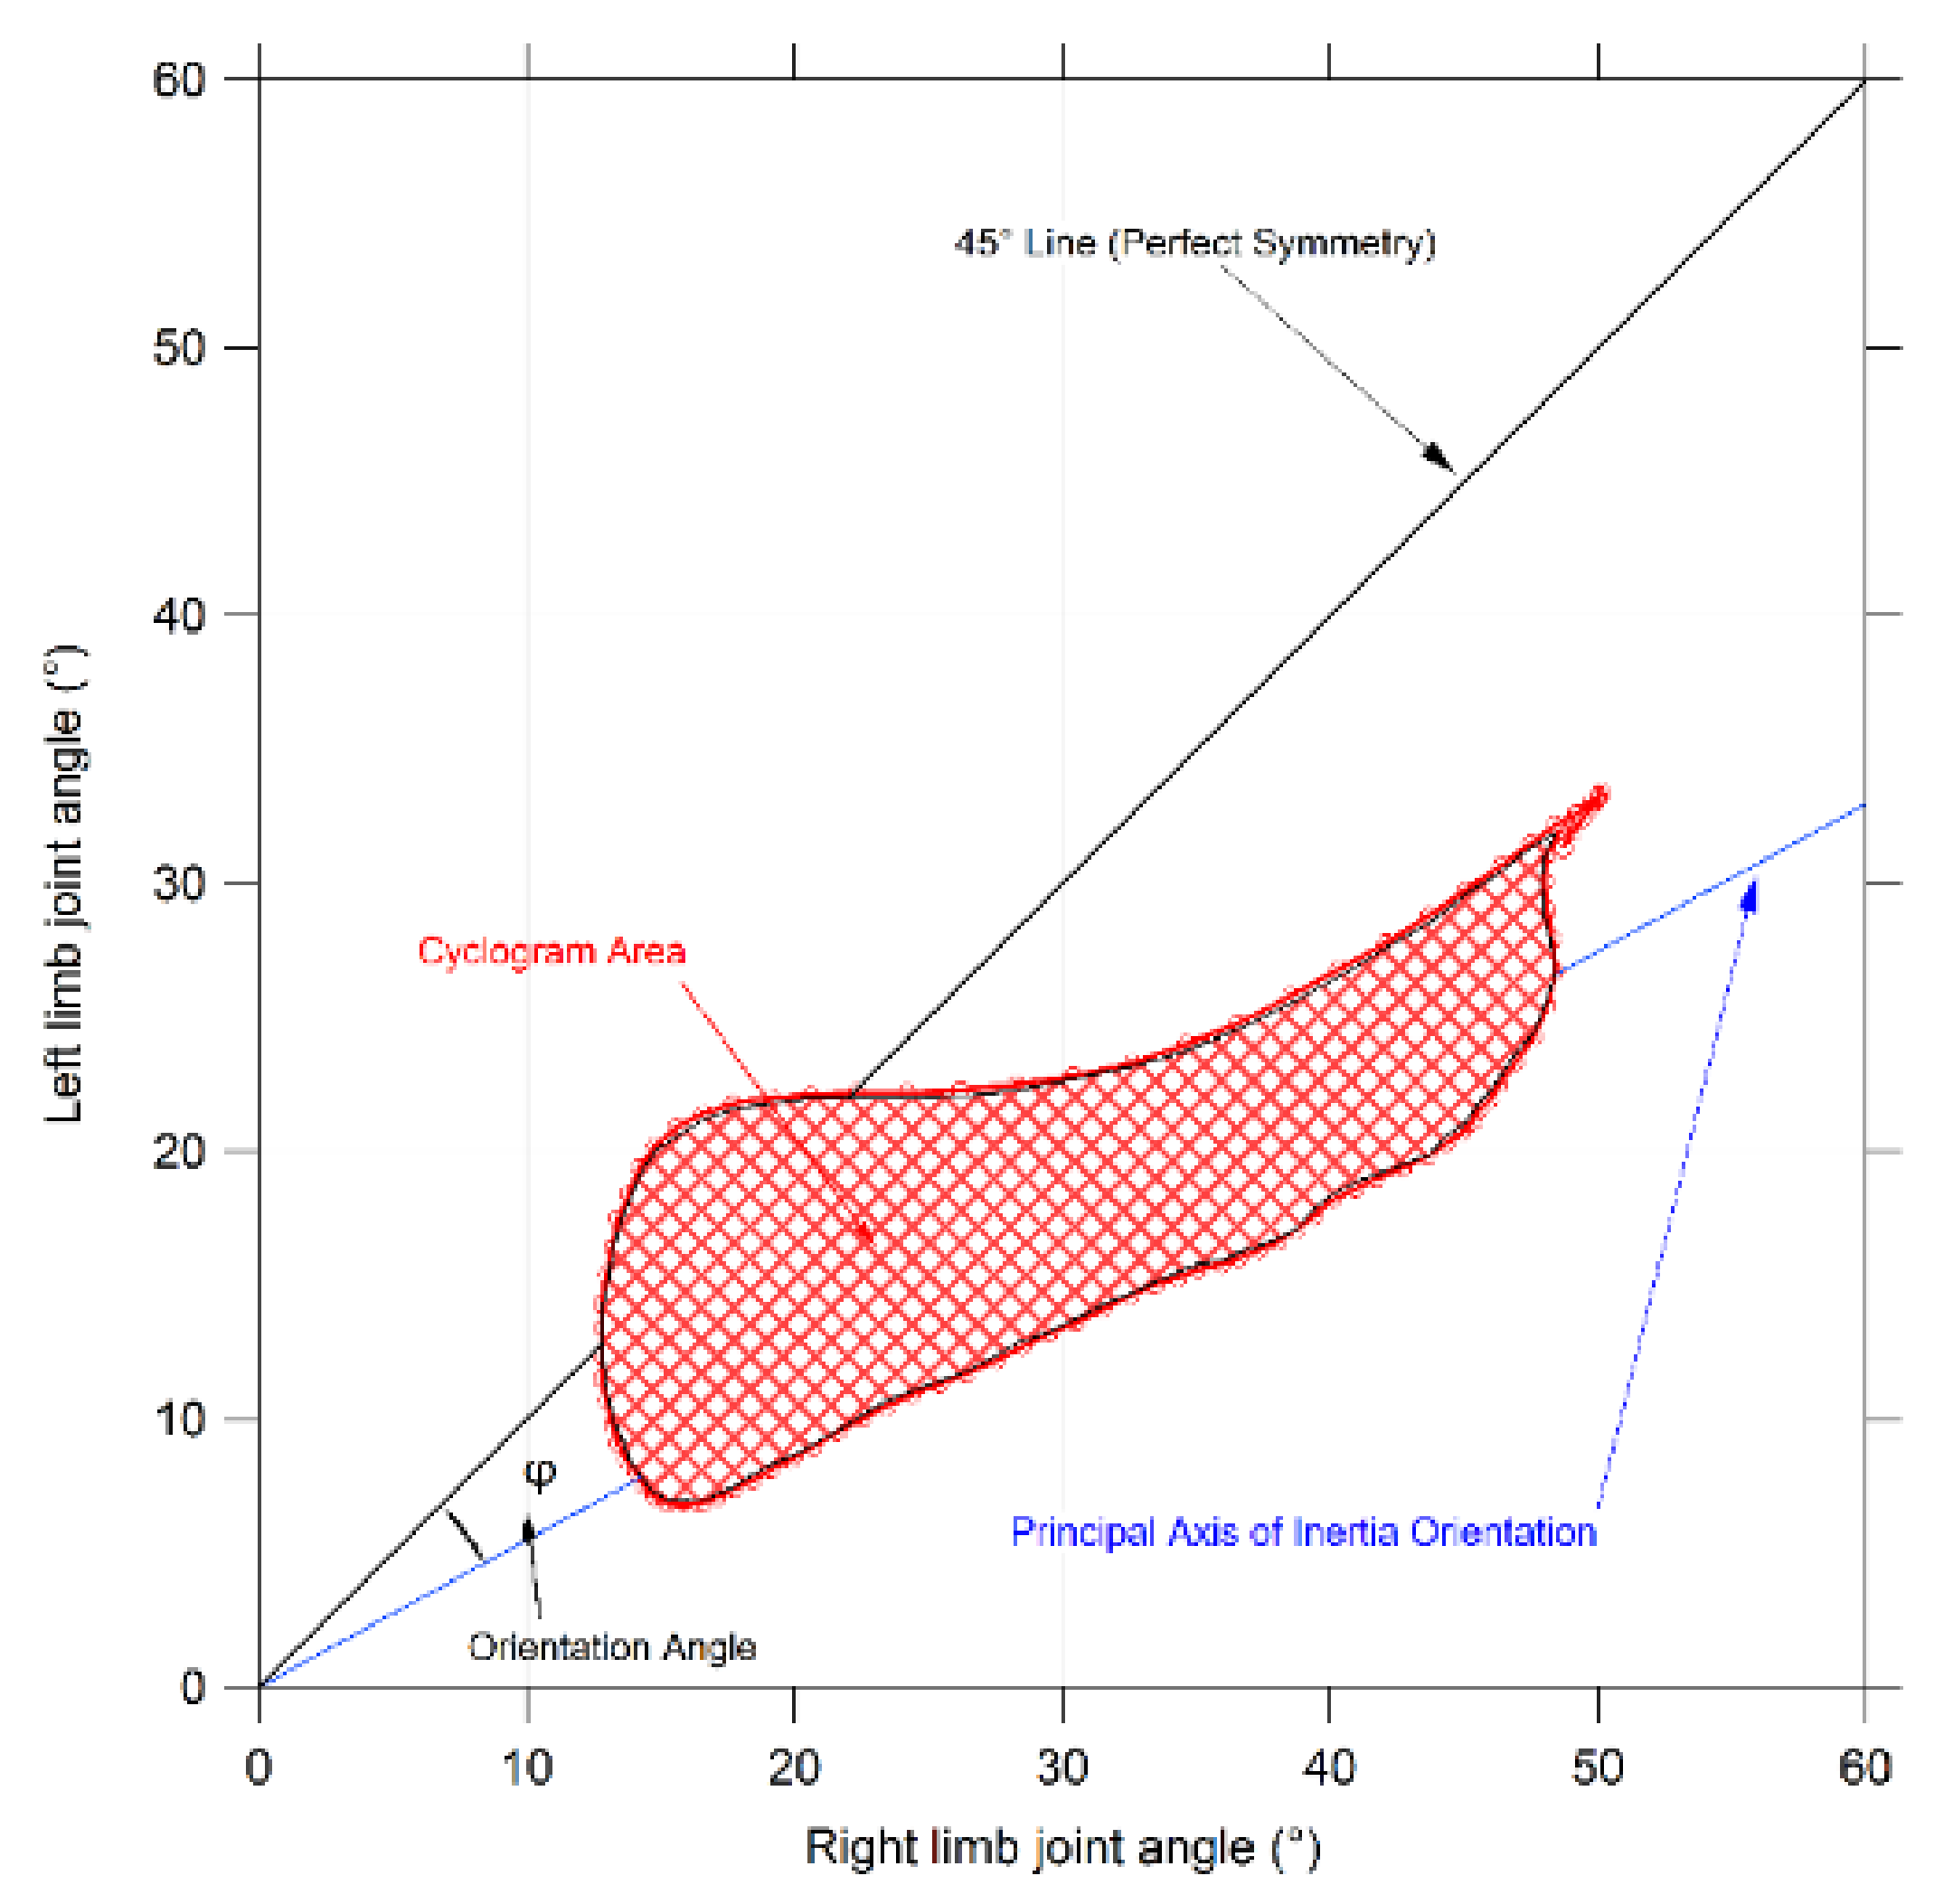
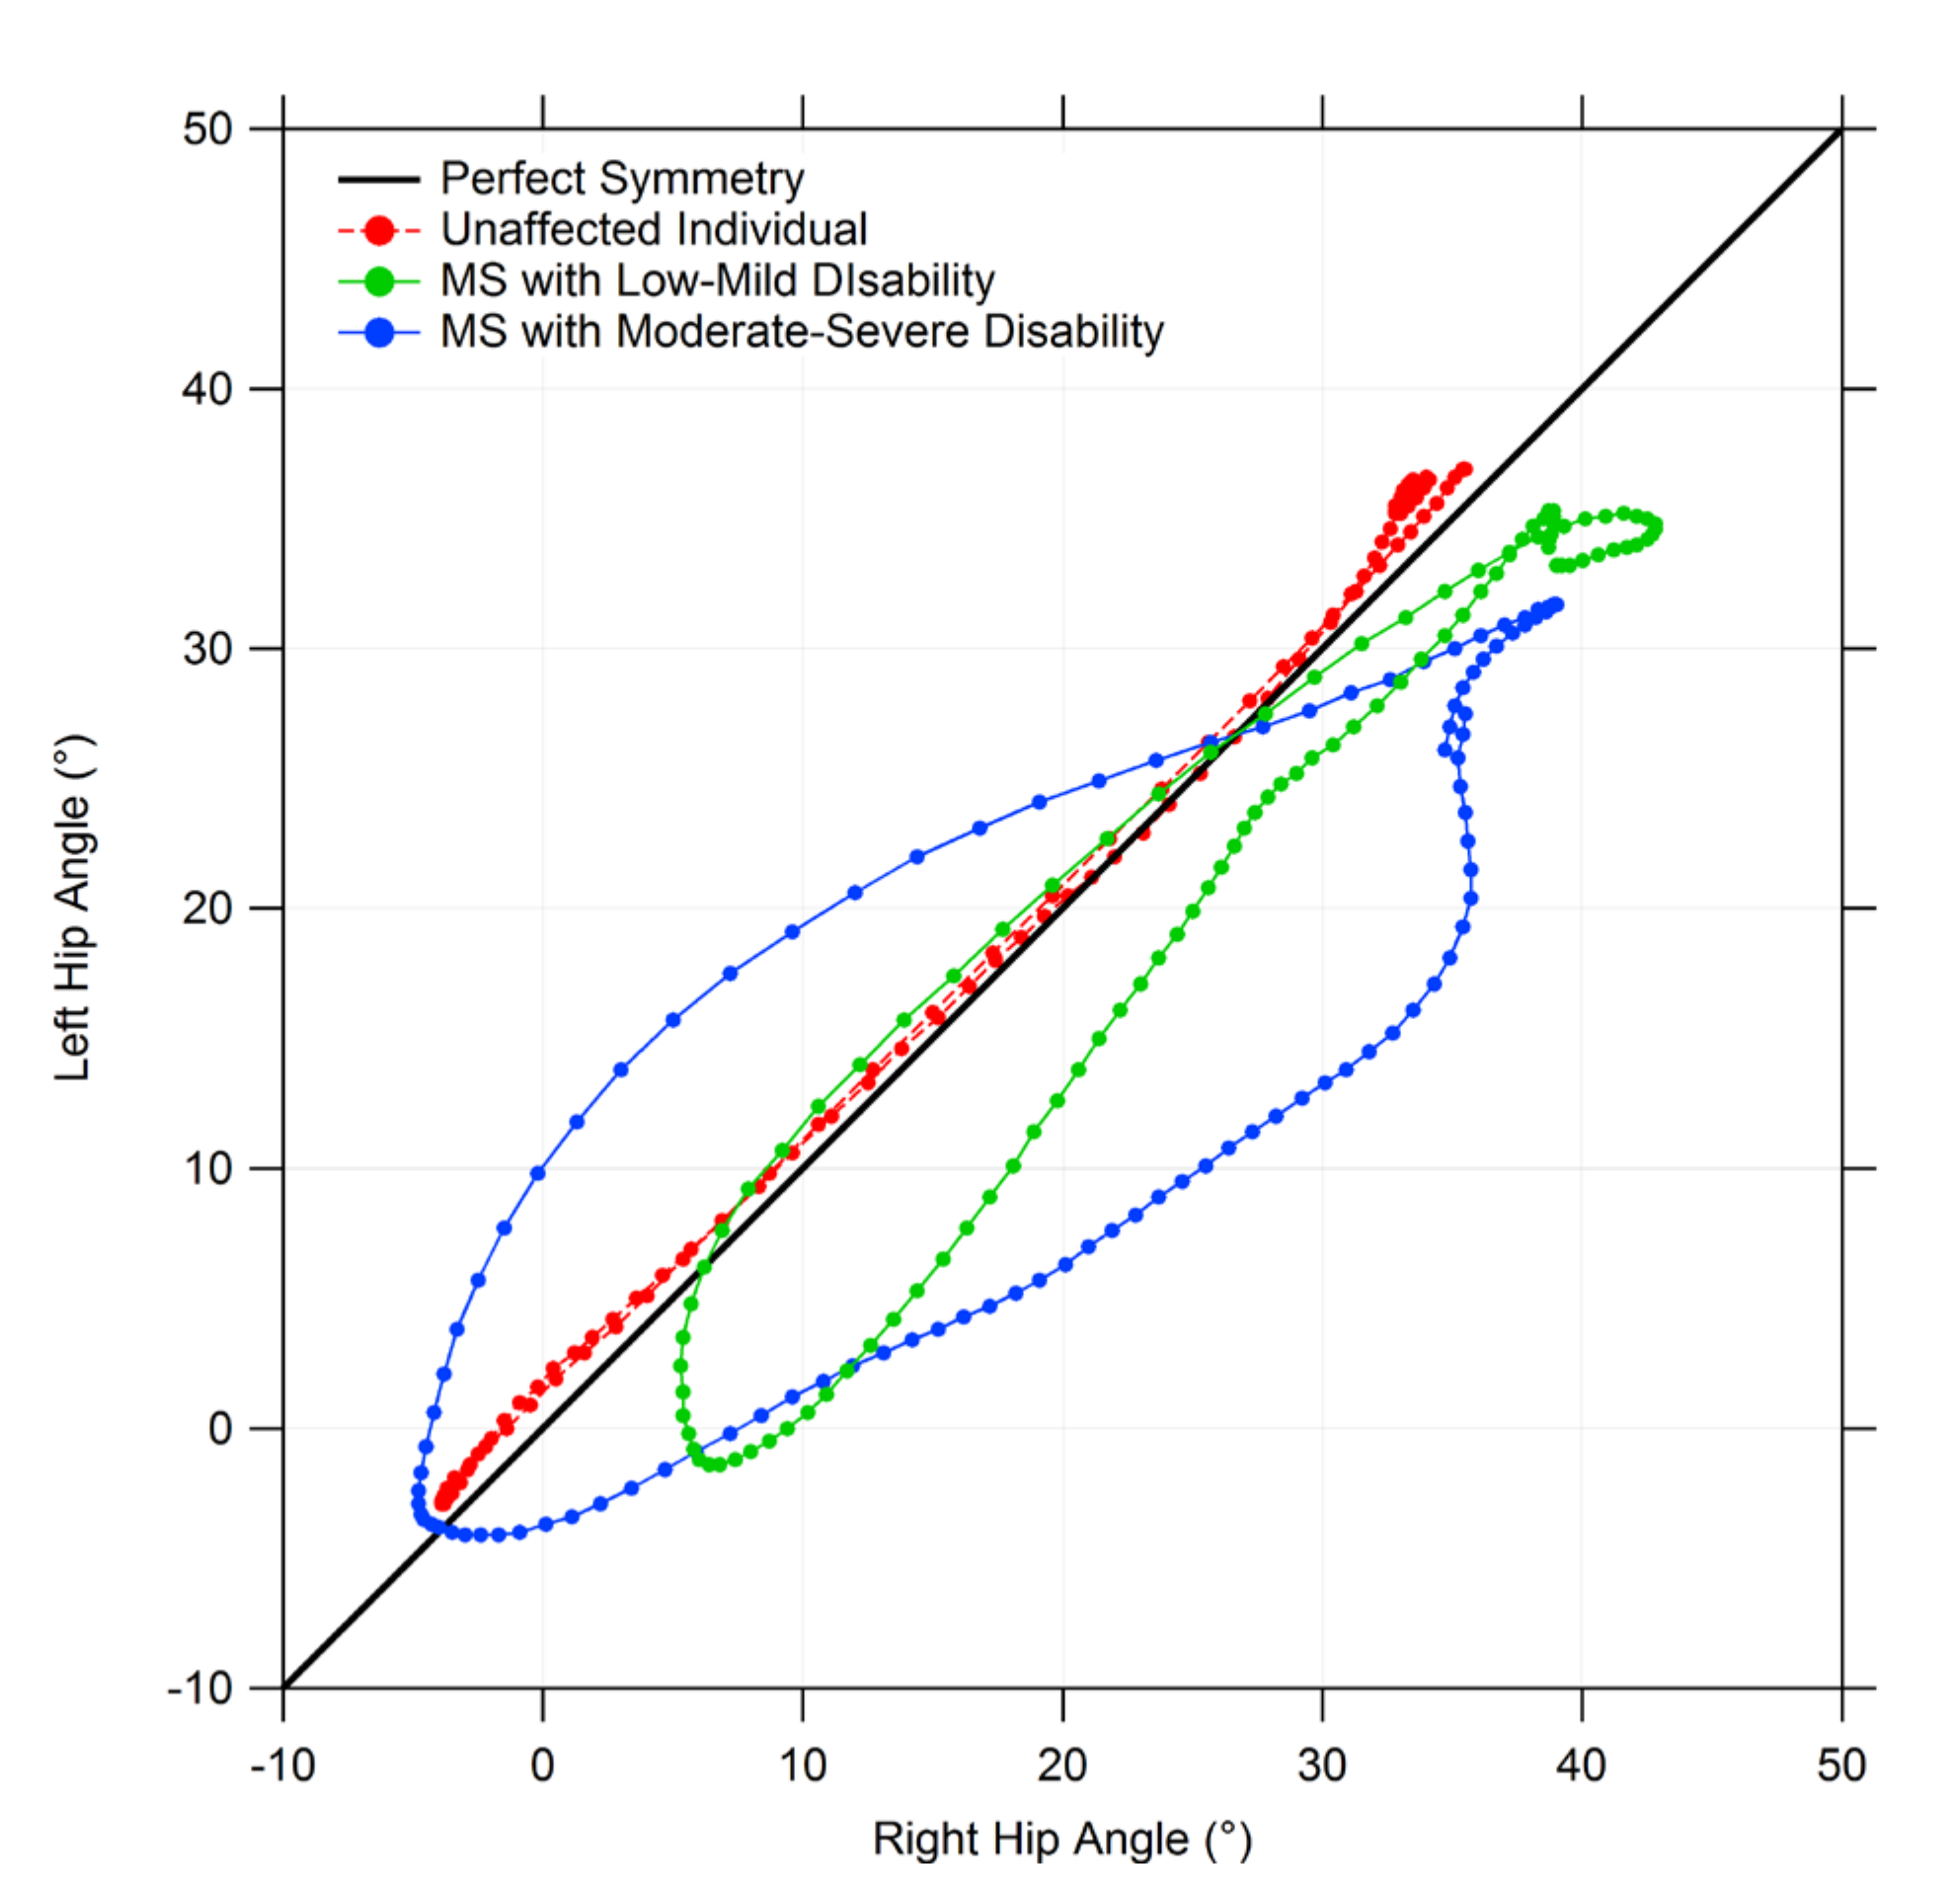
2.3. Gait Symmetry Quantification by Means of Cyclograms

Synchronized bilateral cyclograms were generated according to the procedure described by Goswami [41]. To this end, right and left limb angle values acquired during the gait cycle were used to build angle–angle diagrams for each joint of interest (i.e., hip, knee and ankle). A number of geometrical features of cyclograms were then extracted as follows (see also Figure 1 for a graphical explanation):
  • Cyclogram area (degrees2) represents the area of the closed curve obtained from each angle–angle diagram [42]. Since a perfectly symmetrical gait is achieved when both left and right joints are positioned at the same angle for a certain time of the gait cycle (i.e., all the cyclogram points stand on a 45° line in the diagram and thus the area is null), the interpretation of this parameter is quite straightforward; that is, the smaller the area, the more symmetrical the gait.
  • Cyclogram orientation (degrees): this feature is identified by the absolute value of angle ϕ formed by the 45° line, which corresponds to perfect interlimb symmetry and the orientation of the principal axis of inertia, which corresponds to the minimum moment of inertia of the cyclogram [41,43]. The latter was calculated as the direction of the eigenvector of the matrix of inertia of the cyclogram points distribution in the x-y (i.e., left joint angle–right joint angle) reference system. Smaller values of this angle indicate higher interlimb symmetry.
  • Trend Symmetry: this dimensionless parameter quantifies the similarity between two waveforms (in our case time-normalized right leg and left leg angular trend across the gait cycles for each joint of interest) using an eigenvector analysis (see [44] for details of the mathematical procedure). In particular, it is obtained by dividing the variability about the eigenvector to the variability along the eigenvector, and it is not influenced by the presence of a shift or by magnitude differences in two waveforms. Even in this case, the interpretation of this parameter is quite simple; a 0 value indicates perfect symmetry, and asymmetry increases as the Trend Symmetry value increases.

2.4. Statistical Analysis

Parametric statistical analysis was adopted after preliminarily checking data for normality (using the Shapiro–Wilk’s test) and homogeneity of variances (Levene’s test). The existence of possible differences in symmetry introduced by the presence of MS was investigated using two distinct one-way multivariate analyses of variance (MANOVA). The first one, which investigated the differences between spatio-temporal parameters of pwMS and unaffected individuals, was performed by considering the participant’s status (i.e., unaffected and pwMS with low–mild or moderate–severe disability) as independent variables and the 7 spatio-temporal parameters previously mentioned (speed, stride length, cadence, step width, stance, swing and duration of double support phases) as dependent variables. In the second MANOVA, we analyzed the effect of the presence of MS on symmetry parameters. In this case, the independent variable was once again the participant’s status (i.e., unaffected and pwMS with low-mild or moderate-severe disability), while the dependent variables were the 3 previously listed symmetry indexes calculated at hip, knee and ankle joints. Two additional analyses were carried out by pooling all the pwMS in a single group.The level of significance was set at p = 0.05, and the effect sizes were assessed using the eta-squared (η2) coefficient.
Univariate ANOVA was carried out as a post hoc test by reducing the level of significance to p = 0.007 (0.05/7) for spatio-temporal parameters and p = 0.017 (0.05/3) for the symmetry indexes after a Bonferroni correction for multiple comparisons. When necessary, a post hoc Holm-Sidak test for pairwise comparison was carried out to assess intra- and inter-group differences. Data were checked for normality (using the Shapiro–Wilk test) and homogeneity of variances (by means of Levene’s test) before any ANOVA.
Moreover, for the group of pwMS only, we also explored the existence of a relationship between gait symmetry parameters, spatio-temporal parameters of gait and disability level using Spearman’s rank correlation coefficient rho by setting the level of significance at p = 0.05. Rho values of 0.1, 0.3 and 0.5 were assumed to be representative of small, moderate, and large correlations, respectively, according to Cohen’s guidelines [45]. All analyses were performed using the IBM SPSS Statistics v.20 software (IBM, Armonk, NY, USA).

3. Results

The results of the comparison between pwMS and unaffected individuals as regards spatio-temporal parameters of gait and symmetry indexes are summarized in Table 2 and Table 3.

3.1. Spatio-Temporal Parameters of Gait

Parameters that were separately calculated for right and left limb (i.e., stride length and duration of stance, swing and double support phases) were preliminarily screened using an independent sample t-test to verify the existence of significant differences between the limbs. Since this was not the case, their average value was calculated and considered representative of a certain participant.
The statistical analysis revealed a significant effect of the individual’s status (F (14,346) = 10.70, p < 0.001, Wilks λ = 0.49, η2 = 0.30) on spatio-temporal parameters of gait. In particular, the follow-up analysis detected the existence of significant differences between the three groups in all the parameters investigated except for step width. In this case, no significant differences were found between unaffected individuals and pwMS with low–mild disability, while those with moderate–severe disability exhibited a step width significantly higher with respect to healthy controls (0.23 m vs. 0.20 m, p = 0.007).

3.2. Gait Symmetry Indexes

MANOVA detected a significant effect of the individual’s status on symmetry indexes in all three joints investigated. In particular, for hip [F (6354) = 13.48, p < 0.001, Wilks λ = 0.66, η2 = 0.19], for knee (F (6354) = 21.35, p < 0.001, Wilks λ = 0.54, η2 = 0.27) and for ankle (F (6354) = 12.28, p < 0.001, Wilks λ = 0.68, η2 = 0.17). From the post hoc analysis, it was observed that in the case of cyclogram area no significant differences were observed between the groups as regards knee and ankle joints, while in the case of the hip joint, pwMS with moderate–severe disability exhibited significantly larger areas in comparison with both unaffected individuals and pwMS with low–mild disability. The orientation and Trend Symmetry indexes were found significantly different in the three groups at the ankle joint. In the case of hip and knee, significant differences were observed between the moderate–severe disability group with both low–mild disability and unaffected individual groups. Figure 2 shows an example of the different shapes and orientations of the cyclograms for pwMS of different disability levels and unaffected individuals.

3.3. Relationship between Symmetry Indexes and Spatio-Temporal Parameters of Gait

Table 4 summarizes the results of the correlation analysis between disability level, spatio-temporal parameters of gait and symmetry indexes for pwMS. Significant correlations were found between all the variables investigated, with a few exceptions, which involved the cyclograms’ area. For this parameter, we generally observed the weakest associations with spatio-temporal parameters of gait or (as in the case of the ankle joint) no correlations at all, except for a low one with EDSS score. Instead, Trend Symmetry was the index that exhibited the largest coefficient of correlation with EDSS score (rho ranged from 0.62 to 0.69 depending on the joint: p < 0.001), gait speed (−0.58 to −0.63, p < 0.001), stride length (−0.52 to −0.55, p < 0.001) and double support phase duration (0.50 to 0.57, p < 0.001) in all three joints.

4. Discussion

4.1. General Considerations

The general aim of this study was to assess the magnitude of interlimb asymmetry during gait in pwMS in terms of joint kinematics and compare it with those of unaffected individuals using waveform-based methods. Such information is of great importance in the analysis of motor dysfunctions associated with MS because symmetry has been recognized as one of the domains that significantly influences gait quality and efficiency [46], together with pace, rhythm, variability and complexity. Although the analysis based on cyclograms is somewhat complex and requires full kinematic data (which can be typically extracted only from laboratory tests) it may provide a better insight into the mechanisms that lead to altered gait in pwMS. Moreover, it represents an effective way to quantify the deviation from a “normal” gait through parameters easy to interpret and thus may be useful, for instance, to quickly verify the effects of rehabilitation, or training exercise, on a joint-by-joint basis.
Our results show that pwMS exhibit a significantly larger asymmetry with respect to unaffected participants for hip, knee and ankle joints when considering cyclogram orientation and the Trend Symmetry parameter. In contrast, a more conventional parameter such as the cyclogram area was able to discriminate pwMS from controls only as regards the hip joint. The approach employed also appears capable of detecting asymmetry differences associated with the disability level of pwMS since all investigated parameters (with the same exceptions involving the cyclogram areas) were found significantly higher in pwMS with moderate–severe disability with respect to those with low–mild disability. In contrast, the analysis generally failed in discriminating pwMS with EDSS ≤3.5 from unaffected individuals, even though some significant differences were observed at the ankle joint as regards the cyclogram orientation and Trend Symmetry. Such phenomenon suggests that the ankle joint might play a specific role in gait alterations. This seems also confirmed by recent studies [47], which reported greater ankle muscle coactivation (with respect to unaffected individuals) and alterations in ankle joint kinematics during gait occurring especially at early stages of the disease in pwMS and that might serve as biomarker of neurodegeneration. It is also possible that the absence of significant differences between the two groups of pwMS depends on the specific EDSS score cut-off selected to stratify the participants. Further studies are thus necessary to clarify such aspects.
On one hand, the findings of the present study confirm those reported by Crenshaw et al. [30] for a small cohort of pwMS, but further extend them, as they indicate that asymmetry tends to be more marked as the disability level worsens. Generally speaking, several previous studies on gait of pwMS included some form of asymmetry analysis, but this is often restricted to few spatio-temporal parameters. In this regard, there is strong evidence that pwMS exhibit clinically relevant asymmetries in terms of gait cycle duration, stride/step length and time and stance/swing phase duration [21,48,49,50]. To the authors’ knowledge, only two studies [17,51] specifically investigated asymmetry for lower limb joint kinematics during gait, even when using discrete values of ROM (typically the maximum value observed within the entire gait cycle). Consistent with our results, they both reported higher asymmetries in pwMS with respect to unaffected individuals at hip, knee and ankle joints.
The existence of interlimb asymmetry in terms of joint kinematics can be attributed to several factors. Firstly, the differences in muscular function, due to corticospinal tracts involvement, between more affected and less affected limb (which has been repeatedly observed in pwMS in terms of strength, torque and metabolism [9]) may introduce some kind of unbalance even on joint movement control. This can be further exacerbated by the presence of compensatory mechanisms unconsciously adopted to overcome the uneven supporting and propulsive action of the two limbs. Secondly, the reduced capability to optimally coordinate left and right limbs during gait might be due to reduced efficiency in the neural communication pathways between the two cerebral hemispheres, particularly as regards the fiber bundle connecting the primary motor cortices [52]. Moreover, imaging studies have highlighted the existence of a significant correlation between asymmetries in electrophysiological deficits for both arms and legs and asymmetric anatomic changes in the spinal cord’s normal-appearing white matter, thus suggesting that the functional asymmetries are associated with microstructural damage of the spinal cord [53]. Finally, Filli et al. [17] hypothesized that the loss of inter- and intralimb coordination, particularly at the distal level, might be due to the altered integrity of the long ascending and descending myelinated fiber tracts of cortical, cerebellar and brainstem systems.

4.2. Relationship between Interlimb Asymmetry, Spatio-Temporal Parameters of Gait and Disability

As previously mentioned, one of the most debated issues related to lower limb asymmetry in MS involves assessment of its actual impact on gait performance. In this regard, the findings of the present study suggest the existence of a close relationship between gait efficiency and interlimb asymmetry of joint kinematics, especially when the latter is expressed in terms of cyclogram orientation and Trend Symmetry. This link appears similar in strength regardless of the joint considered for gait speed and stride length (and consequently for cadence). However, we also detected moderate to large correlations between asymmetry parameters and other aspects of gait more specifically associated with dynamic balance, such as step width and double support phase duration.
The recent reviews by Rudroff and Proessl [9] and Ramari et al. [54], which analyzed the effect of asymmetries in muscular strength and limb loading on walking capabilities of pwMS (in particular gait speed and performance on timed tests) raised strong doubts about the possibility of defining a clear relationship between them. However, recent studies that investigated asymmetry through calculation of the phase relationship between the step timing of the left and right legs (the so-called Phase Coordination Index, PCI [55]) reported that bilateral coordination of gait was negatively correlated with gait speed and performance in 6 m and Timed 25-foot walking tests [52,56]. Even from a quantitative point of view, such results are fully consistent with those of the present study, thus suggesting that even when assessed with completely independent methods, bilateral coordination negatively affects gait speed and stride length [49]. Interestingly, we also observed significant positive correlations between symmetry parameters and step width and double support, the latter being stronger. Although there are no data available for comparison, it has been suggested that in pwMS, asymmetries in muscle strength may result in a wider base of support and prolonged double support phase duration during gait [15]. Although in this study we did not investigate muscular strength, it appears reasonable to hypothesize that even the asymmetry in kinematics of lower limb joints (through a combined or superposed effect with those of muscle function) plays a crucial role in the establishment of adaptative strategies that pwMS are forced to employ to counteract the negative effects associated with uneven motor functions of the two limbs.
Finally, it is to be mentioned that all asymmetry parameters were found positively correlated with the EDSS score, thus indicating the strict relationship existing between bilateral coordination and disease progression, whose nature deserves further in-depth investigations. This result was not completely surprising, since gait deterioration represents one of the distinctive hallmarks of the disease, but it is noteworthy that similar findings were also found by Plotnik et al. [56], who, as previously mentioned, calculated a different index of asymmetry (i.e., the previously mentioned PCI).
Some limitations of the study are to be acknowledged. Firstly, in our research, the waveform-based method was employed only to explore interlimb symmetry, but the same approach might be advantageously exploited to investigate intralimb coordination considering the different combination of joints (i.e., hip vs. knee, knee vs. ankle, etc.). This would provide further important data regarding the possible impact of the degree of coordination (or incoordination) between the two limbs on the quality of coordination between the joints and vice versa, thus allowing assessment of the existence and type of compensatory mechanisms. Furthermore, in the present study, men and women were pooled in a single group, even though recent studies point out that several sex-related differences exist in lower limb kinematics during gait for pwMS [57]. At last, it should be considered that all the walking tests performed for the present study refer to a relatively short distance (i.e., 10 m), but the literature reports that, in pwMS, asymmetry of gait (calculated in terms of spatio-temporal parameters of gait) tends to worsen in case of longer distance due to fatigue effects [48,49,50]. It would be, thus, interesting to verify if a similar phenomenon would be present also as regards the joint kinematics symmetry.

5. Conclusions

The analysis of asymmetry of lower limb joint kinematics during gait of pwMS shows that bilateral coordination is impaired in those with moderate–severe disability at hip, knee and ankle levels, while individuals characterized by low–mild disability exhibit anomalous values of asymmetry at ankle level only. Moreover, the existence of moderate-to-large correlations between symmetry and gait parameters suggest that the former (which increases as the disease progresses) has a direct influence on gait quality and efficiency since pwMS with the poorest symmetry indexes are characterized by reduced gait speed and stride length and increased step width and double support phase duration. While confirming that MS differentially alters most aspects of lower limb motor functionality, the findings of the present study also suggest that the asymmetries of spatio-temporal parameters reported by many studies on gait of pwMS are likely to reflect the combined effect of muscular and joint kinematics asymmetries. In such a context, the use of waveform-based methods to assess interlimb (and possibly interlimb) symmetry may provide useful insights not only to better understand the impairments in motor control associated with the presence of MS, but also to accurately assess the effect of physical therapy and exercise training programs, which have been shown to have a positive effect on gait and balance asymmetries of individuals with MS as well as other chronic neurologic conditions [58]. However, future studies (possible longitudinal) are necessary to clarify the evolution of asymmetry during the disease progression, to identify specific peculiarities associated with MS type and with the sex of the affected individual and to assess the effects of fatigue.

Author Contributions

Conceptualization, M.P. (Massimiliano Pau); methodology, M.P. (Massimiliano Pau), B.L.; software, B.L.; validation, B.L., M.P. (Massimiliano Pau); formal analysis, M.D., F.P.; investigation, E.C., G.C., M.P. (Micaela Porta); resources, E.C.; data curation, M.D., M.P. (Massimiliano Pau); writing—original draft preparation, M.P. (Massimiliano Pau); writing—review and editing, E.C.; supervision, E.C.; project administration, E.C.; funding acquisition, E.C. All authors have read and agreed to the published version of the manuscript.

Funding

This research was funded by the Autonomous Region of Sardinia (L.R. 7/2007, grant number RASSR42584).

Institutional Review Board Statement

Data used for this retrospective study were collected during previous studies conducted according to the guidelines of the Declaration of Helsinki, and approved by the Local Ethics Committee (authorization numbers 180/2014, 102/2018 and 198/2019).

Informed Consent Statement

Informed consent was obtained from all subjects involved in the study.

Data Availability Statement

The data that support the findings of this study are available from the corresponding author M.P. upon reasonable request.

Acknowledgments

The authors are grateful to Federico Arippa, Federica Corona and Giuseppina Pilloni for their valuable support during the data acquisition process.

Conflicts of Interest

The authors declare no conflict of interest.

Appendix A

Matlab pseudocode for the calculation of symmetry parameters (see ref. [44] for details)
function [TS, CO, m_T] = symm_pars(X, Y)
% symm_pars calculates inter-limb joint cyclogram symmetry parameters.
% input:
% X = column array of Left joint data.
% Y = column array of Right joint data.
% Output:
% 1 - TS = Trend Symmetry, as defined by Crenshaw et al.(2006) [44]
% 2 - CO = Cyclogram Orientation (degrees).
% 3 - m_T = Angular coefficient of the trend line.
 
XT = X - mean(X);
YT = Y - mean(Y);
M = [XT YT];
S = (M’)*M;
[V, D, W] = eig(S); % eig function returns full matrix W whose columns are the corresponding left eigenvectors, so that W’*A = D*W’.
eigVals = sum(D); % array containing the eigenvalues or Inertia matrix
 
[emax, pos_emax] = max(eigVals); % emax = maximm eigenvalue (i.e. maximum variability; pos_emax = position of emax in array eigVals;
[emin, pos_emin] = min(eigVals); % emin = minimum eigenvalue (i.e. minimum variability; pos_emax = position of emax in array eigVals;
 
e1 = V(:,pos_emax); % eigenvector parallel to the direction maximizing the variability (along which the variability is maximum)
 
% NOTE:
% from the mathematical point of view, the eigenvalues and the eigenvectors
% of matrix M represent, respectively, the principal inertia moments and
% the direction of principal axis of inertia of the cyclograms point distribution
 
TS = (emin/emax)*100; % Trend Symmetry: the ratio of the minimum to the maximum variability expressed as percentage;
 
% in condition of perfect symmetry, the direction of e2 is 45° with respect
% to the reference axis. "delta_THETA_I", i.e. the difference between the orientation of e1 and
% 45°, is a measurement of the asymmetry of the cyclogram points
 
CO = 45 - (180/pi)*atan(e1(2)/e1(1)); % angle between the eigenvector e2 and 45 degrees
m_T = (e1(2)/e1(1)); % Angular coefficient of the trend line
 
Fig1 = figure;
p1 = plot(XT, YT, ‘or’); %Cyclogram
axis equal
grid on
hold on
p2 = plot(XT, XT, ‘-k’); % 45° line
p3 = plot(XT, m_T.*XT, ‘-r’); % principal axis
legend(‘cyclogram’, ‘45° line’, ‘linear regression’, ‘principal axis’);
xlabel(‘left joint (deg)’, ‘fontsize’, 5);
ylabel(‘right joint (deg)’, ‘fontsize’, 5);
title(‘syncronized cyclogram’);
end

References

  1. Compston, A.; Coles, A. Multiple sclerosis. Lancet 2008, 372, 1502–1517. [Google Scholar] [CrossRef]
  2. Koch-Henriksen, N.; Sørensen, P.S. The changing demographic pattern of multiple sclerosis epidemiology. Lancet Neurol. 2010, 9, 520–532. [Google Scholar] [CrossRef]
  3. Thompson, A.J.; Baranzini, S.E.; Geurts, J.; Hemmer, B.; Ciccarelli, O. Multiple sclerosis. Lancet 2018, 91, 1622–1636. [Google Scholar] [CrossRef]
  4. Cameron, M.H.; Lord, S. Postural control in multiple sclerosis: Implications for fall prevention. Curr. Neurol. Neurosci. Rep. 2010, 10, 407–412. [Google Scholar] [CrossRef] [PubMed]
  5. Comber, L.; Galvin, R.; Coote, S. Gait deficits in people with multiple sclerosis: A systematic review and meta-analysis. Gait Posture 2017, 51, 25–35. [Google Scholar] [CrossRef]
  6. Lamers, I.; Feys, P. Assessing upper limb function in multiple sclerosis. Mult. Scler. 2014, 20, 775–784. [Google Scholar] [CrossRef]
  7. Buzaid, A.; Dodge, M.P.; Handmacher, L.; Kiltz, P.J. Activities of daily living: Evaluation and treatment in persons with multiple sclerosis. Phys. Med. Rehabil Clin. N. Am. 2013, 24, 629–638. [Google Scholar] [CrossRef]
  8. Institute of Medicine. Multiple Sclerosis: Current Status and Strategies for the Future; The National Academies Press: Washington, DC, USA, 2001. [Google Scholar]
  9. Rudroff, T.; Proessl, F. Effects of Muscle Function and Limb Loading Asymmetries on Gait and Balance in People with Multiple Sclerosis. Front. Physiol. 2018, 9, 531. [Google Scholar] [CrossRef]
  10. Flachenecker, P.; Henze, T.; Zettl, U.K. Spasticity in patients with multiple sclerosis: Clinical characteristics, treatment and quality of life. Acta Neurol. Scand. 2014, 129, 154–162. [Google Scholar] [CrossRef] [PubMed]
  11. Chung, L.H.; Remelius, J.G.; van Emmerik, R.E.; Kent-Braun, J.A. Leg power asymmetry and postural control in women with multiple sclerosis. Med. Sci. Sports Exerc. 2008, 40, 1717–1724. [Google Scholar] [CrossRef]
  12. Larson, R.D.; McCully, K.K.; Larson, D.J.; Pryor, W.M.; White, L.J. Bilateral differences in lower-limb performance in individuals with multiple sclerosis. J. Rehabil. Res. Dev. 2013, 50, 215–222. [Google Scholar] [CrossRef]
  13. Proessl, F.; Ketelhut, N.B.; Rudroff, T. No association of leg strength asymmetry with walking ability, fatigability, and fatigue in multiple sclerosis. Int. J. Rehabil. Res. 2018, 41, 267–269. [Google Scholar] [CrossRef] [PubMed]
  14. Farrell III, J.W.; Motl, R.W.; Learmonth, Y.C.; Pilutti, L.A. Persons with Multiple Sclerosis Exhibit Strength Asymmetries in both Upper and Lower Extremities. Physiotherapy 2020, 25, S0031-9406(20)30392-8. [Google Scholar] [CrossRef] [PubMed]
  15. Workman, C.D.; Fietsam, A.C.; Rudroff, T. Associations of lower limb joint asymmetry with fatigue and disability in people with multiple sclerosis. Clin. Biomech. 2020, 75, 104989. [Google Scholar] [CrossRef] [PubMed]
  16. Daunoraviciene, K.; Ziziene, J.; Ovcinikova, A.; Kizlaitiene, R.; Griskevicius, J. Quantitative body symmetry assessment during neurological examination. Technol. Health Care 2020, 28, 573–584. [Google Scholar] [CrossRef]
  17. Filli, L.; Sutter, T.; Easthope, C.S.; Killeen, T.; Meyer, C.; Reuter, K.; Lörincz, L.; Bolliger, M.; Weller, M.; Curt, A.; et al. Profiling walking dysfunction in multiple sclerosis: Characterisation, classification and progression over time. Sci. Rep. 2018, 8, 4984. [Google Scholar] [CrossRef] [PubMed]
  18. Cofré-Lizama, L.E.; Khan, F.; Lee, P.V. The use of laboratory gait analysis for understanding gait deterioration in people with multiple sclerosis. Mult. Scler. 2016, 22, 1768–1776. [Google Scholar] [CrossRef]
  19. Robinson, R.O.; Herzog, W.; Nigg, B.M. Use of force platform variables to quantify the effects of chiropractic manipulation on gait symmetry. J. Manip. Physiol. Ther. 1987, 10, 172–176. [Google Scholar]
  20. Viteckova, S.; Kutilek, P.; Svoboda, Z.; Krupicka, R.; Kauler, J.; Szabo, Z. Gait symmetry measures: A review of current and prospective methods. Biomed. Signal Proces. 2018, 42, 89–100. [Google Scholar] [CrossRef]
  21. Dujmovic, I.; Radovanovic, S.; Martinovic, V.; Dackovic, J.; Maric, G.; Mesaros, S.; Pekmezovic, T.; Kostic, V.; Drulovic, J. Gait pattern in patients with different multiple sclerosis phenotypes. Mult. Scler. Relat. Disord. 2017, 13, 13–20. [Google Scholar] [CrossRef]
  22. Moraes, A.G.; Neri, S.G.R.; Motl, R.W.; Tauil, C.B.; Glehn, F.V.; Corrêa, É.C.; de David, A.C. Effect of hippotherapy on walking performance and gait parameters in people with multiple sclerosis. Mult. Scler. Relat. Disord. 2020, 43, 102203. [Google Scholar] [CrossRef]
  23. Liao, F.; Wang, J.; He, P. Multi-resolution entropy analysis of gait symmetry in neurological degenerative diseases and amyotrophic lateral sclerosis. Med. Eng. Phys. 2008, 30, 299–310. [Google Scholar] [CrossRef] [PubMed]
  24. Xie, H.-B.; Zheng, Y.-P.; Guo, J.-Y.; Chen, X. Cross-fuzzy entropy: A new method to test pattern synchrony of bivariate time series. Inf. Sci. 2010, 180, 1715–1724. [Google Scholar] [CrossRef]
  25. Kutilek, P.; Viteckova, S.; Svoboda, Z.; Socha, V.; Smrcka, P. Kinematic quantification of gait asymmetry based on characteristics of angle-angle diagrams. Acta Polytechnica Hungarica 2014, 11, 25–38. [Google Scholar]
  26. Viteckova, S.; Kutilek, P.; Krupicka, R.; Adamova, B.; Szabo, Z.; de Brito, A.C.D.M.; Kopecka, J. Evaluation of movement of patients with Parkinson’s disease using wearable MoCap system and bilateral cyclograms. In Proceeding of the International Conference on Applied Electronics, Plisen, Chech Republic, 5–6 September 2017; University of West Bohami: Plisen, Chech Republic, 2017; pp. 269–272. [Google Scholar] [CrossRef]
  27. Pilkar, R.; Ramanujam, A.; Chervin, K.; Forrest, G.; Nolan, K.J. Cyclogram based Joint Symmetry Assessment after Utilization of a Foot Drop Stimulator during Post Stroke Hemiplegic Gait. J. Biomech. Eng. 2018. [Google Scholar] [CrossRef] [PubMed]
  28. Sung, P.S.; Danial, P. A Kinematic Symmetry Index of Gait Patterns Between Older Adults with and Without Low Back Pain. Spine 2017, 42, E1350–E1356. [Google Scholar] [CrossRef]
  29. Farkas, G.J.; Schlink, B.R.; Fogg, L.F.; Foucher, K.C.; Wimmer, M.A.; Shakoor, N. Gait asymmetries in unilateral symptomatic hip osteoarthritis and their association with radiographic severity and pain. Hip. Int. 2019, 29, 209–214. [Google Scholar] [CrossRef]
  30. Bai, X.; Ewins, D.; Crocombe, A.D.; Xu, W. Kinematic and biomimetic assessment of a hydraulic ankle/foot in level ground and camber walking. PLoS ONE 2017, 12, e0180836. [Google Scholar] [CrossRef] [PubMed] [Green Version]
  31. Grieve, D.W. Gait patterns and the speed of walking. Biomed. Eng. 1968, 3, 119–122. [Google Scholar]
  32. Crenshaw, S.J.; Richards, J.G.; Miller, C.M. Gait Symmetry in Subjects with Multiple Sclerosis. Med. Sci. Sports Exerc. 2006, 38, S1. [Google Scholar] [CrossRef]
  33. Polman, C.H.; Reingold, S.C.; Edan, G.; Filippi, M.; Hartung, H.P.; Kappos, L.; Lublin, F.D.; Metz, L.M.; McFarland, H.F. Diagnostic criteria for multiple sclerosis: 2005 revisions to the McDonald criteria. Ann. Neurol. 2005, 58, 840–846. [Google Scholar] [CrossRef] [PubMed] [Green Version]
  34. Polman, C.H.; Reingold, S.C.; Banwell, B.; Clanet, M.; Cohen, J.A.; Filippi, M.; Fujihara, K.; Havrdova, E.; Hutchinson, M.; Kappos, L.; et al. Diagnostic criteria for multiple sclerosis: 2010 revisions to the McDonald criteria. Ann. Neurol. 2011, 69, 292–302. [Google Scholar] [CrossRef] [Green Version]
  35. Pau, M.; Coghe, G.; Atzeni, C.; Corona, F.; Pilloni, G.; Marrosu, M.G.; Cocco, E.; Galli, M. Novel characterization of gait impairments in people with multiple sclerosis by means of the gait profile score. J. Neurol. Sci. 2014, 345, 159–163. [Google Scholar] [CrossRef] [PubMed]
  36. Pau, M.; Coghe, G.; Corona, F.; Marrosu, M.G.; Cocco, E. Effect of spasticity on kinematics of gait and muscular activation in people with Multiple Sclerosis. J. Neurol. Sci. 2015, 358, 339–344. [Google Scholar] [CrossRef] [PubMed]
  37. Pau, M.; Corona, F.; Coghe, G.; Marrosu, M.G.; Cocco, E. Quantitative assessment of the effects of 6 months of adapted physical activity on gait in people with multiple sclerosis: A randomized controlled trial. Disabil. Rehabil. 2017, 13, 1–11. [Google Scholar] [CrossRef] [PubMed]
  38. Wells, R.P. The kinematics and energy variations of swing-through crutch gait. J. Biomech. 1979, 12, 579–585. [Google Scholar] [CrossRef]
  39. Crosbie, J. Kinematics of walking frame ambulation. Clin. Biomech. 1993, 8, 31–36. [Google Scholar] [CrossRef]
  40. Davis, R.B.; Õunpuu, S.; Tyburski, D. A gait analysis data collection and reduction technique. Hum. Mov. Sci. 1991, 10, 575–587. [Google Scholar] [CrossRef]
  41. Goswami, A. Kinematic quantification of gait symmetry based on bilateral cyclograms. In Proceedings of the International Society of Biomechanics XIXth Congress, Dunedin, New Zealand, 6–11 July 2003. [Google Scholar]
  42. Hershler, C.; Milner, M. Angle-angle diagrams in the assessment of locomotion. Am. J. Phys. Med. 1980, 59, 109–125. [Google Scholar]
  43. Goswami, A. A new gait parameterization technique by means of cyclogram moments: Application to human slope walking. Gait Posture 1998, 8, 15–36. [Google Scholar] [CrossRef]
  44. Crenshaw, S.J.; Richards, J.G. A method for analyzing joint symmetry and normalcy, with an application to analyzing gait. Gait Posture 2006, 24, 515–521. [Google Scholar] [CrossRef]
  45. Cohen, J. Statistical Power Analysis for the Behavioral Sciences, 2nd ed.; Lawrence Erlbaum Associates: Hillsdale, MI, USA, 1998. [Google Scholar]
  46. Lord, S.; Galna, B.; Rochester, L. Moving forward on gait measurement: Toward a more refined approach. Mov. Disord. 2013, 28, 1534–1543. [Google Scholar] [CrossRef] [PubMed]
  47. Cofré Lizama, L.E.; Bastani, A.; van der Walt, A.; Kilpatrick, T.; Khan, F.; Galea, M.P. Increased ankle muscle coactivation in the early stages of multiple sclerosis. Mult. Scler. J. Exp. Transl. Clin. 2020, 11, 6. [Google Scholar] [CrossRef] [PubMed] [Green Version]
  48. Kalron, A. Association between perceived fatigue and gait parameters measured by an instrumented treadmill in people with multiple sclerosis: A cross-sectional study. J. Neuroeng. Rehabil. 2015, 12, 34. [Google Scholar] [CrossRef] [Green Version]
  49. Escudero-Uribe, S.; Hochsprung, A.; Izquierdo-Ayuso, G. Gait pattern changes after six-minute walk test in persons with multiple sclerosis. Physiother. Res. Int. 2019, 24, e1741. [Google Scholar] [CrossRef] [PubMed] [Green Version]
  50. Shema-Shiratzky, S.; Gazit, E.; Sun, R.; Regev, K.; Karni, A.; Sosnoff, J.J.; Herman, T.; Mirelman, A.; Hausdorff, J.M. Deterioration of specific aspects of gait during the instrumented 6-min walk test among people with multiple sclerosis. J. Neurol. 2019, 266, 3022–3030. [Google Scholar] [CrossRef]
  51. Taborri, J.; Studer, V.; Grossi, P.; Brambilla, L.; Patanè, F.; Ferrò, M.T.; Mantegazza, R.; Rossi, S. Reliability and Repeatability Analysis of Indices to Measure Gait Deterioration in MS Patients during Prolonged Walking. Sensors 2020, 20, 5063. [Google Scholar] [CrossRef]
  52. Richmond, S.B.; Swanson, C.W.; Peterson, D.S.; Fling, B.W. A temporal analysis of bilateral gait coordination in people with multiple sclerosis. Mult. Scler. Relat. Disord. 2020, 45, 102445. [Google Scholar] [CrossRef]
  53. Von Meyenburg, J.; Wilm, B.J.; Weck, A.; Petersen, J.; Gallus, E.; Mathys, J.; Schaetzle, E.; Schubert, M.; Boesiger, P.; von Meyenburg, K.; et al. Spinal cord diffusion-tensor imaging and motor-evoked potentials in multiple sclerosis patients: Microstructural and functional asymmetry. Radiology 2013, 267, 869–879. [Google Scholar] [CrossRef]
  54. Ramari, C.; Hvid, L.G.; David, A.C.; Dalgas, U. The importance of lower-extremity muscle strength for lower-limb functional capacity in multiple sclerosis: Systematic review. Ann. Phys. Rehabil. Med. 2020, 63, 123–137. [Google Scholar] [CrossRef]
  55. Plotnik, M.; Giladi, N.; Hausdorff, J.M. A new measure for quantifying the bilateral coordination of human gait: Effects of aging and Parkinson’s disease. Exp. Brain Res. 2007, 181, 561–570. [Google Scholar] [CrossRef]
  56. Plotnik, M.; Wagner, J.M.; Adusumilli, G.; Gottlieb, A.; Naismith, R.T. Gait asymmetry, and bilateral coordination of gait during a six-minute walk test in persons with multiple sclerosis. Sci. Rep. 2020, 10, 12382. [Google Scholar] [CrossRef] [PubMed]
  57. Pau, M.; Corona, F.; Pilloni, G.; Porta, M.; Coghe, G.; Cocco, E. Do gait patterns differ in men and women with multiple sclerosis? Mult. Scler. Relat. Disord. 2017, 18, 202–208. [Google Scholar] [CrossRef] [PubMed]
  58. Farrell, J.W., III; Merkas, J.; Pilutti, L.A. The Effect of Exercise Training on Gait, Balance, and Physical Fitness Asymmetries in Persons with Chronic Neurological Conditions: A Systematic Review of Randomized Controlled Trials. Front. Physiol. 2020, 11, 585765. [Google Scholar] [CrossRef] [PubMed]
Figure 1. Graphic representation of a cyclogram and its main features considered for the present study.
Symmetry 13 00598 g001
Figure 2. Example of comparison between cyclograms of unaffected individuals and people with MS of different disability levels. The diagram refers to the hip joint.
Symmetry 13 00598 g002
Table 1. Anthropometric and clinical features of participants. Values are expressed as mean (SD).
Healthy ControlsAll MSMS Low-Mild Disability
(EDSS ≤3.5)
MS Moderate-Severe Disability (EDSS >3.5)
Participants (M, F)81 (44F, 37M)101 (55F, 46M)59 (33F, 26M)42 (22F, 20M)
Age (years)48.9 (15.2)46.3 (10.4)44.2 (10.3)49.3 (9.7)
Body Mass (kg)65.2 (11.4)64.7 (12.0)66.1 (12.5)62.8 (11.1)
Height (cm)167.2 (9.1)166.3 (9.3)166.7 (9.6)165.8 (9.0)
EDSS Score3.5 (1.7)2.4 (1.0)5.2 (1.0)
EDSS: Expanded Disability Status Scale; MS: Multiple Sclerosis.
Table 2. Comparison between spatio-temporal parameters of gait of people with MS and unaffected individuals. Stance, swing and double support phases duration are expressed as percentage of the gait cycle. Values are expressed as mean (SD).
Healthy ControlsAll MSMS Low-Mild Disability
(EDSS ≤3.5)
MS Moderate-Severe Disability (EDSS >3.5)
Gait Speed (m/s)1.23 (0.19)0.85 (0.34) a1.00 (0.31) a0.65 (0.27) a,b
Stride Length (m)1.29 (0.13)1.02 (0.25) a1.09 (0.22) a0.92 (0.24) a,b
Cadence (steps/min)113.07 (10.34)96.49 (20.26) a104.48 (17.06) a85.26 (19.17) a,b
Step Width (m)0.20 (0.03)0.22 (0.04) a0.21 (0.03) 0.23 (0.04) a
Stance Phase59.09 (2.80)63.63 (4.82) a62.51 (4.03) a65.22 (5.41) a,b
Swing Phase40.45 (1.76)35.78 (4.78) a37.22 (4.01) a33.75 (5.08) a,b
Double Support19.86 (3.60)29.38 (10.72) a25.58 (8.24) a34.7 (11.60) a,b
The symbol a indicates significant difference vs. Healthy Controls after Bonferroni correction. The symbol b indicates significant difference vs. people with MS with low-mild disability after Bonferroni correction.
Table 3. Comparison between symmetry indexes of people with MS and unaffected individuals. Values are expressed as mean (SD).
Cyclogram
Parameter
Healthy ControlsAll MSMS Low-Mild Disability
(EDSS ≤ 3.5)
MS Moderate-Severe Disability (EDSS >3.5)
AreaHip108.17 (98.54)195.52 (190.40) a144.16 (163.77)267.68 (203.34) a,b
Orientation ϕ1.58 (1.34)5.09 (7.06) a2.28 (2.64)9.05 (9.18) a,b
Trend Symmetry0.26 (0.43)1.74 (2.97) a0.66 (0.98)3.27 (4.02) a,b
AreaKnee270.60 (192.50)311.18 (269.64)262.71 (259.20)379.28 (272.33)
Orientation ϕ1.51 (1.57)6.99 (9.60) a2.22 (2.46)13.71 (11.71) a,b
Trend Symmetry0.48 (0.41)4.19 (6.89) a1.26 (2.01)8.29 (8.98) a,b
AreaAnkle76.45 (62.25)91.07 (82.40)74.50 (68.90)114.33 (94.33)
Orientation ϕ3.05 (2.80)6.45 (6.48) a4.88 (5.38) a8.65 (7.28) a,b
Trend Symmetry1.51 (1.58)8.46 (10.00) a5.40 (9.70) a12.77 (8.84) a,b
The symbol a indicates significant difference vs. Healthy Controls after Bonferroni correction. The symbol b indicates significant difference vs. people with MS with low-mild disability after Bonferroni correction.
Table 4. Spearman’s coefficients for the correlations between spatio-temporal parameters of gait, symmetry indexes and disability level in people with MS.
EDSS ScoreSpeedStride LengthCadenceStep widthDouble Support
AreaHip0.433 **−0.268 **−0.245 *−0.240 *0.1470.321 **
Orientation ϕ0.509 **−0.511 **−0.475 **−0.403 **0.262 **0.426 **
Trend Symmetry0.619 **−0.581 **−0.519 **−0.493 **0.349 **0.568 **
AreaKnee0.314 **−0.225 *−0.322 **−0.0930.318 **0.228 *
Orientation ϕ0.644 **−0.590 **−0.486 **−0.517 **0.473 **0.524 **
Trend Symmetry0.687 **−0.634 **−0.546 **−0.547 **0.419 **0.532 **
AreaAnkle0.223 *−0.136−0.046−0.1140.1240.100
Orientation ϕ0.391 **−0.439 **−0.354 **−0.464 **0.281 **0.376 **
Trend Symmetry0.636 **−0.627 **−0.512 **−0.573 **0.465 **0.509 **
*p < 0.05; ** p < 0.01; EDSS: Expanded Disability Status Scale.
Publisher’s Note: MDPI stays neutral with regard to jurisdictional claims in published maps and institutional affiliations.

