Article

Towards a Novel Computer-Aided Optimization of Microreactors: Techno-Economic Evaluation of an Immobilized Enzyme System

Institute for Micro Process Engineering (IMVT), Karlsruhe Institute of Technology (KIT), 76344 Eggenstein-Leopoldshafen, Germany
*
Author to whom correspondence should be addressed.
Symmetry 2021, 13(3), 524; https://doi.org/10.3390/sym13030524
Submission received: 27 February 2021 / Revised: 18 March 2021 / Accepted: 19 March 2021 / Published: 23 March 2021
(This article belongs to the Special Issue Symmetry and Complexity of Catalysis in Flow Chemistry)

Abstract

:
Immobilized multi-enzyme cascades are increasingly used in microfluidic devices. In particular, their application in continuous flow reactors shows great potential, utilizing the benefits of reusability and control of the reaction conditions. However, capitalizing on this potential is challenging and requires detailed knowledge of the investigated system. Here, we show the application of computational methods for optimization with multi-level reactor design (MLRD) methodology based on the underlying physical and chemical processes. We optimize a stereoselective reduction of a diketone catalyzed by ketoreductase (Gre2) and Nicotinamidadenindinukleotidphosphat (NADPH) cofactor regeneration with glucose dehydrogenase (GDH). Both enzymes are separately immobilized on magnetic beads forming a packed bed within the microreactor. We derive optimal reactor feed concentrations and enzyme ratios for enhanced performance and a basic economic model in order to maximize the techno-economic performance (TEP) for the first reduction of 5-nitrononane-2,8-dione.

1. Introduction

The application of miniaturized continuous reactors has increased rapidly over the past few decades. Microreactors in particular possess great potential for synthesizing various compounds, including substances of pharmaceutical interest [1,2]. Flow reactors [3], and especially micro flow reactors, benefit from increased control of reaction conditions, enhanced mass transport, increased safety, the possibility of automation and easier scale-up [3,4,5,6], as compared to batch reactors. Simultaneously, they enable sustainable and green processes, due to potential recycling of substrates and less chemical waste [7]. Many enzymes require an expensive cofactor, which is consumed [8,9]. In order to create a more cost-efficient process, additional reactions are utilized to regenerate the cofactor [10]. Ideally, this is done in close proximity, e.g., in the same reactor compartment, provided the required reaction conditions such as temperature and pH value for both enzymatic reactions are similar. This can be achieved by enzyme immobilization on macroscopic supports, which can be placed at a desired position in the reactor [11]. To this end, enzymes can be (non-)covalently attached to matrices such as beads, enabling a potentially increased enzyme stability and recycling of the biocatalyst [12,13]. Reactors with immobilized multi-enzyme systems enabled by different immobilization techniques are increasingly gaining attention due to their versatility and application in flow chemistry [14,15,16,17,18]. Applications include packed beds with micrometer- and nanometer-scale particles, wall-coated systems and matrix-entrapped enzymes. We extend this list with an investigation of an overflown packed bed reactor with micrometer-scale particles.
Understanding of such complex multi-enzyme systems is vital to utilize them as efficiently as possible. Thereby material usage, productivity and production cost are optimized while reducing waste. To achieve this, an extensive amount of experiments would normally have to be performed. Computationally aided process design utilizing mathematical models is critical in achieving sufficient knowledge to design high-performing processes with minimal experimental effort [19]. In the past decade, most reactors have been modeled as one-dimensional systems [20]. More complex, higher-dimensional models mostly focus on processes with two phases [21,22,23,24]. For optimization purposes, a tradeoff between accuracy and computational effort has to be met, since typically thousands of reactor calculations have to be performed. For chemical reactors this has been demonstrated [25], whereas for bioprocesses utilizing immobilized enzyme cascades no such examples are to be found yet.
There are a variety of different methods to derive best operating conditions described in the literature. The commonly used Design of Experiments (DoE) [26,27] gives an understanding of how different parameters affect the outcome of the process. Furthermore, cross-parametric influences can be elaborated. Combined with a mathematical model, this enables minimal experimental effort.
The multi-level reactor design (MLRD) methodology developed by Peschel et al. [28] follows a different approach, which is based on the basic governing chemical and physical processes, the so-called elementary process functions (EPF) [29]. Investigating processes in three levels from infinite fluxes to technical approximation, this method enables more profound understanding of the process under investigation including its bottlenecks. This method was successfully applied for different chemical and biochemical processes [28,30,31,32,33].
Despite their successful application, none of these methods tackle the challenge of an economic evaluation of the processes. Although bioprocesses can be superior to chemical reactions in terms of selectivity, safety and environmental profile, their main disadvantage is the cost of the catalyst [34]. This promotes the consideration of economic aspects while improving the performance of the biocatalytic process.
This work is focused on a flow reactor consisting of a porous bed of magnetic beads functionalized with an immobilized ketoreductase (Gre2) and glucose dehydrogenase (GDH) for cofactor regeneration, which was well described and characterized beforehand [35,36]. Within this work, we first determine the most feasible dimension in modeling with regard to accuracy and computational effort for optimizing a multi-enzyme microreactor. The optimization of the reactor uses a theoretical approach to derive optimal feed concentration, enzyme ratios and amounts of immobilized enzymes. We investigate the effects of immobilization of the regeneration enzyme on performance and production cost. Furthermore, we apply the MLRD methodology to the chosen model and add an economic evaluation. We demonstrate the capability of mathematical modeling, the knowledge the models can provide, and how both can be utilized to optimize a microfluidic reactor system for space time yield (STY), specific productivity and techno-economic performance (TEP). The results obtained in the economic study should not be regarded as final values but rather as an indication of an economical reactor design.

2. Materials and Methods

2.1. Reactor System

The findings of this work are based on a previously reported reactor system for the chiral reduction of a diketone within a microreactor and enzymes immobilized on magnetic beads (MBs). The investigated system is an (S)-selective reduction of the symmetrical diketone 5-nitrononane-2,8-dione (NDK) using the ethylglyoxal reductase Gre2 in combination with an NADPH (cofactor) regeneration system catalyzed by glucose 1-dehydrogenase (GDH). The reaction network, as shown in Figure 1, was introduced and investigated in several previous contributions [35,36,37]. Within this work, the intermediate a (5S, 8S)-anti-configured stereoisomer of the hydroxyketone is the desired product and will be referred to as hydroxyketone (HK) in the following. Diol is a possible but undesired consecutive product.
In a first approach, we immobilized Gre2, which is genetically fused to a Halo-Tag variant, on Streptavidin-coated beads (Dynabeads M280), using a HaloTag-PEG-Biotin linker and kept GDH in the aqueous solution. The magnetic beads (MBs) were held inside the reactor with magnets placed below the reactor, forming a packed bed. Burgahn et al. clearly indicated a need for higher regeneration rates inside the packed bed [36]. To achieve a sufficient concentration of NADPH within the packed bed layer, GDH is immobilized on separate beads bearing reactive epoxy groups (Dynabeads M270 Epoxy) by employing a His-SpyCatcher linker. The tetrameric GDH is equipped with SpyTag fusion proteins and reacts with the linker in a covalent manner, thereby efficiently binding GDH to the beads.
The reactor encompasses a single microchannel with 200 µm height, 2 mm width and a particle bed with a length of 48 mm. The MBs are held within the reactor with eight magnets and form a packed bed at the bottom of the channel, schematically shown in Figure 2. This system was previously investigated by Burgahn et al., additionally applying a mathematical model to create a deeper understanding of the transport and reaction phenomena within the reactor. This model is also used here and is addressed as a basic Matlab model in the following. It can be regarded as a one-dimensional model, as it divides the reactor into sequential segments in the flow direction. Each segment consists of a packed bed and an ideal mixed free volume above the packed bed. Reactions and mass transport transversal to the flow direction in the packed bed are described by a set of ordinary differential equations, which are solved numerically assuming a finite mass transfer between the packed bed and the free volume above according to a Sherwood number correlation. Mass transport within the packed bed is calculated using effective diffusivities based on porosity and tortuosity of a compact packing of uniform, spherical particles. The particle bed is assumed to be a homogeneous package with constant height. Due to the high magnetic forces and the low flow rates, the packed bed is stable; in particular, there are no magnetic beads dragged out. The actual packing height depends on the amount of loaded particles. Inhomogeneity within the particle bed was not considered. The reactions are described with multi-substrate reaction mechanisms [38]. The model approximated the three-dimensional rectangular microchannel by a one-dimensional model in Matlab. A more detailed description of the model can be found in the work of Burgahn et al. [36].
The kinetic parameters were fitted for NDK concentrations ranging from 0.1 to 2 mmol/L for Gre2 and 1 to 100 mmol/L glucose for GDH reactions, covering the concentrations in this work. NADP/H ranged for both reactions between 0.1 and 1 mmol/L. For increased NADP/H concentration, an extrapolation was applied. The model was found to show good agreement with experimental data, which justifies its use for the optimization intended in this work. For bed heights of 88 µm, good agreement with experimental data could be shown. For flow rates from 0.5 to 2 µL/min, correct tendencies were predicted by the model; however, conversion was slightly overestimated for higher flow rates. This was attributed to remaining uncertainties of the mass transport parameters such as tortuosity and porosity. Reactor behavior for process parameters such as bed heights above 88 µm (more than 4.5 mg MBs) and high NADPH concentrations are not in the validated range of parameters, hence are extrapolations. This needs to be done in future. Furthermore, the results hint at sufficiently and insufficiently used parts of the reactor, resulting in our desire to enhance the system.
To enable a sufficiently accurate model for optimization of the present reactor, models ranging from a one-dimensional to a three-dimensional representation of the microchannel were investigated and compared with each other regarding their applicability for the MLRD methodology. For this reason, the basic Matlab model was translated to ANSYS Fluent.

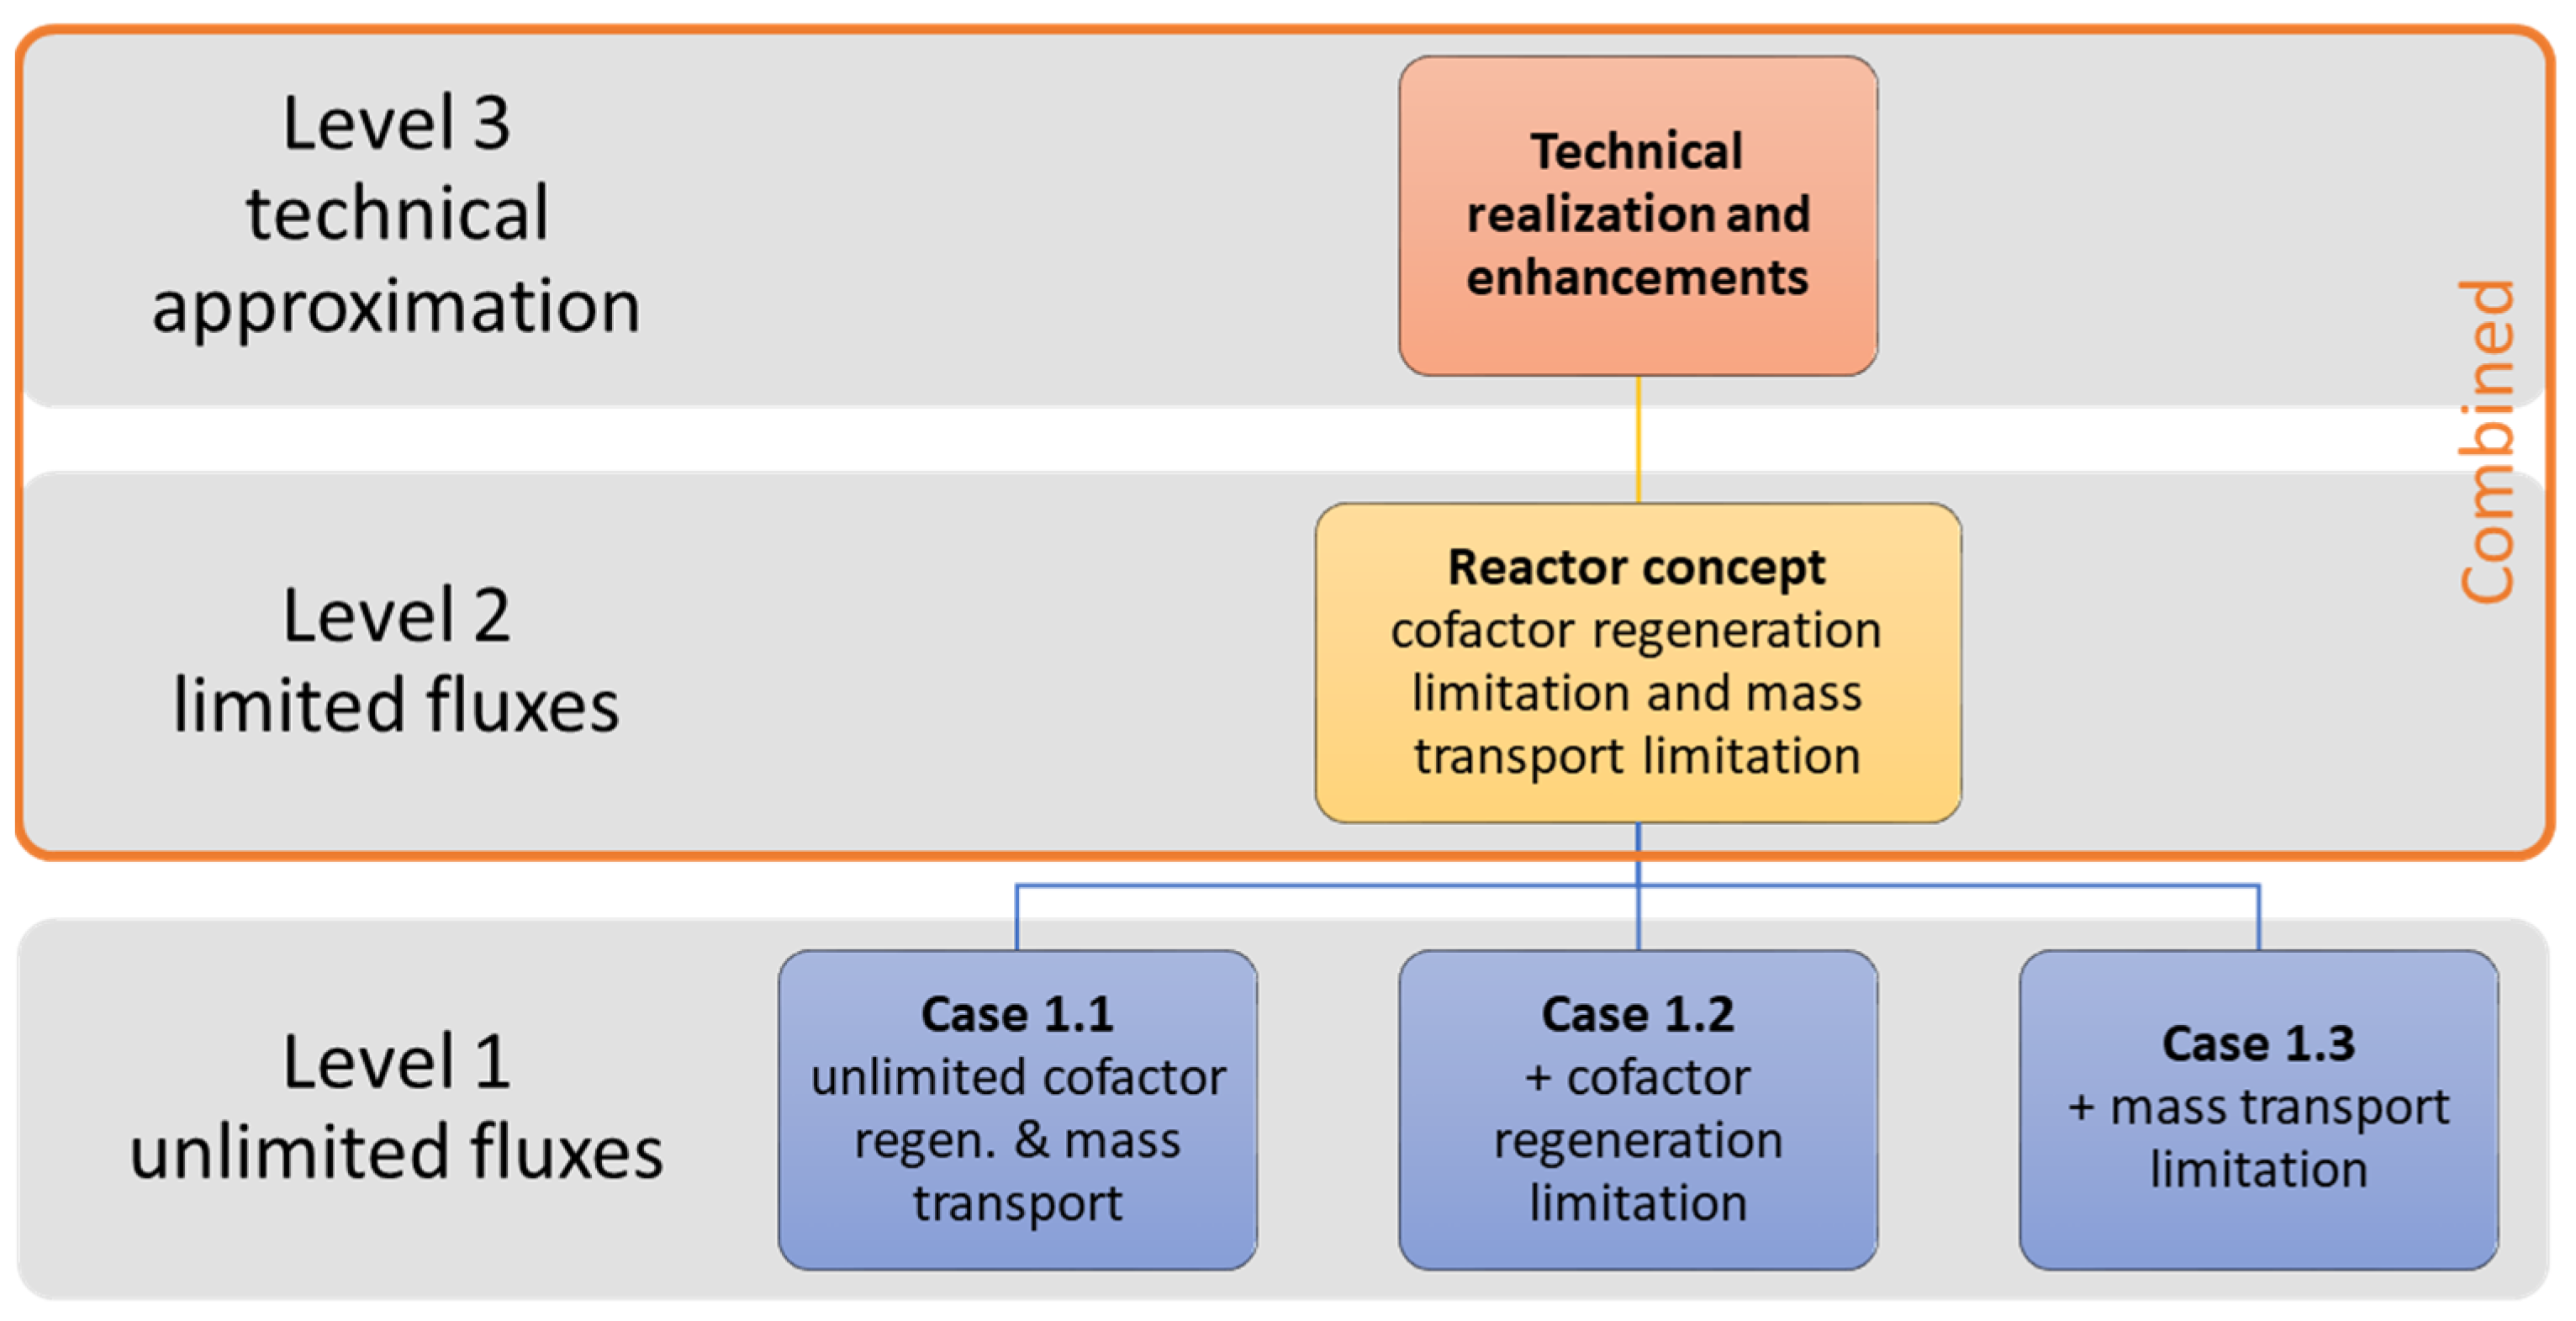
2.2. Systematic Design Methodology

The reactor design as described above holds potential for optimization [36]. While some reactor parameters are fixed due to the conditions, there are several others, such as feed concentration, MB enzyme loading and flow rate, which can be optimized. In the following sections, we give a short overview of the systematic of the multi-level reactor design (MLRD) approach [39] to enhance the reactor. We applied and adjusted this methodology to fit the present reactor system.
As mentioned before, there are a variety of different optimization methodologies. With the concept of elementary process functions (EPF), Freund and Sundmacher [29] took a very basic approach to the task of reactor optimization. They split chemical systems into functional modules regarding physical and chemical processes, which leads to an abstract module-specific system analysis. Based on the idea of EPF, Peschel [28] and Freund [39] developed a multi-level reactor design (MLRD), which has been used successfully for chemical reactors with catalyst deactivation [31], flexible feedstock [30] and catalytic particles [32].
The MLRD methodology contains three levels, shown in Figure 3—level 1: optimal reaction conditions, level 2: optimal reactor concept, and level 3: technical reactor. For level 1, generally, no limitations for heat or mass transport are considered, and thus the catalyst can work under optimal conditions at a given position. It is important to mention that these conditions are the utopian optimum for the reaction and reactor.
In level 2, transport processes are included, aiming to optimize driving forces. This includes the specific dimensions or shapes within a reactor. Thereby, optimal reaction volume designs are evaluated and eventually chosen.
Finally, in level 3 technical approximations are evaluated based on the previously defined optimal reactor conditions. The final set of reactor parameters will be a tradeoff between optimal reactor conditions, technical approximation and productivity of the investigated reactor system.
This method was already successfully applied for different chemical reactor systems, for example, synthesis of methanol [32], of ethylene oxide [28] and of biopharmaceutical manufacturing in Pichia pastoris [33]. The abstract approach of the EPF and MLRD methodology, based on fundamental processes, is a tool with great potential in the field of computer-aided design. It enables a systematic design of enhanced chemical reactors based on physical phenomena.
Considering our specific EPF, we adapted the levels of the MLRD methodology. Optimizing a process requires an understanding of the major contributing sources to enable the best possible reaction conditions. The present multi-enzyme system is realized with a heterogeneous catalyst bed, whereby the prevailing fluxes of materials must be balanced in the optimization. Regarding the reduction reaction, important fluxes include the cofactor regeneration and the mass transport. Within the first level, these fluxes were set to “unlimited” separately, resulting in three separate cases:
  • Case 1.1—unlimited cofactor regeneration and mass transport
  • Case 1.2—unlimited cofactor regeneration (mass transport limitation)
  • Case 1.3—unlimited mass transport (cofactor regeneration limitation)
This allows a clear distinction between the limitation by regeneration and mass transport. The second level will address all limitations due to fluxes and hence will provide reasonably optimized reactor parameters. We formulated the condition for the optimization so as to utilize the reactor PMMA chip at its fullest, resulting in a technical solution for the investigated system. By this approach, we combine level 2 and level 3 into one case. Further technical measures to improve the reactor would be installed upstream or downstream of the reactor. These measures were not investigated within the scope of this work.

2.3. Optimization Methodology

Usually the performance of a catalytic reactor is characterized by yield, selectivity, conversion, space time yield (STY) and catalyst productivity. As the literature shows, these measures proved to be appropriate to optimize biochemical processes [27]. The values reached should be as high as possible. These scalars are defined by Equations (1)–(5). For our optimizations, the intermediate (HK) is the desired product, and therefore STY, yield and biocatalytic productivity P r o d c a t . STY is calculated with the concentration of the desired product (HK) c H K , its molecular mass M ˜ and the residence time τ . The yield relates the product concentration c H K and the feed concentration of the starting material NDK. The biocatalytic productivity is related to the mass of Gre2 m E , which is the enzyme catalyzing the reduction and the amount of HK m H K after 24 h.
S T Y = c H K M ˜ H K τ
Y = c H K c N D K , i n
P r o d c a t = m P m E
The reactor is divided into N segments as outlined in Section 2.1 and in more detail in Burgahn et al. [36]. For each segment i , a mean enzyme utilization (EU) η ¯ j within the packed bed is defined. The segment’s packed bed contains M cells of the height Δ y i with a respective reaction rate R based on the present concentration c i , j in the cell I and segment j. The sum of all the cells’ reaction rates in relation to the volume averaged reaction rate R ¯ j and the bed thickness d b e d results in the mean EU η ¯ j (Equation (4)). This provides an assessment of how well the enzymes in a given segment are utilized. The value of the mean EU ranges from 0 to 1, with 1 showing no transport and cofactor regeneration limitation. Values approaching 0 represent an increased transport and cofactor regeneration limitation. Combining all segments’ mean EU, with respect to the length of the segment, results in a single scalar for the reactor’s EU η R of length L (Equation (5)). η R is calculated for the reduction reaction of NDK to HK, since this is the desired reaction and ranges from 0 to 1.
η ¯ j = 1 R ¯ j d b e d i = 0 M R ( c i ,     j ) Δ y i
η R = 1 L j = 0 N η ¯ j Δ x

2.3.1. Measure of Process Economics

Evaluating the economic performance of a biocatalytic process can be split into capital expenditure (CapEx) and operating expenditure (OpEx) [41]. CapEx covers the cost for installed equipment and materials in €. This includes in this particular case the magnetic beads (MBs) inside this reactor, since they are assumed to be reusable and stationary during the operation of the process. To enable immobilization, the enzymes have to be modified. This adds 90% of the pure enzyme costs, due to the procedure, equipment and labor, excluding the carrier [41]. MB costs are differentiated between streptavidin (Gre2) and epoxy (GDH) immobilization techniques, since streptavidin MBs are almost five times more expensive [42]. This leads to CapEx calculations as described in Equation (6), with the amount of carriers for Gre2 and GDH and the cost for the modified enzymes.
Operating costs (OpEx) consist of direct, indirect and fixed costs in € per time. The latter two can be calculated from capital investment as converted annual cost. Process parameters, conversion, etc. result in certain amounts of raw materials consumed in the process as given by the material balances. Raw material costs are listed in the Supplementary Materials. Additionally, energy consumption, maintenance, requirements for heating, sterilization and labor costs are included in the operation costs.
A complete economic analysis is a major effort, so we apply here a simplified cost estimation for the present reactor system. Assuming that all investigated cases are using the same equipment, we only investigated the case-specific CapEx, namely the MBs and the related immobilized enzymes. OpEx is calculated for pumped media and their components, excluding buffer and water. This results in a sum of all raw materials fed with the adapted flow rate of V ˙ , molecular weight M ˜ i and their respective costs as shown in Equation (7). Deriving an overall scalar to measure the economic performance, we calculate product cost with CapEx and OpEx as given by Equation (8). This is achieved by relating costs and the amount of HK produced after one week of operation time (OT).
C a p E x   = m G r e 2 p r i c e M B , G r e + m G D H p r i c e M B , G D H + N G r e 2 M ˜ G r e 2 p r i c e G r e 2 , i m m + N G D H M ˜ G D H p r i c e G D H , i m m
O p E x   = i = 1 N r .   o f   s p e c i e s c f e e d , i · M ˜ i · p r i c e i · V ˙
p r o d u c t c o s t   = ( C a p E x + O p E x · O T ) V ˙ · c P · M ˜ P · O T
Due to the simplifications, the cost derived in this work only provides an economic trend for a cost-effective reactor design. For a detailed and realistic cost estimation, a complete economic study has to be performed, which is, however, beyond the scope of this paper.

2.3.2. Boundary Conditions

Due to the variety of adjustable parameters, we define boundary conditions with regard to the reactions and the reactor chip used in the experiments [35,36]. The desired yield for the intermediate should be achieved at the end of the reactor. The flow rate V ˙ and hence the residence time τ will be adjusted to achieve the desired yield. To keep the case studies consistent and comparable, the feed concentrations of NDK and glucose are kept constant. For all cases, fixed values of temperature of 30 °C and pH value of 7.6 are assumed. These values had been identified as an appropriate choice in the experimental screening phase. The pH value is constant within the reactor due to the addition of a T-TEMg buffer to the feed. A steady temperature was achieved with a thermostat for heating and cooling the PMMA chip. Of course, temperature and pH value have a great impact on the reaction kinetics, and their influences have to be built into the kinetic model if variations of temperature and pH value are to be considered. In our case we excluded both as variable process parameters. Considering this in the optimization would require a kinetic model describing their influence on the reaction rate, which has not yet been established. Furthermore, all results depict stationary reactor conditions.
Enzyme immobilization provides a general system parameter, whether GDH is fixed in the reactor or dissolved in the feed. The latter benefits from cofactor regeneration in the liquid volume with an equilibrated NADP/NADPH concentration in the feed. However, in that case expensive GDH flows through the reactor, which increases the product cost. Although the immobilization demands further costs in preparation, we obtain an enzyme fixed within the reactor. Compared with feeding GDH, the average enzyme concentration within the layer is higher due to the loading capacity of the beads.
Kinetic parameters from Burgahn et al. are used in all calculations in this work [36]. As reported in the literature, the immobilization of GDH has a negligible impact on its activity [35]. Therefore, kinetic parameters for immobilized GDH are assumed to be equal to those of free GDH.
The packed bed within the reactor is assumed to be homogeneous with a fixed height. The bed height is proportional to the amount of beads loaded in the channel. The basic case contains 4.5 mg of beads in the reactor, resulting in a bed height of 88 μm [36]. Due to different methods of immobilization used for Gre2 and GDH, they cannot be provided co-immobilized on the same magnetic beads. The total amount of beads held in the reactor is comprised of both types of loaded MBs ( m t o t a l = m G r e 2 + m G D H ). Hence, adding immobilized GDH will reduce the amount of Gre2 in the reactor for the same amount of magnetic beads or bed height. For both immobilization methods, a maximum enzyme loading is assumed (Gre2: 24 pmol/mg; GDH: 55 pmol/mg).
These conditions result in a set of parameters for the investigated reactor system. As shown in Figure 4, the parameters are classified into reactor and flow parameters. The latter describe the concentrations in the feed stream. NADP in particular is an interesting parameter, since NADPH is three times more expensive then NADP [43,44]. For the different cases of an immobilized or dissolved regeneration enzyme GDH, its concentration in the feed, the enzyme loading on the beads and the bead ratio are included in the reaction and reactor parameters. Reactor parameters are bound to fixed costs for the investigated case. Bed thickness is proportional to the amount of loaded beads. For the case of immobilized GDH, the ratio of Gre2 versus GDH beads is an essential reactor parameter. Flow rate V ˙ and residence time τ are adapted due to the condition of maximal HK yield at the end of the reactor.

2.3.3. Techno-Economic Performance (TEP)

With the measures described in Section 2.3.1, during the optimization, a tradeoff between a high yield and economic viability with regard to the defined boundary conditions has to be met. To estimate STY, biocatalytic productivity and enzyme utilization (EU) are calculated for maximum yield Y , obtained with the respective value of τ .
Summarizing the measures to fully evaluate the reactor with a focus on performance and economics, the techno-economic performance (TEP) in Equation (9) was introduced and is used as an objective function to be maximized for our system. The case from the investigations by Burgahn et al. was set as a reference for the TEP [36]. All measures refer to the adapted space-time τ for achieving a maximum intermediate yield Y . Since the productivity is related to the amount of enzyme within the system, the EU is covered in the productivity.
max [ T E P ] = max [ S T Y · p r o d c a t p r o d u c t c o s t   · 1 T E P r e f   ]

3. Results and Discussion

3.1. Reactor Model

With an increase in dimensions, mathematical models gain accuracy in modeling fluid dynamics at a tradeoff to the computational effort. For the investigation and especially the optimization of a reactor setup, an accurate and sufficiently fast model is needed, since a lot of calculations have to be performed. Translating the basic 1D Matlab model briefly explained in Section 2.1 into two and three-dimensional computational fluid dynamics (CFD) models in ANSYS Fluent (in the following named model F2D and F3D) enables more detailed results on the concentration patterns in the liquid volume above the packed bed. In addition to a more realistic description of the flow behavior of the fluid, the CFD-based models also account for diffusional transport in all directions, which allows for a more accurate quantification of the mass transport from the bulk liquid flow along the channel to the packed bed.
The kinetics of the enzymatic reactions were included via User-Defined-Functions. Transient calculations were performed until steady values were obtained. To keep calculation time reasonable only the entrance region of the reactor was simulated, where the highest reaction rates and therefore also concentration gradients are present.
As a result of the channel geometry and the assumed constant bed height throughout the reactor, the investigated reactor exhibits axial symmetry. Thus, a two-dimensional representation was applied first. The principle of reducing the dimension from a realistic three-dimensional model to a two-dimensional model is commonly used [20,45].
As the Matlab model basically chains axial segments of the free channel volume sequentially, the calculations result in a two-dimensional depiction of the reactor, which can be compared with the model F2D. Figure 5 shows the concentration distribution as calculated by the Matlab and F2D models for the first 2 mm of the reactor. The Matlab model assumes a constant flow velocity over the whole cross-section of the free channel volume, whereas the F2D model yields a parabolic flow velocity profile typical of laminar channel flow. However, the concentration distributions in the packed bed show only small differences. This is even more obvious from Figure 6, which compares the concentration profiles in the y-direction at the beginning of the reactor. The only notable difference is that the Matlab model slightly overestimates the mass transport resistance from the bulk liquid flow to the surface of the packed bed. This is obviously due to the correlation used to derive the Sherwood number. Thereby, a more pronounced drop in the concentration is predicted, and hence small deviations at the top of the catalytic bed are present. However, the concentration profiles within the catalytic bed are almost identical.
An additional calculation for 25 mm reactor length was performed to further investigate differences between the models. The results are shown in Figure 7, which reports the average concentration in the volume above the bed. As the curves for F2D and the basic Matlab model are very similar, the most pronounced differences occur in the entrance region of the reactor. The effects are either diminished, maintained or slowly accumulated along the channel. Since the reduction rate of NDK gets smaller with increasing x-position in the reactor, less NADPH is needed and hence the cofactor regeneration system reaches its equilibrium. Thereby the differences between the Matlab and Fluent models reduce with increasing x-position. Altogether, however, the deviations are small. At 25 mm (half) of the reactor, a maximum deviation of 3.4% of the HK concentration between the F2D model and the basic Matlab model is present for the case shown in Figure 7.
We further investigated the dimensional influence applied to this reactor. The F3D model expands the advantages of the F2D model in comparison to the basic Matlab model, with a consideration of influences by the corners of the channel and possible diffusion-induced inhomogeneity across the width of the channel. Assuming no influences by the solute species, the flow regime is found to be fully laminar (Re = 0.5). Due to the increase in complexity, the simulated length of the reactor had to be reduced to 1 mm to keep manageable computing times. Differences between models F2D and F3D are negligible with a deviation of 0.1% as shown in Figure S2.
Aiming to select a suitable model to be used for the intended optimization, the effort in computing time for the whole reactor has to be considered. A comparison is given in Table 1 for the three different models. With respect to hundreds of reactor simulations to be performed in the course of the optimization, the decision for the basic Matlab model is obvious. It cuts the computational time immensely and provides the best compromise between accuracy and computational time for our investigated systems.

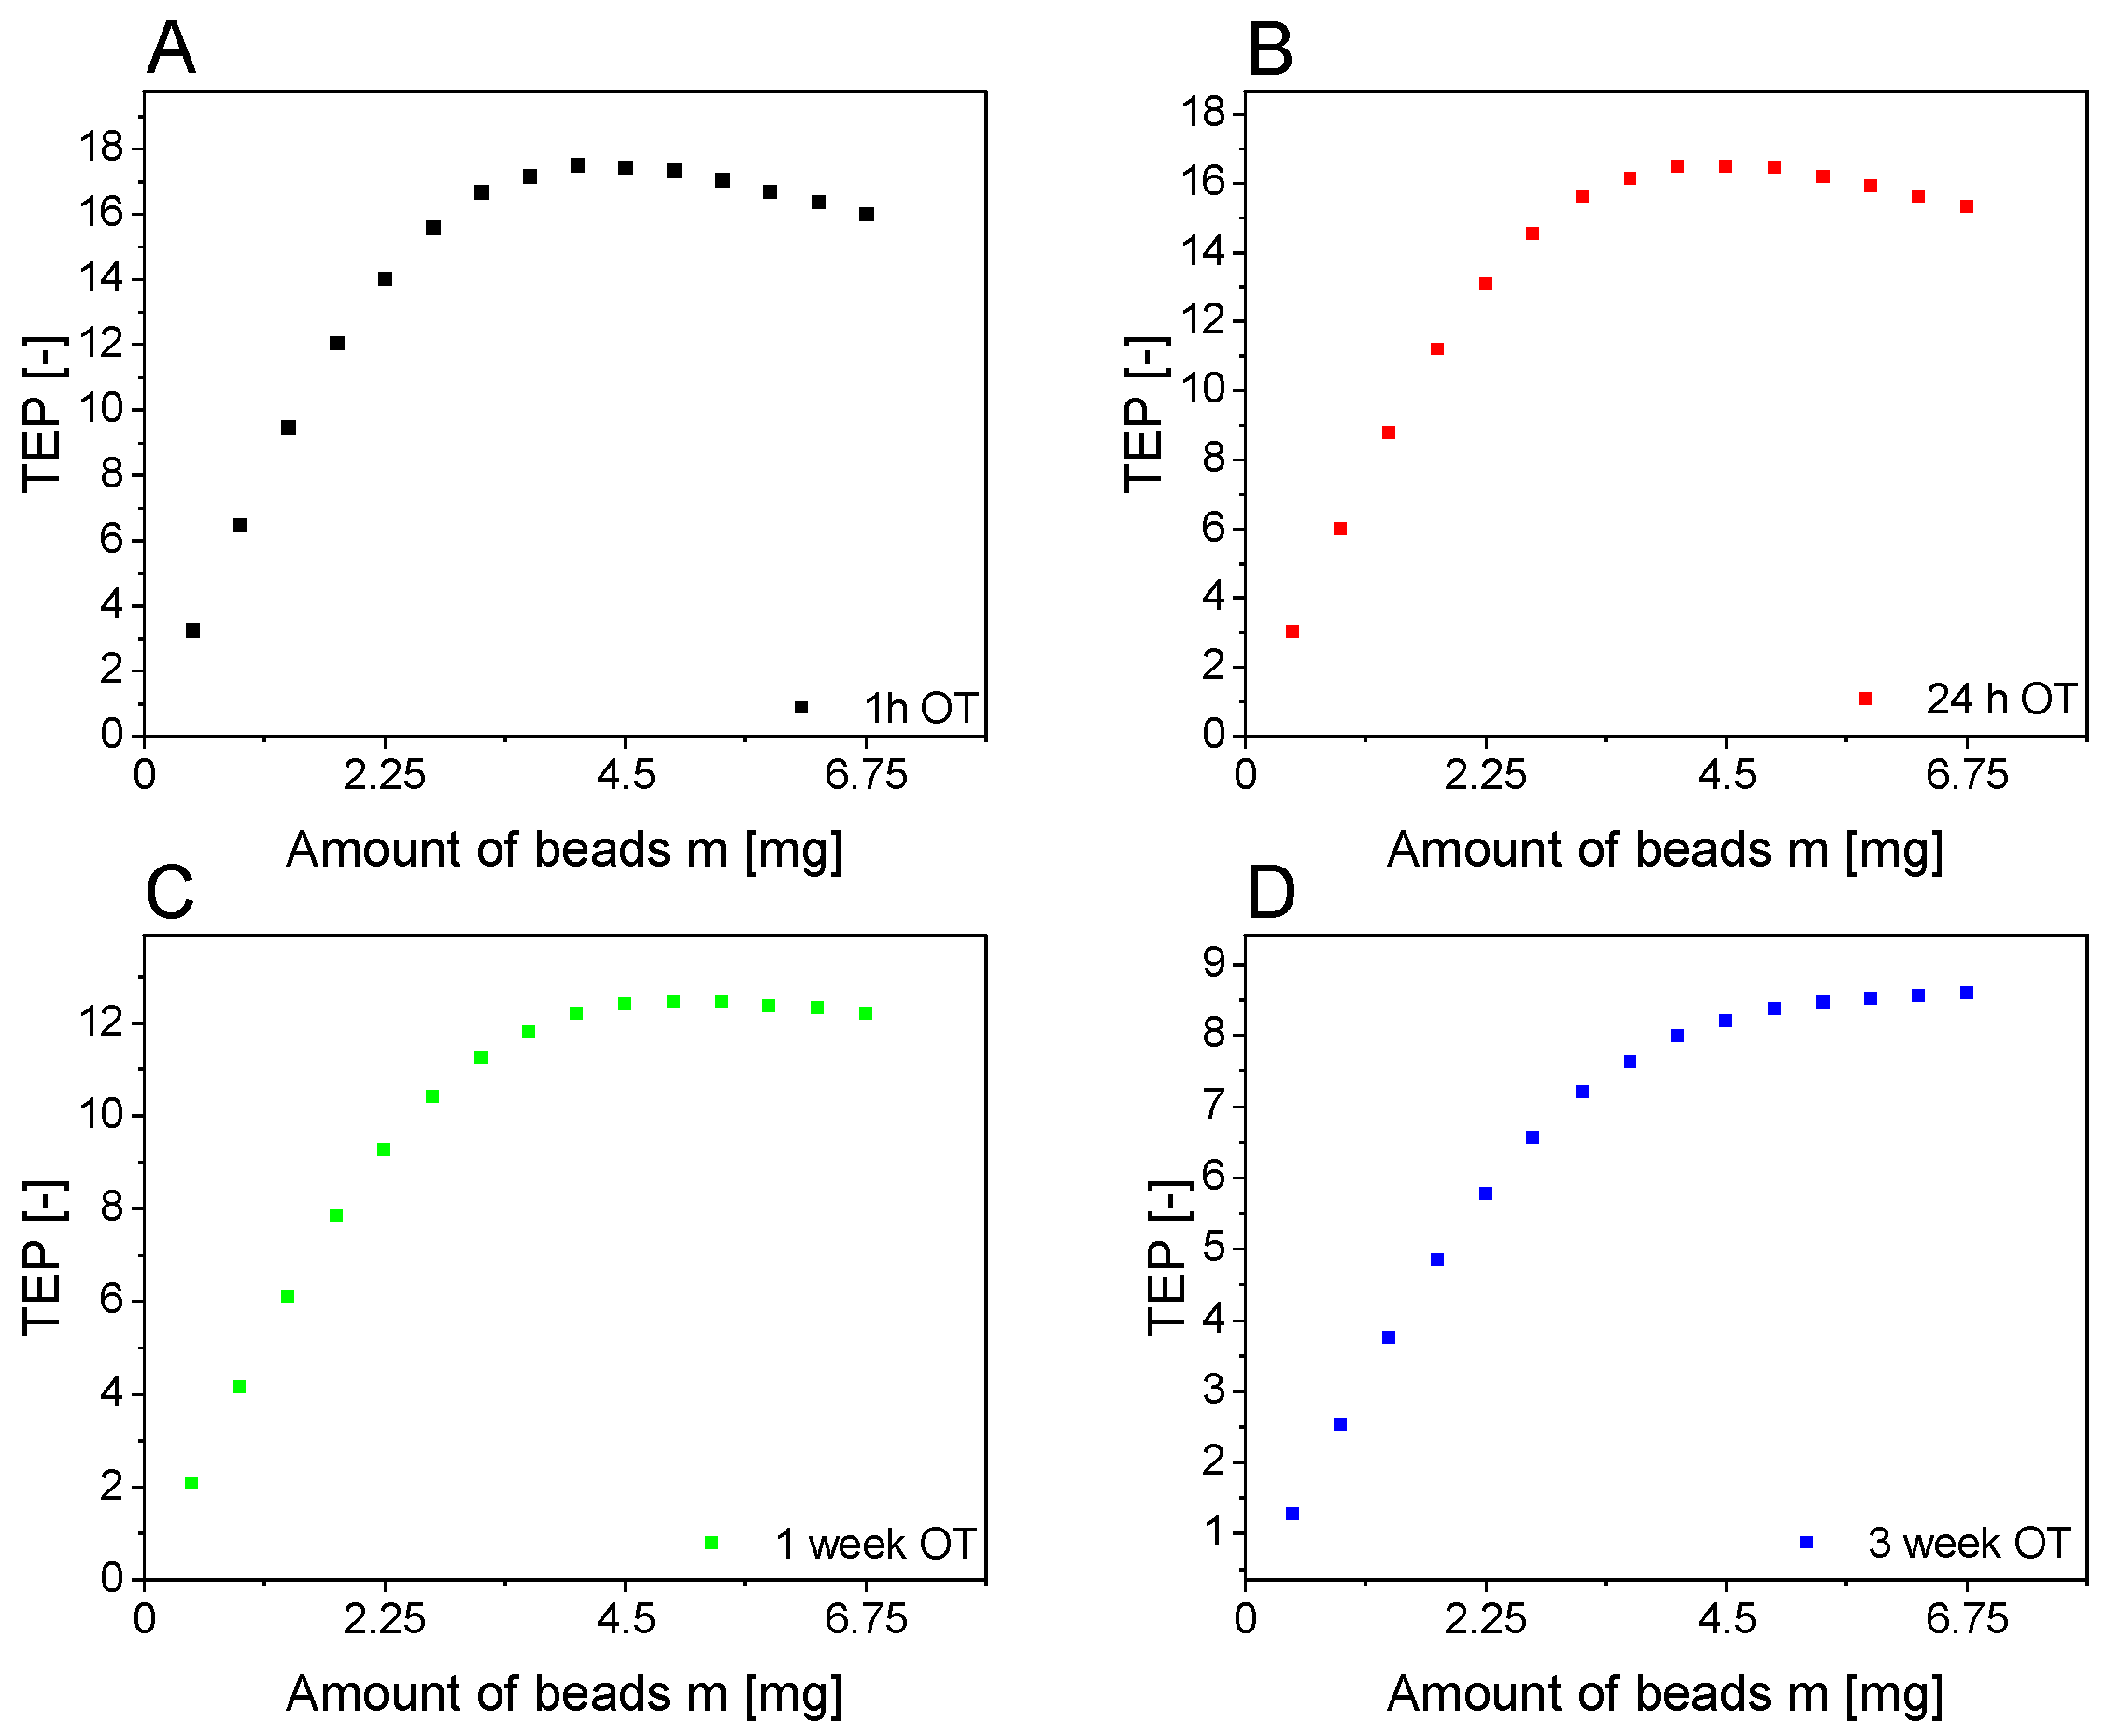
3.2. GDH Immobilization

The immobilization of GDH influences the economic efficiency and the reactor behavior. To compare the effects of immobilization, conditions leading to the same STY are investigated. For both cases 4.5 mg of total MBs was investigated, since this is the easiest realizable amount of beads in the experiments. With a lower amount of beads, the EU and hence the catalytic productivity for aqueous GDH will increase as shown by Burgahn et al. [36]. For all cases, the feed consists of the raw materials NDK, glucose and NADP. In the case of aqueous GDH, NADPH is already produced before the feed is applied to the reactor, hence enabling an immediate onset of reduction reactions, compared with generating NADPH only within the bed in the case of immobilized GDH. NADPH is regenerated in situ in both cases. However, the mean GDH concentration in the bed is more than 15-fold higher when immobilized, compared with aqueous GDH.
Since applying immobilized GDH reduces the amount of Gre2 MBs in the reactor when the total amount of MBs is fixed, an optimal relation had to be found. For the same amount of total beads in the reactor, the same STY was iteratively derived for a bead ratio of 0.6 ( m G r e 2 m t o t a l ) . The resulting reactor characteristics are shown in Table 2. Immobilization of GDH results in benefits in all aspects. The same STY means an increase in productivity from 155.9 to 263.5 g H K g G r e 2 after 24 h operating time for immobilized GDH, since less Gre2 is applied. A batch reactor with the same reaction system with aqueous GDH was experimentally investigated previously [36]. It achieved a maximum HK yield after 2 h, resulting in a productivity of 63.2 g H K g G r e 2 and an STY of 11.6 g L d a y . To uphold this productivity and STY would demand an ideal situation with 100% catalyst recyclability and zero downtime between two consecutive batches. The productivity of the flow system increases with OT as the amount of enzyme is constant. To achieve the idealized batch productivity, the setup with aqueous and immobilized GDH would need to run 5 h for aqueous and 3 h for immobilized GDH.
For immobilized GDH, the bed has a higher η R , which results from an increased GDH concentration in the bed as compared to aqueous GDH. Immobilization is reported to reduce the production costs due to the fixation within the reactor [10,41]. While the operating cost decreases by more than 50%, the capital cost is reduced as well, since GDH beads are cheaper than Gre2 beads.
As indicated in Figure 8, immobilization enables higher NADPH concentration in the bed, due to ongoing regeneration. This is a consequence of high enzyme loadings on the magnetic beads. The reactor behavior with aqueous GDH is set as the reference case and has the TEP of 1. The TEP for immobilized GDH has been found to be 2.28, which shows the overall benefits of GDH immobilization. Due to this we studied only the reactor system with immobilized GDH.

3.3. Level 1: Infinite Fluxes

Within the reactor, a tradeoff between optimal reaction conditions and limiting physical phenomena has to be met. To investigate the influences of cofactor regeneration and mass transport fluxes, they were artificially set to unlimited in three different cases. As described in Section 2.2, this level shows the optimal reaction conditions with a view to bead ratio and NADP concentration in the feed. The NADP feed concentration sets the maximal possible equilibrium NADPH concentration within the system. In regard to this, we address this correlation with “NADP/H” concentration. In cases 1.1 and 1.2 infinitely fast cofactor regeneration enables a constant, maximum equilibrium NADPH concentration and hence will minimize the cofactor influences on the reduction rates. Raising the NADP/H concentration increases conversion and yield while increasing the operating costs. For case 1.2, the optimum NADP feed concentration is evaluated. Enabling a limited cofactor regeneration (case 1.3) aims at optimizing the bead ratios. This is crucial for the reactor behavior, since this parameter balances the enzyme ratios within the packed bed. Besides the importance of the enzyme ratio, its optimization is rarely applied for enzymatic systems [27]. A genetic algorithm [46] was used to derive optimum reaction conditions, resulting in a feed concentration of 8.4 mmol/L NADP and a bead ratio of 0.743 m G r e m t o t a l , respectively. Details on the results of applying the generic algorithm can be found in the Supplementary Materials.
The respective results include the EU η R , the STY compared with the productivity, the production cost, and the TEP, which are all shown in Figure 9. Distinct behaviors resulting from the investigated physical phenomena are observable. As case 1.1 is not limited, the EU is 1, and the lowest cost and highest STY and productivity are achieved. Notable is a constant productivity over all amounts of beads due to the same reaction conditions for the enzymes. This is reflected in constant production cost (Figure 9C) and consequently an almost linearly rising TEP (Figure 9D). If we compare cases 1.1 and 1.2 in their STY-productivity trends (Figure 9B), a connection to the case of unlimited mass transport is evident, underlined by the value of 1 for the EU. Reduced productivity and STY are both due to changing equilibria of the regeneration reaction, caused by a rising concentration of gluconolacton within the reactor. This lowers the concentration of NADPH and hence reduces the reduction rate. To achieve the same yield, flow rates have to be reduced, resulting in higher residence time and lower STYs and productivities and thus higher costs and lower TEPs.
By enabling mass transport limitation in case 1.3, an additional consequence is a reduced EU for higher MB loads. Due to an increased bead loading, the bed height and thus the diffusion path length increase. For small bead quantities, case 1.3 approaches case 1.1. The EU explains lower STY and productivity in Figure 9B, as different reaction conditions are present within the bed. Thereby Gre2 enzymes deeper within the bed are less productive. For smaller amounts of beads, this effect of productivity inhomogeneity is reduced, approaching the outcomes of case 1.1. The TEP for case 1.3 shows an approaching plateau, which foreshadows a possible saturation for the investigated system. It also shows that cases 1.1 and 1.2 are probably too strongly simplified.
In Figure 9B–D, for a bead loading of 2 mg an interception between cases 1.2 and 1.3 is visible. At this loading, the limitations induced by mass transport and cofactor regeneration are equal. For higher bead loadings, mass transport limitations are of higher importance than cofactor regeneration limitations.

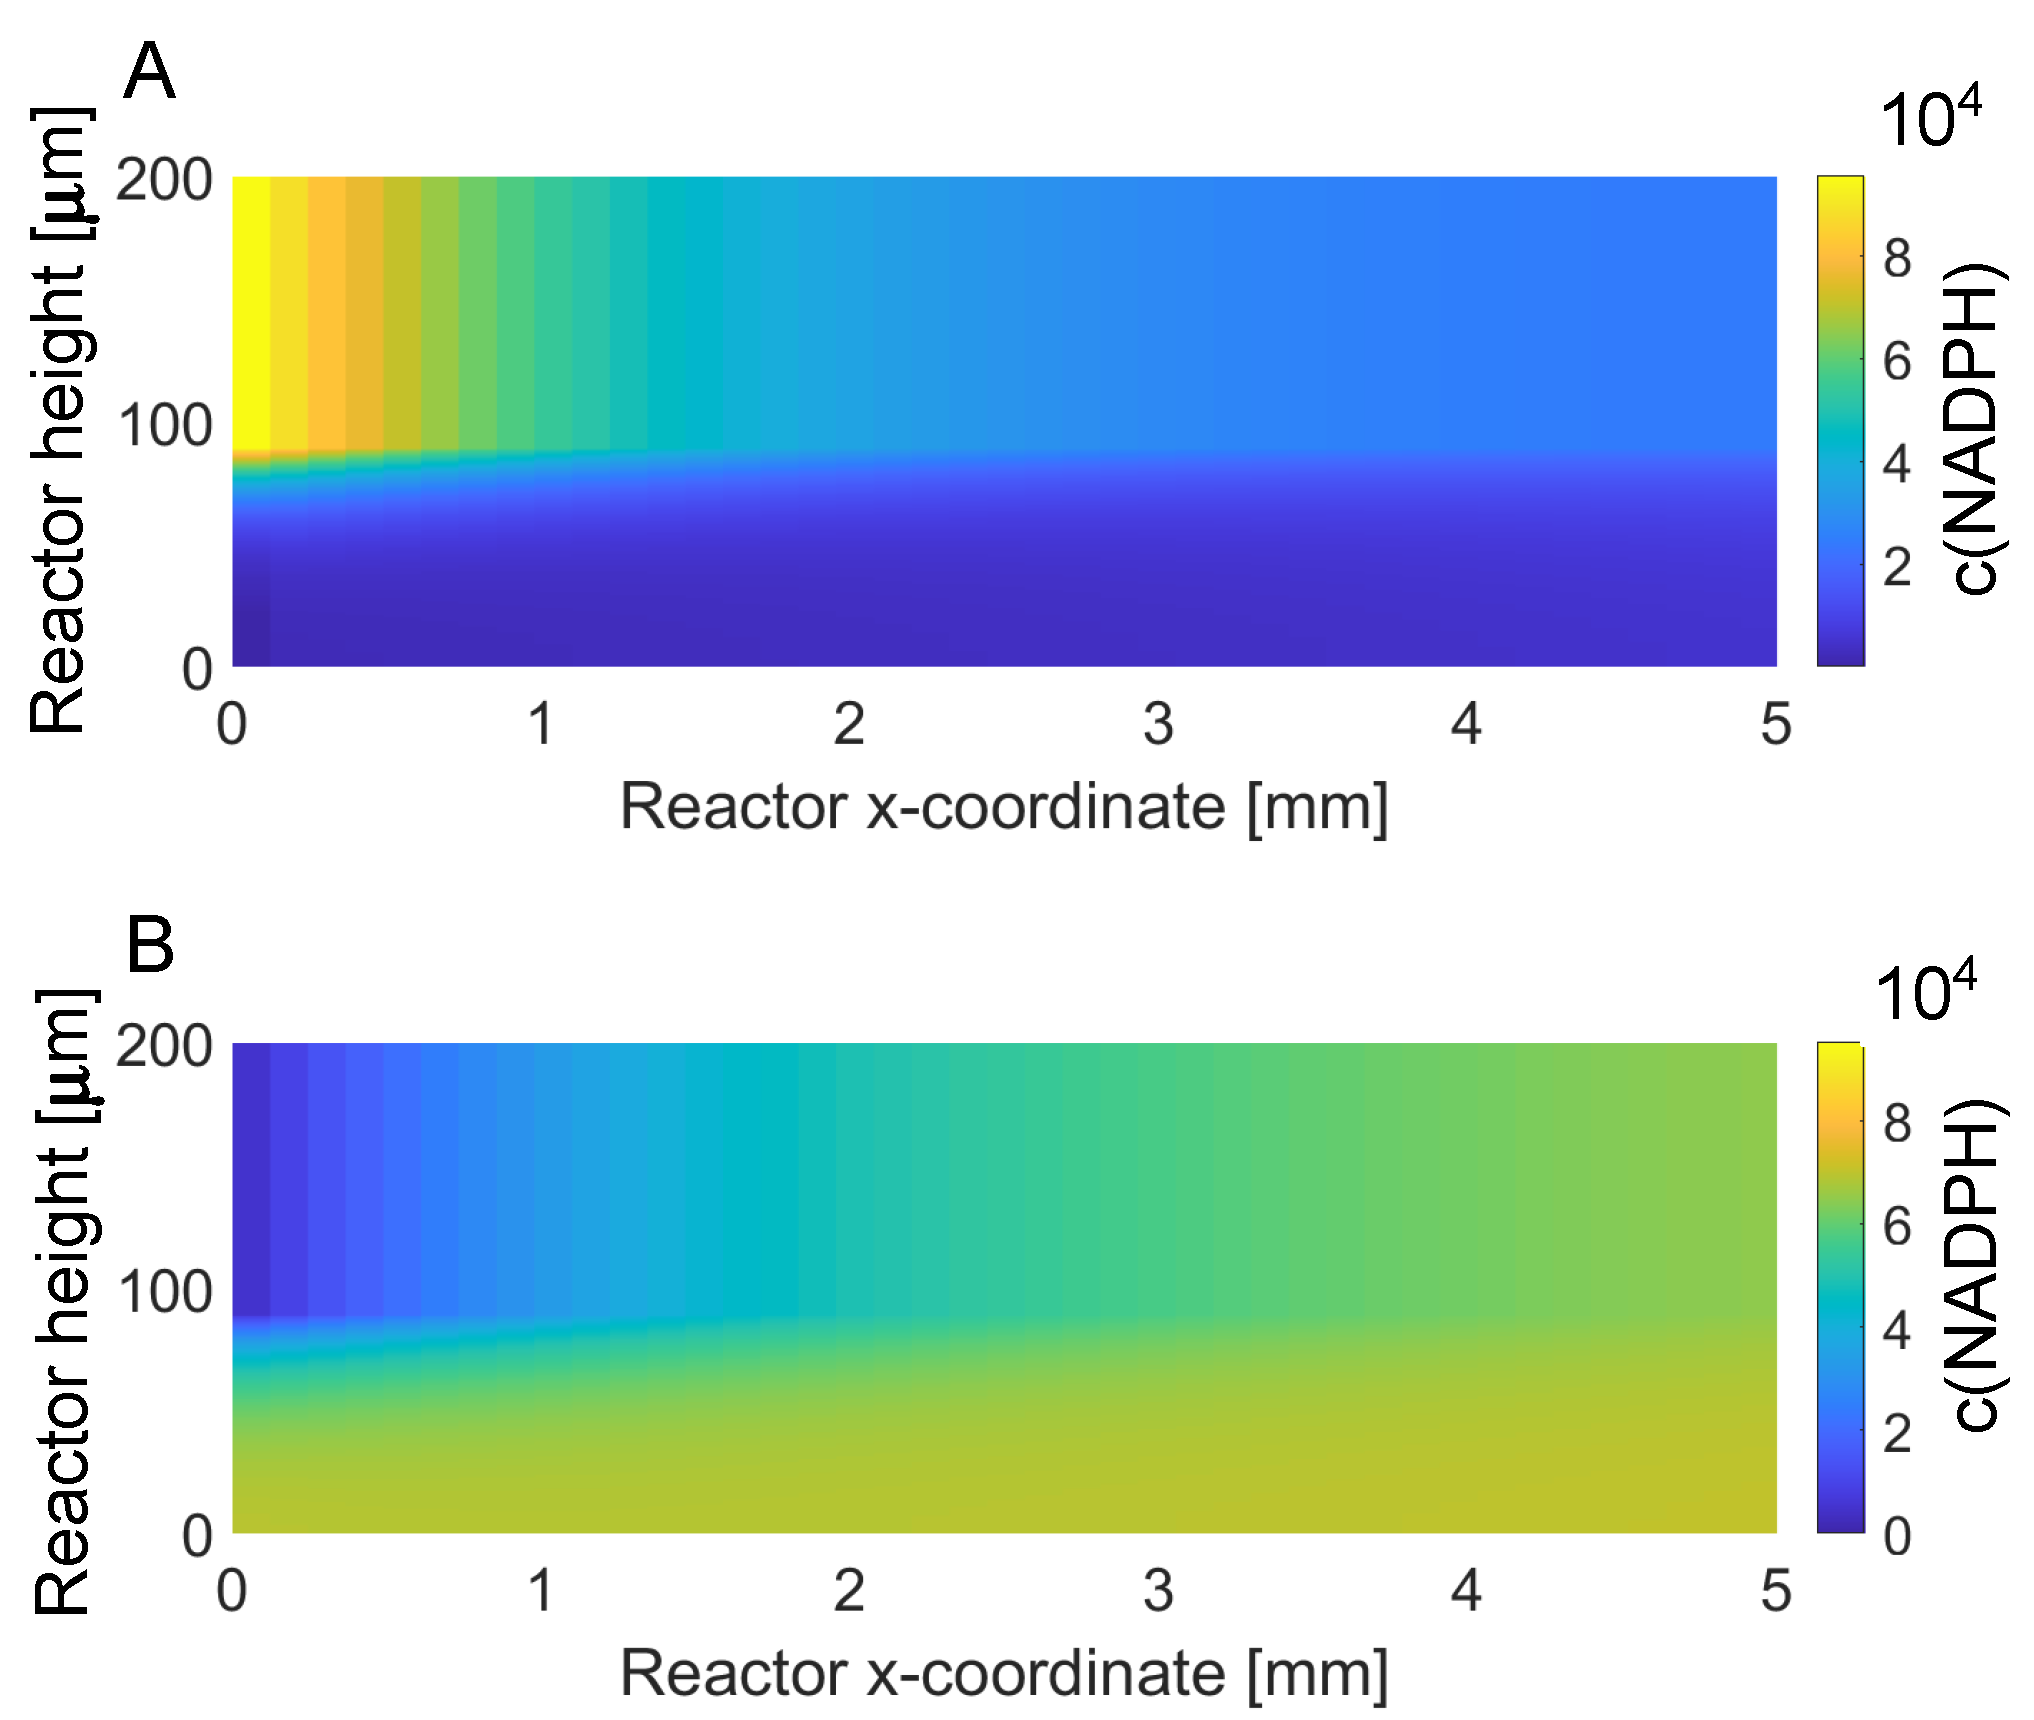
3.4. Levels 2 and 3: (Technical) Reactor Concept

A genetic algorithm [46] was employed to derive optimal reactor parameters with regard to performance and economics. Hence, the TEP described in Section 2.3.3 was maximized with the given boundary conditions from Section 2.3.2. The bead ratio is bound from 0 to 1, ranging from solely GDH beads to solely Gre2 beads. The NADP concentration was capped at 20 mmol/L in the feed stream. The results for immobilized GDH enzyme from Section 3.1 were used as the starting point. A TEP value of 1 is related to the result for aqueous GDH (base case).
The genetic algorithm derived optimal parameter sets for the different MB amounts as shown in Figure 10. The algorithm provides a lot of data points, which show a considerable variation. It can easily be seen that for each bead loading a limiting curve is established. These curves obtain successively higher maxima up to about 4.5 mg of MBs. For even higher amounts of beads, no positive effect is achieved anymore. It is evident that both functional relationships exhibit a maximum and neither curve is symmetrical.
Regarding the concentration of NADP plus NADPH (Figure 10A), it is observed that up to a value of about 10 the TEP rises fast, at first almost linear, then a maximum is achieved. This is caused by the availability of hydrogen for the desired enzyme reaction. Nevertheless, this effect reaches an economic limit, once the supply of hydrogen is not a crucial parameter anymore. We can conclude from these results that an amount of 4.5 mg of MBs is optimal. At that point, the concentration for the hydrogen carrier should be 10 mmol/L.
The curve for the bead ratio (Figure 10B) is a bit more complex. On both extremes a very steep rise is observed, as expected, since both enzymes are needed to obtain high conversion. The optimal bead ratio is found at 0.74 ( m G r e 2 m t o t a l ) . The optimum bead ratio and NADP feed concentration differ from the optimum values in Section 3.3. The reactor behavior is a combination of the limitations by mass transport and cofactor regeneration and cannot be represented by either one of those. Thereby new optima for bead ratio and NADP feed concentration appear.
As a result, cost evaluations allow for higher product cost, due to lower flow rates for maximum HK yield. As the parameters are not influenced by the amount of beads, the results establish a simple relation between MB load and optimal conditions. Higher amounts of MBs are advantageous at these parameters, as all enzymes are used sufficiently to compensate for an increase in costs. As an increased NADP feed concentration increases the regeneration rate within the packed bed, their limitation is lowered. As implied in Figure 10, an increased TEP is shown for higher quantities of beads.
Figure 11 shows all cases calculated by the genetic algorithm in the relationship between STY and productivity. For improvement in visualization, grey dashes show the limits for different amounts of MBs. The symbols are color-coded according to the TEP from red (low) via yellow to green (high). The initial case was 263 g/g productivity and 96.3 g/L day for STY and is marked with a star. An optimum in relation to TEP is indicated by the black dashed line.
The shape of the limiting grey dashes for different amounts of beads overlaps for very high productivities. With increasing bead loadings, more enzymes are in the reactor enabling faster NDK reduction rates. As the overlapping dashes indicate, cofactor regeneration limitations are very small, as the curvature is similar to the results of case 1.3 in Figure 9. The same can be concluded for the optimum line in Figure 11. The colors indicate an improved TEP for higher amounts of beads. Although specific conditions allow for higher possible productivity, economic considerations shift the optimal operating points to slightly lower STY and productivity.
Since NADPH replenishment is secured, the selectivity to HK for higher bead loadings slightly decreases as shown in Figure 12A. This includes a higher amount of wasted NDK. For thicker particle beds, diffusion path length increases, increasing the time for all species in the bed, and hence giving more time for the consecutive reaction decreasing HK. The EU η R decreases with an increased amount of beads indicating mass transport limitation, as can be seen from Figure 12B.
OpEx results are similar for all bead loadings, due to the same optimal NADP/H concentration and HK yield. CapEx in turn is determined by the amount of MBs and hence increases (Figure 12C). As explained above, all CapEx values are calculated for one week of operation, thus the effect of increasing CapEx on specific product cost is very high. After a realistic estimation of catalyst deactivation, which would give us a reasonable time on stream estimation for the reaction system, we could redo the calculation using reasonable assumptions. This could lead to different results, depending on the achievable time on stream.
The correlation of TEP with MBs indicates a maximum of 13.25 at a value of about 5 mg of beads (Figure 12D). This shows a balance between higher product cost and decreased selectivity for an increased quantity of beads on the one hand and the profit of higher flow rates on the other hand. Differences in TEP between 4 and 6 mg MBs are only small. Increasing the operation time would increase the amount of product and thereby decrease the contribution of CapEx to the production cost. It should be kept in mind that this maximum is valid for one week of operation. A different operation time impacts the CapEx influence within the cost calculations. For shorter operation times, CapEx makes a stronger contribution to the cost, and hence lower bead amounts are beneficial, as the maxima in Figure 13A,B shift. TEP refers to the corresponding TEP of the basic case and operation time. With increased time of operation, higher bead amounts become viable as shown in Figure 13D. Additionally, we can note that increasing the operation times reduces the maximum achievable adapted TEP, but it is still a major improvement compared with the base case. An amount of beads of 4.5 mg shows great TEPs for all operation times with minor drawbacks for higher operation times. Although these evaluations are promising and show great enhancement in performance and economics, experiments should be performed to validate the calculations and trends.
As mentioned previously, the boundary conditions make the results from level 2 a viable technical solution. Additional measures that are not related to the reactor can influence the TEP. Since OpEx is a major contributing factor to production cost, measures to reduce this would enhance the performance with regard to TEP. NADP/H is the most expensive content in the feed. By recycling NADP/H OpEx will decrease, while CapEx will be raised due to the separation method. In the long term, this would allow higher NADP/H concentration, boosting reduction rates significantly. The potential of an NADP/H recycling system was reported by Baumer et al. with a two-phase system and a flow liquid-liquid extraction (FLLEX) [47]. Another option for single-phase recycling is micro simulated moving bed (μSMB) systems [48]. These recycling methods can be implemented in the model of this work by adding a recycling factor for the OpEx for NADP and NADPH, alongside additional CapEx for the separation unit and the separation efficiency. However, as we could not retrieve quantitative information from the literature, we did not include this topic in the present study.

4. Conclusions

Immobilized enzyme cascades in a flow system show great benefits over traditional batch systems. The application of complex reaction systems exhibits different demands on suitable flow systems. Combined with the possible limitations due to cofactor regeneration and mass transport, optimization of such systems is challenging. Optimization in combination with mathematical modeling allows us to predict and derive enhanced reactor systems, while reducing the experimental effort. We showed that a simple Matlab model, which describes a diffusion-driven processes in combination with a complex reaction network, is feasible, especially for optimization purposes. Mathematical modeling of such reactor systems enables insights into the processes controlling the reactor performance, indicating insufficiently used regions, major contributing limitations and bottlenecks. Maintaining low production cost while improving the performance is an important aspect in scale-up and competitiveness of continuous flow reactors. Within this work, we utilize a modified multi-level reactor design (MLRD) approach to optimize selective reduction with cofactor regeneration catalyzed by immobilized enzymes. Optimization aims to maximize the techno-economic performance (TEP).
In a first step, we showed that immobilization of the regeneration enzyme GDH alongside the ketoreductase Gre2 is beneficial in all aspects of performance, economics and lastly TEP. To achieve the same space time yield (STY), catalytic productivity increases while the production cost decreases, as depicted in Figure 14. NADP feed concentration and enzyme ratios are crucial parameters of the system. High NADPH demand of the reduction reactions can be compensated by an increased NADPH concentration in the feed and additional immobilized GDH in the packed bed. Optimal reactor conditions were derived for those two parameters and for different amounts of beads with the aim of maximizing hydroxyketone (HK) yield. For all cases investigated in level 2, an NADP feed concentration of 10 mmol/L and a bead ratio of 0.74 ( m G r e 2 m t o t a l ) gave the best TEP independent of the amount of beads inside the reactor. An increase in bead loading results in higher STY while reducing catalyst productivity, as the EU is decreasing. While production cost for HK rises with the utilization of more beads, the overall TEP shows the highest improvement with 5 mg of loaded magnetic beads for an operation time of 1 week. Figure 14D summarizes the evolution of TEP in this work from the base case with aqueous GDH to the derived optimum. While immobilization improves the TEP by a factor of 2.3, an optimal NADP feed concentration and bead ratio increases the TEP further to 13.25 after evaluating more than 1300 reactor configurations. We predict an increase of the STY from 100 to 260 g H K L   d a y and of the specific productivity from 150 to 430 g H K g G r e 2 , while reducing the production cost by 50% for an operation time of 1 week. Further improvements in the economics by including NADP/H recycling would further increase the TEP. It has been shown conclusively how the MLRD approach led to a deeper understanding of the process and enabled its optimization. Such continuous-flow microreactor systems could replace conventional batch reactors. We look at the system as a possible new platform technology for continuous flow biochemical production. Upscaling of the production would be possible by internal and external numbering-up. Internal numbering-up brings about the challenge of uniform distribution of the flow to a multitude of channels while avoiding the need for duplication of peripheral components (see, for example, [49]). For single-phase flow, the internal flow distribution can be solved with the aid of computational fluid dynamics simulations and precise fabrication methods. Well-engineered continuous-flow systems can deliver productivities and yields comparable to or better than conventional batch systems over a wide range of production volumes relevant for specialty products.

Supplementary Materials

The following are available online at https://www.mdpi.com/2073-8994/13/3/524/s1. Figure S1: Development of the cross-section averaged concentration in the free channel volume in the flow direction for the basic Matlab model and F2D and F3D models, Figure S2: Development of the cross section averaged concentration in the free channel volume in flow direction for the basic Matlab model, model F2D and model F3D, Figure S3: Genetic algorithm results for NADP/H concentration for case 1.3 and bead ratio for case 1.2, Table S1: Kinetic parameters for NDK reduction and cofactor regeneration reactions, Table S2: Material prices for CapEx estimations in €/g, Table S3: Cost of species for OpEx estimation in €/g.

Author Contributions

Conceptualization, P.P. and R.D.; methodology, P.P. and M.K.; validation, P.P.; formal analysis, P.P. and M.K.; investigation, M.K.; writing—original draft preparation, P.P.; writing—review and editing, P.P., M.K. and R.D.; visualization, P.P.; supervision, M.K. and R.D.; project administration, R.D.; funding acquisition, R.D. All authors have read and agreed to the published version of the manuscript.

Funding

This research received no external funding.

Institutional Review Board Statement

Not applicable.

Informed Consent Statement

Not applicable.

Data Availability Statement

Not applicable.

Acknowledgments

This research was supported by the work group of Christof M. Niemeyer of the Institute for Biological Interfaces (IBG-1), Karlsruhe Institute of Technology (KIT). We especially thank Sandra Kröll who provided experimental investigation of binding capacities of the magnetic beads for both enzymes.

Conflicts of Interest

The authors declare no conflict of interest. The funders had no role in the design of the study; in the collection, analyses, or interpretation of data; in the writing of the manuscript; or in the decision to publish the results.

References

  1. Hickey, A.M.; Marle, L.; McCreedy, T.; Watts, P.; Greenway, G.M.; Littlechild, J.A. Immobilization of thermophilic enzymes in miniaturized flow reactors. Biochem. Soc. Trans. 2007, 35, 1621–1623. [Google Scholar] [CrossRef] [PubMed]
  2. Matsuura, S.-I.; Ishii, R.; Itoh, T.; Hamakawa, S.; Tsunoda, T.; Hanaoka, T.; Mizukami, F. Immobilization of enzyme-encapsulated nanoporous material in a microreactor and reaction analysis. Chem. Eng. J. 2011, 167, 744–749. [Google Scholar] [CrossRef]
  3. Plutschack, M.B.; Pieber, B.; Gilmore, K.; Seeberger, P.H. The Hitchhiker’s Guide to Flow Chemistry II. Chem. Rev. 2017, 117, 11796–11893. [Google Scholar] [CrossRef] [PubMed]
  4. Wiles, C.; Watts, P. Improving chemical synthesis using flow reactors. Expert Opin. Drug Discov. 2007, 2, 1487–1503. [Google Scholar] [CrossRef] [PubMed]
  5. Kockmann, N. Transport Phenomena in Micro Process Engineering; Springer Science & Business Media: Berlin, Germany, 2007; ISBN 3540746188. [Google Scholar]
  6. Vorbach, M.; Bohn, L.; Kotthaus, M.; Kraut, M.; Pöchlauer, P.; Wenka, A.; Schubert, K. Achema 2006: 28. Internat. Ausstellungskongreß für Chemische Technik, Umweltschutz und Biotechnologie, Frankfurt, 15.-19.Mai 2006 Book of Abstracts; Dechema e.v.: Frankfurt am Main, Germany, 2006; First Large-Scale Application of Microreaction Technology within Commercial Chemical Production of DSM. [Google Scholar]
  7. Proctor, L.; Dunn, P.J.; Hawkins, J.M.; Wells, A.S.; Williams, M.T. Continuous Processing in the Pharmaceutical Industry. In Green Chemistry in the Pharmaceutical Industry; Dunn, P.J., Wells, A.S., Williams, M.T., Eds.; Wiley-VCH Verlag GmbH & Co. KGaA: Weinheim, Germany, 2010; pp. 221–242. ISBN 9783527629688. [Google Scholar]
  8. Bornscheuer, U.T.; Huisman, G.W.; Kazlauskas, R.J.; Lutz, S.; Moore, J.C.; Robins, K. Engineering the third wave of biocatalysis. Nature 2012, 485, 185–194. [Google Scholar] [CrossRef] [PubMed]
  9. Faber, K. Biotransformations in Organic Chemistry; Springer: Berlin, Germany, 1992. [Google Scholar]
  10. Wang, X.; Saba, T.; Yiu, H.H.P.; Howe, R.F.; Anderson, J.A.; Shi, J. Cofactor NAD(P)H Regeneration Inspired by Heterogeneous Pathways. Chem 2017, 2, 621–654. [Google Scholar] [CrossRef] [Green Version]
  11. Rabe, K.S.; Müller, J.; Skoupi, M.; Niemeyer, C.M. Cascades in Compartments: En Route to Machine-Assisted Biotechnology. Angew. Chem. Int. Ed. Engl. 2017, 56, 13574–13589. [Google Scholar] [CrossRef] [PubMed]
  12. Cao, L.; van Langen, L.; Sheldon, R.A. Immobilised enzymes: Carrier-bound or carrier-free? Curr. Opin. Biotechnol. 2003, 14, 387–394. [Google Scholar] [CrossRef]
  13. Foley, A.M.; Maguire, A.R. The Impact of Recent Developments in Technologies which Enable the Increased Use of Biocatalysts. Eur. J. Org. Chem. 2019, 2019, 3713–3734. [Google Scholar] [CrossRef]
  14. Zhu, Y.; Chen, Q.; Shao, L.; Jia, Y.; Zhang, X. Microfluidic immobilized enzyme reactors for continuous biocatalysis. React. Chem. Eng. 2020, 5, 9–32. [Google Scholar] [CrossRef]
  15. Bitterwolf, P.; Ott, F.; Rabe, K.S.; Niemeyer, C.M. Imine Reductase Based All-Enzyme Hydrogel with Intrinsic Cofactor Regeneration for Flow Biocatalysis. Micromachines 2019, 10, 783. [Google Scholar] [CrossRef] [Green Version]
  16. Dall’Oglio, F.; Contente, M.L.; Conti, P.; Molinari, F.; Monfredi, D.; Pinto, A.; Romano, D.; Ubiali, D.; Tamborini, L.; Serra, I. Flow-based stereoselective reduction of ketones using an immobilized ketoreductase/glucose dehydrogenase mixed bed system. Catal. Commun. 2017, 93, 29–32. [Google Scholar] [CrossRef]
  17. Weiser, D.; Bencze, L.C.; Bánóczi, G.; Ender, F.; Kiss, R.; Kókai, E.; Szilágyi, A.; Vértessy, B.G.; Farkas, Ö.; Paizs, C.; et al. Phenylalanine Ammonia-Lyase-Catalyzed Deamination of an Acyclic Amino Acid: Enzyme Mechanistic Studies Aided by a Novel Microreactor Filled with Magnetic Nanoparticles. Chembiochem 2015, 16, 2283–2288. [Google Scholar] [CrossRef]
  18. Ender, F.; Weiser, D.; Nagy, B.; Bencze, C.L.; Paizs, C.; Pálovics, P.; Poppe, L. Microfluidic multiple cell chip reactor filled with enzyme-coated magnetic nanoparticles—An efficient and flexible novel tool for enzyme catalyzed biotransformations. J. Flow Chem. 2016, 6, 43–52. [Google Scholar] [CrossRef]
  19. Santis, P.D.; Meyer, L.-E.; Kara, S. The rise of continuous flow biocatalysis-fundamentals, very recent developments and future perspectives. React. Chem. Eng. 2020, 16, 852. [Google Scholar] [CrossRef]
  20. Baronas, R.; Kulys, J.; Petkevičius, L. Modelling the enzyme catalysed substrate conversion in a microbioreactor acting in continuous flow mode. Nonlinear Anal. 2018, 23, 437–458. [Google Scholar] [CrossRef] [Green Version]
  21. Strniša, F.; Bajić, M.; Panjan, P.; Plazl, I.; Sesay, A.M.; Žnidaršič-Plazl, P. Characterization of an enzymatic packed-bed microreactor: Experiments and modeling. Chem. Eng. J. 2018, 350, 541–550. [Google Scholar] [CrossRef]
  22. Pribec, I.; Urbic, T.; Plazl, I. Modelling Reaction-Diffusion Dynamics in Microsystems. In Proceedings of the 26th European Symposium on Computer Aided Process Engineering, Portorož, Slovenia, 12–15 June 2016; Elsevier: Amsterdam, The Netherland, 2016; pp. 1623–1628. [Google Scholar]
  23. Marques, M.P.C.; Fernandes, P.; Cabral, J.M.S.; Žnidaršič-Plazl, P.; Plazl, I. On the feasibility of in situ steroid biotransformation and product recovery in microchannels. Chem. Eng. J. 2010, 160, 708–714. [Google Scholar] [CrossRef]
  24. van Daele, T.; Fernandes del Pozo, D.; van Hauwermeiren, D.; Gernaey, K.V.; Wohlgemuth, R.; Nopens, I. A generic model-based methodology for quantification of mass transfer limitations in microreactors. Chem. Eng. J. 2016, 300, 193–208. [Google Scholar] [CrossRef]
  25. Schlereth, D.; Hinrichsen, O. A fixed-bed reactor modeling study on the methanation of CO2. Chem. Eng. Res. Des. 2014, 92, 702–712. [Google Scholar] [CrossRef]
  26. Brown, S.R.; Staff, M.; Lee, R.; Love, J.; Parker, D.A.; Aves, S.J.; Howard, T.P. Design of Experiments Methodology to Build a Multifactorial Statistical Model Describing the Metabolic Interactions of Alcohol Dehydrogenase Isozymes in the Ethanol Biosynthetic Pathway of the Yeast Saccharomyces cerevisiae. ACS Synth. Biol. 2018, 7, 1676–1684. [Google Scholar] [CrossRef]
  27. Finnigan, W.; Citoler, J.; Cosgrove, S.C.; Turner, N.J. Rapid Model-Based Optimization of a Two-Enzyme System for Continuous Reductive Amination in Flow. Org. Process Res. Dev. 2020, 24, 1969–1977. [Google Scholar] [CrossRef]
  28. Peschel, A.; Jörke, A.; Sundmacher, K.; Freund, H. Optimal reaction concept and plant wide optimization of the ethylene oxide process. Chem. Eng. J. 2012, 207–208, 656–674. [Google Scholar] [CrossRef]
  29. Freund, H.; Sundmacher, K. Towards a methodology for the systematic analysis and design of efficient chemical processes. Chem. Eng. Process. Process Intensif. 2008, 47, 2051–2060. [Google Scholar] [CrossRef]
  30. Maußner, J.; Dreiser, C.; Wachsen, O.; Freund, H. Systematic model-based design of tolerant chemical reactors. JNL Adv. Manuf. Process. 2019, 1, 1. [Google Scholar] [CrossRef]
  31. Xie, M.; Freund, H. Optimal reactor design and operation taking catalyst deactivation into account. Chem. Eng. Sci. 2018, 175, 405–415. [Google Scholar] [CrossRef]
  32. Kaiser, M.; Freund, H. A multimodular pseudoheterogeneous model framework for optimal design of catalytic reactors exemplified by methanol synthesis. Chem. Eng. Sci. 2019, 206, 401–423. [Google Scholar] [CrossRef]
  33. Emenike, V.N.; Schenkendorf, R.; Krewer, U. Model-based optimization of biopharmaceutical manufacturing in Pichia pastoris based on dynamic flux balance analysis. Comput. Chem. Eng. 2018, 118, 1–13. [Google Scholar] [CrossRef]
  34. Rozzell, J.D. Commercial scale biocatalysis: Myths and realities. Bioorgan. Med. Chem. 1999, 7, 2253–2261. [Google Scholar] [CrossRef]
  35. Peschke, T.; Skoupi, M.; Burgahn, T.; Gallus, S.; Ahmed, I.; Rabe, K.S.; Niemeyer, C.M. Self-Immobilizing Fusion Enzymes for Compartmentalized Biocatalysis. ACS Catal. 2017, 7, 7866–7872. [Google Scholar] [CrossRef]
  36. Burgahn, T.; Pietrek, P.; Dittmeyer, R.; Rabe, K.S.; Niemeyer, C.M. Evaluation of a Microreactor for Flow Biocatalysis by Combined Theory and Experiment. ChemCatChem 2020, 12, 2452–2460. [Google Scholar] [CrossRef]
  37. Skoupi, M.; Vaxelaire, C.; Strohmann, C.; Christmann, M.; Niemeyer, C.M. Enantiogroup-differentiating biocatalytic reductions of prochiral Cs -symmetrical dicarbonyl compounds to meso compounds. Chemistry 2015, 21, 8701–8705. [Google Scholar] [CrossRef]
  38. Liebermeister, W.; Uhlendorf, J.; Klipp, E. Modular rate laws for enzymatic reactions: Thermodynamics, elasticities and implementation. Bioinformatics 2010, 26, 1528–1534. [Google Scholar] [CrossRef] [PubMed]
  39. Freund, H.; Peschel, A.; Sundmacher, K. Modellgestützter Reaktorentwurf auf Basis der optimalen Reaktionsführung. Chem. Ing. Tech. 2011, 83, 420–426. [Google Scholar] [CrossRef]
  40. Freund, H.; Maußner, J.; Kaiser, M.; Xie, M. Process intensification by model-based design of tailor-made reactors. Curr. Opin. Chem. Eng. 2019, 26, 46–57. [Google Scholar] [CrossRef]
  41. Tufvesson, P.; Lima-Ramos, J.; Nordblad, M.; Woodley, J.M. Guidelines and Cost Analysis for Catalyst Production in Biocatalytic Processes. Org. Process Res. Dev. 2011, 15, 266–274. [Google Scholar] [CrossRef]
  42. Thermo Fischer. Dynabeads Magnetic Bead Technology. Available online: https://www.thermofisher.com/de/de/home/brands/product-brand/dynal.html (accessed on 14 December 2020).
  43. Sigma Aldrich. NADPH Tetrasodium Salt. Available online: https://www.sigmaaldrich.com/catalog/product/roche/nadphro (accessed on 14 December 2020).
  44. Sigma Aldrich. NADP Disodium Salt. Available online: https://www.sigmaaldrich.com/catalog/product/roche/nadpro (accessed on 14 December 2020).
  45. Pashchenko, D. Effect of the geometric dimensionality of computational domain on the results of CFD-modeling of steam methane reforming. Int. J. Hydrogen Energy 2018, 43, 8662–8673. [Google Scholar] [CrossRef]
  46. The MathWorks, Inc. MATLAB Optimization Toolbox; MathWorks: Natick, MA, USA, 2020; Available online: https://www.mathworks.com/help/symbolic/ (accessed on 10 December 2020).
  47. Baumer, B.; Classen, T.; Pohl, M.; Pietruszka, J. Efficient Nicotinamide Adenine Dinucleotide Phosphate [NADP(H)] Recycling in Closed-Loop Continuous Flow Biocatalysis. Adv. Synth. Catal. 2020, 362, 2894–2901. [Google Scholar] [CrossRef] [Green Version]
  48. Subramani, H.; Kurup, A. Micro-simulated moving bed (μSMB) systems: A numerical study. Chem. Eng. J. 2006, 120, 169–179. [Google Scholar] [CrossRef]
  49. Hessel, V.; Renken, A.; Schouten, J.C.; Yoshida, J.-I. Micro Process Engineering, 3 Volume Set: A Comprehensive Handbook; John Wiley & Sons: Hoboken, NJ, USA, 2005; ISBN 3527315500. [Google Scholar]
Figure 1. Reaction scheme of chiral reduction of NDK to the corresponding hydroxyketone (HK) and the diol using immobilized Gre2. The cofactor NADPH is regenerated during oxidation of glucose with glucose 1-dehydrogenase (GDH) [36].
Symmetry 13 00524 g001
Figure 2. Schematic of the reactor with height H and length L. Particles with a diameter d p of 2.8 µm form a packed bed of fixed height d b e d on the bottom of a flow channel, and are held inside the reactor with magnets below the flow channel plate.
Symmetry 13 00524 g002
Figure 3. Multi-level reactor design (MLRD) levels according to Freund et al. [40] and further adaptation to suit a multi-enzyme cascade reactor with mass transport limitations with a fixed channel length.
Symmetry 13 00524 g003
Figure 4. Optimization parameters considered. Parameters specific for immobilized GDH (light grey) and aqueous GDH enzyme (dark grey).
Symmetry 13 00524 g004
Figure 5. Concentration distribution for feed NDK, product HK and diol for the first 2 mm of the reactor. The lower part (brown) depicts the particle bed, and the volume above is the free volume with convective flow.
Symmetry 13 00524 g005
Figure 6. Concentration profiles over the whole cross-section at the beginning of the reactor for the basic Matlab model (lines) and F2D model (dashes).
Symmetry 13 00524 g006
Figure 7. Development of the cross-section averaged concentration in the free channel volume in flow direction for the basic Matlab model (lines) and F2D model (dashes).
Symmetry 13 00524 g007
Figure 8. NADPH concentration in the reactor entrance region for aqueous GDH (A) and immobilized GDH (B).
Symmetry 13 00524 g008
Figure 9. Results for MLRD case 1.1 (unlimited regeneration and mass transport), case 1.2 (with regeneration limitation) and case 1.3 (with mass transport limitation) for different amounts of beads. (A): Enzyme utilization (EU) η R . (B): Space time yield (STY) and productivity. (C): Cost. (D): TEP.
Symmetry 13 00524 g009
Figure 10. Parameter evaluation of the results for (A) feed NADP/H concentration and (B) bead ratio for different amounts of beads ranging from 1 to 5.4 mg. For all bead amounts, a limiting curve was added to clarify the limits.
Symmetry 13 00524 g010
Figure 11. Optimization of a microchannel enzymatic reactor system with an overflown particle bed and immobilized enzyme cascades. Results generated by a genetic algorithm with characterizing Pareto for different amounts of beads, indicated by grey dashed lines. An increase in TEP is depicted by symbols’ color, ranging from red (low TEP) to green (high TEP).
Symmetry 13 00524 g011
Figure 12. Level 2 results from the genetic algorithm. Results of the optimal cases for different amounts of magnetic beads (MBs). (A): Conversion of NDK to HK and diol. (B): Enzyme utilization (EU) η R . (C): Cost with contributions of CapEx and OpEX. (D): TEP.
Symmetry 13 00524 g012
Figure 13. TEP for different amounts of beads for an operating time (OT) ranging from 1 h to 3 weeks (AD). TEP is scaled to the respective TEP of a reactor with aq. GDH and 4.5 mg beads and the corresponding OT. TEP maxima shift for higher amounts of beads and are reduced overall for increased OT.
Symmetry 13 00524 g013
Figure 14. Evolution of performance (A), enzyme utilization (EU) η R (B), economics (C) and overall TEP (D) in relation to the base case with aqueous GDH (black), comparable immobilization (red) and optimized system parameters (blue).
Symmetry 13 00524 g014
Table 1. Comparison of the basic Matlab model and the CFD models F2D and F3D with a view to number of cells and computing time for a given reactor length, and deviation from the results of model F3D used as a reference.
Basic Model
Symmetry 13 00524 i001
Model F2D
Symmetry 13 00524 i002
Model F3D
Symmetry 13 00524 i003
Length50 mm2 mm1 mm
Number of cells35,0000.75 million8 million
Computing time4 min7 days7 days
Deviation±3.5%±0.1%reference
Table 2. Case study for aqueous and immobilized glucose 1-dehydrogenase GDH with same mean concentration. Displayed are maximal hydroxyketone (HK) yield, space time yield, fixed cost, operating cost, product cost, productivity after one-week operation and techno-economic performance (TEP).
STY
[ g L 1 day 1 ]
Flow Rate
V ˙ [ μ L   min 1 ]
Enzyme Utilization (EU)
η R [-]
CapEx
[ ]
OpEx
[ h 1 ]
Cost
[ g 1 ]
Productivity
[ g ( H K ) g ( G r e 2 ) 1   ]
TEP
[-]
GDH aq.96.250.470.7485.830.02520,330155.91.00
GDH imm.96.260.470.8959.560.00915,091263.52.28
Publisher’s Note: MDPI stays neutral with regard to jurisdictional claims in published maps and institutional affiliations.

