Deep Neural Network Algorithm Feedback Model with Behavioral Intelligence and Forecast Accuracy

Department of Artificial Intelligence Software, Sehan University, Yeongam County, South Jeolla, Korea
Symmetry 2020, 12(9), 1465; https://doi.org/10.3390/sym12091465
Submission received: 27 June 2020
/
Revised: 26 July 2020
/
Accepted: 28 July 2020
/
Published: 7 September 2020
(This article belongs to the Special Issue Optimized Machine Learning Algorithms for Modeling Dynamical Systems)
Abstract
:When attempting to apply a large-scale database that holds the behavioral intelligence training data of deep neural networks, the classification accuracy of the artificial intelligence algorithm needs to reflect the behavioral characteristics of the individual. When a change in behavior is recognized, that is, a feedback model based on a data connection model is applied, an analysis of time series data is performed by extracting feature vectors and interpolating data in a deep neural network to overcome the limitations of the existing statistical analysis. Using the results of the first feedback model as inputs to the deep neural network and, furthermore, as the input values of the second feedback model, and interpolating the behavioral intelligence data, that is, context awareness and lifelog data, including physical activities, involves applying the most appropriate conditions. The results of this study show that this method effectively improves the accuracy of the artificial intelligence results. In this paper, through an experiment, after extracting the feature vector of a deep neural network and restoring the missing value, the classification accuracy was verified to improve by about 20% on average. At the same time, by adding behavioral intelligence data to the time series data, a new data connection model, the Deep Neural Network Feedback Model, was proposed, and it was verified that the classification accuracy can be improved by about 8 to 9% on average. Based on the hypothesis, the F (X′) = X model was applied to thoroughly classify the training data set and test data set to present a symmetrical balance between the data connection model and the context-aware data. In addition, behavioral activity data were extrapolated in terms of context-aware and forecasting perspectives to prove the results of the experiment.
1. Introduction
Missing values in data have always been present in many domains such as energy, healthcare, and national defense in relation to neural networks and large-scale databases that are artificial intelligence targets. Some research on the substitution and interpolation of missing values, by filling in missing values with appropriate ones, is now being actively conducted [1,2]. With the development of artificial intelligence and deep neural networks, the importance of training data sets and test data sets is increasing, as well as the performance of GPUs and the accuracy of prediction results through neural networks in behavioral research [3].
In particular, as a new neural network model is proposed in the fields of energy, defense, medicine, and finance that includes a large-scale database, when used as an input in terms of efficiency and productivity, it shows the best performance to predict the result [4,5]. This soon recommends the most suitable model and uses it for the domain as the most important key element in deep neural networks.
Therefore, the existence of an imbalance or missing value in the data commonly occupied by each domain, such as energy, medicine, defense, and finance, is inevitably positioned as the most influential factor in artificial intelligence algorithm performance. These missing values often cause problems of data imbalance when they are used to analyze big data or learn artificial intelligence, and it is difficult to use the data in a personalized way. This is because it would be very difficult to apply data with different personalities to a single conventional deep neural network.
When classifying data in most artificial intelligence algorithms, there is a high proportion of data imbalances due to the traditional structure of predictive learning based on the assumption that the difference in the number of data belonging to each category is not large [6]. Therefore, the data imbalance problem causes the predictive performance of the classifier of the artificial intelligence algorithm to decrease and, in most prediction problems, the classifier tries to predict data belonging to a smaller number of categories.
Data imbalance also faces a particular problem when using more than one type of data in a complex way [7]. For example, in the case of medical data, the number of breast cancer patients tends to be significantly lower than that of normal persons in studies predicting breast cancer through various X-ray, Computed Tomography (CT), and (Magnetic Resonance) MR images. In the case of breast cancer patients, if a certain amount of exercise and proper management are combined together, X-ray or surgical images can be an important factor as predictable data that we want, and life log data about exercise can be another big factor. Since we want to make predictions using various types of data, the basic premise is that we need to acquire more data and a different data connection model than traditional deep neural networks.
In order to solve this problem, this paper proposes a feedback model through deep learning data connection and restoration that considers individual characteristics of medical data by using DAE (Denoise Auto Encoder) technique along with behavioral intelligence and cognitive data. It seeks to provide a basic model that can predict how physical activity indices can be built by connecting health care information for multiple generations, especially the young and old generations. At this time, the younger generation has more active lifelog data than the older one, so it is possible to predict the physical activity claimed in this paper, thus recommending a new influence index or factor of behavioral research.
In general, the most basic statistical methods for interpolating missing data are the global constant, attribute, average, and mode. Of course, there are also sophisticated missing value substitution techniques that employ advanced statistical analysis algorithms such as regression analysis, propensity scores, logistic regression, and discriminate functions [8,9]. This statistical model can be meaningfully inferred, but it does not reflect personal characteristics, so it should be considered as a method of restoring missing data that are sensitive and contain personal information, such as medical data. According to the model proposed in the field of artificial intelligence, if the noise is removed and features are extracted from the data, the proposed learning model and method of the original input data are combined with the above mentioned DAE [10]. This first selects different heterogeneous data composed of features such as medical data that have missing values. The selected heterogeneous data are data that cannot be mixed at all, that is, domains may contain different data, and it is difficult to interpolate missing sites at the same time. For example, when studying genetic data for the study of an individual’s behavior, lifelog data about physical activity or behavior are the best examples of this when considering genetic factors. The heterogeneous data mainly mentioned in this paper are the primary object of the observation of physical activity, as this searches genetic data and lifelog data [11].
With different heterogeneous datasets, the DAE model hypothesizes that F (X′) = X. At this time, the value of X′ is defined by randomly replacing the input data with a zero value (Zero) of about 10–20%. To train the DAE model, the loss function is defined as the mean squared error (MSE) of the output value and X value of the decoder layer, and the DAE model is trained through the optimizer that minimizes the loss, and thus the loss is minimized. Assuming an individual’s characteristics as a feature vector, medical data with missing values are restored via the feature vector.
The following are the key contributions of this paper:
- We propose that, in deep neural networks, the training data sets/test data sets are implemented by an artificial intelligence algorithm, which is a deep neural network algorithm, after performing the data connection model and obtaining heterogeneous data.
- Experimental tests were set up and configured using the young generation’s behavioral data, i.e., lifelog data, versus the old generation’s behavioral data, i.e., laboratory data validated through the software code.
- Consequently, through the feedback model and data connection model, the impacts on the different generations alongside behavioral activity data were assessed in terms of context-aware and forecasting perspectives.
- We established a data input and feedback model, and the scientific test results were verified with an initial output value associated with lifelog data for F(X’) = X hypotheses.
The structure of this thesis proceeds as follows. Section 2 deals mainly with feature extraction in deep neural networks. Section 3 examines the data connection model based on behavioral data, including context awareness. Section 4 deals with the structure of the feedback model, a deep learning system. Section 5 describes the modeling and theoretical proof in connection with the feedback model and Section 6 shows the experimental environment and experimental results. Finally, Section 7 concludes the study and the paper.
2. Feature Extraction for Deep Neural Network
Medical data, including sensitive personal information, contains various types of specialized information about particular diseases. To improve hospital work efficiency, various information systems, such as Electronic Medical Records (EMRs), Order Communication Systems (OCS) and Picture Archiving and Communication Systems (PACS), which are included as part of the Hospital Information System (HIS), have been introduced in hospitals, and they support the electronic storage and sharing of various data generated by hospitals [12].
In recent years, in order to provide appropriate medical services to patients, these systems have been studied in relation to probabilistic distribution and disease prediction from the younger generation to the elderly generation according to the definition of precision medicine [13,14]. At the same time, medical data require behavioral studies to obtain prediction results through a number of effectiveness and artificial intelligence technologies [15]. Since the behavioral research that occurs at this time has a profound effect on the results, it is necessary to extract the most efficient features considering the correlation to reflect the characteristics of machine learning accuracy and deep neural networks.
Most deep neural network classification algorithms are structures that make predictions based on the assumption that the difference in the number of data in each category is not large. At the same time, when the influence of deep neural network algorithms exceeds a certain range, a generalization phenomenon occurs in which learning is biased toward a certain classification group [16]. However, in the case of real data, one can question the accuracy of heterogeneous cases where the data are different [17]. As in the previous example, if a large-scale database is involved, assuming that it is a study predicting the disease incidence index, in the case of breast cancer survivors or hypertensive patients, genetic factors and environmental factors, etc., are produced by the generation of data over time. Considering all of the above, there is a need to generate a prediction model for a deep neural network. The problem in extracting feature points from a deep neural network is related to the predictive performance of the classifier. As described above, the performance problem caused by learning in most Artificial Intelligence (AI) algorithms is that behavioral intelligence data are used simultaneously with genetic factors, so a problem always occurs when applying the traditional model.
In this paper, to solve this problem, we apply a Denoise Auto Encoder to form a feedback model, and as a result, we will verify the performance of a better deep neural network. DAE was the first model proposed by Vincent et. al., and when noise is removed to extract the original data [18]. When using a large-scale database as a basis, in the fields of pattern recognition and vision studies, noise is artificially added to input data, and the results from the data learned based on the added noise are artificially added. One must first go through the steps to see if the value is the original input value before adding the noise.
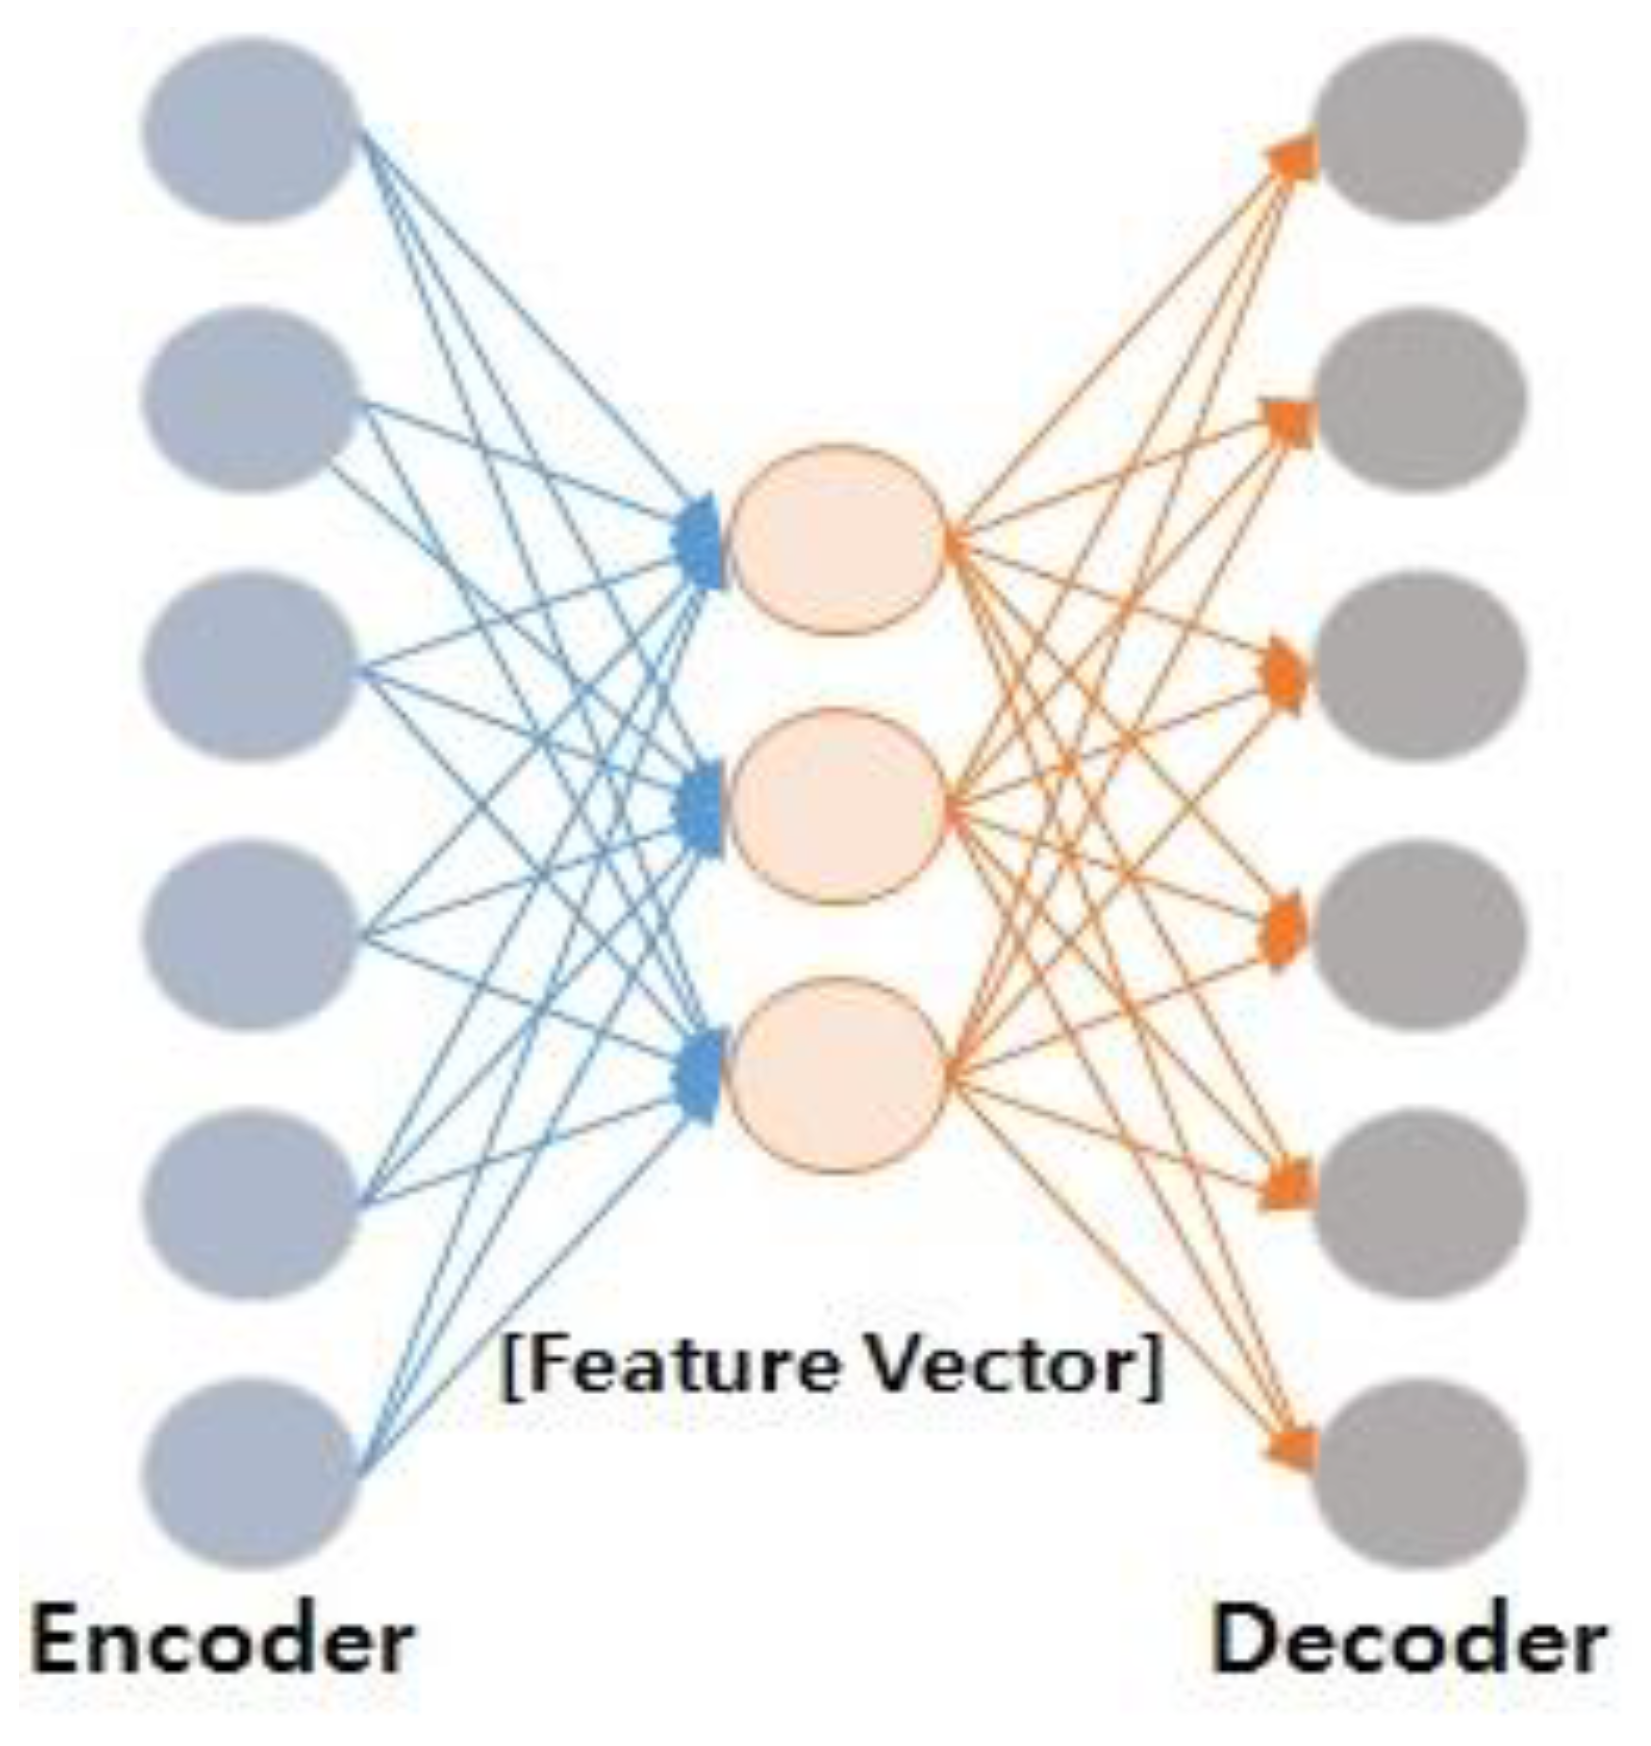
Figure 1 schematically depicts the process of extracting feature vectors between input and output values in a deep neural network. In principle, the mechanism by which DAE operates initially accepts half of the input data as zero at random in the stochastic corruption process. Through this process, the DAE predicts values that are accepted as the remaining zero through data that is uncorrupted or where inputs are not zero. The main reason for these steps is that partially decomposed (or split) inputs with partially decomposed input values have almost the same representation [19]. This means that data with the most appropriate representation should extract stable structured data from dependent data. Technically, even in the case of noise-containing data, there are cases in which there are interdependent input data representing human objects.
In addition, as in the case of time series data generated in the energy domain, in the case of the multi-processing that occurs when processing a large-scale database, a behavioral data connection model is required. That is, the object’s modalities and characters are extracted from the dependent data into a stable structure. Moreover, these modalities and characters are likely to exist in combination with specific input vectors. Thus, DAE can be applied to conduct experiments on these motifs and set up a feedback model of deep neural networks to conduct experiments on younger generations and behavioral studies on other generations, that is, genetic data as well as lifelog data, respectively.
3. Data Connection Model
In the 21st century, artificial intelligence has progressed in various fields and, in the medical field, this has not only occurred in the form of simple administrative-oriented computerization, but also in the qualitative improvement of patient care services and medical records containing medical information data, as well as the computerization of medical records for information sharing [20]. Among these types of artificial intelligence, a large amount of research is being conducted to share behavioral intelligence data in a cloud computing format, as large databases that continuously satisfy both genetic data and environmental variables are being derived [21]. In addition, with the development of technologies such as various artificial intelligence algorithms, a paradigm shift has occurred towards personalized precision medicine that enables prediction through behavioral intelligence data from the environment, along with the genuine data of individuals. In this section, we describe models that utilize different types of behavioral intelligence-based data to connect them.
3.1. Clinical Data
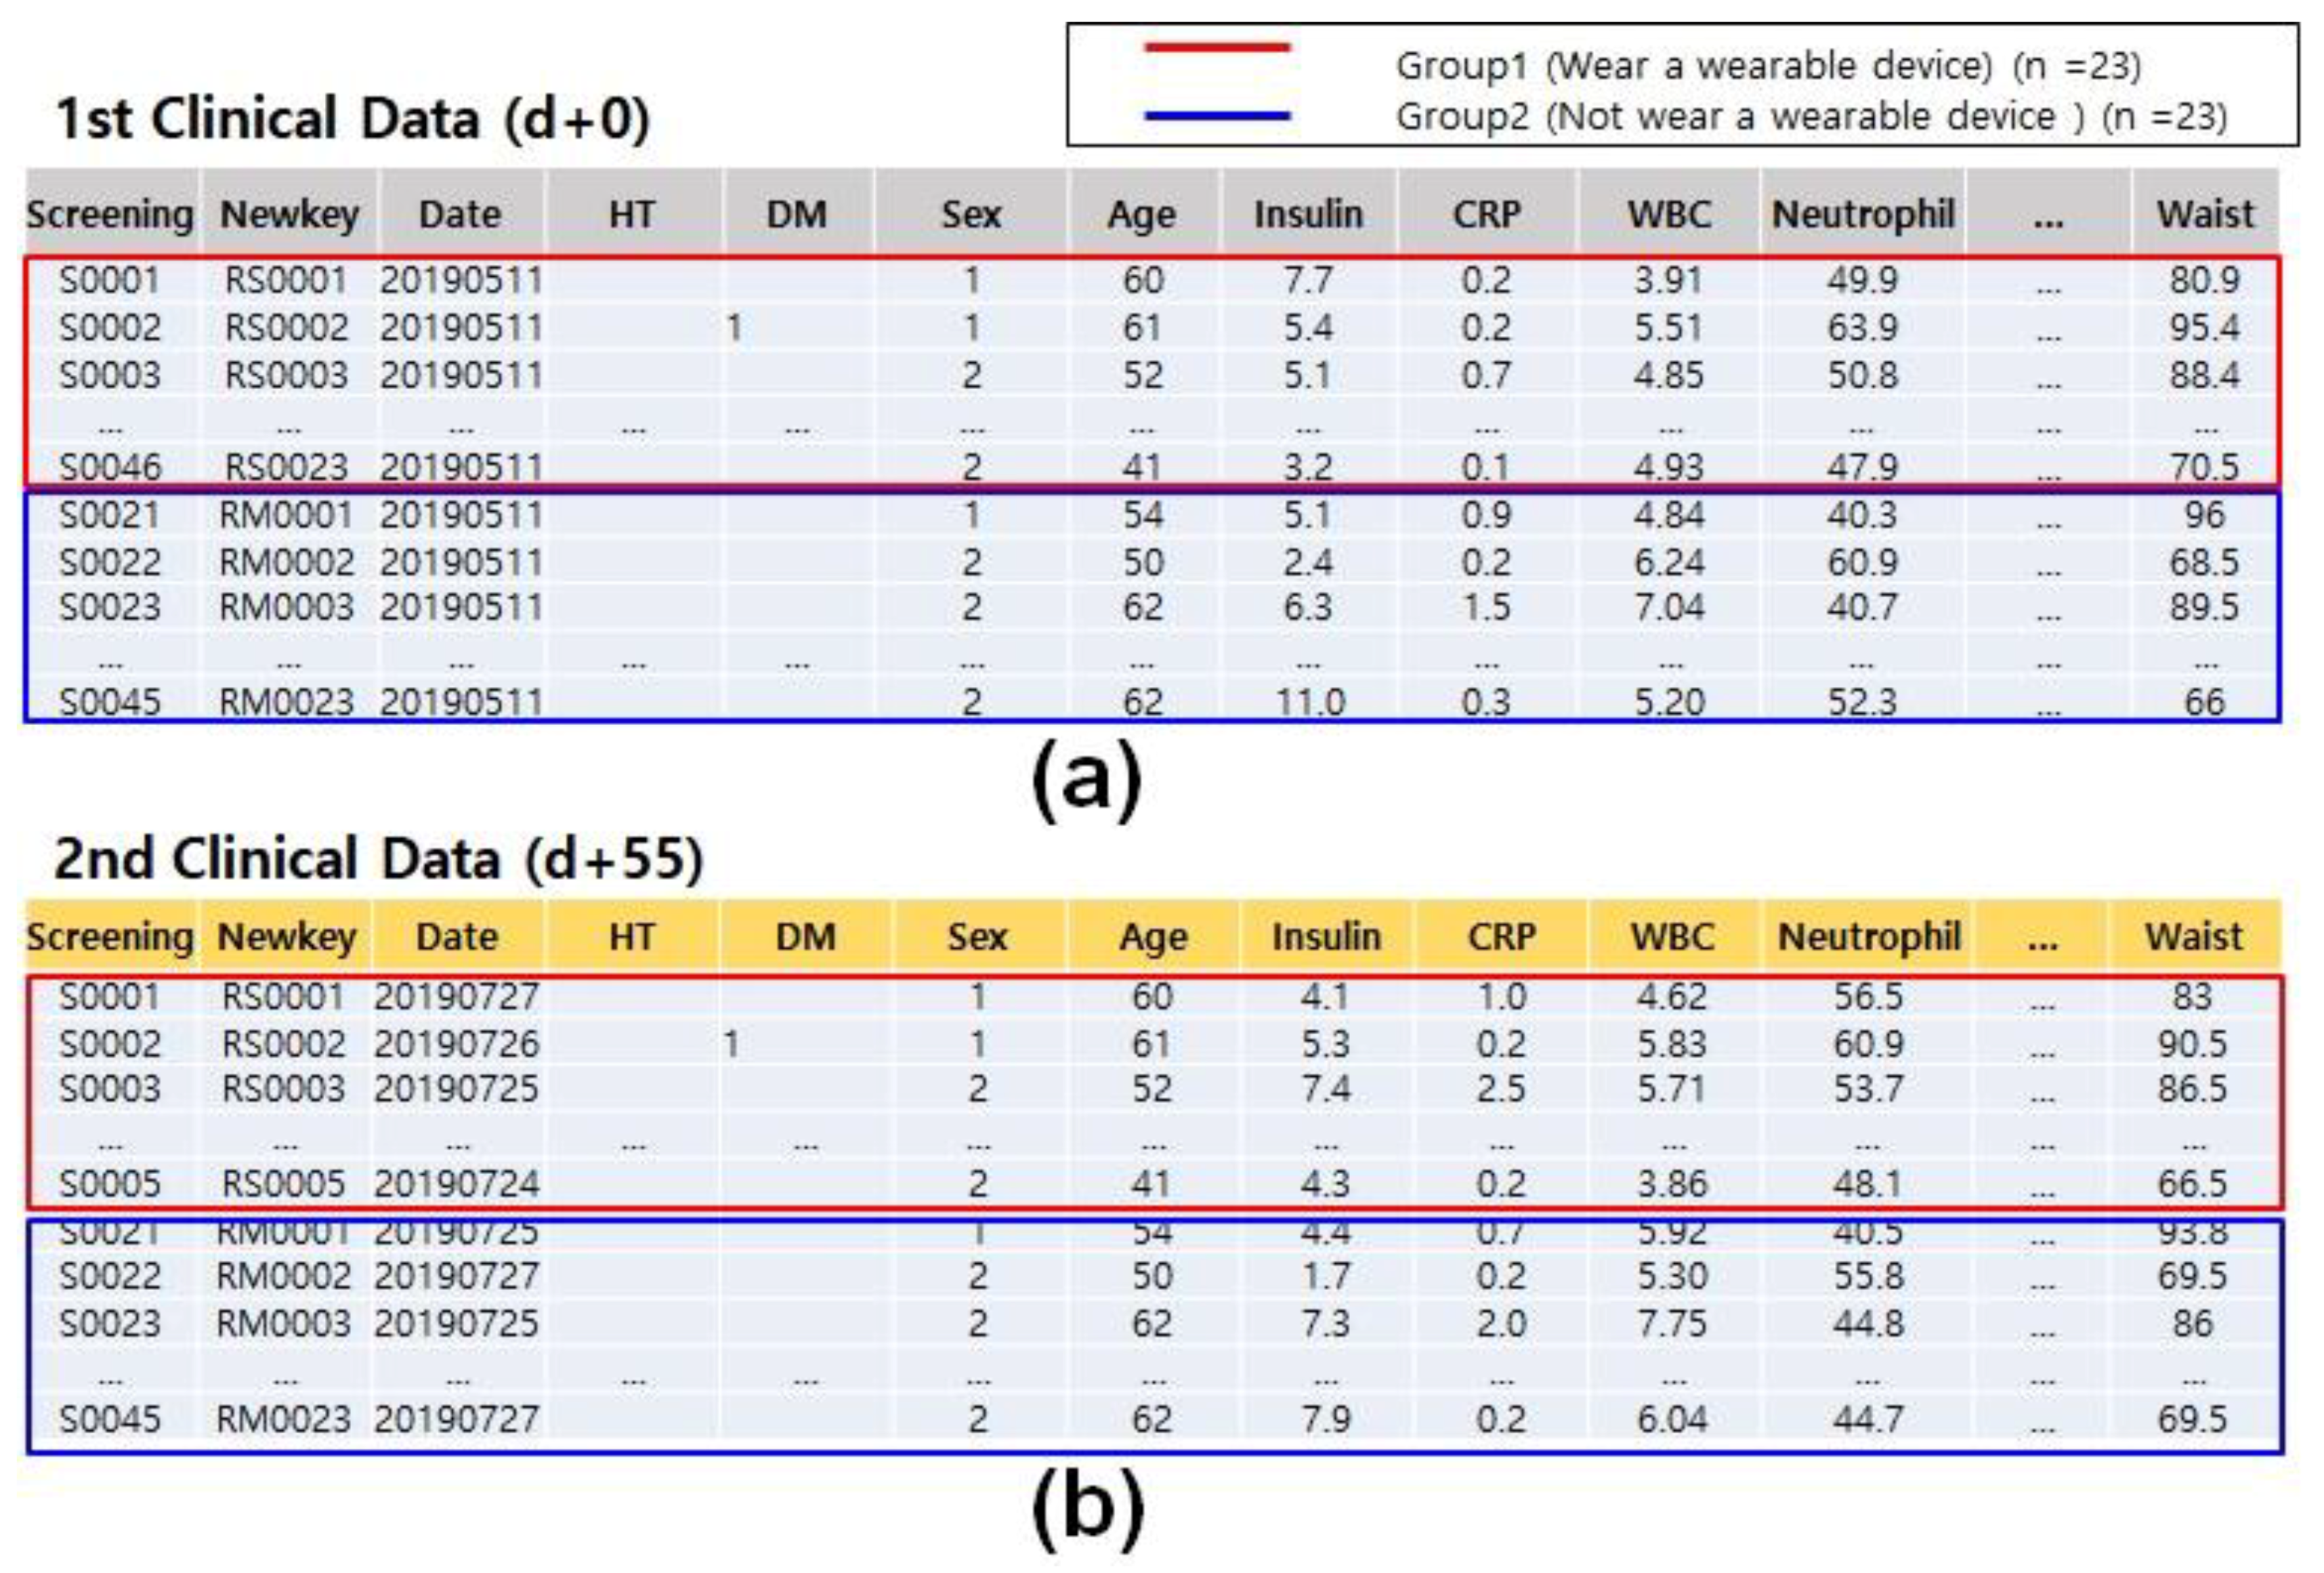
Clinical data are the result of collecting information derived from the human body directly from people, with the purpose of treating human diseases and promoting health. Therefore, a collection of information can be obtained by extracting medical information of human origin from a particular individual or population group. Serum, blood sugar, insulin and white blood cells are all examples of clinical data. Figure 2 shows an example of recorded values of clinical data, where a total of 46 volunteers were selected during the research period, divided into the first period and second period, and assessed via blood tests, urine tests, surveys of dietary and exercise habits and body measurements.
3.2. Medical Survey Data
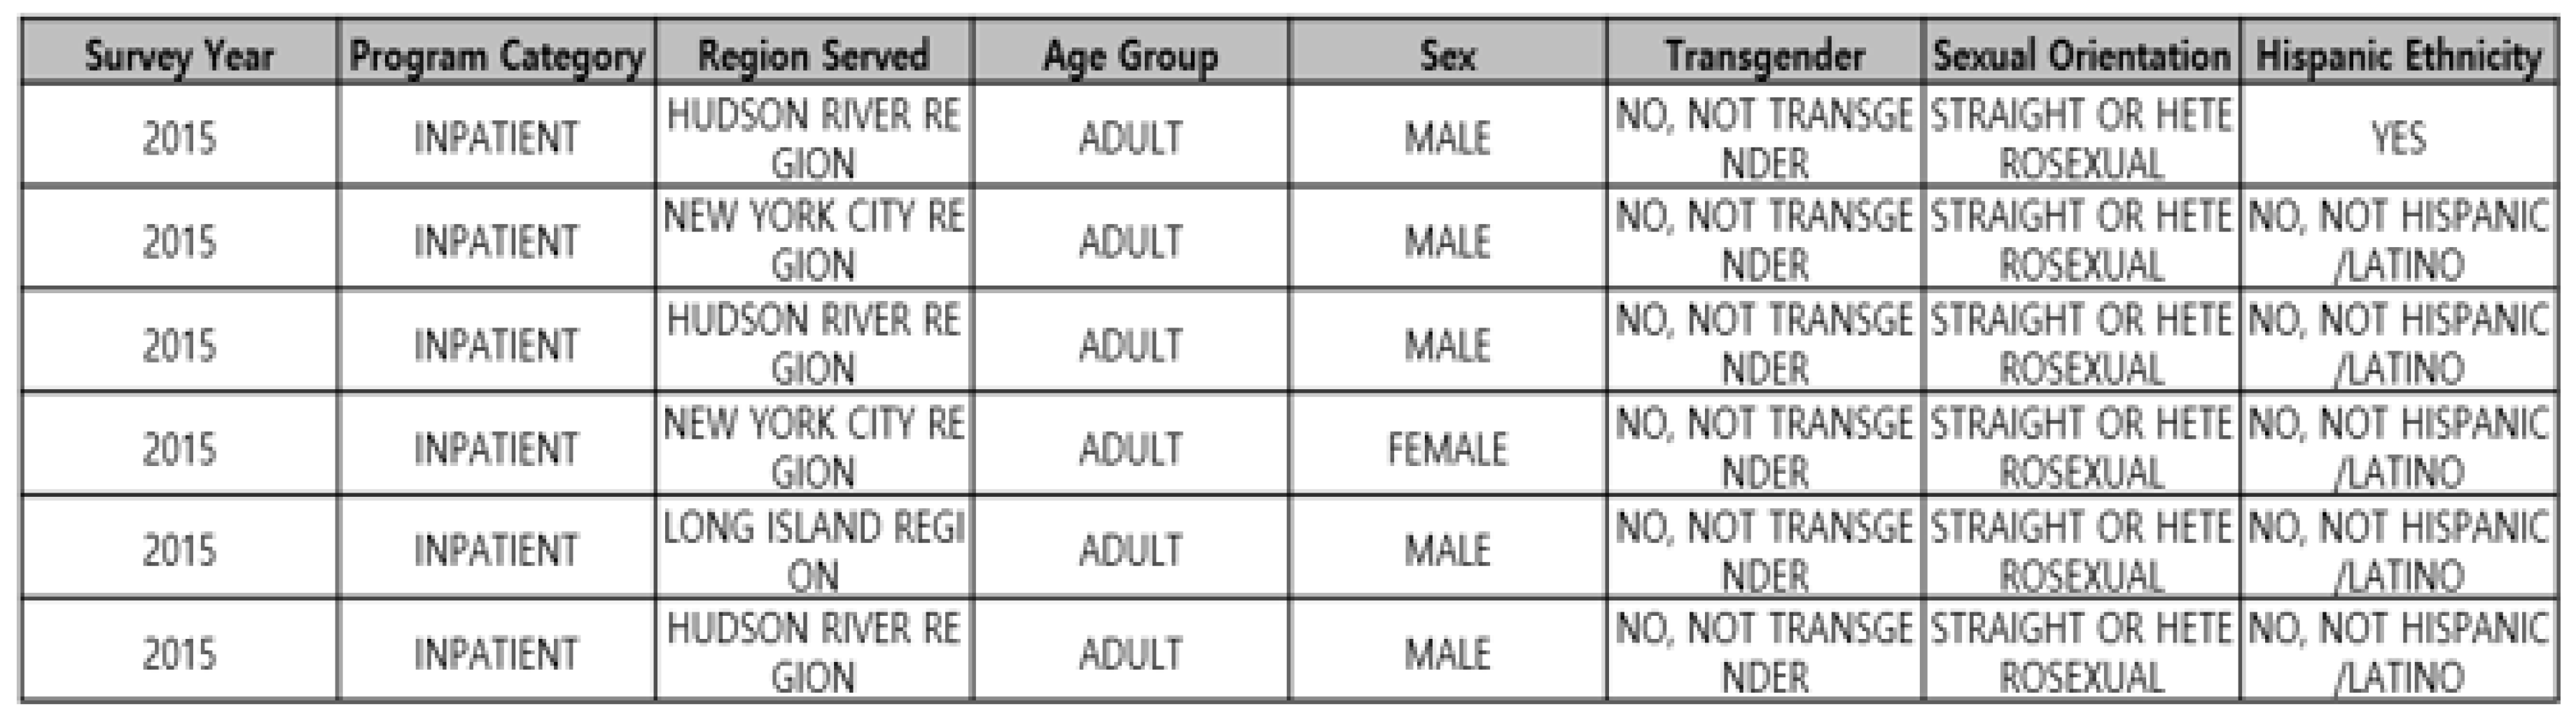
Medical questionnaire survey data are data collected by researchers in the medical field, asking questions about what they want to find out, with the purpose of promoting human health. Figure 3 shows examples of recorded values from the medical survey data set. The UK Biobank in the UK collects basic information on about 180,000 people every two years, including mental disability, history of disease, exercise, smoking, coverage, etc. The data generated from the collection of the information [22] are used as training data to improve the prediction accuracy of artificial intelligence for the training of deep neural networks.
3.3. Community-Based Cohort Data (KOGES)
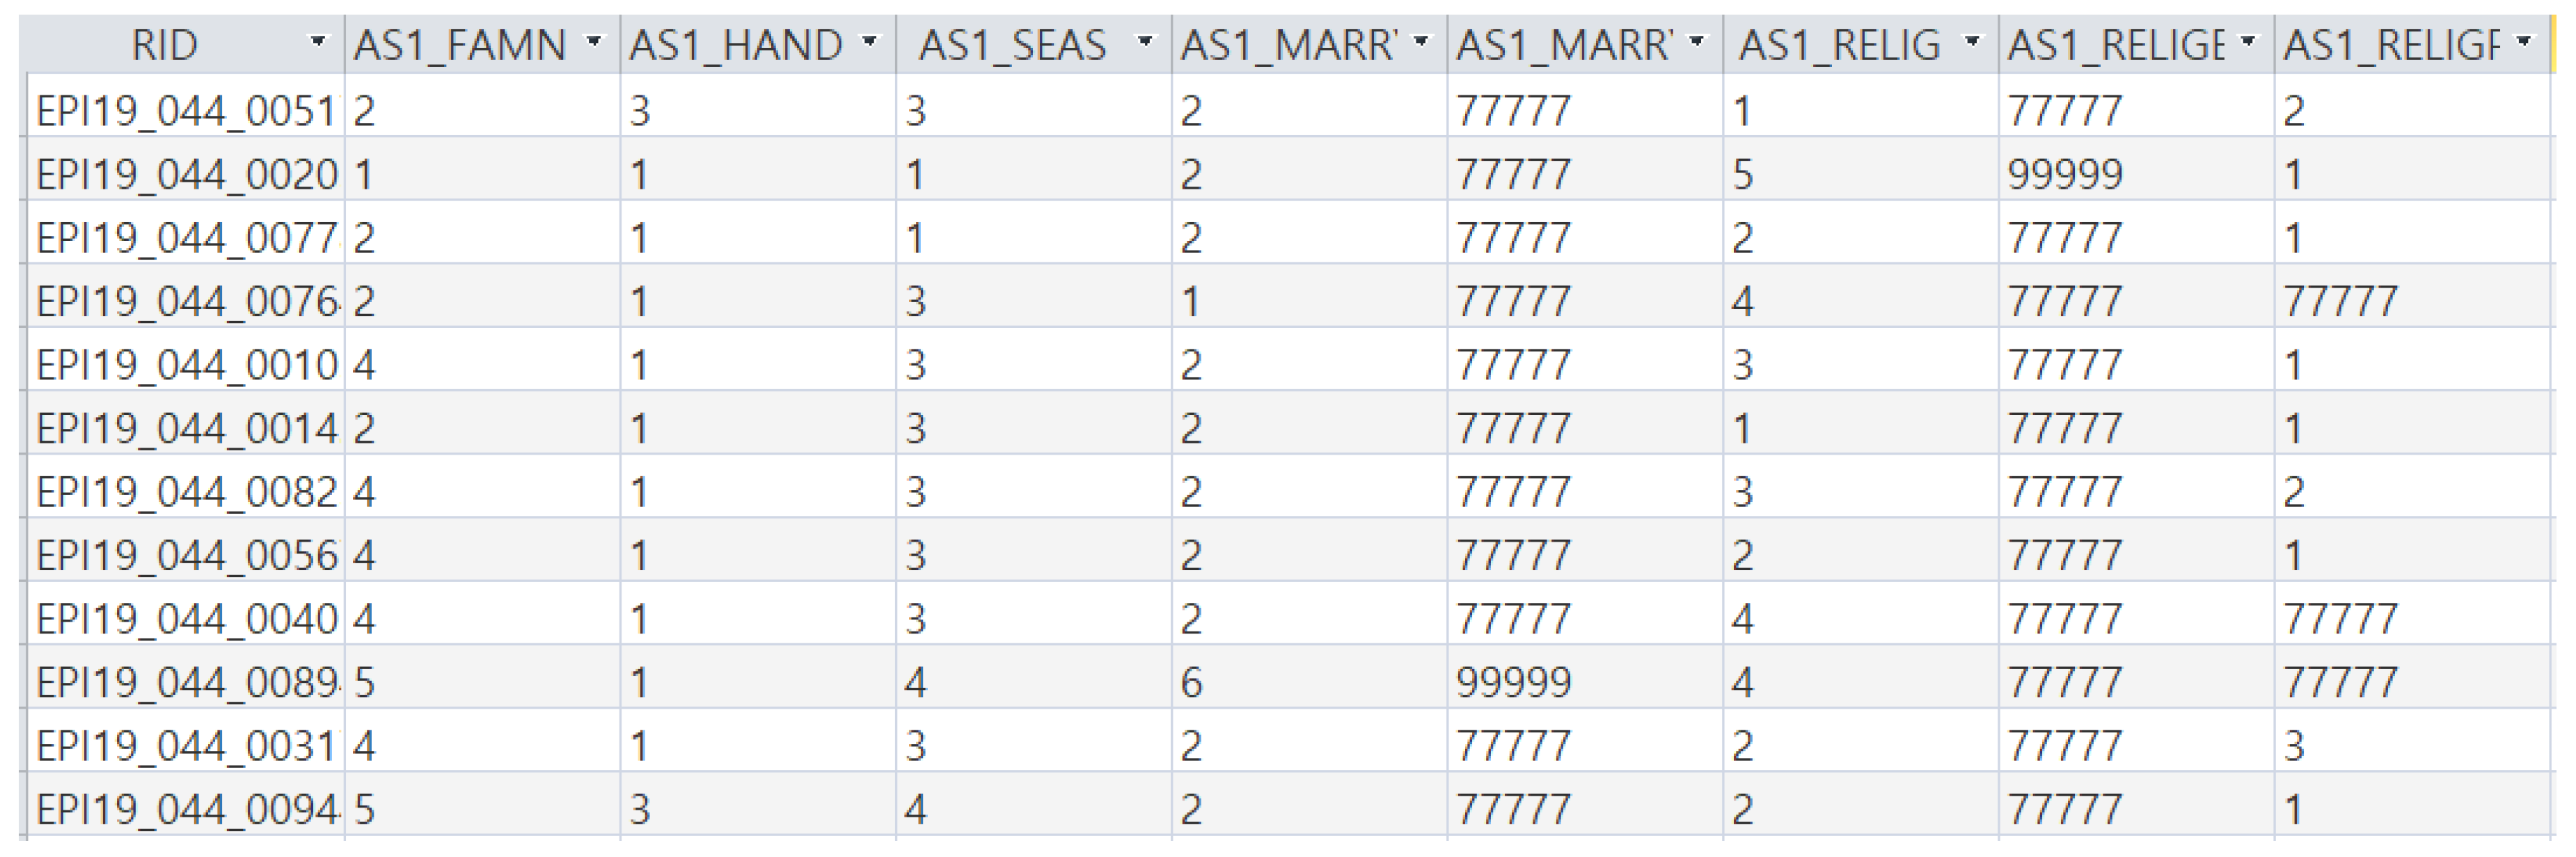
Community-based cohort data (KOGES) is a Korean genomic epidemiologic research project by the Korea Centers for Disease Control and Prevention (KCDC) and is a cohort data set for a population of Koreans residing in a specific area (Anseong–Ansan) [23]. It contains representative characteristics of prospective cohort data, and these are collected from epidemiological and clinical data through health examinations and epidemiological investigations. These data were used to identify the major chronic disease risk factors that are common among Koreans such as diabetes and high blood pressure. The community-based cohort data in this paper were used after approval by the IRB (Institutional Review Board), as shown in Figure 4, and filed as a patent application [24].
3.4. Gene Data
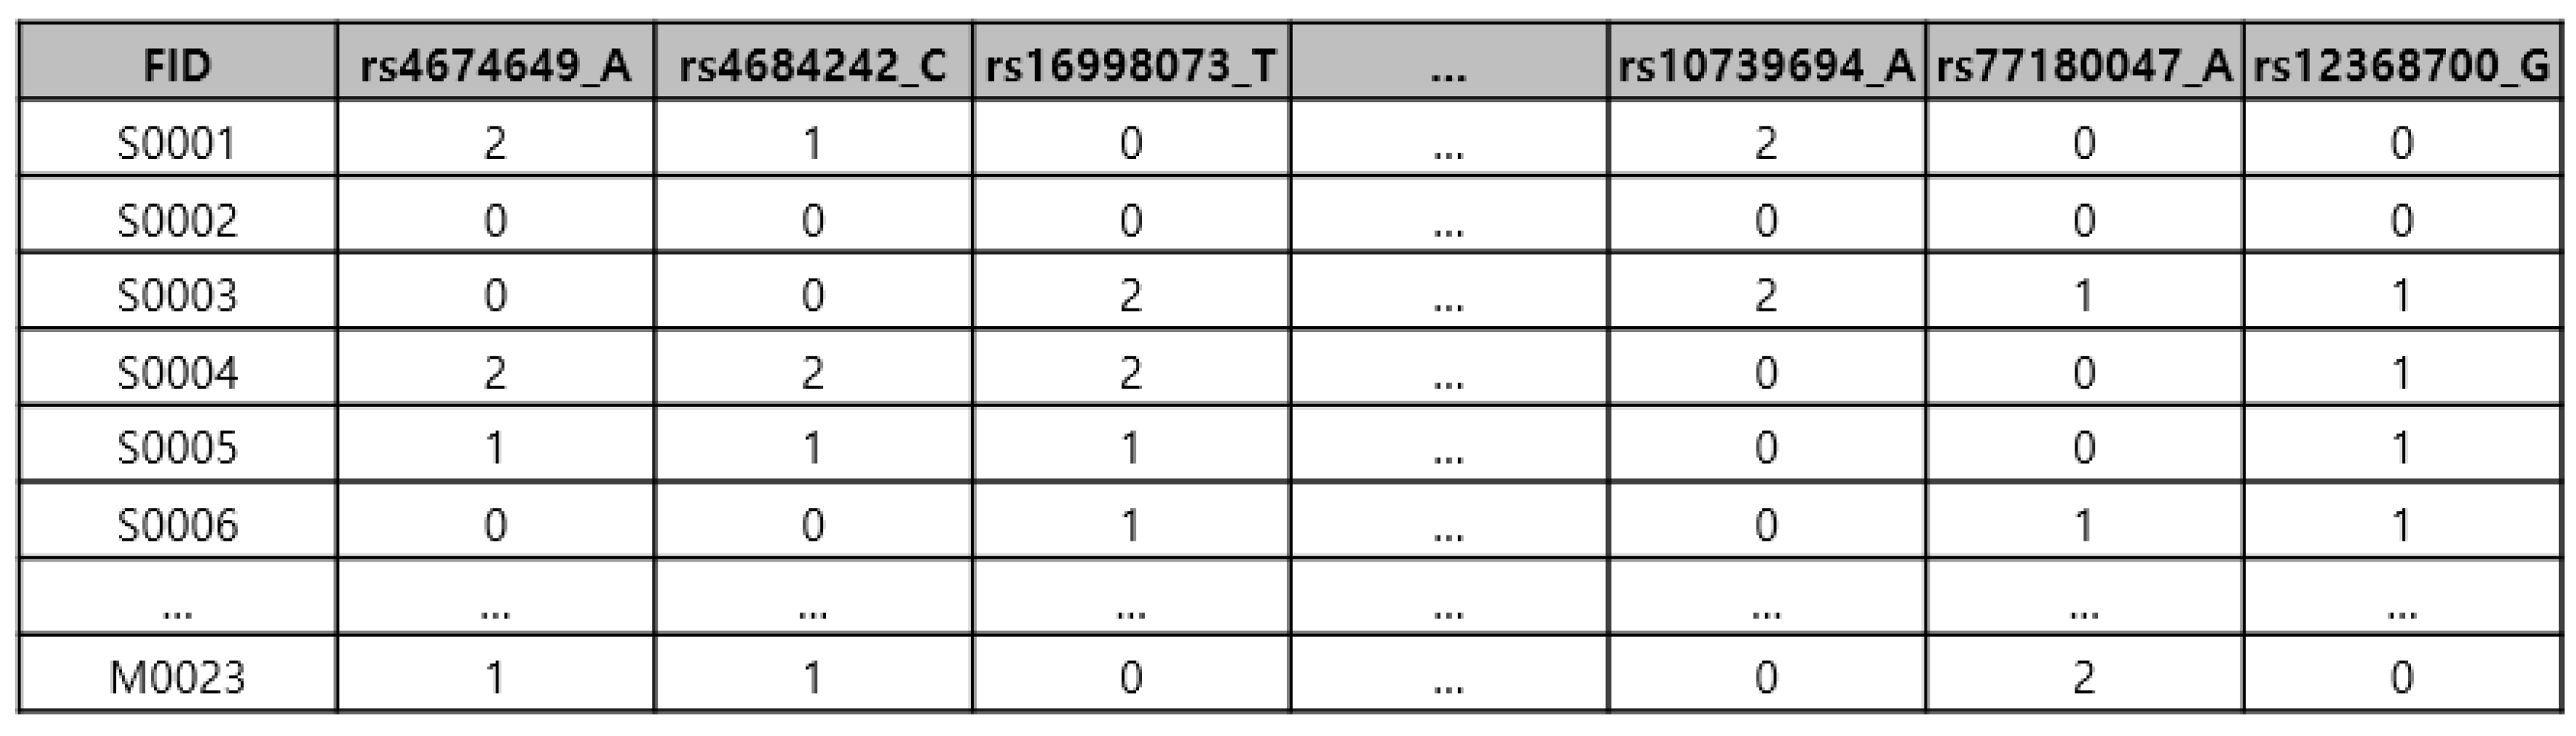
The genomic data used in this experiment are used a basic attribute values (X_2) for behavioral research and for the prediction of deep neural networks for comparisons with other types of data. In general, genomic data include all the biological information of an individual and are homeostatic data that continuously and directly affect an individual’s health until an individual’s birth and death are reached, unless a mutation occurs for any reason. Figure 5 is an example of the recorded values of the genome dataset. About 440,000 pieces of genetic data were collected per person.
3.5. Behavioral Intelligence Data (Lifelog Data)
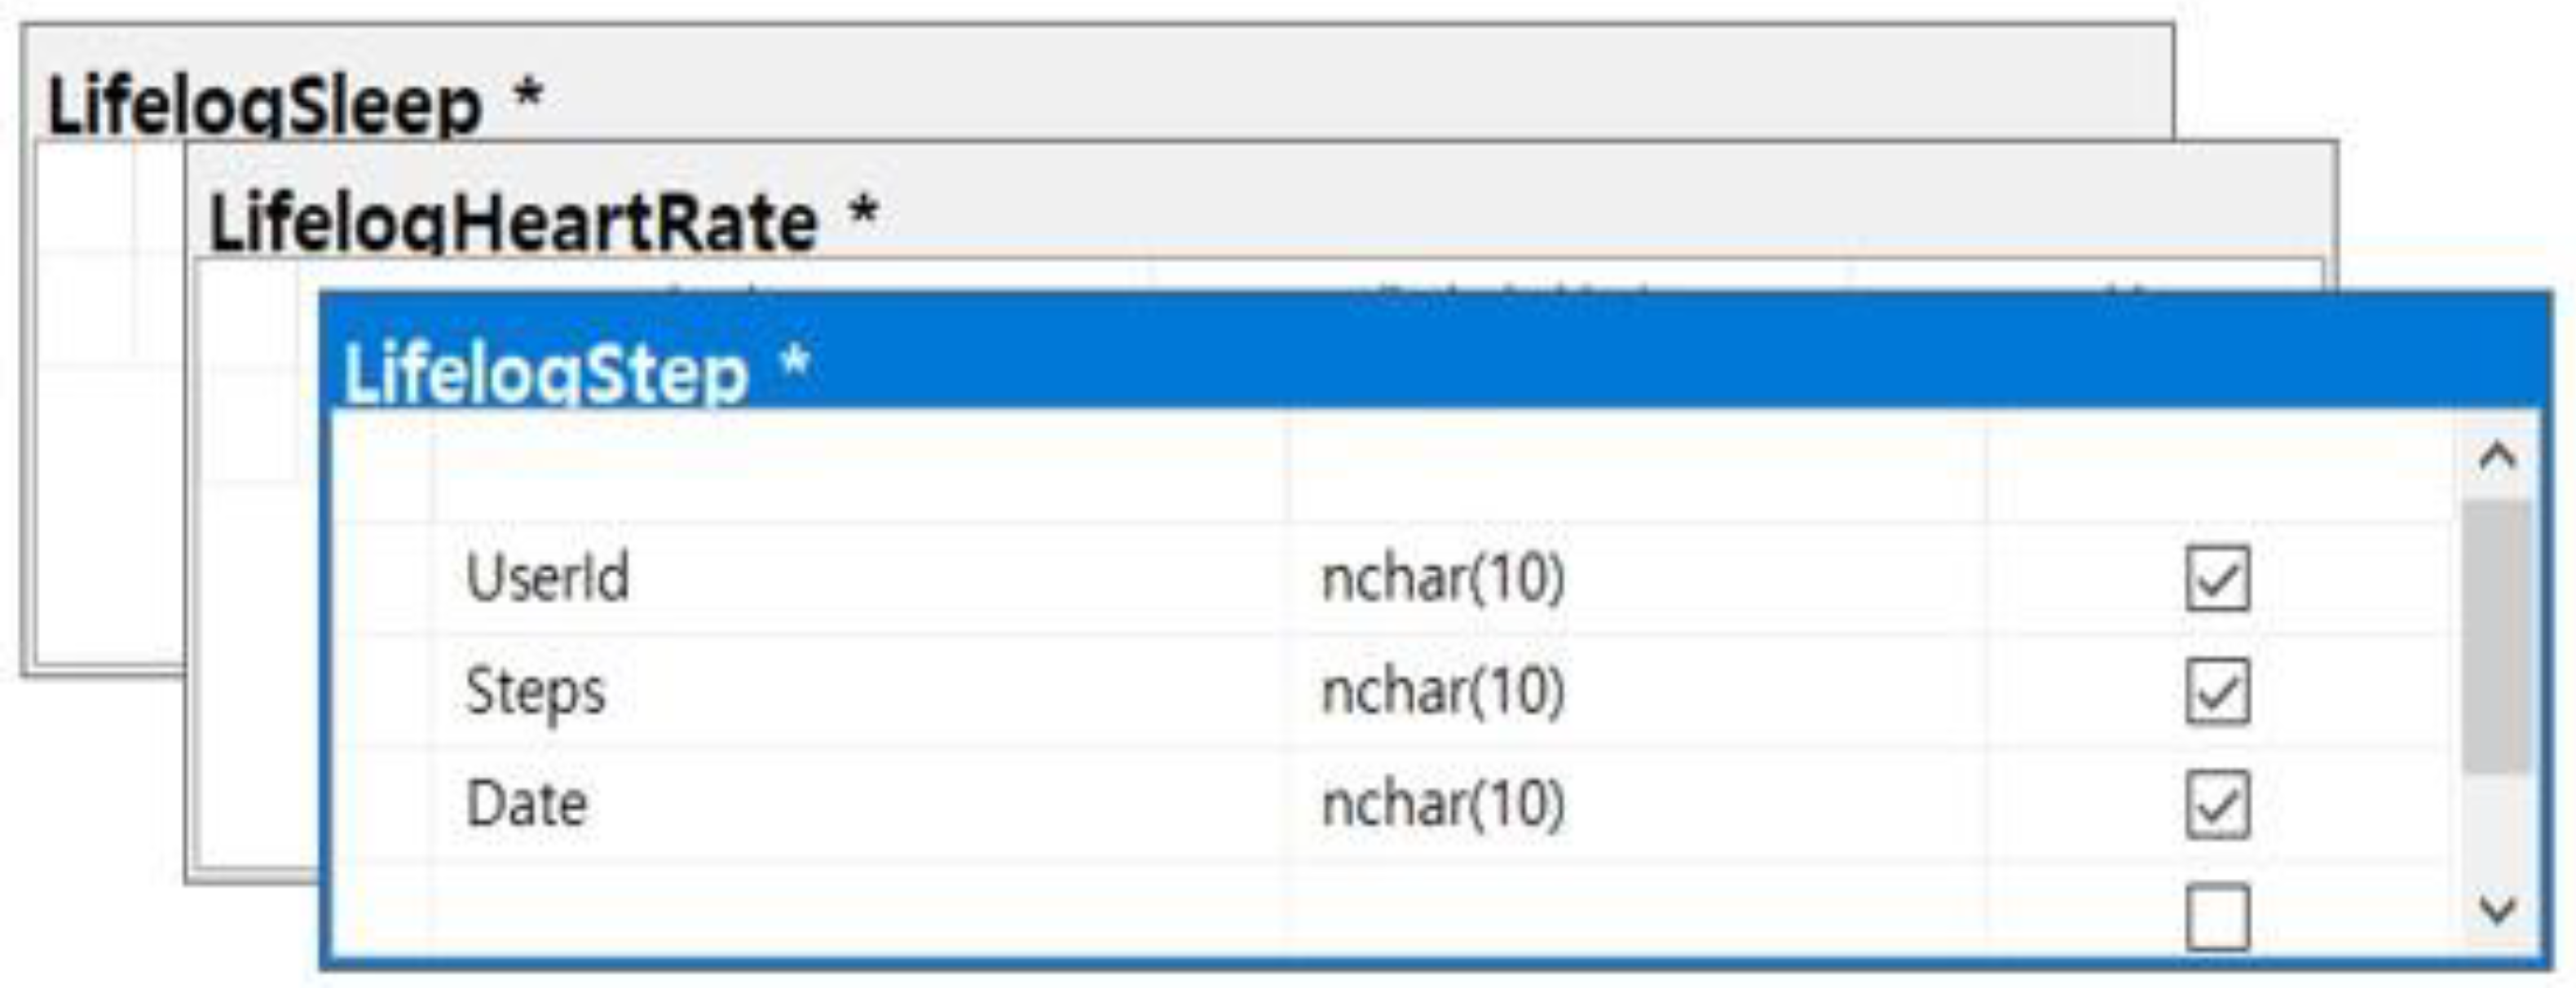
Behavioral intelligence data (X_2), in other words, context awareness (lifelog) data mean everything recorded in the digital space such as personal life and everyday smartphone applications and wearable devices [25]. Lifelog data are obtained by collecting and storing information created in everyday life by a device. Figure 6 shows the recorded values of the behavioral intelligence (lifelog) data set, and these were collected by 23 wearable devices at a 1:1 randomization among 46 applicants. Data were collected by measuring heart rate, exercise, calories burned, and quality of sleep in real time through the device.
4. Feedback Model
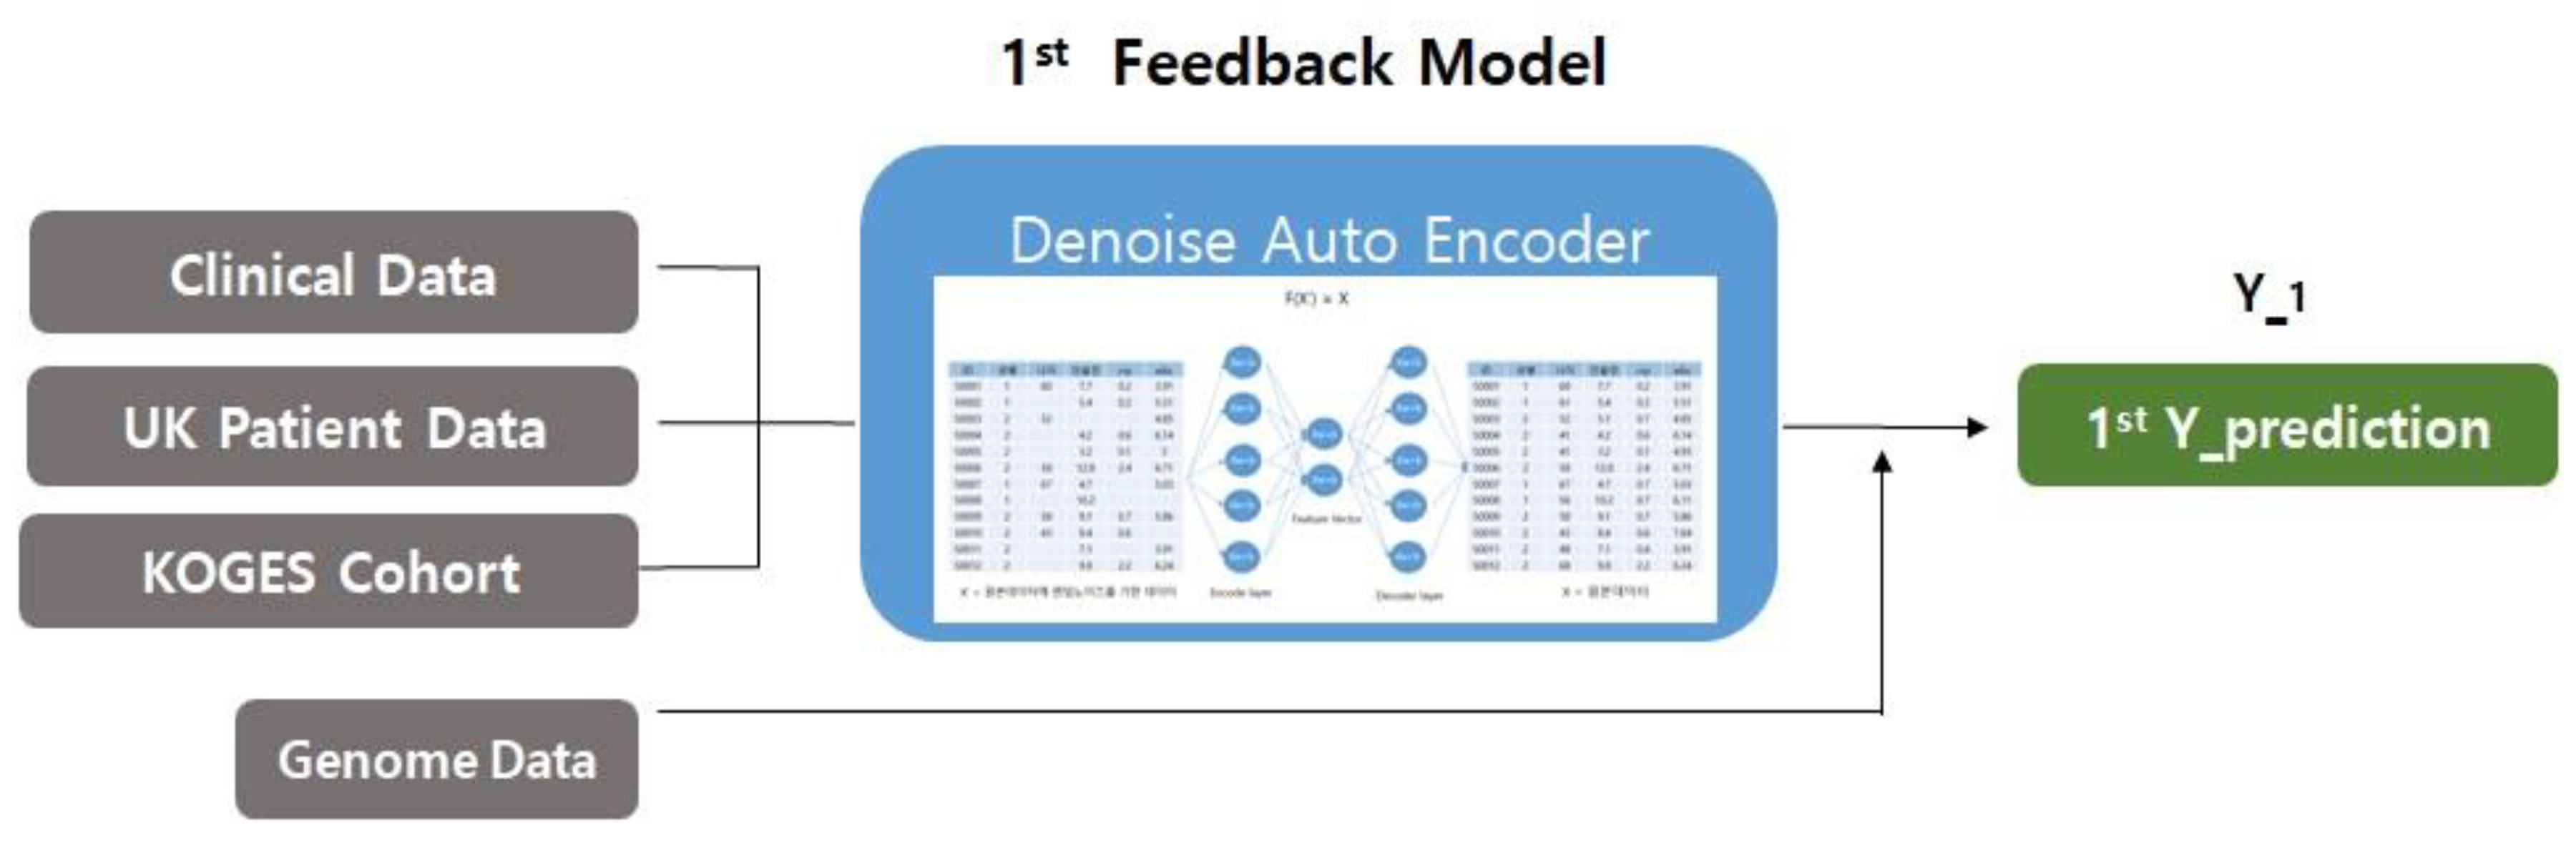
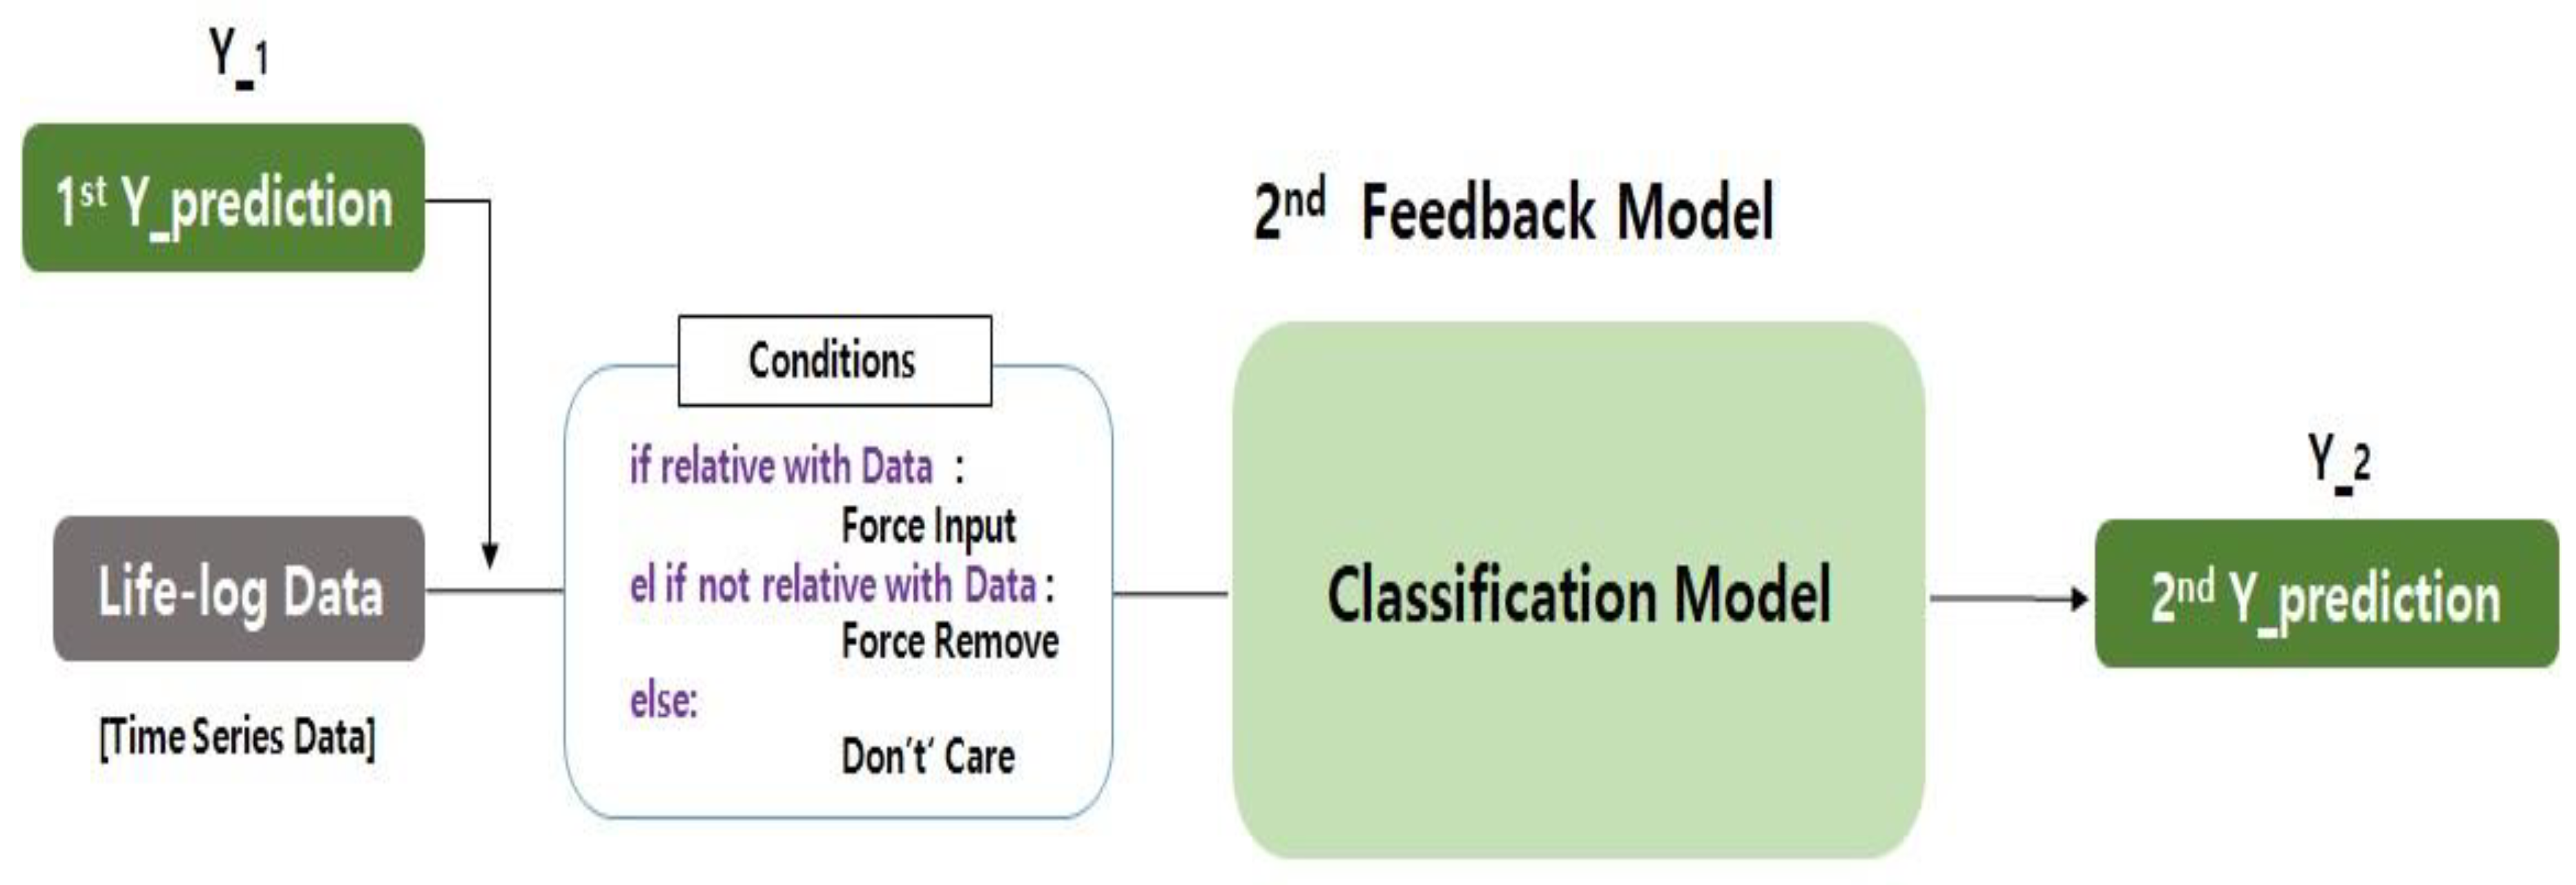
When a large database is involved in increasing the accuracy of deep neural network algorithms, a model of data production and artificial intelligence learning for behavioral research is essential. In general, clinical data are used when the user’s disease information is included. At this time, however, if the clinical data are inaccurate, the results of the prediction are also incorrect. Moreover, if information about the user’s behavior and activity, other than clinical data, is not reflected, time series data (lifelog) according to the user’s situation, which changes over time, must be used as an input value to accurately predict the result. Figure 7 shows the conditions of the first feedback model (first Y_prediction) and the second feedback model (second Y_prediction) and the expected result, used as an input in the deep neural network.
This section presents a new feedback model for the newly proposed deep neural network algorithm, focusing on the need for a special feedback structure for the integrated analysis of behavioral research. As shown in Figure 7, the individual’s physical activity (behavioral intelligence data or lifelog data) emphasizes the part used as the input value in the secondary model with the first Y_prediction value from the primary feedback model. This is an example of a new feedback model, a structured framework for the integrated analysis of behavioral studies of heterogeneous data (X_1, X_2, X_3, and X_4) for deep neural networks. The feedback model for the deep neural network algorithm consists of an initial feedback model and a secondary feedback model that reuses the results. The feedback model proposed in this paper can have various modifications and can take various forms. For example, the input data of the primary feedback and the secondary feedback can be completely different data, except the data described in Section 2, and the model of the first and second feedback model can be varied depending on the purpose and the situation in which it is used. Machine learning techniques can also be used.
The first clinical data (X_1), the dielectric data (X_2), the second clinical data (X_3), and the lifelog data (X_4) were used as examples to exemplify the feedback model in Figure 7. To explain the working principle of the overall feedback model, first, a data set in the form of two data (X_1, X_2) from the first feedback model are merged as a result of the first feedback model. Then, the input data of the second feedback model are recycled. The secondary feedback model performs an analysis using the resulting data set (first Y_prediction) of the primary feedback model, behavioral intelligence data (X_4) and secondary clinical data (X_3), including user activity, as the input data. At this time, for analysis, a method for interpolating missing data values for forced input, forced deletion, and do not care can be presented [24]. First, the condition for applying the forced input is when the input data are input to the secondary feedback model and related to the output value to be predicted or classified. For example, when the feature of the dataset where the missing value is generated should be used as the input for the secondary feedback, replace the missing value with the mean and mode. Second, the condition for applying forced deletion is to delete the feature when the input data are not related to the output that the secondary feedback model has predicted or classified.
5. Theoretical Proof
In this section, in order to verify the validity of the predictive model for the deep neural network algorithm, the theoretical proof and rationale will be presented by linking the abovementioned feedback model based on four or more different heterogeneous data. To briefly describe the overall process, the DAE technique is used and the and feature vectors are extracted, then data pre-processing is performed to restore the missing values in the clinical data from the primary feedback model. The first Y_prediction is derived by merging the data pre-processing result with the genomic data set. At the same time, in the second feedback model, the first Y_prediction, secondary clinical data (X_3) and behavioral intelligence lifelog data (X_4) are used to predict disease. At this time, conditions are applied for the interpolation of missing values [24]. Finally, we use the logistic regression model to classify the deep neural network to generate predictive values and compare them with the correct disease labels to calculate the accuracy.
Figure 8 clearly shows the utilization of various datasets of the first feedback model to derive the first result value. The clinical data used for the accuracy of the deep neural network predictions include the additional UK Biobank patient data [22] and community-based cohort data [23] as input values for the intelligent study of behavior. The values of the data (X_2) were utilized in an important feature.
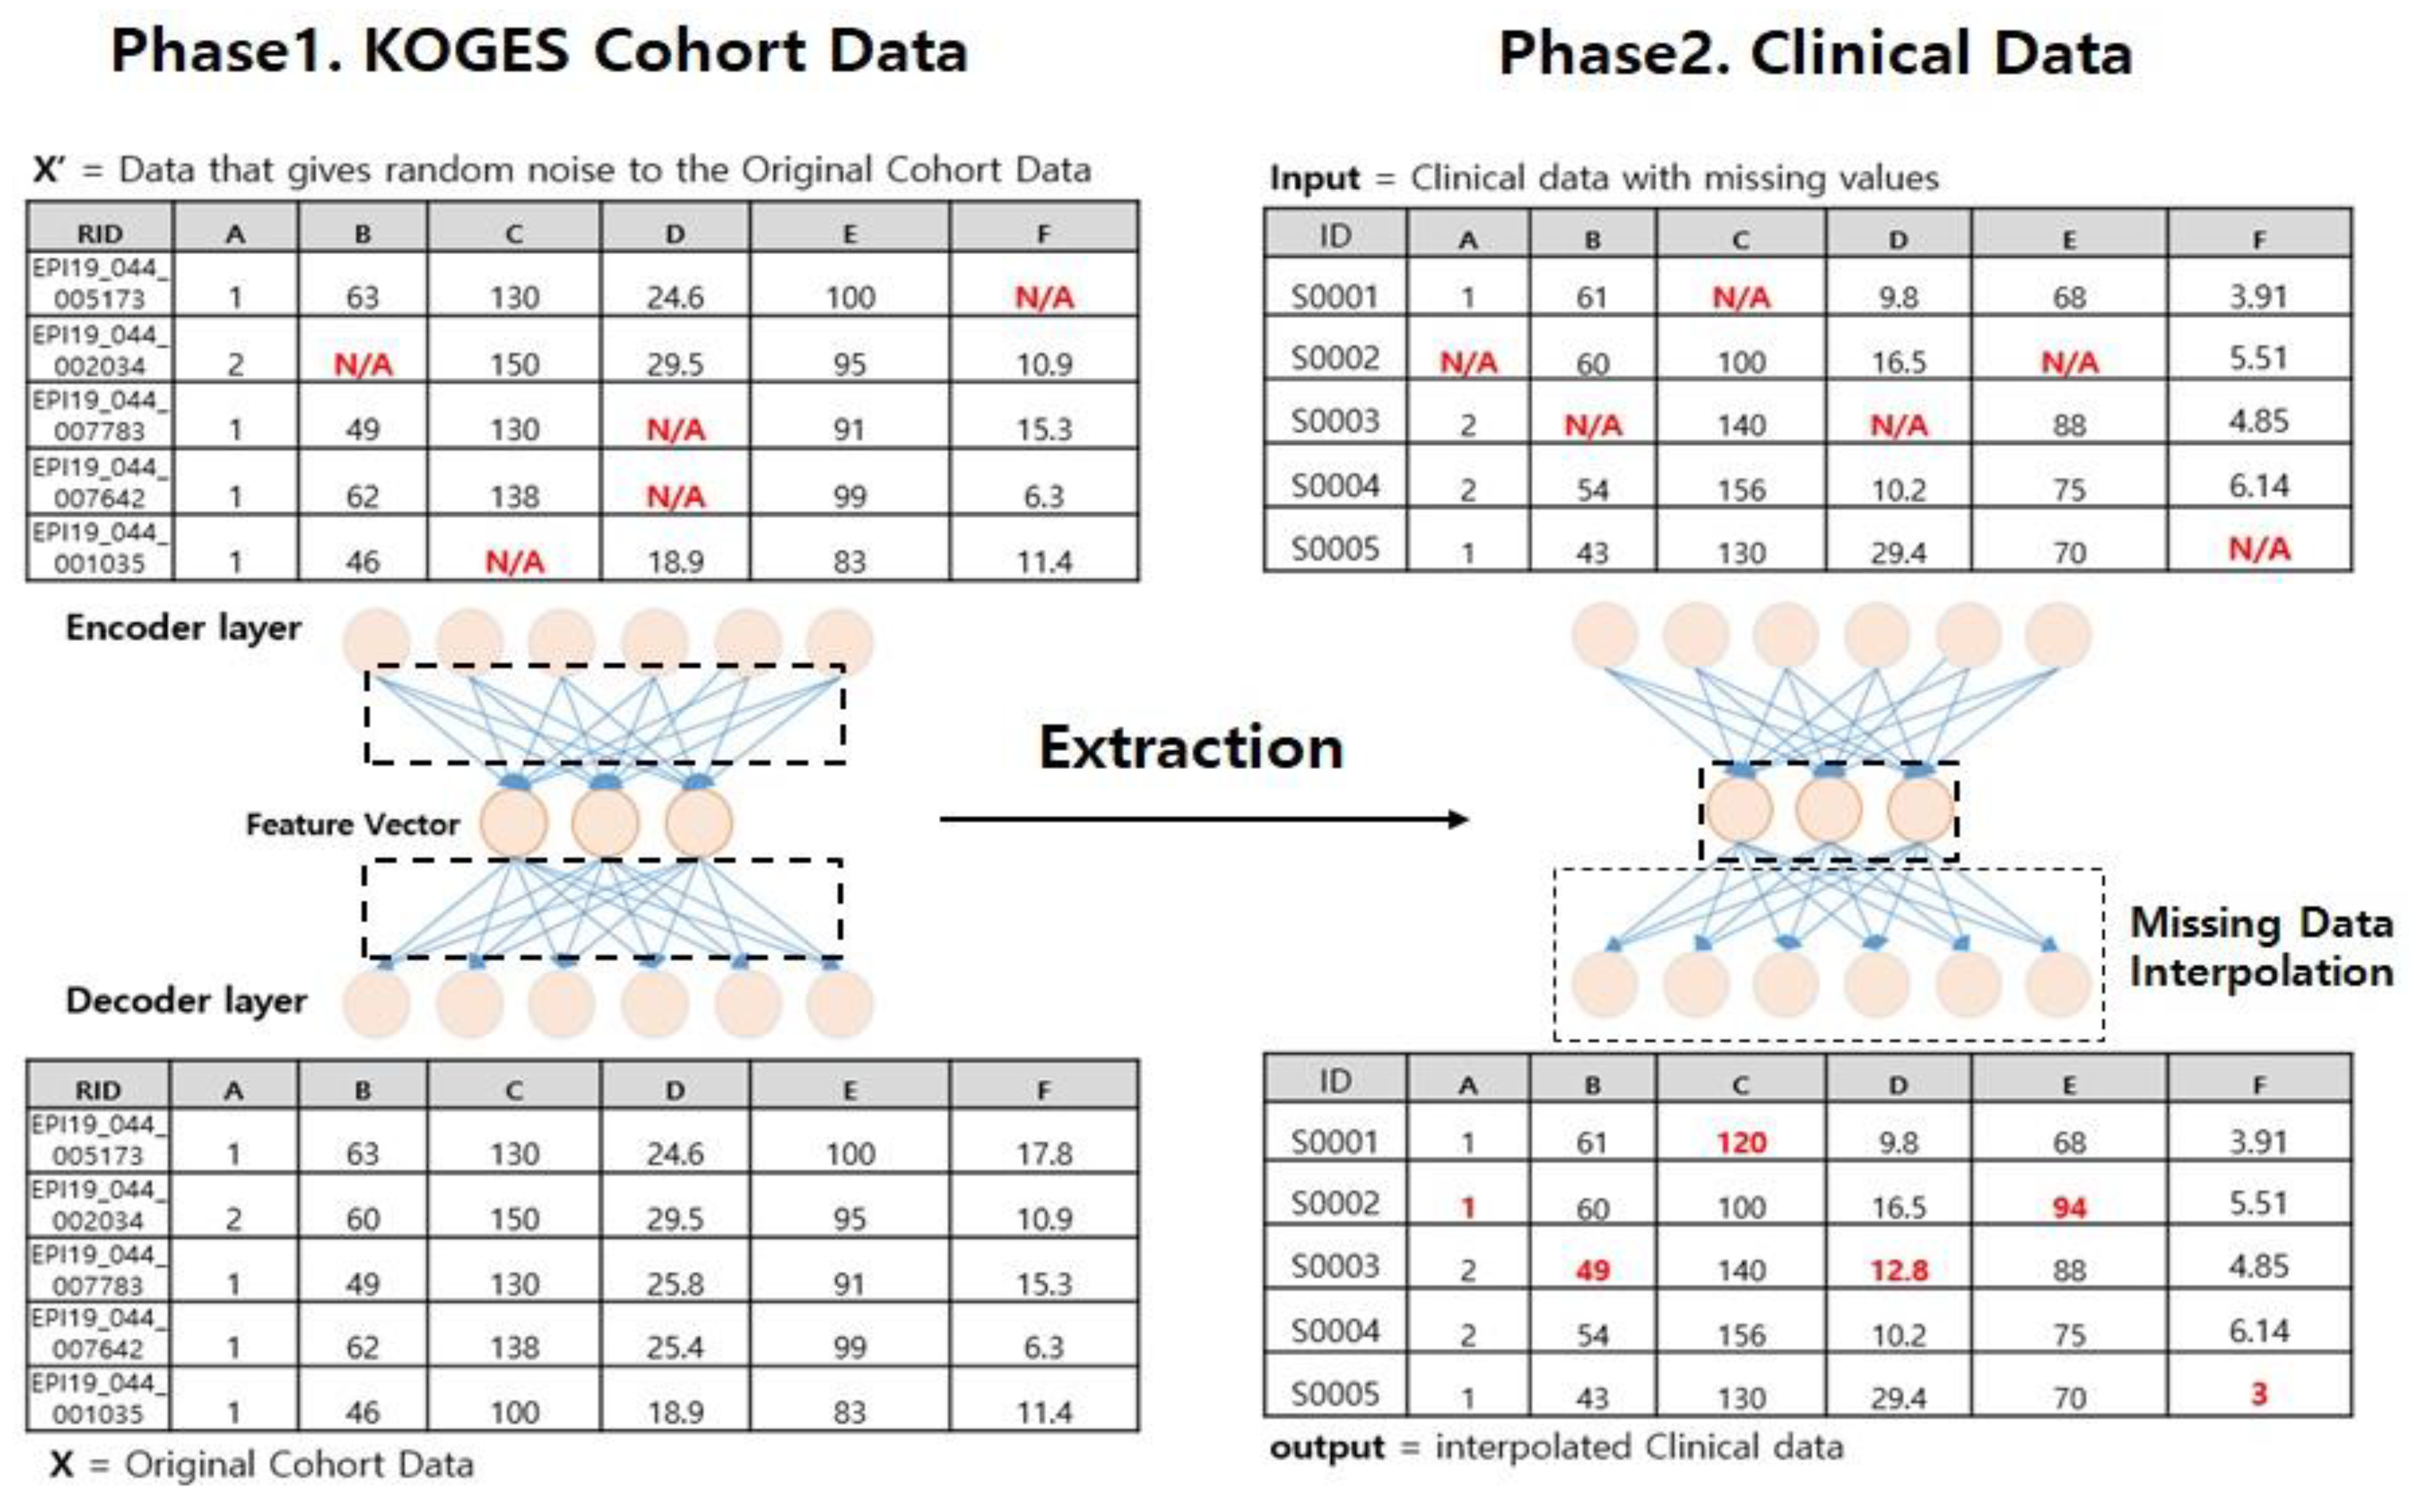
Moreover, Figure 9 shows an example of the interpolation process using the Denoise Auto Encoder. In phase 1, we set the cohort data as input value X and hypothesize that F (X′) = X. At this time, the value of X′ is defined by randomly replacing the original data X with 10% of the input value of zero, including the missing value. We define the loss function as the decoder layer and the mean squared error (MSE) of the X value, and train the DAE model through the optimizer that minimizes the loss.
The relationship between the i-th expected output value () for the mean square error and the value of the correct answer () is as follows:
where is the predicted value, and is the ground truth.
When the training is completed, the compressed information that explains the data of the cohort well, that is, the feature vector, which is the vector in which the individual characteristics are dimensionally reduced, is extracted.
In phase 2, the clinical data for which the missing value is generated is used as an input value and the extracted feature vector is applied. Finally, clinical data with missing values are interpolated through the feature vector. This process applies the UK Biobank patient data to the same data and performs the interpolation of missing values. However, due to the application of deep neural network algorithms, the limitation of the absence of behavioral intelligence data must be overcome. This is because it cannot be predicted if the value of the record associated with the missing value of the data is to be interpolated, that is, the column does not exist in the context-aware data. In this case, as in Equation (2), the conditions of the second feedback model should be applied [24].
The following equation shows the classification of the condition values for the interpolation of missing values in the feedback model:
if relative with Data:
Force input
else if not relative with Data:
Force remove
else:
Do not care
Force input
else if not relative with Data:
Force remove
else:
Do not care
In each case, Equation (2) is a “condition”, which sometimes indicates force input or force remove or do not care in the data connection model.
Figure 10 shows a second feedback model for a heterogeneous data linkage model, where the first prediction value (that is, the first Y_prediction), X_3 (that is, the second clinical data) and X_4 (the lifelog data, mainly physical activities, including all behavioral data) are analyzed by using the training data set for forecasting purposes using conditions and backpropagations [26].
5.1. Force Input
In the DAE method of the primary feedback model, it is impossible to carry out the restoration of missing data if no features are the same as the clinical data, which contains missing data of different types. Conditions are needed because solving the underlying problem is necessary to complete the DAE for deep neural networks. When the missing value feature generated in the clinical data needs to be used in the input data of the quadratic feedback model, the continuous variable is replaced by the mean, and the data are replaced by the missing value in the mode.
5.2. Force Remove
In addition, numerous features exist in clinical data. Due to the classification characteristics of the algorithm of deep neural networks, the more effective the data, the more accurate the prediction is likely to be; however, in reality, the results are often incorrectly derived [27]. This is because the accuracy of the dependent variable does not unconditionally increase due to the large number of independent variables of the linear function in statistical analyses [28].
Therefore, the performance of the algorithm of deep neural networks is data dependent, so there is a need to delete features. For the feature of the missing value that does not explain the value to be predicted in clinical data, this was removed using the drop function provided by Pandas [29]. Finally, the characteristics of hypertension, a typical disease caused by metabolic syndrome, were examined through a data set that applied conditions for the accuracy of the algorithms of the first and second feedback models. A logistic regression model was used as the classification model in this paper. We defined the loss function of logistic regression as a sigmoid, trained it through an optimizer that minimizes the loss, and calculated its accuracy using verification data.
The sigmoid model of the loss function of logistic regression is as follows:
where is constrained by an x variable pair to horizontal asymptotes.
6. Experiments
In this section, using the feedback model of the deep neural network proposed in Section 5, the results are derived through experiments to implement the deep learning-based data connection model and enable behavioral intelligence data research by feature extraction. Here, in order to explain the experimental environment, prediction accuracy, and performance comparison process of a deep neural network, a behavioral-type feedback model based on a new deep learning classification model is presented.
The whole process performs the pre-processing of the data via DAE with the first feedback model, merging clinical and genomic datasets. The resulting value that appears here is merged with the lifelog data as an input value for the second feedback model, and special conditions are applied. At this time, the logistic regression model method is applied to measure the expected accuracy of a specific disease in the experimental group, that is, the division between the young generation and the old generation. In this experiment, the results of measuring the hypertension classification accuracy by experimental group per 1000, 2000 and 3000 epochs were obtained. It should be noted that the epoch is the number of passes through the entire training dataset the machine learning algorithm has completed. For the experiment, we used Tensorflow version 2.0, provided by Google, as a deep learning software tool [30]. We implemented CentOS of Linux version 7.0 in an environment where Tensorflow version 2.0 was installed and implemented it using a Jupyter open source web application [31]. This has the advantage of being able to create deep neural network models in a variety of environments and to facilitate learning, which allows intuitive development, and applies DAE and logistic regression as proof to derive the final results [32,33,34,35,36]. As for the values in the case of DAE and logistic regression, the experimental results when applying the condition values of the feedback models at the same time were clearly compared and analyzed.
Therefore, in this experiment, the feedback model of the deep neural network presented in Section 5 was implemented and verified. In particular, in order to evaluate the performance of the classification of deep neural networks, first, the source data set was randomly divided at a ratio of 7:3 to extract the training data set and test data set. In the training data set, only columns with or without hypertension were selected to make a training data set (Y_1; i.e., 1st Y_prediction); columns with or without hypertension in the training data set were deleted, and test data sets were also extracted in the same manner. After that, we trained for logistic regression using the training data. In this experiment, the same test data set was used for the accurate performance comparison, and the accuracy of the hypertension classification in the experimental group can be recognized as the performance of a deep neural network algorithm that forms the basis of behavioral intelligence research.
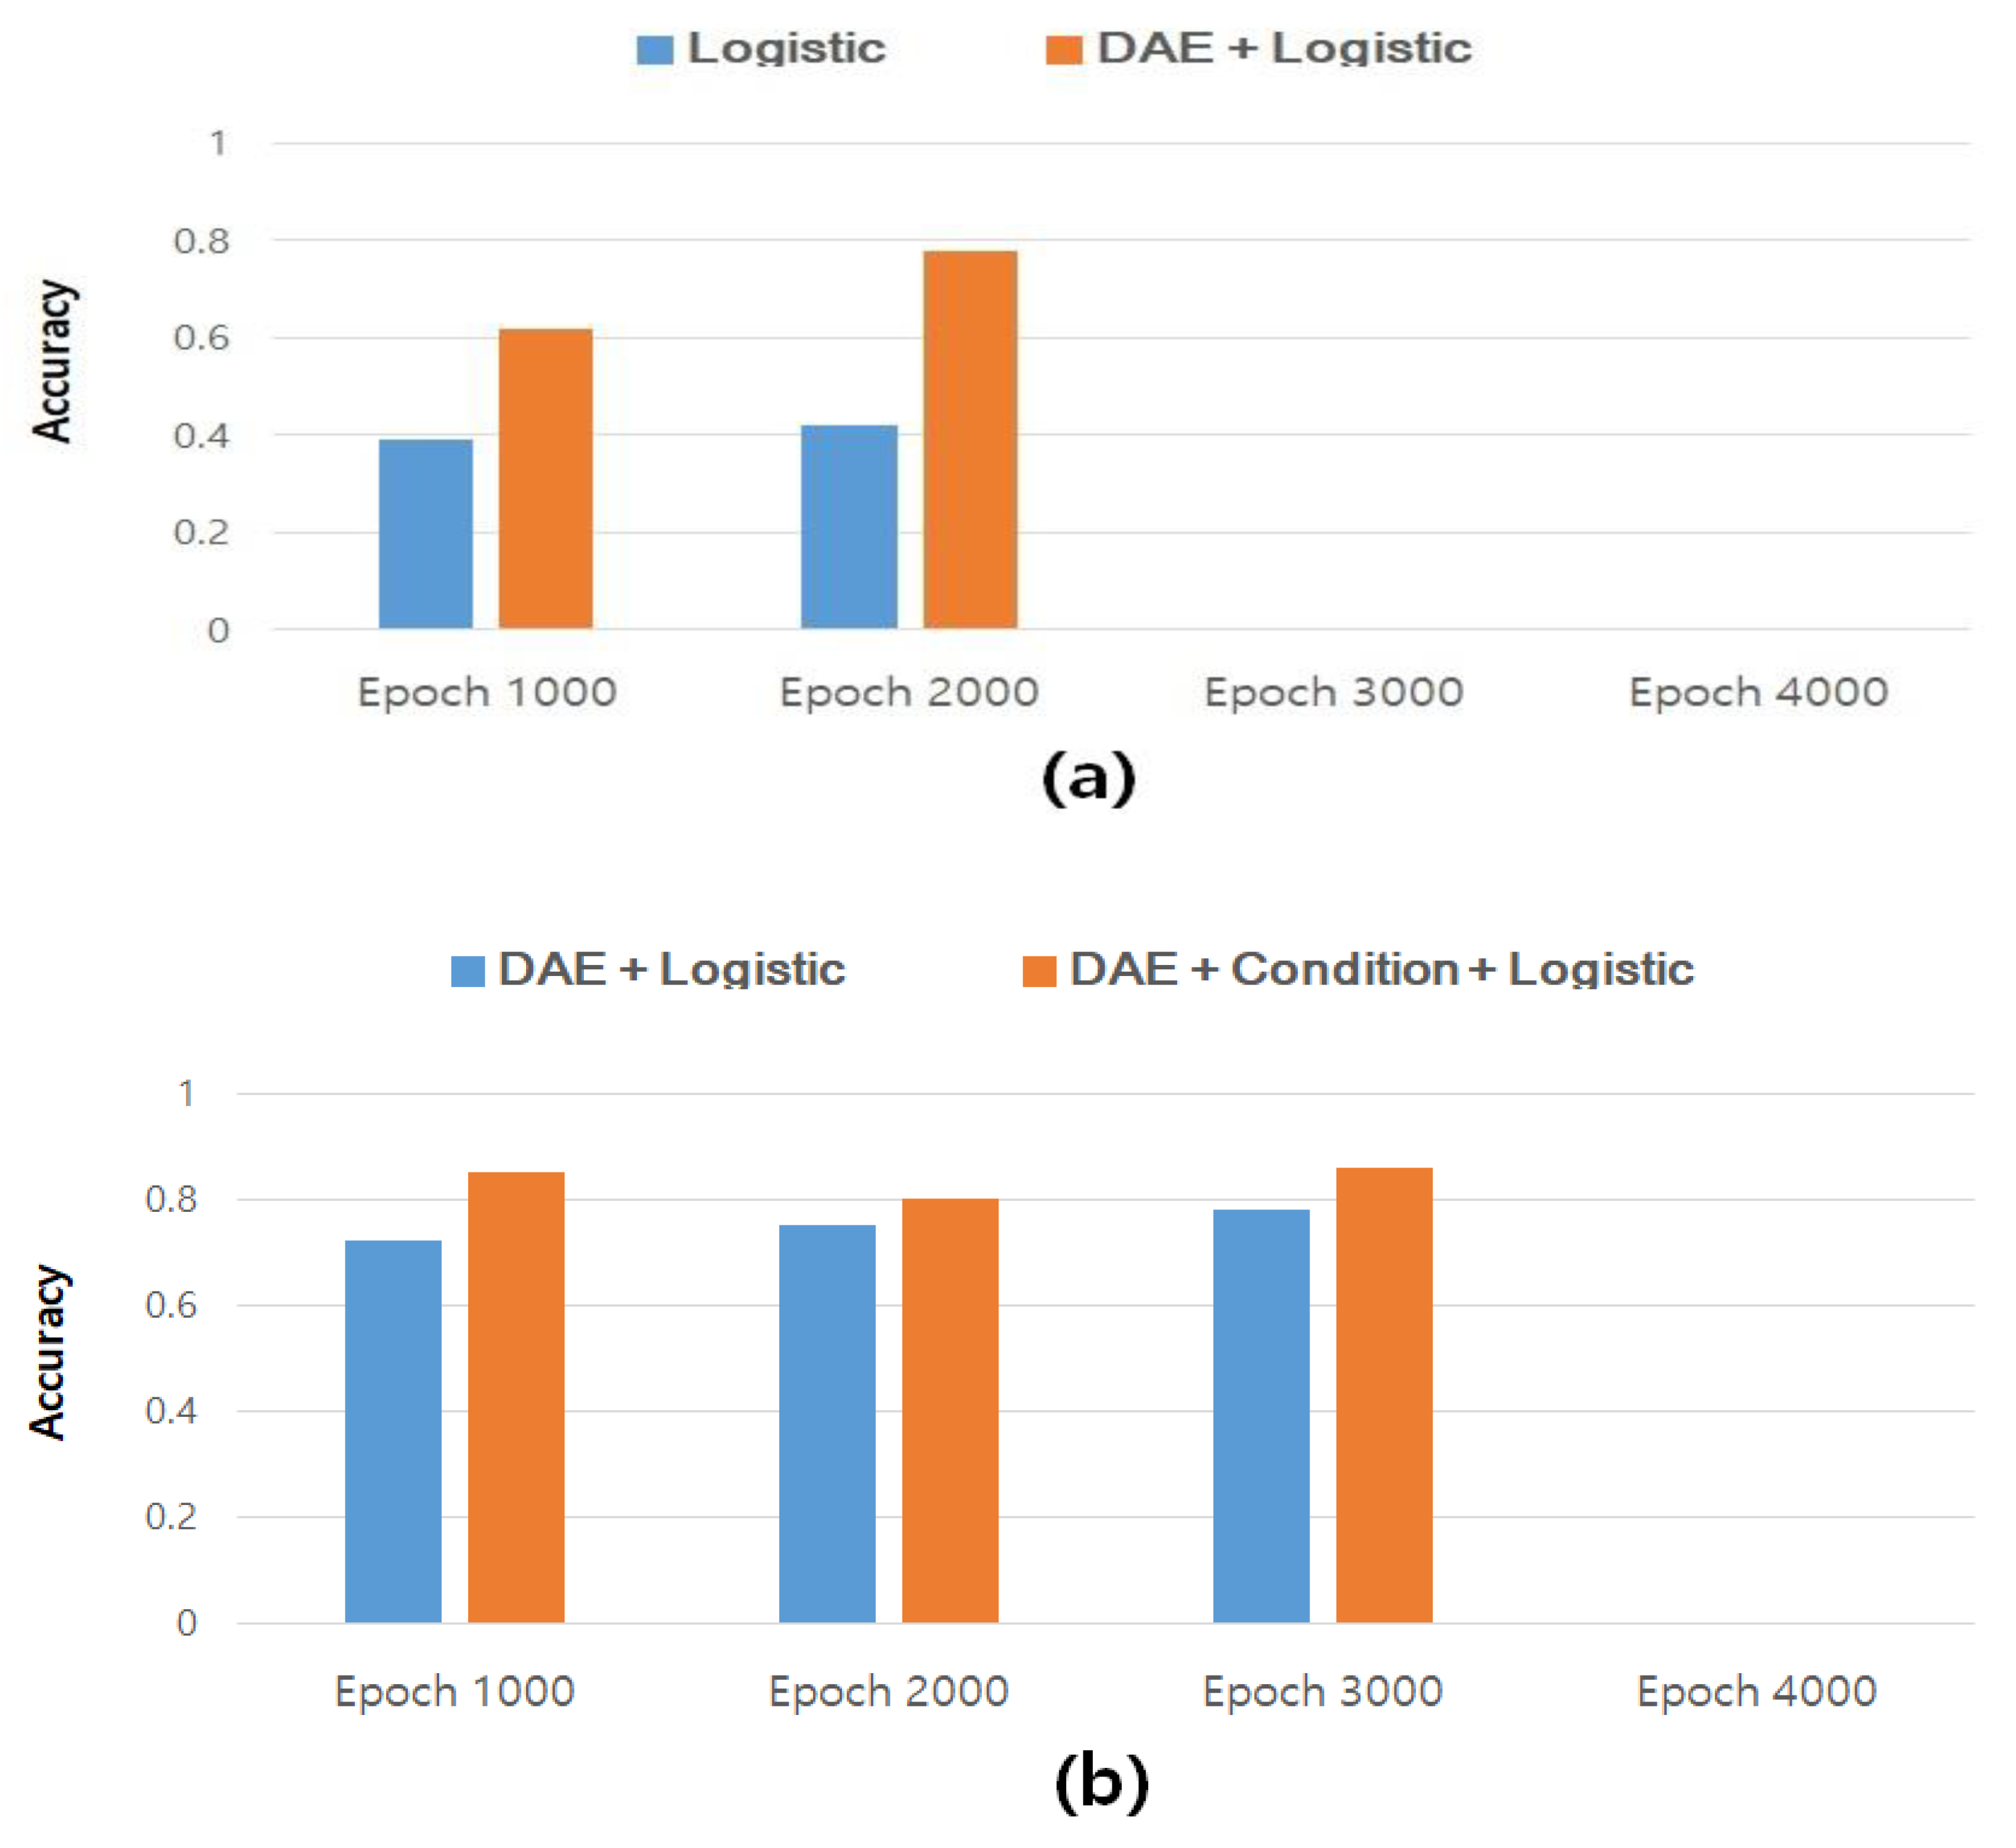
Figure 11 compares the results of measuring the accuracy of hypertension classification without restoring the missing values in the dataset for the study of behavioral intelligence on a given deep neural network, and the results of measuring the accuracy of hypertension classification after restoring the missing values through DAE. In particular, Figure 11a shows the accuracy of the classification of hypertensive disease before restoring the missing data. The results after restoring the missing value through the DAE and classifying hypertension disease were from 0.4 to 0.6 ~ 0.79 or more and we obtained an accuracy of about 20% or more compared to the general logistic regression analysis value, showing an improvement. As a result, it can be seen that for the study of behavioral intelligence on deep neural networks, it is better to obtain and predict more relevant data through data restoration.
In addition, Figure 11b shows the results of measuring the accuracy of classification of hypertensive disease after restoring missing values through DAE for behavioral intelligence research on deep neural networks, and secondary feedback by applying clinical data and lifelog data after using the DAE. These are the results after finally measuring the classification accuracy of hypertensive disease via the model. In conclusion, the results after applying the deep neural network’s feedback model show that the classification accuracy can be improved by about 8 to 9% on average. By simply applying DAE and logistic regression, we verified the experimental results for epochs 100, 2000, and 3000 of deep learning to evaluate the effectiveness and accuracy of the feedback model of the deep neural network, given the classification accuracy of hypertensive diseases. This was verified by a procedure to validate the study of behavioral intelligence data as a feedback model for deep neural networks.
In addition to predicting the occurrence of hypertensive disease for real prediction purposes, a correlation experiment with smoking was also simulated. Two types of data, a training data set and a test data set, were sampled at a ratio of 7:3, and pre-processing was performed to enable training by the one-hot encoding of each datum. First, the order of the deep neural network (DNN) performance evaluation is obtained by the random partitioning of the source data set 7:3 (outcome: training data set and test data set). Second, we pull out only the smokes column from the training data set (outcome: training Y_1). Third, we train DNN to be the training data set with the test data set (outcome: training Y_2, i.e., the final prediction of the DNN model). Fourth, we generate noise in the test data set (outcome: noise test data set), Fifth, we evaluate the accuracy by comparing the result obtained by entering the noise test data set into the DNN model and the test data Y_2 value.
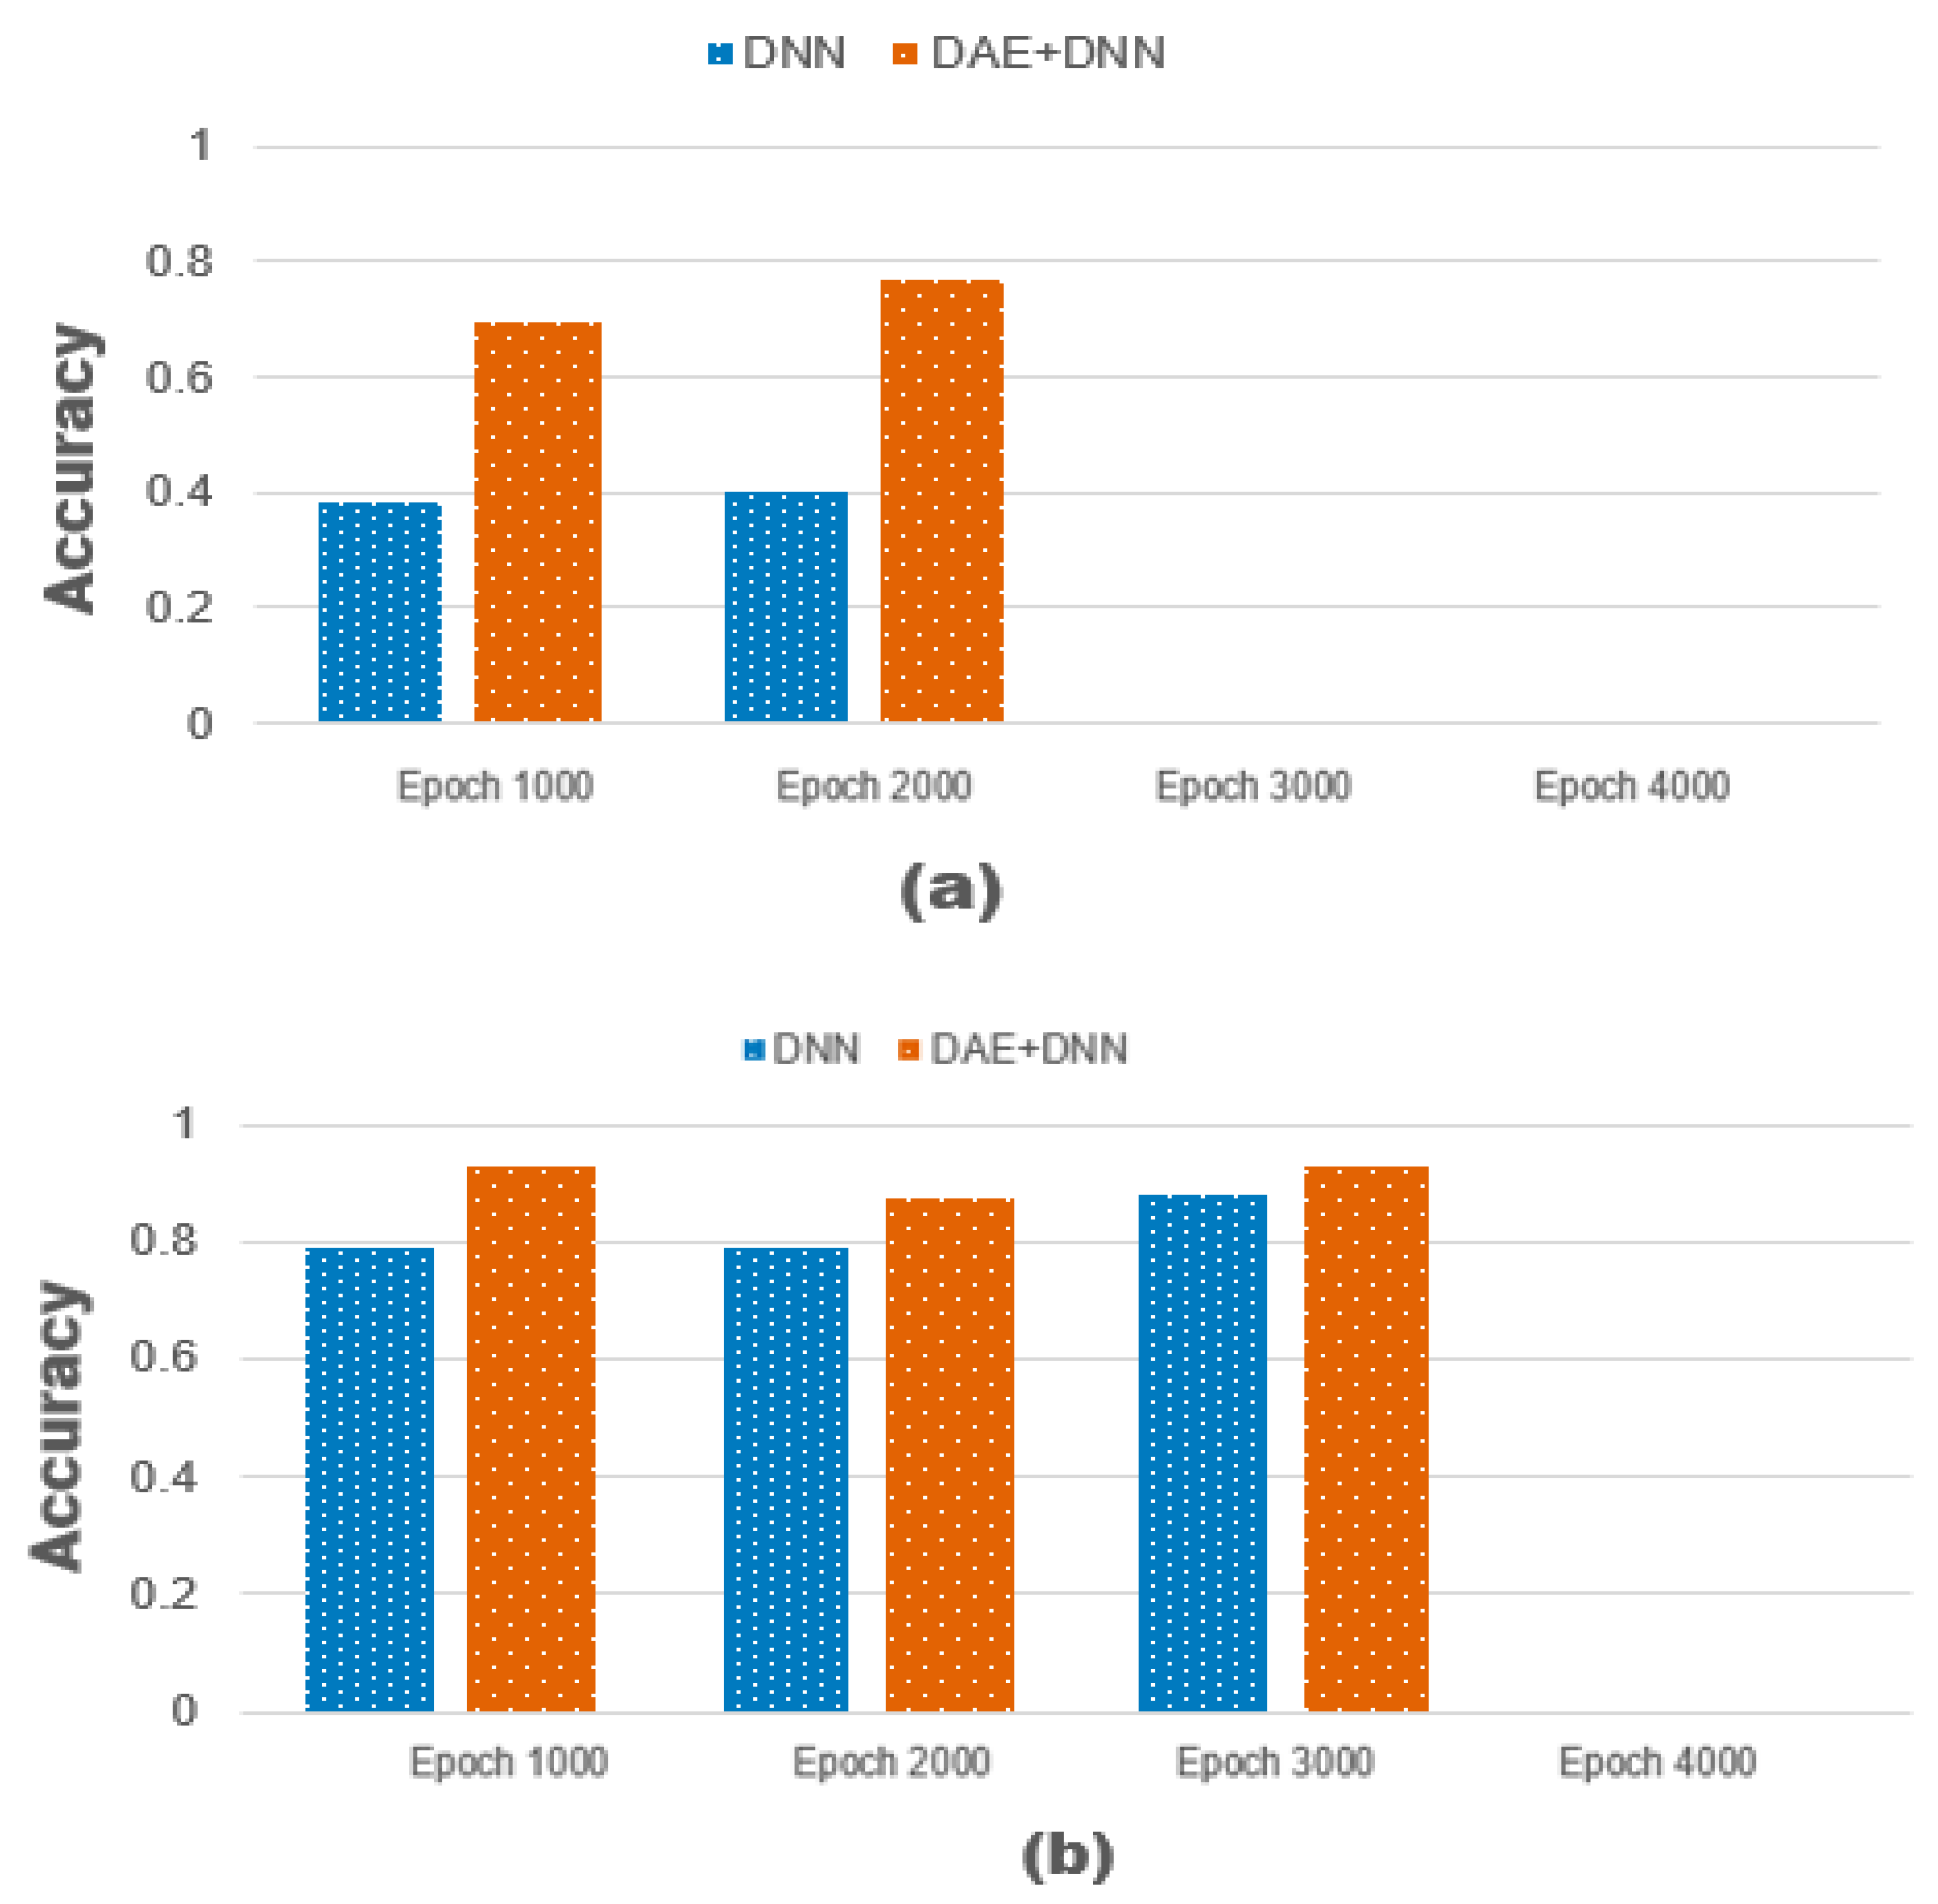
Therefore, the simulation considerations include the noise ratio when learning DAE, the noise ratio of the test data set, the number of epochs, the number of DAE encoder and decoder nodes, the layer of DNN, and the change in the prediction column. It is necessary to construct and simulate heterogeneous data associated with time-series data, i.e., clinical data and lifelog data, by applying linear regression. Therefore, in order to visualize the input values of 1000, 2000, and 3000 epochs, the metabolic syndrome related to the smoking rate is composed of multi-layers in the deep neural network. In Figure 12, the x-axis shows “accuracy”, while the y-axis shows the number of epochs. By applying deep neural network learning to metabolic syndrome related to smoking rate, our results indicate that multi-layers 51 and 101, and 1000, 2000, and 3000 epochs are compared. In this case, the F (X′) = X model of the source code is given by the cost function (+ a). The output value is generally compared to the input value, but noise levels 10 and 40 are included in the experiment. Figure 12a compares the values of ‘DNN’ and ‘DAE + DNN’, which change at a noise ratio of 10 when the number of epochs increases by one step (1000~3000), through the entire data set and updates the parameters. As shown in Figure 12b, each ‘DAE + DNN’ model occurring at noise ratio of 40 shows that the accuracy fits the linear regression model.
7. Conclusions
When applying a large-scale database that holds the behavioral intelligence data of a deep neural network, it is necessary to propose a new model to avoid errors by using the results of the deep neural network that were collected first. This can be applied when research on behavioral change is needed, especially in the medical field, and among multiple domains that deal with large amounts of data such as energy, defense, finance, and medicine. Since each type of data includes artificial intelligence classification accuracy and behavior data, it is insufficient to replicate the characteristics of individual behavior as an existing statistical model. Therefore, it is difficult to apply other types of data to deep neural networks in general, and a new reconstruction method and feedback model for missing data is needed for the algorithms of new deep neural networks. In particular, it is absolutely necessary to validate the performance value of a new deep neural network rather than using an output value that is obtained by executing a completely different data set in a new deep neural network.
With the recent increasing interest in health, various systems and services for providing personalized information for health management have been developed. Even in cohort studies that mainly focus on time series data, it is more efficient that personalized medical services rely on deep neural network algorithms that reflect action-intensive data to enable the accuracy of classification and prediction. The need to provide services emerges with an accurate result, that is, health information that changes due to the activity of the user.
In this paper, through an experiment, after extracting the feature vector of the deep new network, restoring the missing value, and classifying the hypertension, the accuracy was improved by about 20% on average. A new data connection model, the Deep Neural Network Feedback Model, was proposed by adding behavioral intelligence data to time series data. After measuring the classification accuracy of hypertensive disease, the objective was to verify that the classification accuracy improved by about 8–9% on average.
Funding
This work was supported by the AIM (AI based Next-generation Security Info. Event Mgmt. Methodology for Cognitive Intelligence and Secure-Open Framework) project, IITP (Ministry of Science, Technology and Communication, Republic of Korea), under Grant no. 2019-0-00224.
Acknowledgments
We thank the anonymous reviewers for their useful comments that helped improved the paper. The author is grateful for the experimental discussions with S. J. Lee., who is a guest member of the Applied Internet Research (AIR) laboratory, and also thanks the lab researchers, S. Yoon., B. Kim., and Miseon. Lee., for their help with data entry and the pre-processing of files. All authors have read and agreed to the published version of the manuscript.
Conflicts of Interest
The author declare no conflict of interest.
References
- Samek, W.; Wiegand, T.; Müller, K.R. Explainable Artificial Intelligence: Understanding, Visualizing and Interpreting Deep Learning Models. arXiv 2017, arXiv:1708.08296. [Google Scholar]
- Jerez, J.M.; Molina, I.; García-Laencina, P.J.; Alba, E.; Ribelles, N.; Martín, M.; Franco, L. Missing Data Imputation using Statistical and Machine Learning Methods in a Real Breast Cancer Problem. Artif. Intell. Med. 2010, 50, 105–115. [Google Scholar] [CrossRef] [PubMed]
- Kesner, R.P.; Gilbert, P.E.; Wallenstein, G.V. Testing Neural Network Models of Memory with Behavioral Experiments. Curr. Opin. Neurobiol. 2000, 10, 260–265. [Google Scholar] [CrossRef]
- Zimmermann, T.; Nagappan, N.; Gall, H.; Giger, E.; Murphy, B. Cross-project Defect Prediction: A Large Scale Experiment on Data vs. Domain vs. Process. In Proceedings of the 7th Joint Meeting of the European Software Engineering Conference and the ACM SIGSOFT Symposium on The Foundations of Software Engineering, Amsterdam, The Netherlands, 24–28 August 2009; pp. 91–100. [Google Scholar]
- Sabuncu, M.R.; Konukoglu, E.; Alzheimer’s Disease Neuroimaging Initiative. Clinical Prediction from Structural Brain MRI Scans: A Large-scale Empirical Study. Neuroinformatics 2015, 13, 31–46. [Google Scholar] [CrossRef] [Green Version]
- Siegrist, J.; Starke, D.; Chandola, T.; Godin, I.; Marmot, M.; Niedhammer, I.; Peter, R. The Measurement of Effort–reward Imbalance at Work: European comparisons. Soc. Sci. Med. 2004, 58, 1483–1499. [Google Scholar] [CrossRef]
- Seiffert, C.; Khoshgoftaar, T.M.; Van Hulse, J.; Napolitano, A. RUSBoost: A Hybrid Approach to Alleviating Class Imbalance. IEEE Trans. Syst. Man Cybern. Part A Syst. Hum. 2009, 40, 185–197. [Google Scholar] [CrossRef]
- Batista, G.E.; Monard, M.C. An Analysis of Four Missing Data Treatment Methods for Supervised Learning. Appl. Artif. Intell. 2003, 17, 519–533. [Google Scholar] [CrossRef]
- Acuna, E.; Rodriguez, C. The Treatment of Missing Values and its Effect on Classifier Accuracy. In Classification, Clustering, and Data Mining Applications; Springer: Berlin/Heidelberg, Germany, 2004; pp. 639–647. [Google Scholar]
- Vincent, P.; Larochelle, H.; Bengio, Y.; Manzagol, P.A. Extracting and Composing Robust Features with Denoising Autoencoders. In Proceedings of the 25th International Conference on Machine Learning, Helsinki, Finland, 15–16 July 2008; pp. 1096–1103. [Google Scholar]
- Kelly, P.; Doherty, A.; Berry, E.; Hodges, S.; Batterham, A.M.; Foster, C. Can we use Digital Life-log Images to Investigate Active and Sedentary Travel Behaviour? Results from a Pilot Study. Int. J. Behav. Nutr. Phys. Act. 2011, 8, 44. [Google Scholar] [CrossRef] [Green Version]
- Yucel, G.; Cebi, S.; Hoege, B.; Ozok, A.F. A Fuzzy Risk Assessment Model for Hospital Information System Implementation. Expert Syst. Appl. 2012, 39, 1211–1218. [Google Scholar] [CrossRef]
- Raphael, B.J.; Dobson, J.R.; Oesper, L.; Vandin, F. Identifying Driver Mutations in Sequenced Cancer Genomes: Computational Approaches to Enable Precision Medicine. Genome Med. 2014, 6, 5. [Google Scholar] [CrossRef] [Green Version]
- Ajzen, I.; Joyce, N.; Sheikh, S.; Cote, N.G. Knowledge and the Prediction of Behavior: The Role of Information Accuracy in the Theory of Planned Behavior. Basic Appl. Soc. Psychol. 2011, 33, 101–117. [Google Scholar] [CrossRef]
- Nielson, J.L.; Paquette, J.; Liu, A.W.; Guandique, C.F.; Tovar, C.A.; Inoue, T.; Irvine, K.A.; Gensel, J.C.; Kloke, J.; Petrossian, T.C.; et al. Topological Data Analysis for Discovery in Preclinical Spinal Cord Injury and Traumatic Brain Injury. Nat. Commun. 2015, 6, 1–12. [Google Scholar] [CrossRef] [PubMed]
- Zhou, X.; Li, S.; Tang, F.; Qin, K.; Hu, S.; Liu, S. Deep Learning with Grouped Features for Spatial Spectral Classification of Hyperspectral Images. IEEE Geosci. Remote Sens. Lett. 2016, 14, 97–101. [Google Scholar] [CrossRef]
- Zhou, S.; Stumm, M.; Li, K.; Wortman, D. Heterogeneous Distributed Shared Memory. IEEE Trans. Parallel Distrib. Syst. 1992, 3, 540–554. [Google Scholar] [CrossRef]
- Xie, J.; Xu, L.; Chen, E. Image Denoising and Inpainting with Deep Neural Networks. In Proceedings of the Advances in Neural Information Processing Systems (NIPS 2012), Lake Tahoe, NV, USA, 3–6 December 2012; pp. 341–349. [Google Scholar]
- Smith, B.; Bjorstad, P.; Gropp, W. Domain Decomposition: Parallel Multilevel Methods for Elliptic Partial Differential Equations; Cambridge University Press: London, UK, 2004. [Google Scholar]
- Garets, D.; Davis, M. Electronic Medical Records vs. Electronic Health Records: Yes, there is a Difference. Policy White Pap. Chic. HIMSS Anal. 2006, 1–14. [Google Scholar]
- Rijsdijk, F.V.; Sham, P.C. Analytic Approaches to Twin Data using Structural Equation Models. Brief. Bioinform. 2002, 3, 119–133. [Google Scholar] [CrossRef] [PubMed]
- Bycroft, C.; Freeman, C.; Petkova, D.; Band, G.; Elliott, L.T.; Sharp, K.; Motyer, A.; Vukcevic, D.; Delaneau, O.; O’Connell, J.; et al. The UK Biobank Resource with Deep Phenotyping and Genomic Data. Nature 2018, 562, 203–209. [Google Scholar] [CrossRef] [PubMed] [Green Version]
- Joshi, P.; Kim, W.J.; Lee, S.A. The Effect of Dietary Antioxidant on the COPD Risk: The Community-based KoGES Cohort. Int. J. Chronic Obstr. Pulm. Dis. 2015, 10, 2159. [Google Scholar]
- Jeong, T. Deep Learning System and Methods Using Heterogeneous Data including Behavior Cognitive Data. Korea Patent 10-2019-0179141, 31 December 2019. [Google Scholar]
- Jacquemard, T.; Novitzky, P.; O’Brolcháin, F.; Smeaton, A.F.; Gordijn, B. Challenges and Opportunities of Lifelog Technologies: A Literature Review and Critical Analysis. Sci. Eng. Ethics 2014, 20, 379–409. [Google Scholar] [CrossRef] [Green Version]
- Lee, S.; Jeong, T. Forecasting Purpose Data Analysis and Methodology Comparison of Neural Model Perspective. Symmetry 2017, 9, 108. [Google Scholar] [CrossRef]
- Jia, F.; Lei, Y.; Lin, J.; Zhou, X.; Lu, N. Deep Neural Networks: A Promising Tool for Fault Characteristic Mining and Intelligent Diagnosis of Rotating Machinery with Massive Data. Mech. Syst. Signal Process. 2016, 72, 303–315. [Google Scholar] [CrossRef]
- Firpo, S.; Fortin, N.M.; Lemieux, T. Unconditional Quantile Regressions. Econometrica 2009, 77, 953–973. [Google Scholar]
- McKinney, W. Pandas: A Foundational Python Library for Data Analysis and Statistics. Python High Perform. Sci. Comput. 2011, 14, 1–9. [Google Scholar]
- Abadi, M.; Agarwal, A.; Barham, P.; Brevdo, E.; Chen, Z.; Citro, C.; Corrado, G.S.; Davis, A.; Dean, J.; Devin, M.; et al. Tensorflow: Large-scale Machine Learning on Heterogeneous Distributed Systems. arXiv 2016, arXiv:1603.04467. [Google Scholar]
- Perez, F.; Granger, B.E. Project Jupyter: Computational Narratives as the Engine of Collaborative Data Science. Retrieved Sept. 2015, 11, 108. [Google Scholar]
- Halevy, A.; Rajaraman, A.; Ordille, J. Data integration: The Teenage Years. In Proceedings of the 32nd International Conference on Very Large Data Bases, (VLDB’06), Seoul, Korea, 12–15 September 2006; pp. 9–16. [Google Scholar]
- Hassanzadeh, O.; Duan, S.; Fokoue, A.; Kementsietsidis, A.; Srinivas, K.; Ward, M.J. Helix: Online Enterprise Data Analytics. In Proceedings of the 20th International Conference Companion on World Wide Web, (WWW’11), Hyderabad, India, 28 March–1 April 2011; pp. 225–228. [Google Scholar]
- Kandel, S.; Paepcke, A.; Hellerstein, J.; Heer, J. Wrangler: Interactive Visual Specification of Data Transformation Scripts. In Proceedings of the SIGCHI Conference on Human Factors in Computing Systems, (CHI’11), Vancouver, BC, Canada, 7–12 May 2011; pp. 3363–3372. [Google Scholar]
- Song, J.; Liu, Y.; Shao, J.; Tang, C. A Dynamic Membership Data Aggregation (DMDA) Protocol for Smart Grid. IEEE Syst. J. 2020, 14, 900–908. [Google Scholar] [CrossRef]
- Li, X.; Zhu, Y.; Wang, J.; Liu, Z.; Liu, Y.; Zhang, M. On the Soundness and Security of Privacy-Preserving SVM for Outsourcing Data Classification. IEEE Trans. Dependable Secur. Comput. 2018, 15, 906–912. [Google Scholar] [CrossRef]
Figure 1.
Feature vector extraction procedure between input and output values of encoded and decoded deep neural networks.
Figure 1.
Feature vector extraction procedure between input and output values of encoded and decoded deep neural networks.

Figure 2.
Types of clinical data used as input values. (a) Clinical data obtained first in the experiment; the red box is the wearable device group; the blue is the group who did not wear a device (d + 0). (b) Clinical data acquired second in the experiment (d + 55); the red box is the wearable device group; the blue is the group who did not wear a device.

Figure 3.
Results of various surveys such as year, region, category, age group, race, etc., as medical questionnaire survey data.
Figure 3.
Results of various surveys such as year, region, category, age group, race, etc., as medical questionnaire survey data.

Figure 4.
Genomic epidemiologic research project, community-based cohort data (KOGES), expressed as symbols of symptoms for each ID.
Figure 4.
Genomic epidemiologic research project, community-based cohort data (KOGES), expressed as symbols of symptoms for each ID.

Figure 5.
Gene data: the resulting values that were analyzed by the sequencing procedure and displayed in the Human Genome Project.
Figure 5.
Gene data: the resulting values that were analyzed by the sequencing procedure and displayed in the Human Genome Project.

Figure 6.
Lifelog data: behavioral intelligence data, lifelog data for various behavioral studies.

Figure 7.
Feedback model: the first feedback model used as input into deep neural networks (first Y_prediction) and the second feedback model conditions and expected results (second Y_prediction).
Figure 7.
Feedback model: the first feedback model used as input into deep neural networks (first Y_prediction) and the second feedback model conditions and expected results (second Y_prediction).

Figure 8.
Four inputs and one output of the first feedback model, which are merged back into the inputs in the second feedback model.
Figure 8.
Four inputs and one output of the first feedback model, which are merged back into the inputs in the second feedback model.

Figure 9.
Data interpolation process using Denoise Auto Encoder. F (X′) = the cohort data are set as the input value X in phase 1 by the hypothesis of X, the clinical data generated in phase 2 are input as the input values and the extracted feature vector is applied.
Figure 9.
Data interpolation process using Denoise Auto Encoder. F (X′) = the cohort data are set as the input value X in phase 1 by the hypothesis of X, the clinical data generated in phase 2 are input as the input values and the extracted feature vector is applied.

Figure 10.
The output value of the first feedback model (first prediction) passes through the condition by acting as input together with the lifelog data in the second feedback. As a result, this shows the process of outputting the final second result from the classification model.
Figure 10.
The output value of the first feedback model (first prediction) passes through the condition by acting as input together with the lifelog data in the second feedback. As a result, this shows the process of outputting the final second result from the classification model.

Figure 11.
Hypertension disease classification accuracy per epoch (1000, 2000, 3000) of each model; (a) high blood pressure classification accuracy without restoring the missing values, (b) high blood pressure classification accuracy after restoring missing values through Denoise Auto Encoder (DAE) and the measurement of high blood pressure classification accuracy through the feedback model using DAE.

Figure 12.
Smoking rate of metabolic syndrome classification accuracy per epoch (1000, 2000, 3000) of (a) noise ratio 10 and (b) noise ratio 40 (associated with multi-layers 51 and 101, respectively). (a) Smoking rate of metabolic syndrome classification accuracy of noise ratio 10 with multi-layers 51 and 101. (b) Smoking rate of metabolic syndrome accuracy of noise level 40 with multi-layers 51 and 101.

© 2020 by the author. Licensee MDPI, Basel, Switzerland. This article is an open access article distributed under the terms and conditions of the Creative Commons Attribution (CC BY) license (http://creativecommons.org/licenses/by/4.0/).
Share and Cite
MDPI and ACS Style
Jeong, T. Deep Neural Network Algorithm Feedback Model with Behavioral Intelligence and Forecast Accuracy. Symmetry 2020, 12, 1465. https://doi.org/10.3390/sym12091465
AMA Style
Jeong T. Deep Neural Network Algorithm Feedback Model with Behavioral Intelligence and Forecast Accuracy. Symmetry. 2020; 12(9):1465. https://doi.org/10.3390/sym12091465
Chicago/Turabian StyleJeong, Taikyeong. 2020. "Deep Neural Network Algorithm Feedback Model with Behavioral Intelligence and Forecast Accuracy" Symmetry 12, no. 9: 1465. https://doi.org/10.3390/sym12091465
Note that from the first issue of 2016, this journal uses article numbers instead of page numbers. See further details here.