Article

Time Series Effect on Surface Deformation above Goaf Area with Multiple-Seam Mining

1
College of Safety and Environmental Engineering (College of Safety and Emergency Management), Shandong University of Science and Technology, Qingdao 266590, China
2
College of Resources, Shandong University of Science and Technology, Tai’an 271019, China
3
National Engineering Laboratory for Coalmine Backfilling Mining, Shandong University of Science and Technology, Tai’an 271019, China
4
State Key Laboratory of Mining Disaster Prevention and Control Co-Founded by Shandong Province and the Ministry of Science and Technology, Shandong University of Science and Technology, Qingdao 266590, China
5
Shandong Zhengyuan Construction Engineering Co., Ltd., Jinan 250000, China
6
Shandong Zhengyuan Geological Resource Exploration Co., Ltd., Jinan 250000, China
7
College of Civil Engineering and Architecture, Shandong University of Science and Technology, Qingdao 266590, China
*
Authors to whom correspondence should be addressed.
Symmetry 2020, 12(9), 1428; https://doi.org/10.3390/sym12091428
Submission received: 3 August 2020 / Revised: 23 August 2020 / Accepted: 24 August 2020 / Published: 28 August 2020
(This article belongs to the Special Issue Symmetry in Engineering Sciences Ⅲ)

Abstract

:
The surface subsidence caused by coal mining is a large area, and computer simulation is a fast and intuitive method, which can help us understand the macroscopic subsidence law. The mined-out area left over by coal mining is not disposed of appropriately for a long time. Thus, it can easily cause ground subsidence, collapse, or spot cracking, especially when mining multiple coal seams, which seriously restricts the construction and safety of the near-surface rock and soil layers. Based on the engineering background of five-layer coal mining in the Beibu Coal Mine of Laiwu City, a “Fast Lagrangian Analysis of Continua in 3D” numerical calculation model was established. The model was used to analyze the surface deformation indexes of four groups with different mining sequences in multiple coal seams, revealing the sequence effects of mining time on the surface deformation law in the goaf collapse areas, hence obtaining optimal mining sequences. The results showed that the four groups of mining sequences (including vertical settlement and horizontal deformation) have stable surface deformation centers, but the deformation ranges and amounts are quite different. The settlement deformation is the main difference. Mining sequence I has the largest deformation of 62.7 cm, followed by mining sequence III. Mining sequences II and IV are basically the same, at only 22% of the value of mining sequence 1. A multi-index analysis of the surface deformation curve including the inflection point, stagnation point, and slope showed that the larger the surface deformation, the more evident the change of the curve (concave or convex) and slope, the more uneven the foundation stress, the more severe the damage to the surface structures, and the less suitable the surface construction. Finally, upon analyzing the indicators of surface stability and adaptability, mining sequence IV was indicated as the optimal scheme. It is suggested that an optimal mining sequence should be appropriately selected before the mining of multiple coal seams. The research results can provide effective guidance for addressing surface deformations under similar geological conditions, and can provide scientific evaluations for the safety and stability of surface buildings and structures, leading to considerable economic and social benefits.

1. Introduction

As coal is the main component of China’s energy structure, intensive human activities are still required for underground mining. Influenced by geological technologies of deposits and their history, illegal and irregular mining has left a large number of mining areas that have not been safely managed. This has led to an increase in surface collapses and cracking of the mining areas, reduction in the utilization rate of the mining resources, restriction on the construction of the surface and near-surface rock layer in the mining area, and seriously affected production, lives, and social stability [1,2,3]. As an example, Figure 1 depicts a disaster situation in residential quarters on the surface above the goaf of the Beibu coal mine in Laiwu City, with cracks on the walls, and the foundations damaged to varying degrees. Figure 2 shows the cracks on the surface, damaged vegetation, and lowered groundwater level [4]. Thus, it is necessary to study the deformation law of the upper layer in the mining area, to reveal the effect of the influence law of the coal mining area on the deformation of the upper cover formation, to control or alleviate the deformation of the overlaid formation in the mining area, and to ensure the effective utilization of surface environment and resources in the mining area.
Aiming at the movement and deformation of mined-out subsidence areas and the corresponding hazards, experts worldwide have conducted significant research using various methods. They have found that the deformation of a mined-out area is significantly affected by factors such as the mining depth, mining method, stratum distribution, and mining range. Some results have been achieved. For example, around the year 1950, the Polish scholar Litwiniszyn studied surface subsidence, using a theory of random media. Later, domestic experts Liu Baochen and Liao Guohua developed a probability integral method that was widely used in the field of surface deformation (and prediction thereof) [5,6,7,8]. Traditional prediction methods include a typical curve method, section function method, and elastic thin plate theory, with an aim of researching and establishing a full-section prediction model, for, e.g., rock layers and surface subsidence [9,10,11]. Several studies (Guo, Qingbiao, Guo, Guang-li, Li, et al.) [12,13,14,15] have proposed related prediction models for predicting the surface subsidence law of a goaf. Liu, WT, et al. [16] established a mechanical calculation and analysis model for deep and thick coal seams, aiming to solve the practical problem of roof collapse in deep and thick coal seams. M. Svartsjaern, T. Villegas, et al. [17,18] have conducted on-site surveys of mine surfaces to explain the possible evolution paths of large-scale fracturing, e.g., in the lower and upper walls of the Kiirunavaara mine. Chen, BQ, et al. [19] proposed a new method for managing the large 3D surface displacement(s) caused by underground coal mining. Sun, YJ, et al. [20] proposed a prediction method for determining the movement of overburdened rock based on the key layer theory and Mohr-Coulomb failure criterion. Howladar, MF [21] used field surveys, questionnaire surveys, and laboratory tests to comprehensively analyze the impacts of coal mining on surface subsidence and the surrounding water environment. Xia Kaizong, Chen Congxin, Song Weidong, et al. [22,23] discussed a surface deformation law and related parameter analysis after the occurrence of a collapse, based on the monitoring results of rock movements in the western area of the Chengchao Iron Mine. Howladar, MF, Scigala, R, et al. [24,25] systematically analyzed factors directly or indirectly related to ground subsidence in goafs. Can, E, Gayarre, FL, et al. [26,27] studied the destruction characteristics and impacts on buildings around the subsidence area from the ground subsidence caused by underground mining. Zha, JF, Tong, LY, et al. [28,29] examined the deformation and destruction characteristics of the highways surrounding a mined-out area, and proposed relevant remedial measures. Most of the above research results focused on theoretical bases of ground subsidence after mining disturbances, or on the verification of the field conditions for small-scale mining in a single coal seam. However, the study of the surface deformation of the goaf of the working face under repeated mining conditions with multiple coal seams is less comprehensive. Fewer research studies on the surface deformation law(s) and comparisons of different mining time series; moreover, it is not easy to conduct the selection of an optimal mining time series on site.
In addition, a theoretical calculation has to consider many influencing factors, and it is easy to oversimplify the surface subsidence state, such as truly reflecting the actual state of movement. Although on-site measurements can accurately describe the ground settlement, the construction period is long, significant manpower and financial resources are consumed, and the process is difficult to control globally. Similar model tests can reduce the problem of scale representation, but the scale effect between small scale and engineering scale cannot be shown. Numerical simulations can be used to reduce the surface movements of the mined-out subsidence area at a 3D reduced engineering scale. It is easy to operate and repeat such tests, which is convenient for systematic research [30,31,32,33].
This study relies on the engineering background of the goaf subsidence area of the Beibu Coal Mine in Laiwu City, establishes a 3D spatial numerical model, develops the surface deformation regularities for different mining sequences of multiple coal seams, and reveals the timing effects of mining of the surface deformation regularities on the goaf subsidence area. The research results can effectively predict a surface deformation from corresponding geological conditions, and provide a scientific evaluation of the safety and stability of surface structures. Moreover, the results can provide reliable and accurate information for the treatment of goaf and surface construction and reduce the risk of surface construction on the goaf. This improves the mining efficiency and utilization rate of the ore body, and provides considerable economic and social benefits.

2. Engineering Background and Numerical Model Construction

2.1. Engineering Background

The Beibu Coal Mine is affiliated with the Laicheng District in Jinan City, Shandong Province. It contains 20 layers of coal, with a total thickness of 15.86 m. The layers 2, 4, 7, 15, and 19 are the five recoverable coal layers. In addition, the mining elevation is +137–350 m. The main coal seam of the coal mine comprises the layers of 2, 4 coal, and it has been exploited over a large area. The top and bottom of the coal seam are mainly siltstone, with a low compressive strength, high water absorption rate, and low softening coefficient. After the water absorption, the rock strength decreases greatly, the rock cohesion reduces, and the resistance to tensile and shear deformation becomes weak. The bottom plate has low stability. This study will mainly use the borehole data and exploration section of the Beibu coal mine as a background for analyzing the deformation and stability of the overlying strata in a mined-out area.

2.2. Numerical Model Building

According to the existing data, i.e., “Geological Report on Mine Closure in Beibu Coal Mine, Laiwu City, Shandong Province” and “Report on Mine Closure in Beibu Coal Mine, Laiwu City, Shandong Province”, the construction area on the mine ground is 1.5802 km2. For thin and fine coal seams, the size of the numerical model must be much larger than the influence range of the coal seam excavation considering the actual stratum occurrence status and characteristics of the goaf distribution. Therefore, the six boundary dimensions of the model are determined as follows: the upper boundary is bounded by a +200 m overburden (i.e., the surface, assuming the surface terrain is flat), the lower boundary is bounded by a −400 m rock layer, the distances of the left and right boundaries are 2.7 km each, and the distances of the front and rear boundaries are 3.6 km each. The goaf is evenly distributed in the middle area, and the cumulative area of the model is 9.72 km2; this ensures that the boundary of the study area is not affected when it is loaded, and ensures the accuracy of the numerical analysis.
Based on the mechanical properties of engineering materials obtained from geological data and laboratory tests in the coal mine, the constitutive model adopted in the numerical simulation is Mohr-coulomb model, which obeys the consolidation yield criterion of soil, and small deformation effect is used in the calculation process. The characteristics of the chosen model is that it can be simplified as a trilinear model (as shown in Figure 3), and the pre-peak area can be assumed as elastic deformation stage OA, and the post-peak area can be simplified as strain softening straight line AB and residual stress line BC. In this model, it is assumed that the stress state at any point of rock falls on the Mohr’s stress circle after the strength exceeding its peak stress, the Mohr Coulomb strength criterion can be satisfied as follows.
f = σ 1 1 + sin φ 1 sin φ σ 3 + 2 c 1 + sin φ 1 sin φ
where c and φ denote the cohesion and internal friction angle of the rock.
The establishment and meshing of this numerical model are completed with the help of ANSYS finite element software, and the conversion interface program between ANSYS and FLAC3D is used to import the model into FLAC3D for calculation. Then, the results of various formats including nephogram, vector map, curve, data and animation can be output, through the powerful image and text post-processing function of FLAC3D. The model is divided into 113,436 cells and 124,764 cell nodes, and the coordinates of the real inflection points are converted into model coordinates, as shown in Table 1. Six boundary surfaces are defined in the model; the upper boundary surface is the surface with free interface (research object), and the front, rear, left, right, and lower boundary surfaces are fixed boundary surfaces. As the area of the geometric model is much larger than that of mining area, the side and bottom boundaries of the model are set to a zero displacement field and zero velocity field, as shown in Figure 4. The initial stress field is generated according to the self-weight stress field, and the acceleration from gravity is −9.8 m/s2. The loading method only considers the self-weight of each layer, and the effect of force is not considered in other directions. As the numerical model has a large buried depth, the ground load can be ignored, i.e., the upper surface of the model is a free surface, and is not subjected to loading effects and constraints [35,36,37].
The formation parameters used in the model are taken from the test report of a rock mechanical property test conducted by Shandong Tai’an Haotai Construction Engineering Quality Inspection Co., Ltd. Table 2 lists the physical and mechanical parameters of the formation, from top to bottom.

3. Analysis of Mining Time Series Effect on Ground Deformation Law in Goaf Collapse Area of Multiple Coal Seams

3.1. Determination of Different Mining Sequence Models

To study the influence law of the mining sequence of the 5th coal seam on the surface deformation(s) in the Beibu Coal Mine, the mining sequences of the 5th coal seam were changed in the numerical model and an influence law was developed for the surface deformation to reveal the effect of mining time sequence on the surface deformation of the multi-seam goaf collapse area. Table 3 shows four different mining sequence simulation schemes (mining sequence I is the actual mining sequence of the Beibu Coal Mine).

3.2. Analysis of the Results of Mining Timing Effects on the Law of Ground Deformation

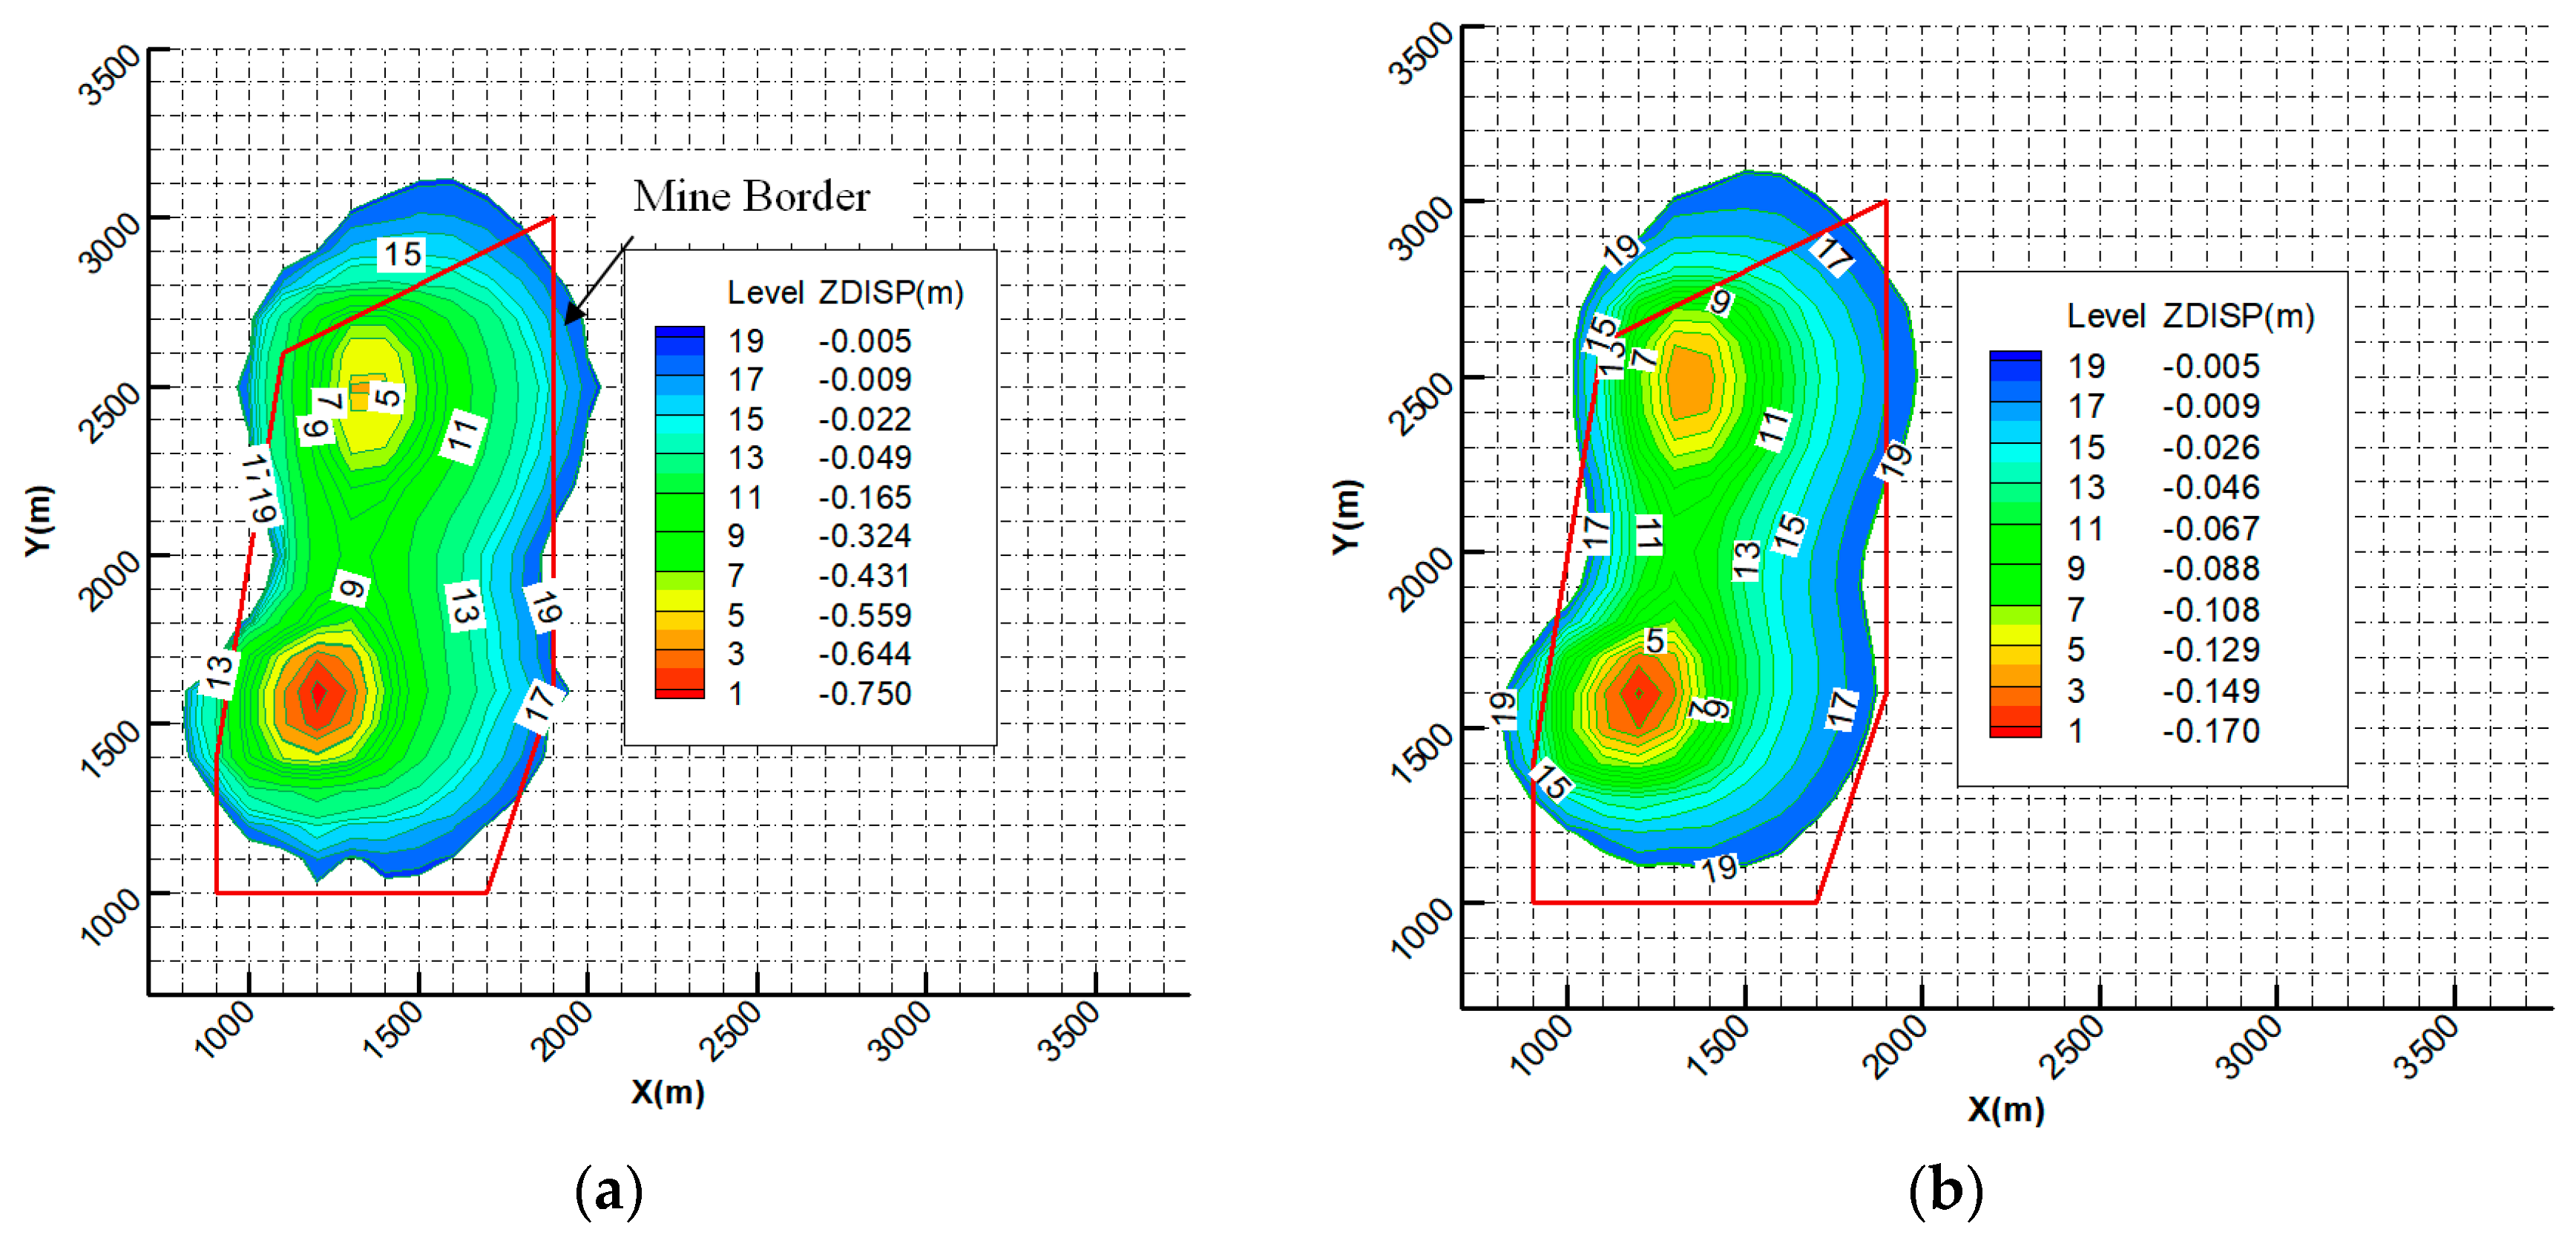
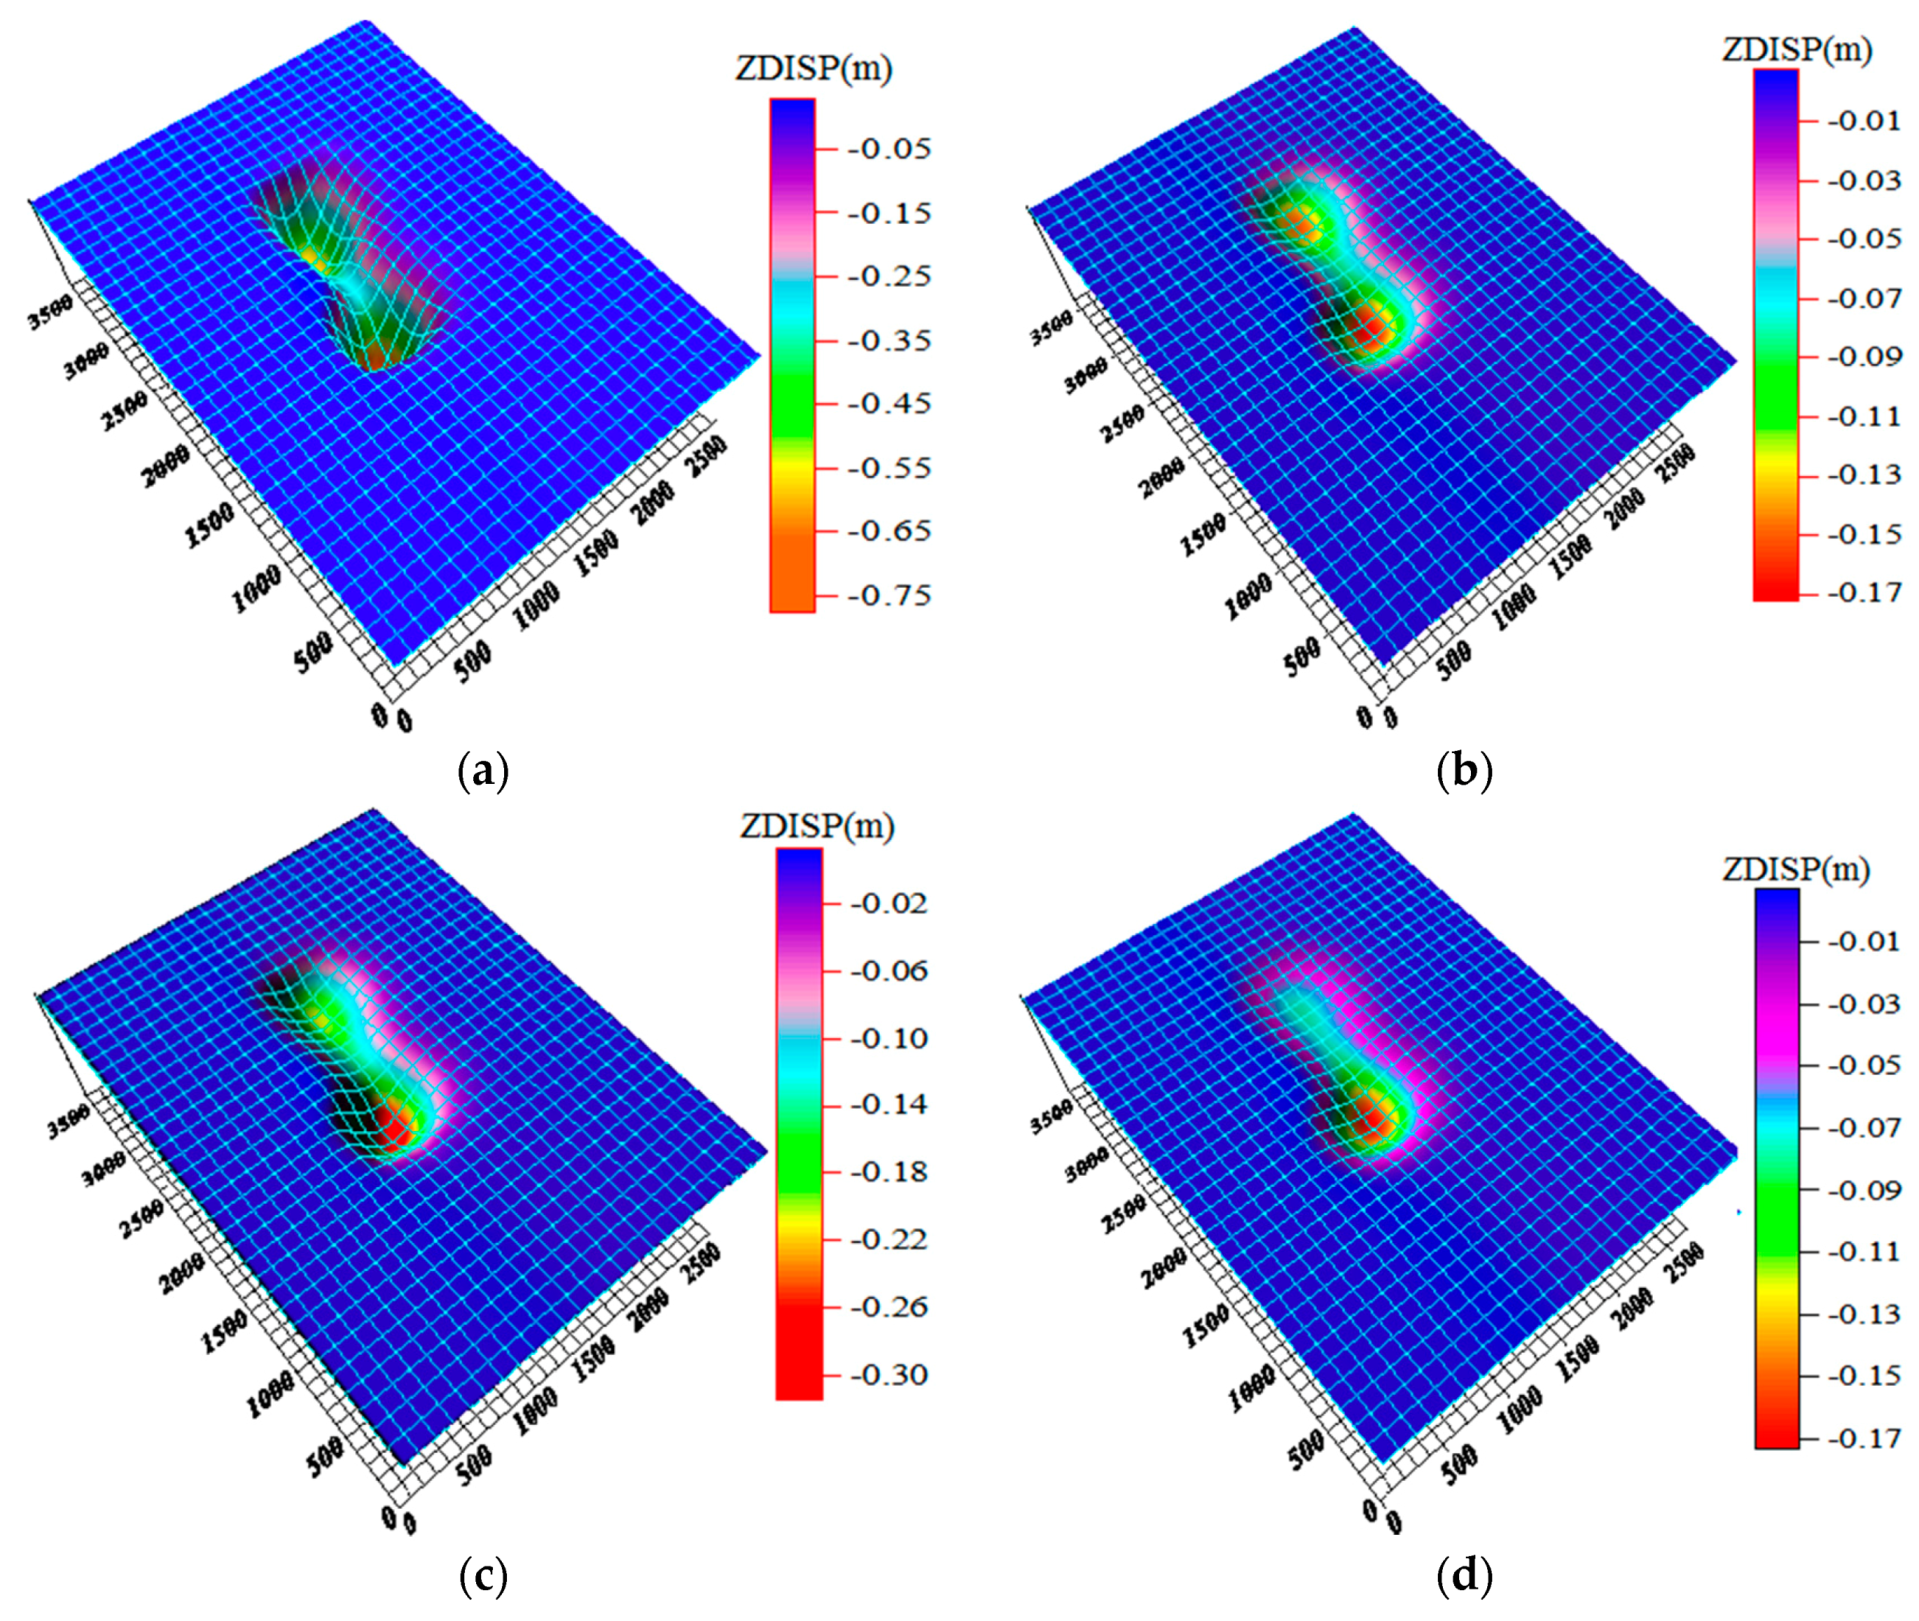
3.2.1. Deformation Contour Map Description

(1)
Analysis of monitoring results of vertical ground settlement
By monitoring the vertical settlement displacement of the surface in the four mining sequences and plotting their settlement patterns, a contour map can be constructed, as shown in Figure 5.
It can be seen from Figure 5a that the average total thickness of the five layers of coal is approximately 700 cm (mining elevation is +150–350 m), and the maximum surface subsidence after mining is 77.6 cm, accounting for 11.09% of the total thickness of the coal seam. The center coordinates of the subsidence are (X1200 Y1600 Z208), corresponding to the real geographic coordinates (X4010500 Y20559200). Another set of large surface subsidence center coordinates are (X1350 Y2500 Z208), also corresponding to the real geographic coordinates (X4011400 Y20559350). The subsidence value is approximately 62.7 cm. The surface impact area is formed by the two subsidence centers diverging to the surroundings. Simultaneously, the surface subsidence is evenly distributed inside the mine boundary. It develops rapidly in the northern part of the mine boundary with a wide distribution area of approximately 130 m beyond the mine boundary.
Comparing Figure 5b–d with Figure 5a reveals that the geographic location of the surface subsidence center remains basically the same, but the distribution range of the affected surface area is reduced. The maximum settlement values are 16.2, 30.1, and 17.3 cm, corresponding to the mining sequence. The highest values, i.e., 22.19, 40.503, and 22.301% in sequence I, indicate that the latter three sequences have significantly weaker surface subsidence behaviors than the former, and can alleviate the surface subsidence to a certain extent. However, the three sequences have different degrees of impact on the relief of the surface subsidence behavior. Among them, the mining sequences II and IV have the highest relief and are basically the same, whereas the relief in sequence III is the smallest. Although the possibility of surface collapse can be reduced, it is still necessary to pay attention to the reinforcement and supplement of the surface. Therefore, from the perspective of the vertical settlement of the ground surface, sequences II and IV can be selected for coal mining.
By extracting the ground subsidence data of the four mining sequences at different excavation stages, they can be drawn into a curve to quantitatively describe the vertical subsidence law of the surface, as shown in Figure 6.
It can be seen that the vertical subsidence laws of the different mining sequences are quite different. Among them, the maximum vertical settlement decreases in the order of I-III-IV-II; the surface settlement in mining sequence I is the largest, and those of mining sequences II and IV (from bottom to top) are the smallest, and basically the same. In addition, the mining subsidence sequence I causes the fastest growth rate of surface subsidence, whereas the surface subsidence caused by other mining sequences increases relatively slowly; this indicates that mining sequence I has the strongest disturbance to the surface. Therefore, it is recommended to use methods II and IV for coal seam mining. If method I is used, special attention should be paid to strengthening the surface reinforcements.
(2)
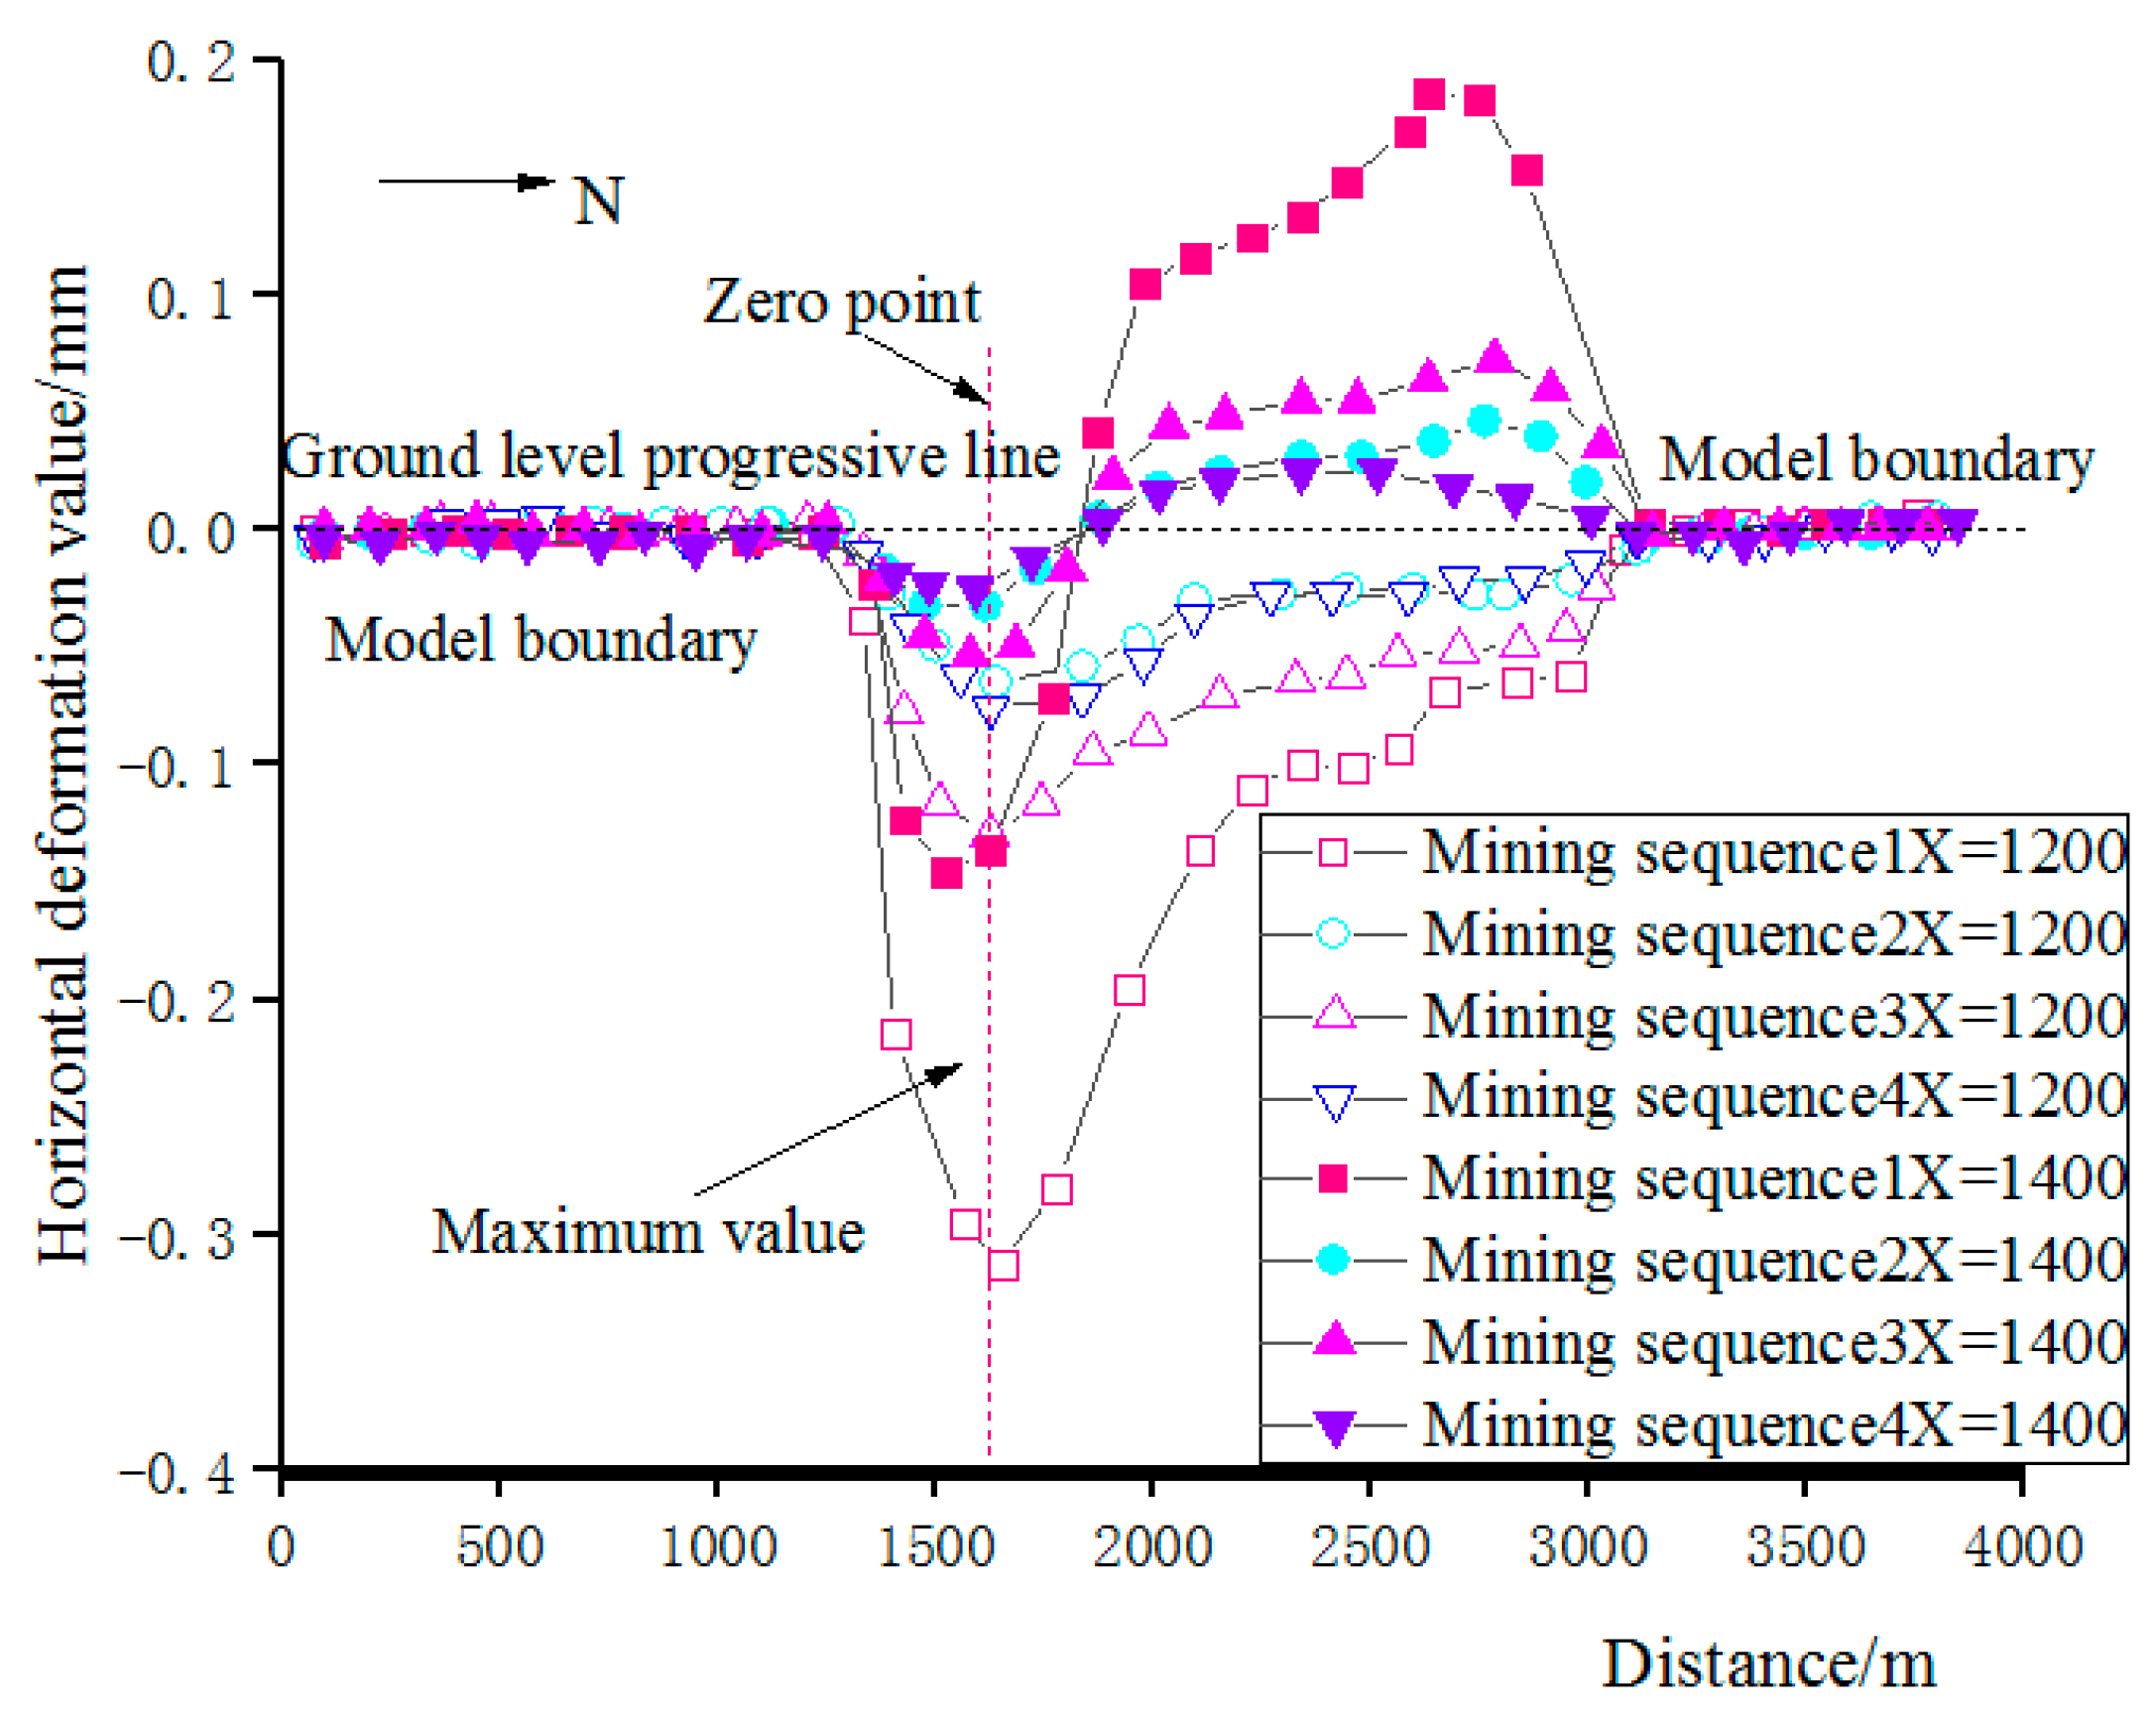
Analysis of monitoring results of horizontal surface deformation
The “Fast Lagrangian Analysis of Continua in 3D” (FLAC3D) self-edited Fish language is used to monitor the maximum deformation and coordinates of the output surface in the X and Y directions, as shown in Table 4.
It can be seen that the coordinates of the horizontal deformation in the X and Y directions in the goafs of the different mining sequences are all located inside the mining boundary, and are concentrated. The surface deformation of mining sequence I is the largest (the two-way deformation values are 31.6 and 17.7 cm, respectively), whereas the horizontal deformations of mining sequences II and IV are basically the same and the smallest, similar to the vertical settlement characteristics. Their values are 6.5, 4.4, 6.9, and 4.6 cm, respectively. In addition, the horizontal deformation of the X direction surface is greater than that of the Y direction surface, but with an increase in the distance between the first and second coal seams from the surface, the horizontal deformation values in the two directions gradually become closer, indicating that the degrees of surface horizontal deformation in the different mining sequences are very different.

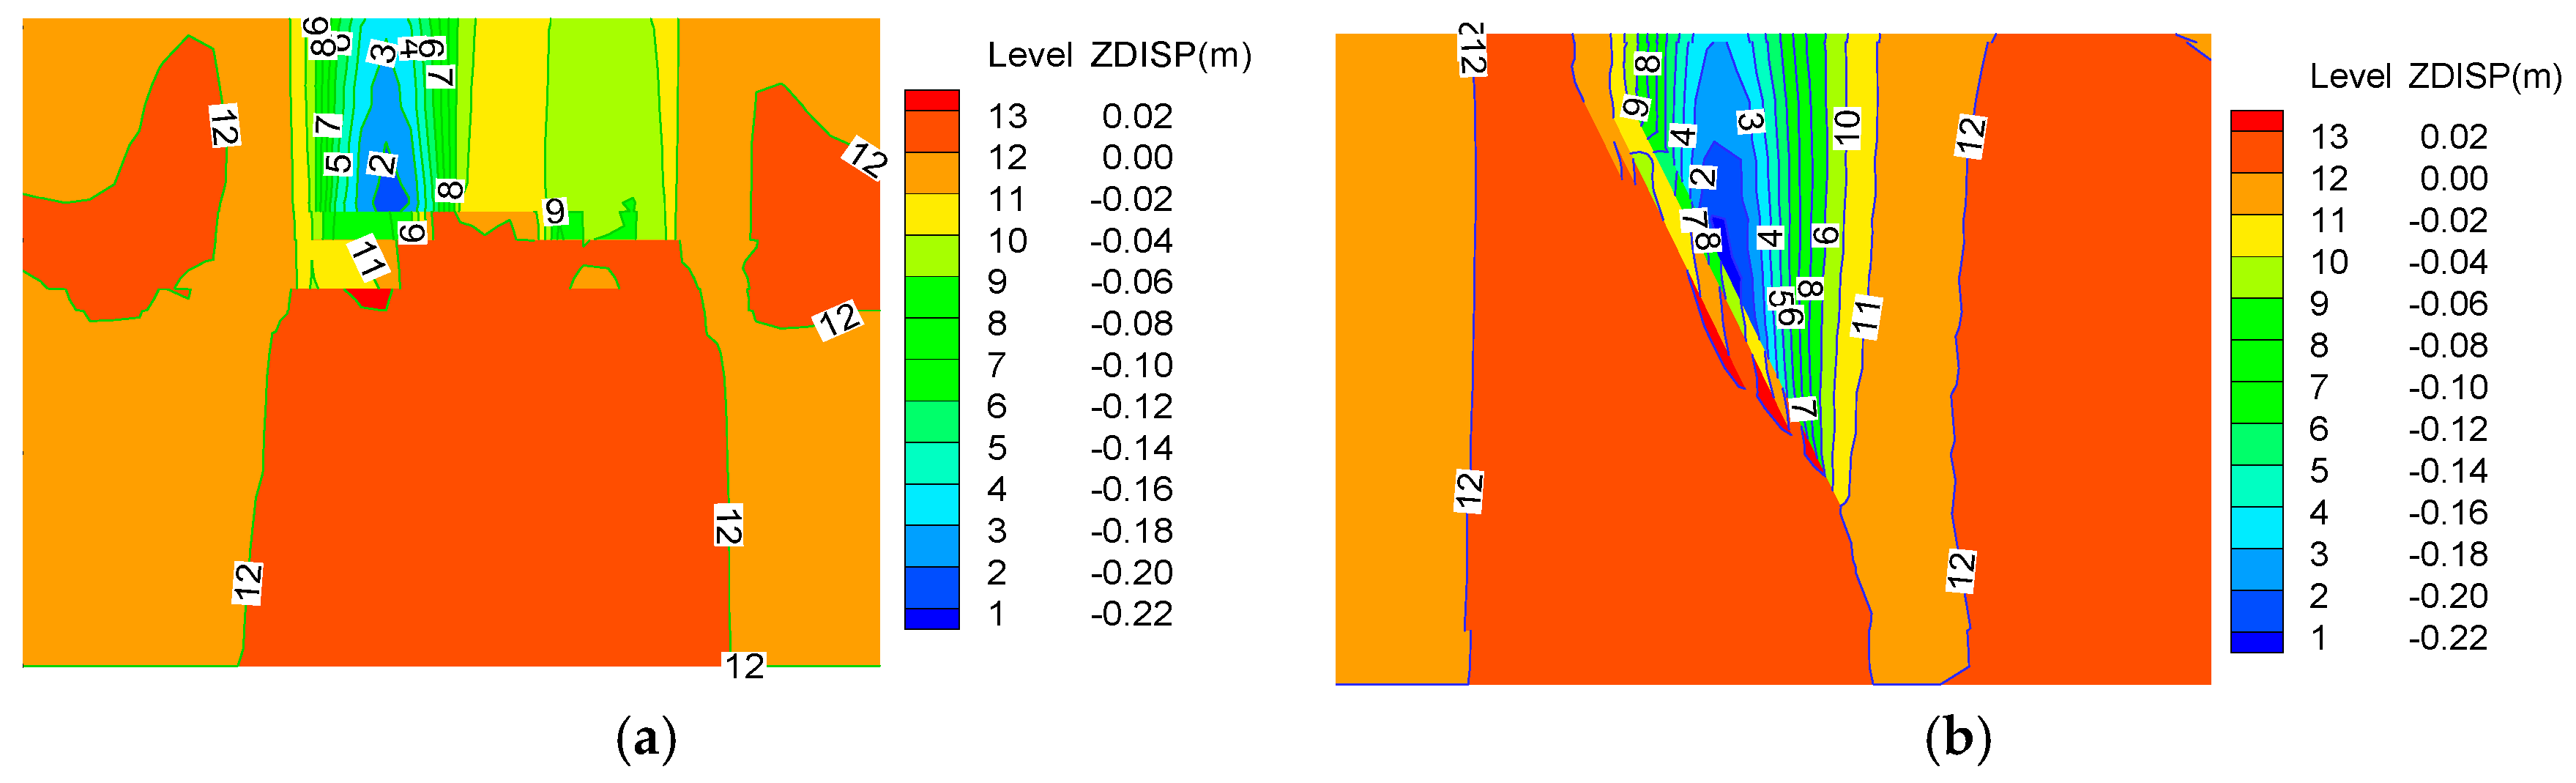
3.2.2. Analysis of Deformation Law of Near-Surface Deep Cover Rock in Goaf

The above analysis indicates that the surface damage is generally caused by vertical settlement. Therefore, the cross-section and vertical cross-section of the maximum settlement point of the surface are taken as the research object, and the representative goaf sections (X = 1200 and Y = 1600) are selected. The effect of influence laws of the above four different mining sequences on surface settlement and deformation are analyzed. Notably, the contour discontinuity in the figures is caused by the blockage of the goaf.
It can be seen from Figure 7, Figure 8, Figure 9 and Figure 10 that the maximum settlement of the strata occurs in the roof strata under the four different mining sequence conditions, and the maximum settlement gradually decreases with an increase in the depth of the first coal seam burial. However, the influence range of the settlement varies greatly. For example, it can be seen from Figure 7 that the angle between the outermost settlement contour of mining sequence I and surface level (quaternary soil bottom) is nearly perpendicular, with an impact range of approximately 1100–2900 m, whereas the contour of Y to the left is at a 45° angle to the surface, the contour of Y to the right is at a 79° angle to the surface, and the influence range is approximately 820–1980 m. For mining sequences II–III, the angles between the left X-line contour and surface are 83°, 87°, and 87°, respectively, and the angle on the right is nearly vertical; the impact ranges are 1240–3000 m, 1100–3000 m, and 1120–3000 m, respectively. The angles between the contour line on the left of Y and surface for sequences II–III are 60°, 40°, and 50°, respectively, and those on the right are 78°, 71°, and 78°, respectively. The influence ranges are 815–1960 m, 820–1970 m, and 810–1970 m, respectively. Therefore, when an actual infrastructure project undermines the mined-out area, the impact area of the contact surface between the rock layer and soil layer should be fully considered, and timely measures should be adopted, according to local conditions.
In addition, if the stratum is uniform, the settlement contours are basically in smooth contact; however, when the stratum is in contact with the soil layer (Z = 200 m elevation, quaternary soil thickness of 8 m), an inflection point appears. The contour is slightly convex, and its horizontal angle with the rock layer decreases. At this time, it can be considered that the thicker the quaternary topsoil layer, the greater the influence of the goaf on the surface. This conclusion is consistent with the regularity of the effects of the rock and soil rock displacement angles on ground deformations in actual engineering.

3.2.3. Analysis of “S” Curve of Surface Subsidence Deformation Index of Typical Section

The profile of the largest settlement point on the surface of the mined-out area is selected (i.e., the X = 1200 and Y = 1600 bidirectional profiles), and the slope and curvature changes of the settlement curve are analyzed, along with the distributions of stagnation points and inflection points across the maximum settlement point of the surface.
It can be seen that the shapes of the surface deformation at the same slice position in different mining sequences are similar, but the differences in the subsidence range are large, and the surface deformation characteristics at different slice positions are different. As shown in Figure 11a, the surface subsidence curve of the four mining sequences at the profile X = 1200 is in the form of a “double valley,” and the surface is basically in a sag state (the sag is mainly above the goaf). There are also some uplifts, but the maximum uplift is only 1.39 × 10⁻⁴ cm; in contrast, the surface subsidence curve at the section Y = 1600 is in the form of a conventional “single valley,” with the ground depression as the main part, and the maximum surface uplift is only 5.4 × 10⁻⁴ cm.
Figure 11 shows that there are many inflection points in the settlement curve. The inflection points represent changes in the unevenness of the surface settlement curve, leading to a loss of support for the base of the ground structure, and to damage caused by gravity bending. The more evident the unevenness of the curve on both sides of the inflection point, the more severe the damage to the building, especially in regards to damage to the foundations of high-rigidity buildings.
It can be seen from analysis of the slope change of the ground subsidence curve that the slope of the curve on both sides of the stagnation point can easily cause the upper building to tilt, especially for buildings with small base areas and high upper parts. However, a local load (maximum value) or zero stress point (minimum value) may appear in the middle of the building base directly above the stagnation point, resulting in an uneven load on the bottom surface of the foundation. In such a case, the foundation cannot fully exert its bearing capacity; such conditions can easily induce local instability.

3.2.4. Analysis of “S” Curve of Horizontal Deformation Index of Typical Section

The horizontal surface deformation caused by the goaf mainly includes the horizontal displacement and horizontal strain. The horizontal displacement is an indicator of the degree of the surface rock movement, and the horizontal strain is an indicator of the speed of the surface rock movement. Under different construction sequences, the degrees of horizontal deformation caused by the ground are also different, and the corresponding coordinates of the maximum horizontal deformation positions are also different. To provide a sharp contrast to the horizontal deformation caused by each mining sequence, the deformation curves along the X and Y directions of the sections at X = 1200 and X = 1400 are respectively plotted.
Figure 12 depicts the horizontal deformation characteristics along X = 1200 and X = 1400 for the different mining sequences. At X = 1200 m (the western part of the mining boundary), there is a clear “0” point on the horizontal displacement of the surface. The horizontal displacements on both sides of this point are different, and the building foundation above it will be affected by the frictional resistance between the center and the edge. At X = 1400 m (near the eastern part of the mining boundary), there is no evident “0” point in the horizontal displacement of the surface. The displacement direction of the surface soil layer or rock layer is the same, and the building foundation will be subject to friction resistance in a single direction. In addition, the horizontal distribution of the horizontal surface displacement comprises not only compressive deformation, but also tensile deformation, as characterized by the slope of the curve. The positive value of the slope indicates the surface tensile deformation, and the negative value indicates the compression deformation. Thus, the mine surface mainly undergoes compressive deformation. The surface near the mine boundary is dominated by tensile deformation. The greater the slope, the more severe the surface deformation, and the greater the impact on the suitability of surface construction.

3.2.5. D Effect Reduction and Optimization of Mining Order in Goaf Surface Subsidence Area

The FLAC3D numerical model is imported into tecplot10 post-processing software using the Fish language. The data is written into Surfer to draw a 3D rendering of the surface collapse of the goaf as shown in Figure 13, so as to reflect the vertical deformation characteristics of the different mining sequences.
In the figure, the degree of grid distortion indicates the degree of formation deformation; the growth of the grid indicates the extension of the formation; and the decrease of the grid indicates the formation compression. It can be seen that the deformation of the ground collapse is quite different under different mining conditions. The specific performance is as follows:
(1)
As the depth of the first coal seam increases, the surface collapse gradually slows down. If the first coal seam is deep enough or overlies a hard rock layer, the surface collapse deformation may not extend to the surface, and the surface may be less (or not) affected by the goaf. However, if the first coal seam is shallow and the mechanical properties of the overlying rock layer are poor, it may cause significant deformation of the surface, such that the degree of cell grid distortion is greater, and the peak of the surface collapse is higher.
(2)
When the first coal seam is the same, the degree of ground subsidence is determined using the secondary coal seam. After the first coal seam is mined, the overburden moves, and the mechanical properties are reduced. The secondary coal seam mining is disturbed again, and the deformation of the overburden is intensified. Therefore, if the secondary coal seam is closer to the surface, the degree of surface collapse is more evident.
(3)
The four types of mining sequences cause large differences in the surface subsidence deformation. Nevertheless, comprehensively considering the indicators that characterize the stability and suitability of the surface (horizontal deformation indicators (displacement and slope) and vertical deformation indicators (settlement, slope, and curvature)), order IV is determined to be the best order. Simultaneously, it is considered that the mining sequence IV takes “7 coal” as the first coal seam. This can avoid the long construction period for the roadway, lack of output, and low mechanical operation efficiency, and can ensure a high utilization rate of the coal seam in the mining area. However, actual coal mines often adopt mining sequence I, which is considered to be the most unfavorable for the control of surface stability. Therefore, it is recommended that mine engineers comprehensively consider the actual stratum and mining factors and formulate and compare a variety of mining schemes, so as to obtain the optimal mining order.

4. Conclusions

Based on the engineering background of five-layer coal mining in the Beibu Coal Mine in Laiwu City, this study conducted tests on four sets of numerical models for the mining sequences of different coal seams, analyzed the surface deformation laws of different mining sequences, and obtained the optimal mining sequence for multiple coal seams. The main conclusions are as follows:
(1)
The center position of the surface deformation (vertical settlement and horizontal deformation) of the four groups of mining sequences is stable, but the deformation ranges and amounts are quite different; however, the settlement deformation is the main difference. Among them, the deformation of mining sequence I is the largest at 62.7 cm. Mining sequences 2 and 4 are basically the same, at only 22% of the value of mining sequence I.
(2)
An analysis of multiple indicators (inflection point, stagnation point, and slope) of the surface deformation curve shows that the greater the surface deformation, the more evident the curve unevenness and slope change; the greater the unevenness of the foundation stress, the more severe the damage to the surface structure, and the worse suitability for surface construction.
(3)
As the depth of the first coal seam increases, the surface settlement gradually slows down. If the first coal seam is deep enough or overlies a hard rock layer, the mined-out area will have little or no impact on the surface settlement and deformation. However, if the first coal seam is shallow and/or the mechanical properties of the overlying rock layer are poor, it may result in significant surface deformation.
(4)
When the first coal seam is the same, the ground subsidence is determined by the secondary coal seam. After the first coal seam is mined, the overburden moves, and the mechanical properties are reduced. The secondary coal seam mining disturbs the overburden again, which intensifies the deformation of the overburden, causing the degree of the ground subsidence to be more evident.
(5)
Based on comprehensively considering the indicators that characterize the stability and suitability of the ground, mining sequence IV is considered as the optimal solution. It is recommended to make a rational choice of sequence before multi-seam mining, or to replace a less-effective sequence with the optimal mining sequence in time. This can not only avoid or overcome the long construction period for the roadway, lack of output, and low mechanical operation efficiency, but can also ensure a high utilization rate of the coal seam in the mining area.
The research results can provide effective guidance for surface deformations under similar geological conditions, can help provide scientific evaluations on the surface construction, safety, and stability of structures, which would provide considerable economic and social benefits.

Author Contributions

Conceptualization, Z.S. and Q.W.; methodology, P.W.; investigation, D.H. and Y.B.; data curation, H.Y. All authors have read and agreed to the published version of the manuscript.

Funding

This research was funded by the National Natural Science Foundation of China (NSFC) (No. 51778351 and 51804182), SDUST Research Fund (No. 2018TDJH101), Second Batch of Cooperative Education Projects of Ministry of Education in 2019 (No. 201902153001), Shandong Provincial Natural Science Foundation (No. ZR2019BEE065), Key R & D plan of Shandong Province (No. 2019SDZY034-1).

Conflicts of Interest

The authors declare no conflict of interest.

References

  1. Zhuhe, X.; Runsheng, Z.; Wenrui, H.; Xiaobin, L. Subsidence model of large working face in shallow buried coal seam with thick loose layer. J. Min. Saf. Eng. 2020, 37, 264–271. [Google Scholar]
  2. Wang, P.; Jiang, L.; Zheng, P.; Qin, G.; Zhang, C. Inducing mode analysis of rock burst in fault-affected zone with a hard-thick stratum occurrence. Environ. Earth Sci. 2019, 78, 467. [Google Scholar] [CrossRef]
  3. Wang, P.; Jia, H.; Zheng, P. Sensitivity Analysis of Bursting Liability for Different Coal-rock Combinations Based on Their Inhomogeneous Characteristics. Geomatics. Nat. Hazards Risk 2020, 11, 149–159. [Google Scholar] [CrossRef] [Green Version]
  4. He, D.L. Study of Deformation Regularity of Overlying Strata in Goaf under Different Mining Time (Spatial) Sequence Based on FLAC3D; Shandong University: Jinan, China, 2018. [Google Scholar]
  5. Baochen, L.; Guohua, L. Basic Law of Coal Mine Surface Movement; China Industry Press: Beijing, China, 1965; pp. 87–89. [Google Scholar]
  6. Yixuan, L.; Zhihai, G.; Junkai, Y.; Zhenyin, D.; Jiuli, C. Subsidence extraction model of mining area with probability integral method based on SBAS technology. Coal Sci. Technol. 2017, 45, 156–161. [Google Scholar]
  7. Xiaodong, Z.; Yang, C.; Jian, J. Probability integral method of arbitrary shape face to predict mining subsidence and its application. Rock Soil Mech. 2016, 37, 3387–3392. [Google Scholar]
  8. Hefang, B.; Huachao, Y.; Shubi, Z. Research on intelligent optimization for predicting parameters of probability-integral method. J. Min. Saf. Eng. 2013, 30, 385–389. [Google Scholar]
  9. Xiaogangand, X.; Qingxiang, H. Prediction model for surface subsidence by elastic stab. Eng. Surv. Mapp. 2008, 17, 9–12. [Google Scholar]
  10. Wenbing, G.; Erhu, B.; Gaobo, Z. Current status and progress on overburden and surface damage and prevention technology of high-intensity mining. J. China Coal Soc. 2020, 45, 509–523. [Google Scholar]
  11. Suping, P.; Yinli, B. Strategic consideration and core technology about environmental ecological restoration in coal mine areas in the Yellow River basin of China. J. China Coal Soc 2020, 45, 1211–1221. [Google Scholar]
  12. Guo, Q.; Guo, G.; Lv, X.; Zhang, W.; Lin, Y.; Qin, S. Strata movement and surface subsidence prediction model of dense solid backfilling mining. Environ. Earth Sci. 2016, 75, 1426. [Google Scholar] [CrossRef]
  13. Guo, G.; Zhu, X.; Zha, J.; Wang, Q. Subsidence prediction method based on equivalent mining height theory for solid backfilling mining. Trans. Nonferr. Metals Soc. China 2014, 24, 3302–3308. [Google Scholar] [CrossRef]
  14. Li, H.; Zhao, B.; Guo, G.; Zha, J.; Bi, J. The influence of an abandoned goaf on surface subsidence in an adjacent working coal face: A prediction method. Bull. Eng. Geol. Environ. 2018, 77, 305–315. [Google Scholar] [CrossRef]
  15. Guney, A.; Gul, M. Analysis of surface subsidence due to longwall mining under weak geological conditions: Turgut basin of Yatagan-Mugla (Turkey) case study. Int. J. Min. Reclam. Environ. 2019, 33, 445–461. [Google Scholar] [CrossRef]
  16. Liu, W.; Pang, L.; Xu, B.; Sun, X. Study on overburden failure characteristics in deep thick loose seam and thick coal seam mining. Geomat. Nat. Haz. Risk 2020, 11, 632–653. [Google Scholar] [CrossRef]
  17. Svartsjaern, M.; Saiang, D.; Nordlund, E.; Eitzenberger, A. Conceptual Numerical Modeling of Large-Scale Footwall Behavior at the Kiirunavaara Mine, and Implications for Deformation Monitoring. Rock Mech. Rock Eng. 2016, 49, 943–960. [Google Scholar] [CrossRef] [Green Version]
  18. Villegas, T.; Nordlund, E. Time-Dependent movements of the hangingwall at the Kiirunavaara mine. Int. J. Min. Reclam. Environ. 2012, 26, 119–133. [Google Scholar] [CrossRef] [Green Version]
  19. Chen, B.; Li, Z.; Yu, C.; Fairbairn, D.; Kang, J.; Hu, J.; Liang, L. Three-Dimensional time-varying large surface displacements in coal exploiting areas revealed through integration of SAR pixel offset measurements and mining subsidence model. Remote Sens. Environ. 2020, 240, 111663. [Google Scholar] [CrossRef]
  20. Sun, Y.; Zuo, J.; Karakus, M.; Wen, J. A Novel Method for Predicting Movement and Damage of Overburden Caused by Shallow Coal Mining. Rock Mech. Rock Eng. 2020, 53, 1545–1563. [Google Scholar] [CrossRef]
  21. Howladar, M.F. Coal mining impacts on water environs around the Barapukuria coal mining area, Dinajpur, Bangladesh. Environ. Earth Sci. 2012, 70, 215–226. [Google Scholar] [CrossRef]
  22. Kaizong, X.; Congxin, C.; Youyou, X.; Yuanbin, D.; Hu, F.; Yangyang, D. Analysis of influence of structural planes on surface deformation in western area of Chengchao Iron Mine. Rock Soil Mech. 2015, 36, 1389–1396. [Google Scholar]
  23. Chen, C.X.; Xiao, G.F.; Huang, P.L. Cheng Chao Iron Mine West Joint Survey and Rock Mass Mechanical Parameter Test; Wuhan Institute of Rock and Soil Mechanics, Chinese Academy of Sciences: Wuhan, China, 2014. [Google Scholar]
  24. Howladar, M.; Hasan, K. A study on the development of subsidence due to the extraction of 1203 slice with its associated factors around Barapukuria underground coal mining industrial area, Dinajpur, Bangladesh. Environ. Earth Sci. 2014, 72, 3699–3713. [Google Scholar] [CrossRef]
  25. Scigala, R.; Szafulera, K. Linear discontinuous deformations created on the surface as an effect of underground mining and local geological conditions-case study. Bull. Eng. Geol. Environ. 2020, 79, 2059–2068. [Google Scholar] [CrossRef]
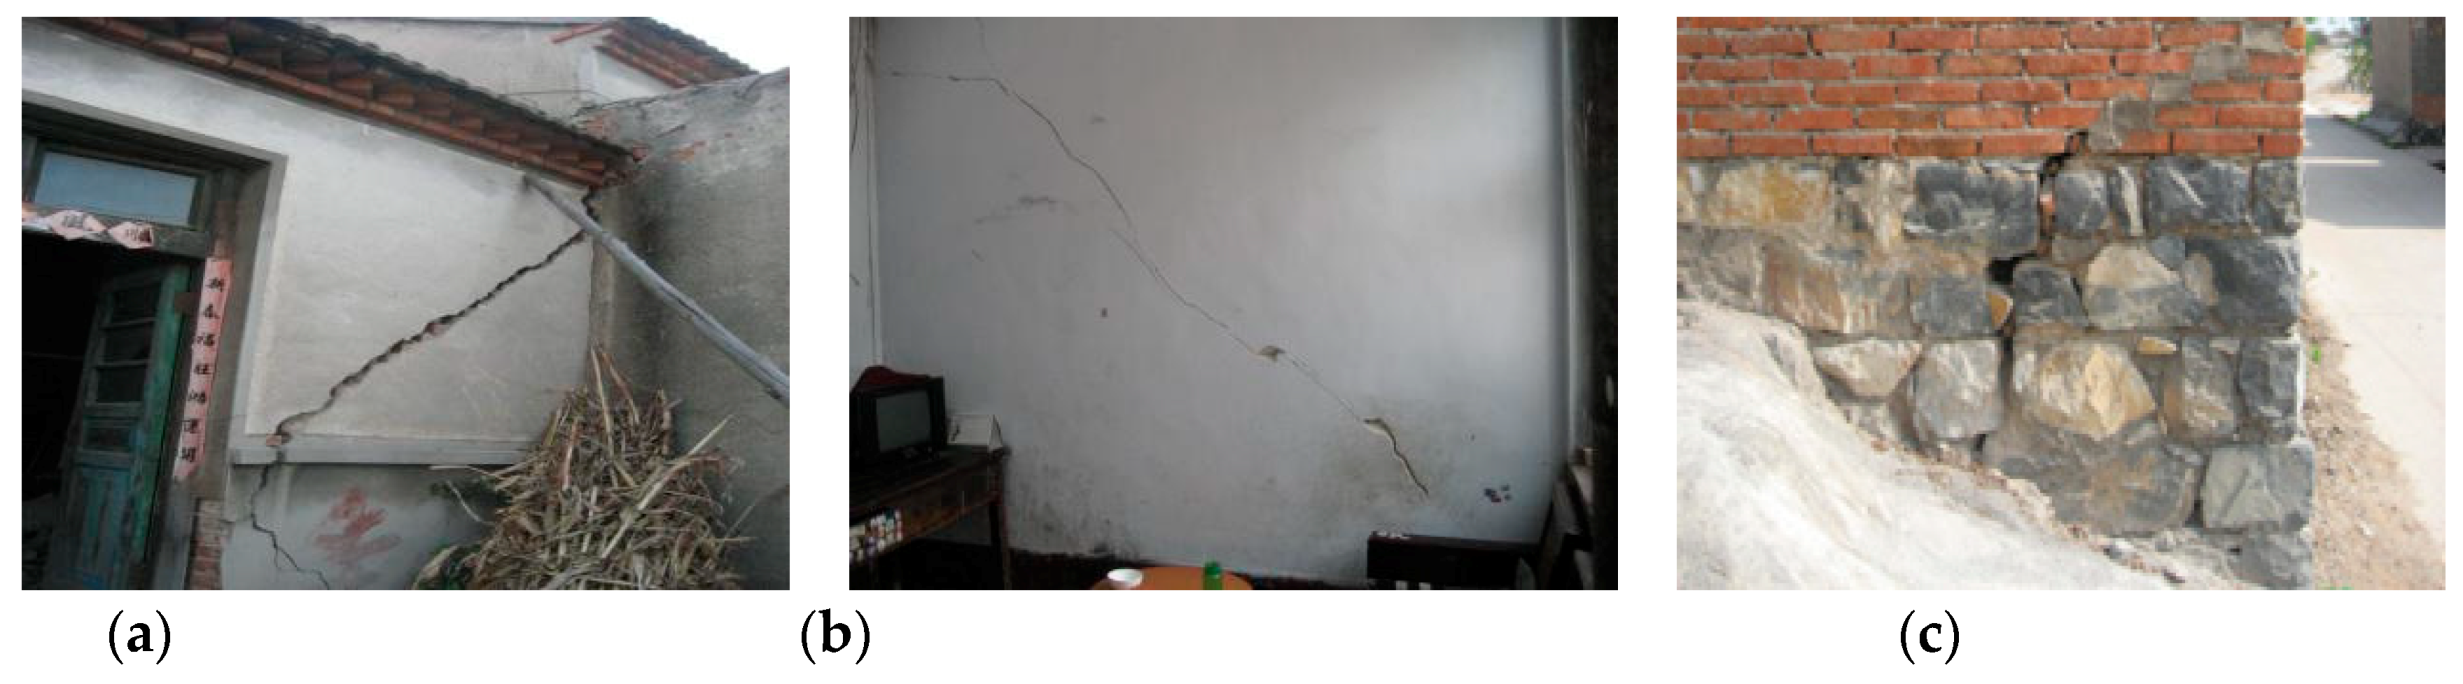
  26. Can, E.; Kuscu, S.; Kartal, M. Effects of mining subsidence on masonry buildings in Zonguldak hard coal region in Turkey. Environ. Earth Sci. 2012, 66, 2503–2518. [Google Scholar] [CrossRef]
  27. Lopez-Gayarre, F.; Alvarez-Fernandez, M.; Gonzalez-Nicieza, C.; Alvarez-Vigil, A.; Herrera-Garcia, G. Forensic analysis of buildings affected by mining subsidence. Eng. Fail. Anal. 2010, 17, 270–285. [Google Scholar] [CrossRef]
  28. Zha, J.; Xu, M. High-Grade highways deformation and failure laws in mining area—A case in Nantun Coal Mine, China. Int. J. Pavement Eng. 2019, 20, 1251–1263. [Google Scholar] [CrossRef]
  29. Tong, L.; Liu, L.; Yu, Q. Highway construction across heavily mined ground and steep topography in southern China. Bull. Eng. Geol. Environ. 2014, 73, 43–60. [Google Scholar] [CrossRef]
  30. Wang, Y.; He, M.; Yang, J.; Wang, Q.; Liu, J.; Tian, X.; Gao, Y. Case study on pressure-relief mining technology without advance tunneling and coal pillars in longwall mining. Tunn. Undergr. Space Technol. 2020, 97, 103236. [Google Scholar] [CrossRef]
  31. Hui, W.; Cheng, J.; Pengqiang, Z.; Wenjuan, Z.; Nan, L. A combined supporting system based on filled-wall method for semi coal-rock roadways with large deformations. Tunn. Undergr. Space Technol. 2020, 99, 103382. [Google Scholar]
  32. Shi, Z.; Wang, Q.; Xu, L. Experimental Study of Cement Alkali-Resistant Glass Fiber (C-ARGF) Grouting Material. Materials 2020, 13, 605. [Google Scholar] [CrossRef] [Green Version]
  33. Liu, Q.; Chai, J.; Chen, S.; Zhang, D.; Yuan, Q.; Wang, S. Monitoring and correction of the stress in an anchor bolt based on Pulse PrePumped Brillouin Optical Time Domain Analysis. Energy Sci. Eng. 2020, 8, 2011–2023. [Google Scholar] [CrossRef]
  34. Itasca. Fast Lagrangian Analysis of Continua in 3 Dimensions User’s Guide; Itasca Consulting Group Inc.: Minneapolis, MN, USA, 2005. [Google Scholar]
  35. Lishuai, J.; Pu, W.; Pengqiang, Z.; Hengjie, L.; Chen, Z. Influence of Different Advancing Directions on Mining Effect Caused by a Fault. Adv. Civ. Eng. 2019, 2019, 1–10. [Google Scholar]
  36. Zhang, C.; Zhu, Z.; Zhu, S.; He, Z.; Zhu, D.; Liu, J.; Meng, S. Nonlinear Creep Damage Constitutive Model of Concrete Based on Fractional Calculus Theory. Materials 2019, 12, 1505. [Google Scholar] [CrossRef] [PubMed] [Green Version]
  37. Han, W.; Li, G.; Sun, Z.; Luan, H.; Liu, C.; Wu, X. Numerical investigation of a foundation pit supported by a composite soil nailing structure. Symmetry 2020, 12, 252. [Google Scholar] [CrossRef] [Green Version]
Figure 1. Surface walls and foundation damage above the mining area. (a) Wall cracking. (b) Cracks in the wall. (c) Basic cracking.
Symmetry 12 01428 g001
Figure 2. Surface fragmentation and vegetation destruction above the mining area [4]. (a) Vegetation destruction. (b) Groundwater depletion. (c) Road collapse.
Symmetry 12 01428 g002
Figure 3. Stress-strain curve of the chosen model [34].
Symmetry 12 01428 g003
Figure 4. Numerical model boundary.
Symmetry 12 01428 g004
Figure 5. Contour map of surface settlement in different mining sequences. (a) Mining sequence I. (b) Mining sequence II. (c) Mining sequence III. (d) Mining sequence IV.
Symmetry 12 01428 g005aSymmetry 12 01428 g005b
Figure 6. Variation curves of surface settlement at different stages of excavation.
Symmetry 12 01428 g006
Figure 7. Subsidence display of mining sequence I. (a) X = 1200 Contour map of overburden settlement. (b) Y = 1600 Contour map of overburden settlement.
Symmetry 12 01428 g007
Figure 8. Subsidence display of mining sequence II. (a) X = 1200 Contour map of overburden settlement. (b) Y = 1600 Contour map of overburden settlement.
Symmetry 12 01428 g008
Figure 9. Subsidence display of mining sequence III. (a) X = 1200 Contour map of overburden settlement. (b) Y = 1600 Contour map of overburden settlement.
Symmetry 12 01428 g009
Figure 10. Subsidence display of mining sequence IV. (b) X = 1200 Contour map of overburden settlement. (b) Y = 1600 Contour map of overburden settlement.
Symmetry 12 01428 g010
Figure 11. Deformation law of settlement on the ground surface under different mining order conditions. (a) Profile X = 1200 vertical surface deformation “S” curve. (b) Profile Y = 1600 vertical surface deformation “S” curve.
Symmetry 12 01428 g011
Figure 12. Characteristics of horizontal surface deformation.
Symmetry 12 01428 g012
Figure 13. 3D rendering of surface collapse. (a) 3D rendering of ground collapse in goaf I. (b) 3D rendering of ground collapse in goaf II. (c) 3D rendering of ground collapse in goaf III. (d) 3D rendering of ground collapse in goaf IV.
Symmetry 12 01428 g013
Table 1. Corresponding values of the inflection point coordinates of the mineral boundary.
DotX Coordinate Corresponding ValueY Coordinate Corresponding Value
Real MineModel MineReal MineModel Mine
A14,009,900170020,559,7001000
A24,010,500190020,559,9001600
A34,011,900190020,559,9003000
A44,011,500110020,559,1002600
A54,010,30090020,558,9001400
A64,009,90090020,558,9001000
Mining depth: +137–350 m
Table 2. Physical and mechanical parameters of each layer [4].
LithologyNatural Density/kg·m−3Elastic Modulus E/×10 GPaPoisson’s Ratio μInternal Friction Angle φ/°Cohesion C/MPaTensile Strength/MPa
Quaternary18501.85 × 10−30.32715.112 × 10−30
Changlu Group23802.750.22735.41.150.77
Fangzi Group23602.870.23436.11.110.65
Stone Box Group23203.280.30333.21.140.74
Shanxi Group 123703.890.31338.71.031.12
Coal seam 2#14600.350.41223.91.180.27
Shanxi Group 223714.010.31438.71.041.12
Coal layer 4#14600.370.41123.91.180.27
Table 3. Timing of five-layer coal mining in Beibu Coal Mine.
Coal SeamMining Sequence
Sequence ISequence IISequence IIISequence IV
2#
4#
7#
15#
19#
Table 4. Horizontal surface deformation values and coordinates under each mining sequence.
Mining SequenceHorizontal Deformation in X DirectionHorizontal Deformation in Y Direction
Maximum/cmOccurrence CoordinatesMaximum/cmOccurrence Coordinates
X/401-Y/2055-X/401-Y/2055-
I31.60500940017.702009200
II6.5050094004.402009200
III12.8050094007.602009200
IV6.9050094004.602009200

