1. Introduction
Optical sensors for measuring biological solutions’ refractive indices are mainly based on resonant excitation of the waveguide processes. The extensive reviews [
1,
2] describe various structures, which are suitable for dynamically measuring the liquids’ and gases’ refractive indices. Sensors based on the resonant excitation of the waveguide processes can be divided into two types. There is resonant excitation of surface plasmon–polariton waves at the metal–dielectric interface [
3] and resonant excitation of waveguide modes in dielectric gratings [
4]. Resonant excitation of surface plasmon–polariton waves at the metal–dielectric interface is possible using prism structures [
5,
6,
7]. In this case, a thin metal film (gold or silver) deposited on the prism contacts with the tested medium. Moreover, the surface plasmon–polariton resonance can be excited using metal or dielectric grating on the metal substrate [
7,
8,
9]. In fact, the above described sensor structures [
3,
4,
5,
6,
7,
8,
9] are based on planar waveguides, which are easy to manufacture with modern lithography technology.
In addition to sensors based on planar waveguides, a number of sensors based on optical fibers have been proposed [
1,
10,
11,
12,
13]. The sensors, in particular, with an optical fiber Bragg grating (FBG) are considered in [
10]. Sensors based on an optical fiber in which the side is polished are studied in [
11]. Fiber sensors based on Long-Period Fiber Grating are discussed in detail in [
12], and sensors based on D-type fiber are described in [
13]. In general, a large number of sensors based on optical fibers have been proposed, the sensitive elements of which are characterized by small dimensions. The attained refractive index detection limit of 2.5 × 10
−8 is so far the highest value reported for any SPR-based sensor [
14]. The variety of fiber sensors is much higher than that based on planar waveguides, but their fabrication is much more complicated, as evidenced by the overwhelming number of theoretical works using numerical methods.
The reflection coefficient of the grating can be equal to unity at a careful selection of the measured structure parameters under resonant excitation of the waveguide mode in dielectric gratings [
4,
15]. The resonance is disturbed when the refractive index of the tested medium changes. As a result, the reflection coefficient decreases. However, it can be restored at the different wavelength or at the different light angle of incidence on the grating [
16,
17].
In the case of surface plasmon–polariton resonance, the reflection coefficient is zero at the carefully selected prism or grating structure parameters [
3,
8,
9]. The reflection coefficient becomes nonzero when the resonance is disturbed due to the change in the tested liquid refractive index. It is restored at the different wavelength at the constant angle of incidence, or at the different angle of incidence at the constant wavelength.
The value of the shifts of resonance minima or maxima determines the sensors sensitivity on the change in the tested media refractive index. Therefore, a number of studies are devoted to increasing sensitivity. In particular, prism structures were analyzed in [
18,
19,
20,
21,
22,
23,
24]. In [
18], the application of a layer of perforated dielectric on the metal film in the prism structure was proposed, which slightly increased sensitivity. In this case, the structure can operate as a sensor not only for TM (transverse magnetic) polarized waves, but also for TE (transverse electric) ones. In [
19], prism structures with and without the additional dielectric layer deposited on the metal film were studied. The structure with the additional layer can operate for both the TM and the TE polarized waves. It was found that the sensitivity is decreased when the additional dielectric layer is used. It decreases significantly for TM polarized waves. The sensitivity of TE polarized waves appears, although it is less than for TM polarized waves without the additional dielectric layer. It was also indicated that sensitivity increases when prism refractive index decreases.
It was proposed to arrange a thin dielectric layer with the refractive index lower than the prism refractive index in the prism structure between the prism and the metal film [
21]. The spectral and angular dependences of the reflection coefficient have narrow and wide resonances in such a structure. The narrow one is observed at a shorter wavelength. However, such an innovation did not increase the sensor sensitivity. It is only possible to increase the reliability of fixing the values of the angles or wavelengths at which the reflection coefficient minima are observed. In [
22], it was proposed to deposit the gold grating with a period several times smaller than the wavelength on the gold film. This resulted in a spectral narrowing of the resonance curve by 3−4 times. The main characteristics of sensors based on the
Otto and
Kretschmann configurations, namely detection speed, sensitivity, portability, are given in [
23].
The results of the study of surface plasmon–polariton resonance sensors based on grating structures are presented in a huge number of the scientific works. Here are given only a few of them, the most original ones in our opinion [
24,
25,
26,
27,
28,
29,
30,
31]. The multiple surface plasmon spectroscopy for the study of biomolecular systems was considered in [
24]. A biosensor on a relief grating with a leaky mode was studied in [
25]. For gas studies, it was proposed to use the grating-based structure in which surface plasmon–polariton resonance exists [
26,
27]. An original grating formation technology was developed in [
28]. Usage of digital versatile discs for studying Raman spectroscopy was described in [
29]. J. Homola and coauthors compared the sensitivity of the surface plasmon–polariton resonance sensors based on prism and grating structures [
30]. It was shown that the spectral sensitivity is higher for prism structures, and the angular sensitivities are approximately the same. The compact and low-cost biosensor based on novel approach to spectroscopy of surface plasmons was considered in [
31].
Guided-mode resonance in the dielectric gratings on dielectric substrates has been described in many works, in particular [
4,
15,
16,
18,
32,
33]. The studies of bulk gratings at normal incidence of the laser beam are presented in [
4]. The average grating refractive index is higher than refractive indices of the substrate and the surrounding medium. Therefore, such a structure is an asymmetric planar waveguide [
34]. As a result, the guided-mode resonance occurs at carefully selected periodic structure parameters and the reflection coefficient of grating becomes equal to 100 percent. The spectral width of the resonance band decreases when modulation of the grating refractive index decreases [
4]. It was also found that the spectral bandwidth of the resonance for TM polarized waves is much narrower than the resonance width for TE polarized waves. Mostly, such gratings can be formed on photopolymer compositions by the holographic method, and the maximum amplitude of refractive index modulation upon exposure is no more than 0.017 [
35]. The theories of the light beam interaction with structures in which a homogeneous dielectric layer is deposited on the dielectric substrate, on which a dielectric relief grating is formed, the thickness of which is much smaller than the thickness of the dielectric layer, and the grating period is significantly less than the length waves of test radiation, were developed and considered in [
16,
17]. The developed theories are quite complex, however, they allow the calculation of the reflection coefficient of the periodic structure. The experimental studies of waveguide structures with dielectric gratings are presented in [
32]. It is shown that the spectral dependence consists of resonance peaks of high reflection, which are significantly larger than the Fresnel reflection. However, the reflection coefficient is much less than unity. It was also experimentally shown that the maximum transmission peaks on the spectral characteristic shift when the refractive index of the aqueous solution changes. The results of theoretical and experimental studies of the waveguide structure with the dielectric layer on which the sinusoidal dielectric grating was formed, are described in [
33]. Theoretical predictions were confirmed by the numerical calculations. The experimentally measured reflection coefficients under resonance are less than unity. The spectral width of the resonance is much wider than in numerical calculation. However, wavelengths of the maximum reflection are matched for both cases. Such a discrepancy between theoretical and experimental results can be explained by the fact that strict periodicity is disturbed in the manufacture of relief gratings by etching.
The application of the aforementioned planar optical sensors in biological and chemical sensing has obtained extensive focus. Detection of small amounts of toxic species and contaminants is critical for environmental monitoring, human health improvement as well as the prevention of biological and chemical warfare threats. Therefore, the study and improvement of optical sensors has a high priority.
The operation of all three types of planar waveguide sensors is based on the resonant excitation of waveguide processes. The propagation constant in the waveguide is determined by the wavelength and the refractive indices of the layers form the waveguide; in particular, the refractive index of the tested medium. Therefore, the sensitivity of the propagation constant changes upon changing the wavelength and, on the change in the tested medium refractive index, it can give information about the sensitivity of the sensors. In the present work, the analytical equations relating the parameters of the waveguide, the angle of incidence, the angular and spectral sensitivity of the sensor, and the relationship between the full widths at half maximum of the resonance spectral and angular dependences, will be obtained. These studies will show us what to expect from sensors based on planar waveguides.
2. Spectral and Angular Sensors’ Sensitivities and Their Relationship with Planar Waveguide Parameters
The simple structures of the sensitive elements of sensors based on resonance phenomena in planar waveguides are shown in
Figure 1.
In the case that the prism structure is under resonance, the following equation must be satisfied as follows [
22]:
where
is wavelength,
is propagation constant.
The equality in Equation (1) is strong under resonance [
22,
36]. Therefore, the propagation constant
is a real value. Equation (1) allows the determination of the resonant angle of incidence
of a plane wave on the metal film. This equation is accurate since the interfaces between the metal film and the dielectric layers are plane.
For the grating structure, which is shown in
Figure 1b under surface plasmon–polariton resonance, the following approximate equation is true [
3]:
The smaller the perturbations of the plane interface between the metal and the dielectric, that is, the smaller the grating thickness
, the smaller the difference between the right and left sides of Equation (2) under resonance. The relations
and
[
37,
38] are true for silver or gold, taking into account that resonance is most pronounced in periodic structures with these metals. In this case, the following relation also is satisfied
. There is at
for silver and
for water refractive index
[
39,
40]. Therefore, the Equation (2) for
can be rewritten as follows:
When the guided-mode resonance is excited in the grating structure, the following equation is satisfied [
4]:
The propagation constant is approximately 15 µm
−1 for our waveguide parameters, which consist of the grating, the substrate and the tested medium. The difference between the right and left sides of Equations (1) and (3) is less than 0.001 µm
−1. The less the modulation of the grating refractive index, the smaller the difference between the right and left sides of Equation (4) [
4]. Discrete propagation constants in the planar dielectric waveguides can be determined by the method described in [
34], as well as by the numerical method in the frequency domain, which provides precision calculation accuracy [
41,
42]. All calculations for three structures shown in
Figure 1 were carried out for the resonance wavelength of 1.064 µm.
2.1. Relationship Between the Parameters of the Sensor Based on the Prism Structure and the Properties of the Planar Waveguide Dielectric/Thin Metal Film/Dielectric
Let consider the case of surface plasmon–polariton resonance in the prism structure. The prism structure is realized with the following parameters, namely
. The reflection coefficient is
for such parameters. It was calculated by the matrix method [
43]. The resonance angle of incidence on the metal film and the metal film thickness in the prism structure were determined from the condition that the real and imaginary parts of the reflection coefficient
. The intersection of these curves determines the resonant thickness of the metal film and the light beam angle of incidence on the film as shown in
Figure 2.
Propagation constant
can be determined on the basis of the following equation [
44]:
where
x and
y are real and imaginary parts of the propagation constant, respectively. That is
,
,
.
The function
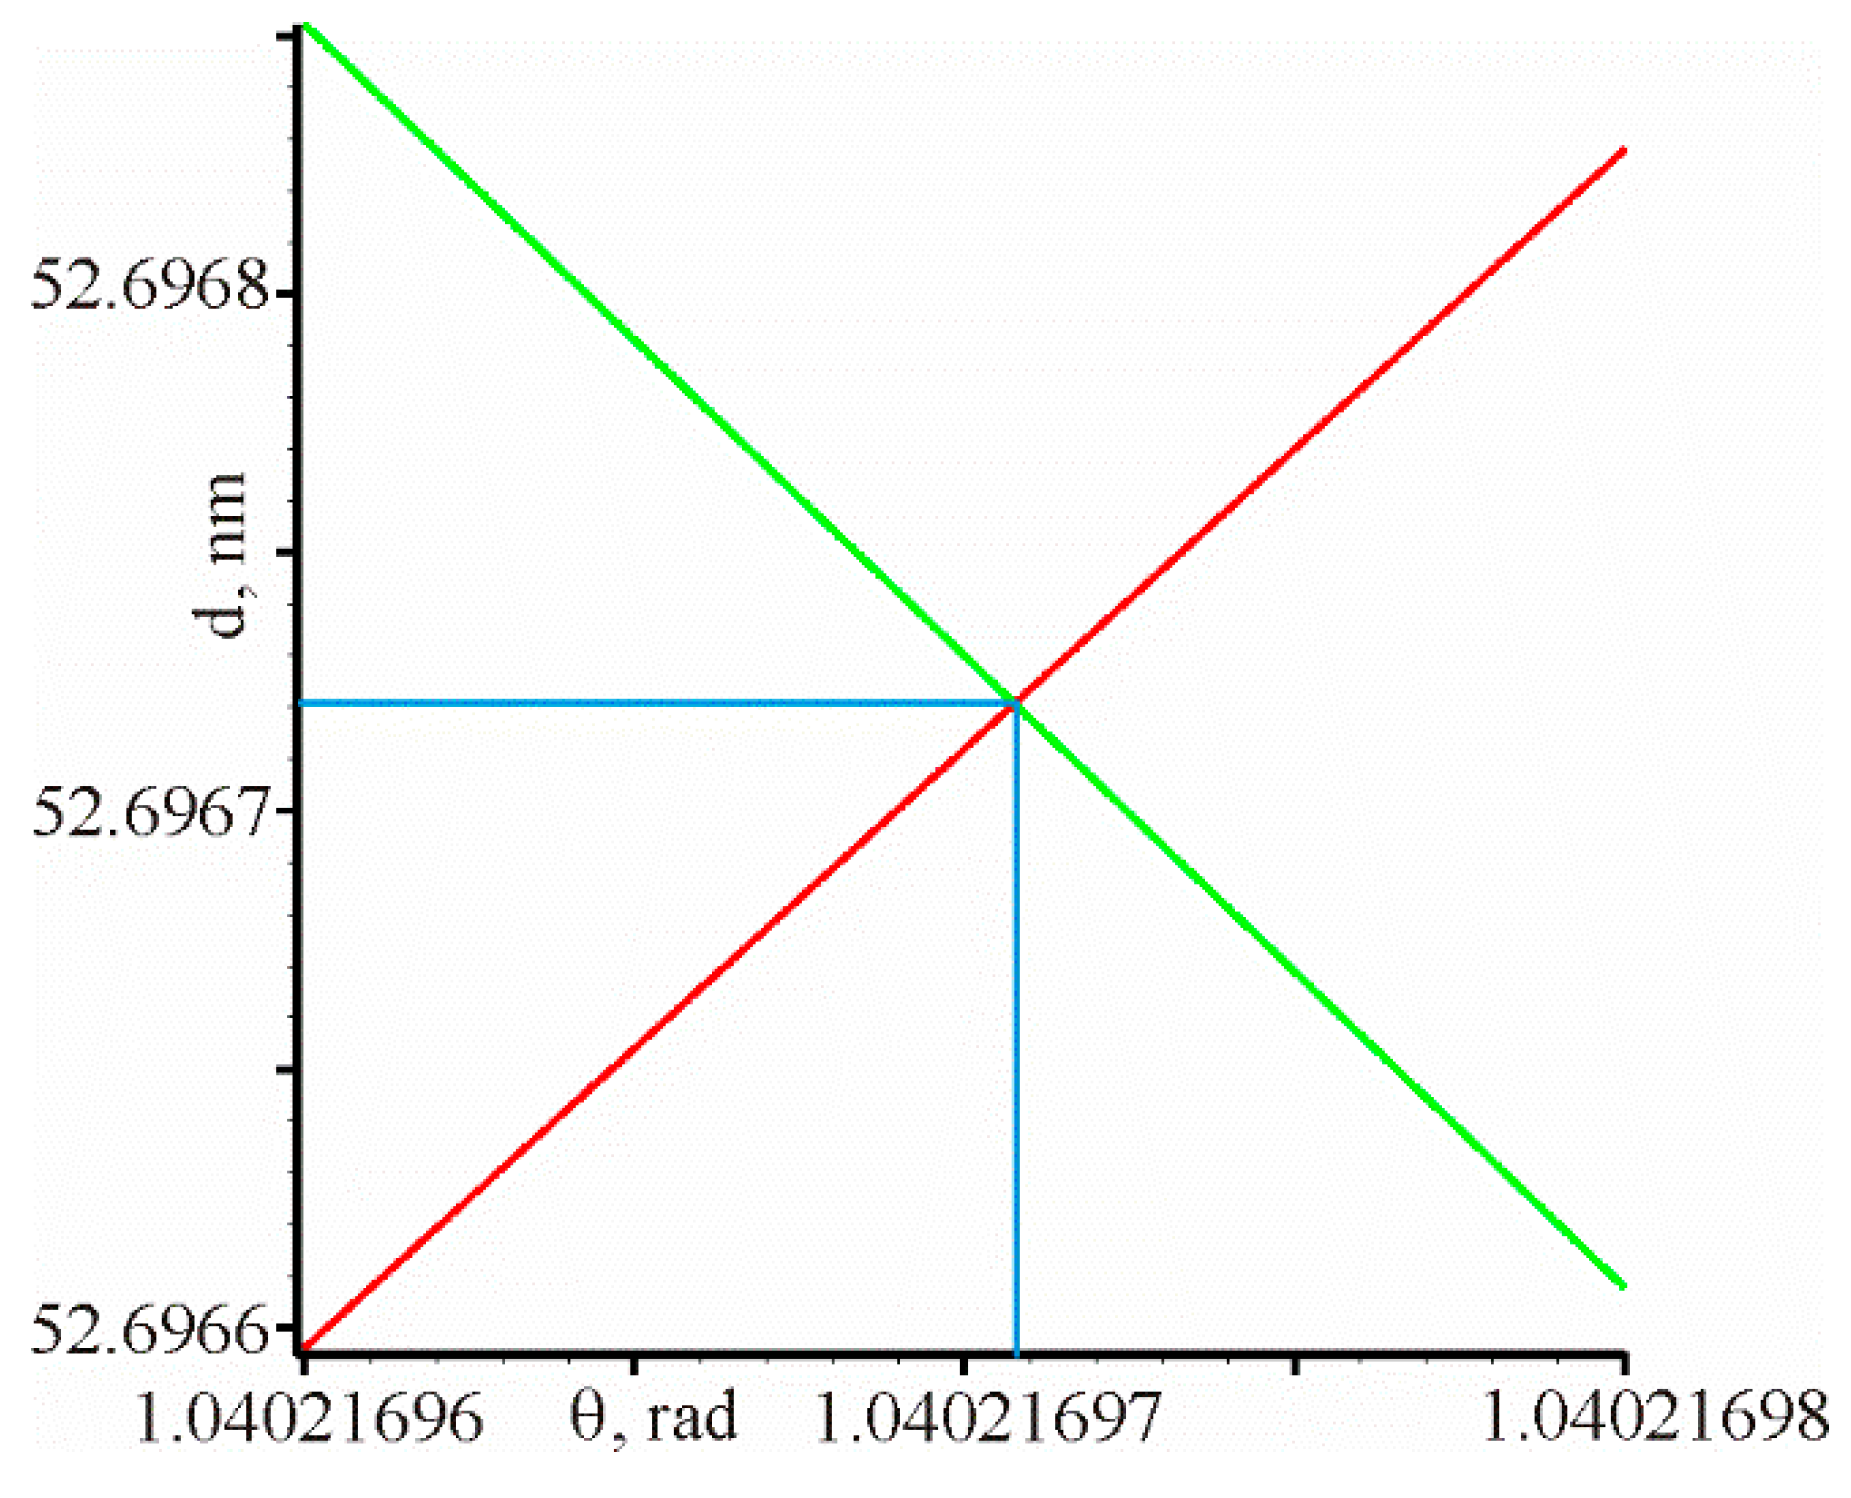
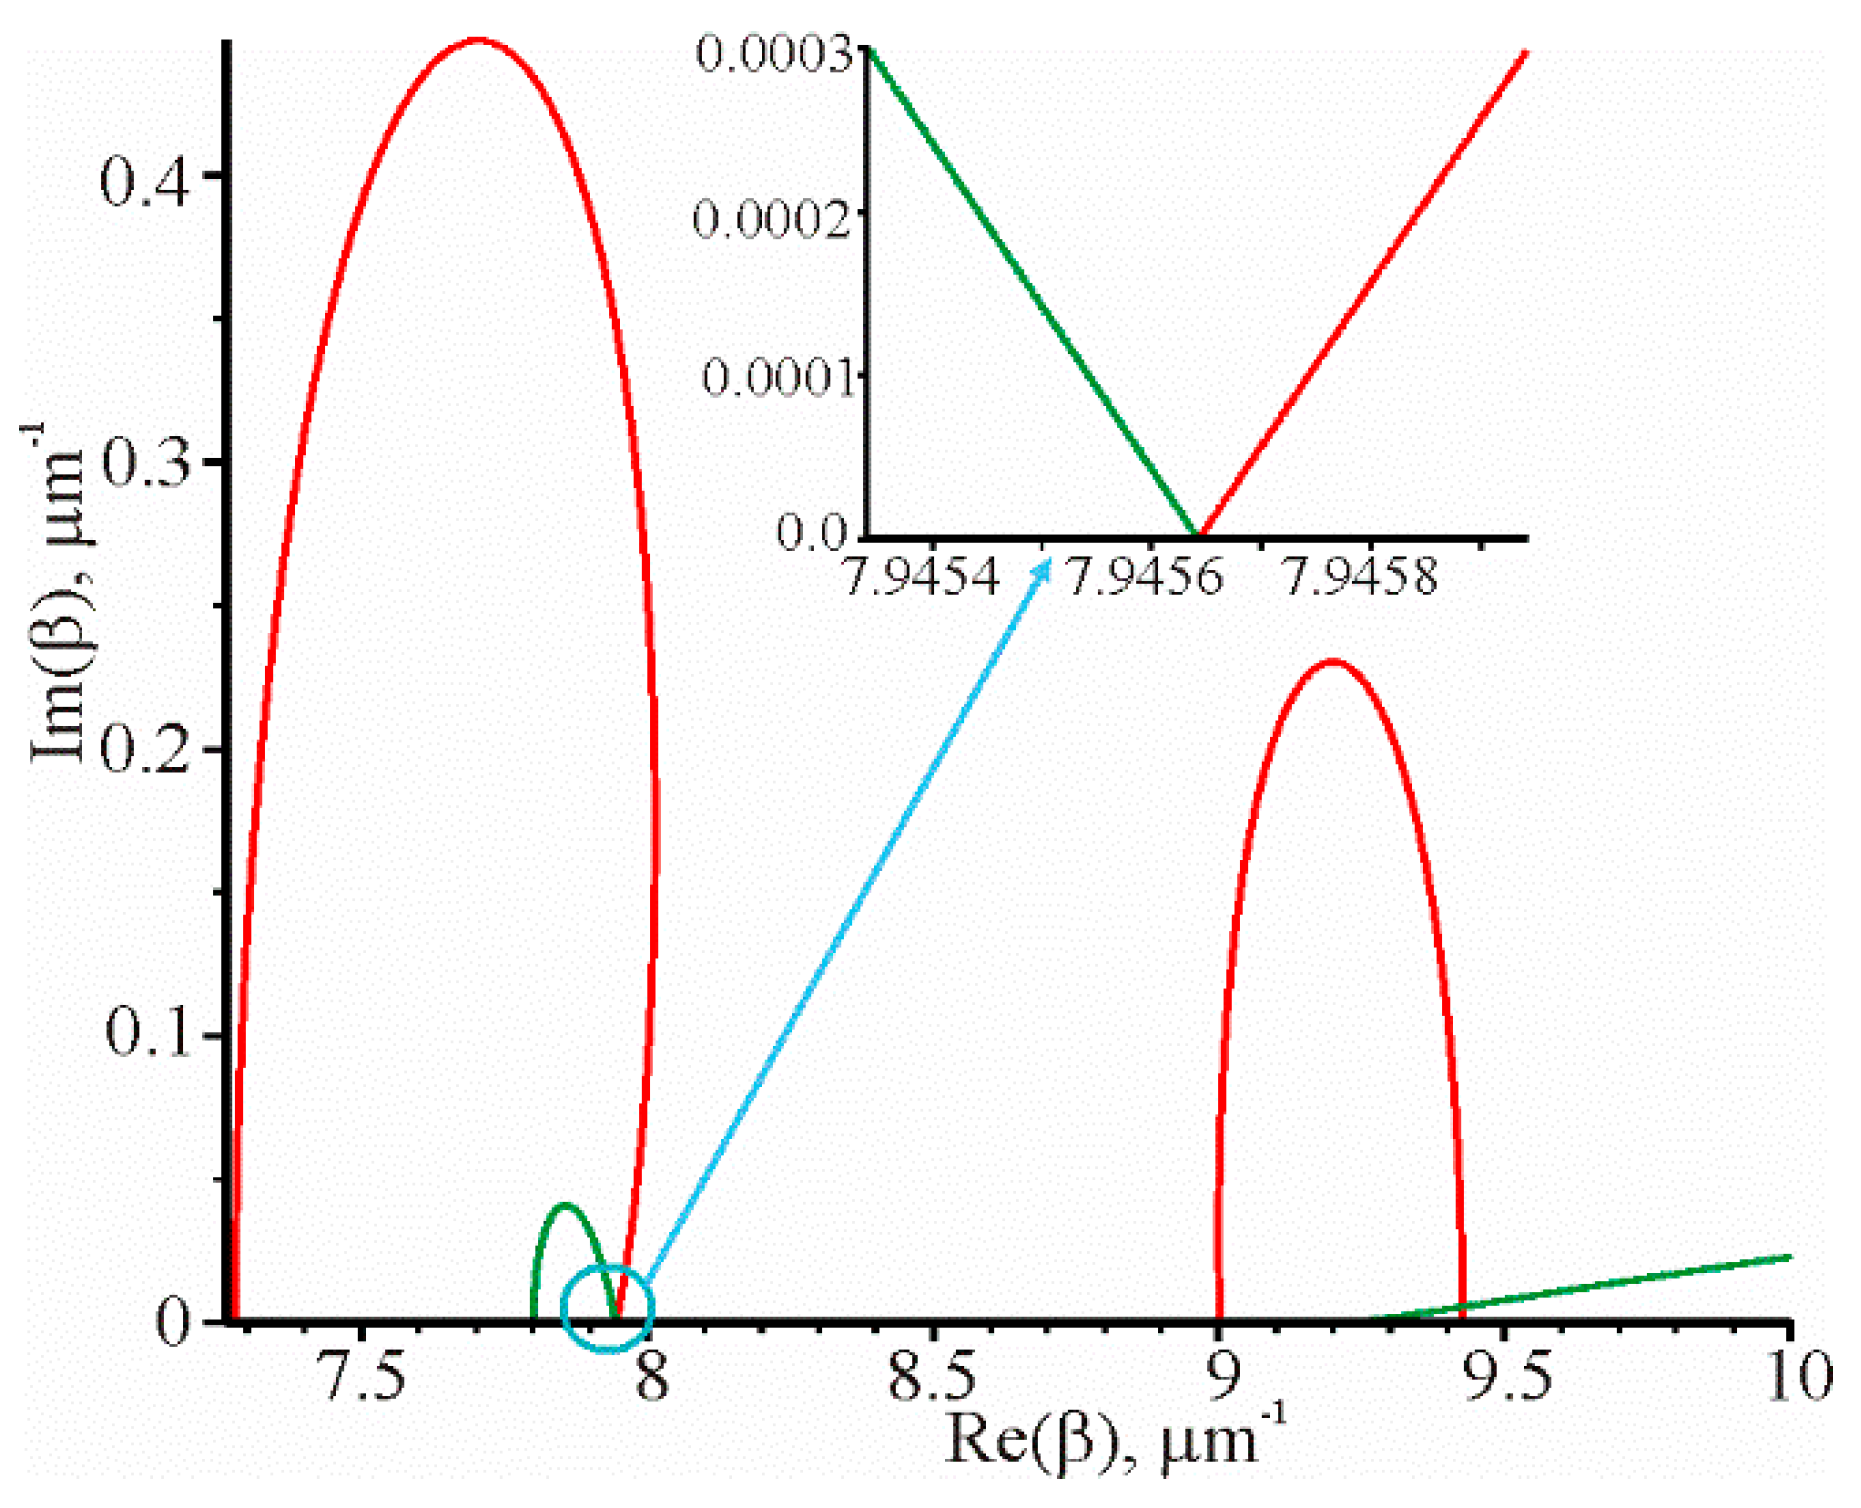
is complex in the general case. It will be equal to zero if the real and imaginary parts of this function are also equal to zero. Therefore, the intersection of the curves must satisfy the following equations:
which determine searched propagation constants. The corresponding graphical dependencies are shown in
Figure 3. The two propagation constants were obtained using systems of Equation (6). One propagation constant is complex. The second one is real and equals
. The angle
calculated by Equation (1) is
rad for
. The reflection coefficient R of the metal film is less than
at this angle. Therefore, it can be argued that Equation (1) is accurate under plasmon–polariton resonance in the prism structure.
The left side of Equation (1) during of the measurement process can depend on the angle and wavelength . The right side depends on and the tested medium refractive index . It is possible to establish a connection between the waveguide parameters using Equation (1), which personifies the right side of the equation, with the sensor characteristics as a whole.
Let the angle of incidence be fixed, in this case when
changes to
, the resonance wavelength changes on dλ. Accordingly, the change in the right and left sides of Equation (1) can be written as follows:
Let’s introduce the following notation
The
and
can be numerically determined using Equation (5) as follows:
From Equation (7), after simple algebraic transformations taking into account Equation (1), the spectral sensitivity can be found as the ratio of the change in the resonance wavelength on the change in the tested medium refractive index at the constant
as follows:
The resonance angle
changes when the tested medium refractive index changes at the fixed wavelength. Based on Equation (1), the following equation can be obtained for this case:
The angular sensitivity can be found from Equation (11) as the ratio of the change in the resonance angle on the change in the tested medium refractive index:
The change in the resonant wavelength by
on the basis of Equation (1) at the constant refractive index
, and with the change in the corresponding resonant angle by
, can be determined using the next equation:
In fact, based on Equation (13), the relation can be calculated between the full widths at half maximum of the spectral resonance curve
and the angular resonance curve
. This ratio can be written as follows:
Let the right side of the Equation (10) be divided by the right side of the Equation (14); as a result, the following can be obtained:
2.2. Sensitivity of the Sensor Based on the Metal Grating under Resonant Excitation of the Surface Plasmon–Polariton Wave
The sensitivities
, as well as the relationship between
and
under surface plasmon–polariton resonance in the grating structure (
Figure 1b), by doing the same using Equation (2), can be determined as follows:
Comparing the ratios
and
, it can be seen that these ratios can be written as:
2.3. Sensitivity of the Sensor Based on the Dielectric Grating under Resonant Excitation of the Localized Waveguide Mode
The sensitivities
, and the relationship between
and
under guided-mode resonance in the grating structure (
Figure 1c), by doing the same using Equation (3), can be determined as follows:
where
and
can be numerically determined from Equations (7) and (8).
The propagation constant can also be expressed as follows:
. The relation
is fulfilled. If it is taken into account that
depends a little on the wavelength, then it can be written:
After substituting (22) into (20) and (21), it can be obtained:
Taking into account Equations (4), (22) and (23) it can be rewritten as follows:
The sensitivity
will be negative when there is a “+” sign in Equation (4). It is due to the fact that
is less than zero and the resonant wavelength will be shorter than the resonant wavelength at the normal incidence [
4]. The sensitivity
will be positive when there is “−” sign in Equation (4). The resonant wavelength will be longer than the resonant wavelength at the normal incidence. It should be noted that the sensitivity using the “−” sign in Equation (4) will be higher than the modulo sensitivity using the “+” sign. It is matched with the results presented in [
33].
Other sensor characteristics can be written as follows:
Equation (27) is written in [
45] as follows:
2.4. Comparison of the Properties of Sensors based on Planar Waveguides
It can be seen that for all types of structures in which resonant excitation occurs, the next relation is satisfied:
This equation is important for sensors because it determines the sensor suitability for measuring changes in the tested medium refractive index. The larger this value, the more accurate and reliable it is possible to measure the change in the refractive index.
The equations relating the characteristics of the sensitive elements of the three types of sensors with the parameters of the grating and the corresponding waveguide are presented in
Table 1.
Some of the equations in the columns are the same, as can be seen from
Table 1. For instance, the equations for
Figure 1a,c are the same in columns 2 and 4. There is also a match for the third column for
Figure 1b,c. However, the equations of the fifth row become the equations of the fourth row if it is taken into account that
[
46] for the grating shown in
Figure 1b. On the other hand, the conditional period
can be introduced for the equations, which relates to the prism structure. This period can be determined as follows:
Thus, the equations in the columns take the same form, which coincides with the equations of the fifth row of
Table 1 and corresponds to the periodic structure shown in
Figure 1c.
As follows from
Table 1, the sensors’ characteristics are determined by the sensitivity of the propagation constants of the waveguides
on the change in the wavelength
and on the change in the test medium refractive index of the
, as well as the width of the angular resonance characteristic
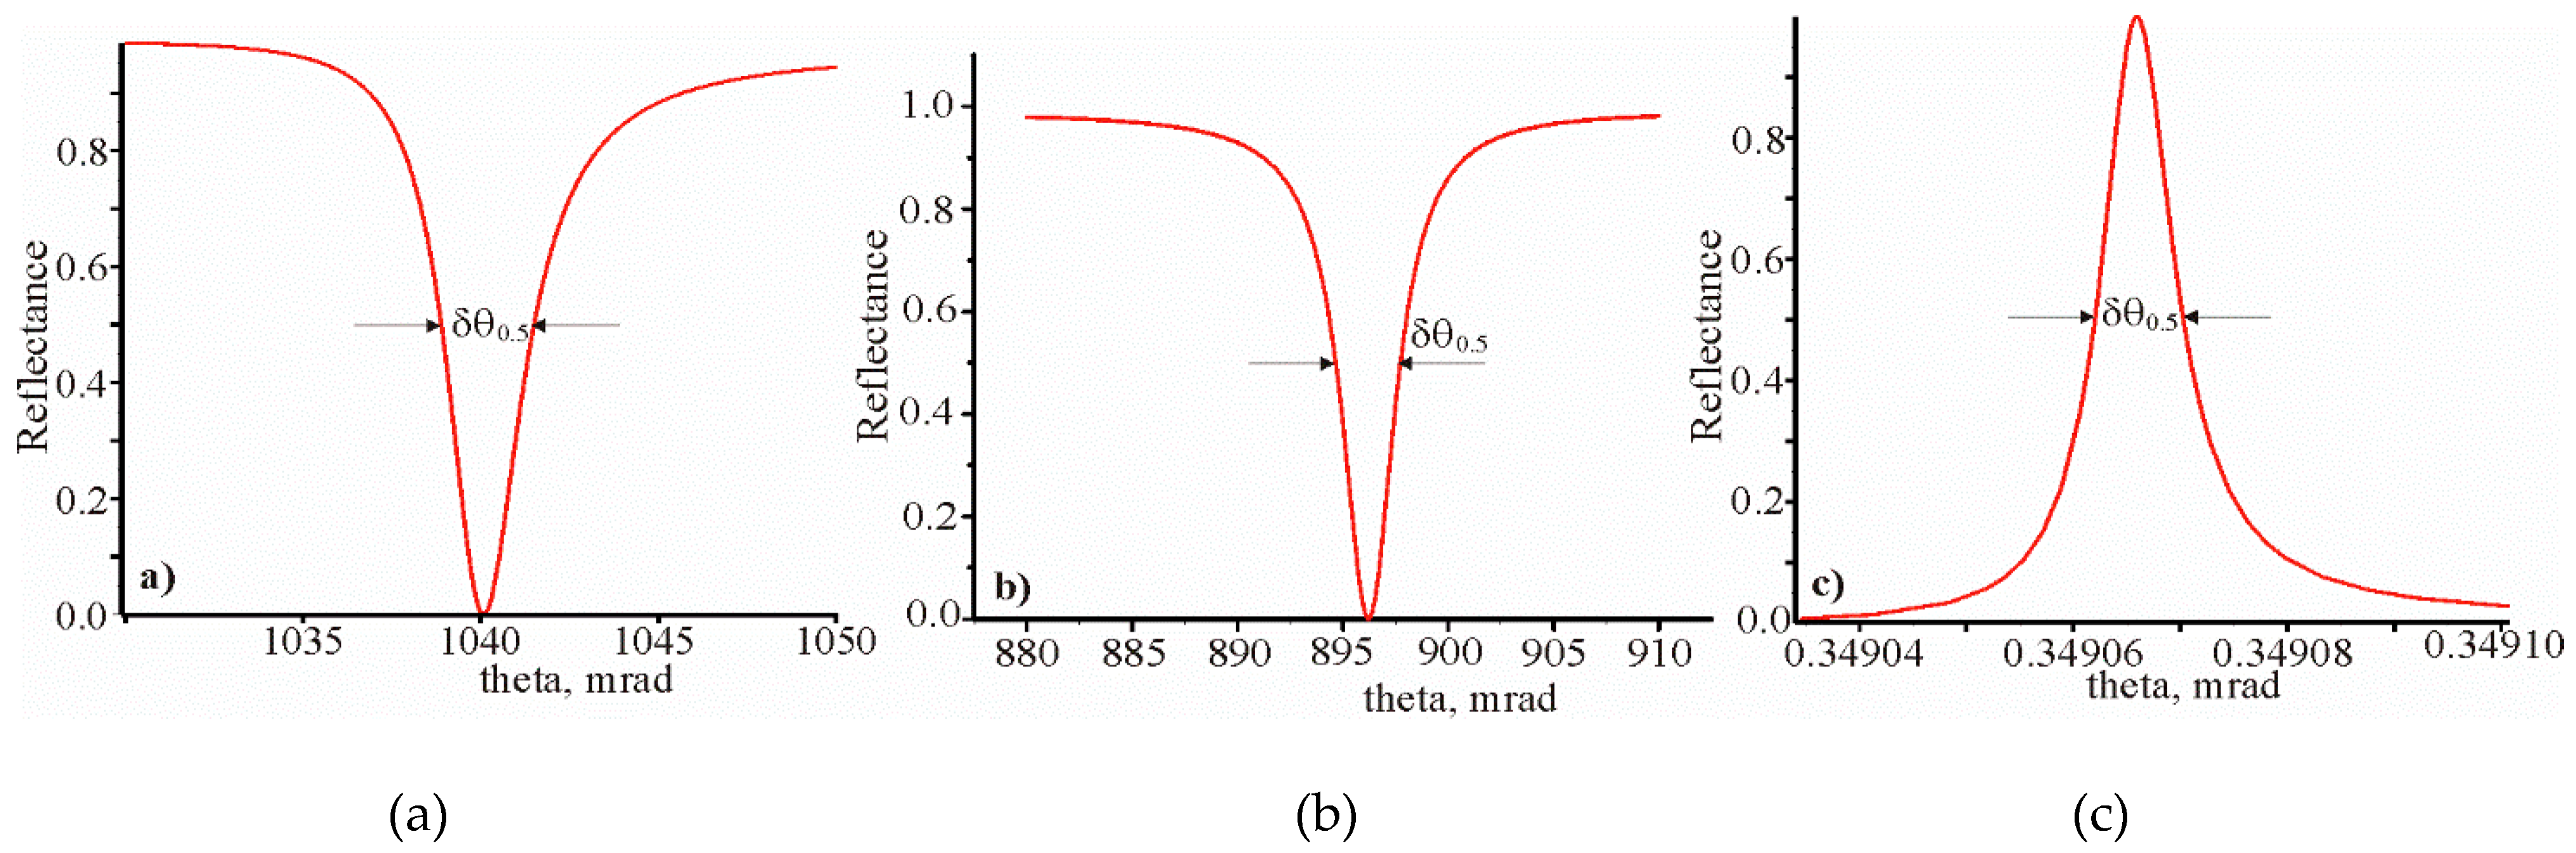
. The angular dependences of the reflection coefficient on the angle of incidence
for three different sensitive sensor elements are shown in
Figure 4. The resonance curves were calculated numerically; in particular, for the prism structure, by the matrix method [
43], and, for grating structures, by the Rigorous couple wave method (RCWA) [
47]. The modulation amplitude of the refractive index for the dielectric grating is 0.017. The values for
are presented in column 6 of
Table 2.
The main parameters of the resonance structures are presented in columns 1, 2 and 3 of
Table 2. The columns from 4 to 8 show the parameters obtained by the matrix method (row 3) and Rigorous coupled wave analysis (RCWA) (rows 4 and 5). It can be seen that the data of columns 9 and 10 in the corresponding rows are practically the same. The angular sensitivities (column 8) of the prism structure and the metal grating are close to each other. The spectral sensitivity of the prism structure is much higher than for the metal grating. However, the ratios
and
are about the same for both structures. The spectral and angular sensitivities of the dielectric grating are approximately an order of magnitude lower than for the metal grating. At the same time, the ratios
and
are approximately 30 times larger than the corresponding ratios for the prism structure and the metal grating. It is due to the very narrow resonant spectral and angular dependencies.
Table 3 shows the calculation results. Data in columns 6–11 are obtained on basis of the data in columns 1–5. The results of column 3 are determined from the angular dependences of the reflection coefficient, which are shown in
Figure 4. The data of columns 4 and 5 are obtained using Equations (7) and (8), where the propagation constants
are determined from solution of the corresponding wave equations. The data of columns from 6 to 11 are calculated using equations presented in
Table 1, columns 1 to 5.
A comparison of the data in the columns 6–11 of
Table 3 with the data in the
Table 2 shows their coincidence with high accuracy. It confirms the reasonableness of the obtained analytical equations.
3. Discussion
All three studied structures are united by the fact that they are, in fact, planar waveguides. In the first two structures, a surface plasmon–polariton wave is excited, and in the third one, the localized waveguide mode is excited. In the case of waveguide resonance, the Equation (1) with careful selected parameters of the prism structure is accurate, so the planarity of the metal film is not violated. For grating structures, shown in
Figure 1b,c, the Equations (2) and (3) are approximate for disturbances in the homogeneity of the layers. These disturbances of the layer homogeneity are small, because the grating thickness (
Figure 1b) is small (10 nm), and the modulation amplitude of the refractive index of the dielectric grating (
Figure 1c) is 0.017. The difference between the right and left sides of Equations (2) and (3) is negligible due to this fact. Bulk phase dielectric gratings based on photopolymer composites can be obtained by the holographic method. They are characterized by high diffraction efficiency, uniformity of parameters over the area and practically no absorption, and the modulation amplitude of the refractive index in the grating is less than 0.02 [
35].
Thus, the spectral and angular sensitivity of the sensors, and the sensitivity of the change in the propagation constant of the waveguide modes on the change in the wavelength and the change in the tested medium refractive index, were analytically connected using the conditions for the resonance appearance in waveguide structures, Equations (1), (2) and (3). Moreover, the analytical equations are determined by the sensitivity of the change in the propagation constant on the change in the tested medium refractive index for both grating structures (see
Table 1). It is shown that the obtained analytical equations are practically the same for all three types of sensors under certain assumptions. In addition, analytical equations show that sensitivities increase when wavelength, grating period and sensitivity
of change in the propagation constant on the change in the tested medium refractive index increase. It should be noted that sensitivities are inversely proportional to
It also was shown that, for all three structures, the equations connecting the characteristics of the sensors with the characteristics of the waveguides are the same.
The full widths at half maximum of the spectral and angular reflectance dependence, using the simple equation
, were connected. Therefore, the following fundamental relation was obtained:
This equation is the most important for sensors, since it determines the suitability of the sensor for measuring changes in the tested medium refractive index. This ratio increases when wavelength and increase. It is inversely proportional to
The obtained analytical equations are confirmed by numerous calculations. The angular and spectral sensitivity, as well as the width of the resonance curves, were determined on their base. The results of numerical calculations are presented in
Table 2 and
Table 3. The calculations showed that the angular sensitivities for the sensors, which are shown in
Figure 1a,b, are approximately the same. However, the spectral sensitivity of the prism structure is much higher than the corresponding sensitivity of the metal grating on the metal substrate. At the same time, the ratio
is the same for both types of sensors. It is approximately 509 and 523. Sensors based on the dielectric grating on the dielectric substrate have the lowest angular and spectral sensitivity. There are 141.6 mrad and 75.9 nm, correspondingly. It should be noted that ratio
is the largest among all types of the sensitive structures. This ratio is approximately of 17,200 for our research case. It is due to the very small widths of the resonance curves. To increase the width of the resonance curves, it is necessary to increase the modulation amplitude of the dielectric grating refractive index [
4].
The measurement accuracy of the above-mentioned sensors is also determined by secondary devices, as well as by the methods of processing the received signals. Comparison of the sensors shown in
Figure 1a,b, according to
Table 3, shows that the sensor based on the prism structure has the highest spectral sensitivity. However,
is higher for this sensor. At the same time, the ratio
is about the same for both sensors. The prism structure has an advantage over the grating structure shown in
Figure 1b if it is possible, with a secondary device and the corresponding software, to record the minimum of resonance with high accuracy. It should also be taken into account that the technology for manufacturing the prism structure is simpler than the technology for the grating structure. The characteristics of the prismatic structure can be improved, as suggested in [
21,
22].
The characteristics of the sensor shown in
Figure 3c differ significantly from the first two cases. The spectral and angular sensitivities are not high (see
Table 3), however,
is the highest (see
Table 3). That is, if a secondary device can record a minimum of resonance curves with a high resolution, then a sensor based on the dielectric grating can record the slightest changes in the refractive index of the tested medium.
In our work, we have described the simplest sensitive structures, however, there are possible ways to complicate and improve them. The sensitivity can be increased by increasing the intensity of the electromagnetic field at the sensitive structure/tested medium interface or by increasing the contact area between two media on this interface. Increases in the field for the structure shown in
Figure 3c can be achieved by introducing the additional buffer layer with the minimum possible refractive index and thickness of 0.5–1μm between the grating and the substrate. It is possible to improve of the characteristics of the structure shown in
Figure 1b by forming the additional grating with width FΛ and a period that is much smaller than the wavelength, similarly to the prism structure as shown in [
22].
It should be mentioned that the effect of temperature is one of the important factors determining the accuracy of measurements. As it is known, it determines a lot of the dimensional errors of the measurement result [
48]. Moreover, the temperature substantially affects the material parameters of the sensor elements. In our previous work [
49], it was indicated that the reflectance spectra in sensors are shifted to the region of the smaller resonance angles of the incident wave with the increase in temperature. In addition, the resonance curves are broadened out when the temperature is increased. In general, we can say that temperature changes influence the resulting characteristics of optical sensors through the modulation of the refractive indices and the thickness of the materials used in the researched structure. The temperature’s influence on the metal has a decisive role in the resonance of the reflectance curve. However, such impact of the temperature is significant only at high temperatures.


