1. Introduction
As an important means for urban public transportation, subways are facing challenges with regard to rapid route expansions and safety-related problems owing to an increase in passenger flow. Consequently, there is an urgent demand for secure methods of forecasting passenger flow using video surveillance. Such methods use computer vision and artificial intelligence to analyze the content of video sequences, and to track and detect anomalous information. There is considerable research on passenger flow analysis [
1,
2,
3]. In works [
1,
2], regions corresponding to moving objects are detected using a background difference method. In the work [
3], a detection-based strategy is proposed based on the heads and shoulders of detection targets to detect subway passenger flow. This method performs well, but it cannot be used to count the number of passengers in a subway car. Most of the time, passengers in subway cars remain still, yet the background difference method is more suited to detecting moving targets because of the need to update the background. Sometimes subway cars are highly crowded, as shown in
Figure 1. In such cases, the algorithm proposed in the work [
3] encounters problems of misdetections and false detections. Single-image crowd counting is useful for traffic management, disaster prevention, and public management. Crowd-counting methods aim to estimate the number of humans in surveillance videos and photos. Current methods of crowd counting are developed from detection-based [
4,
5,
6,
7,
8] approaches to convolutional neural network (CNN)-based approaches [
9,
10,
11,
12,
13,
14,
15]. This reduces counting errors caused by occlusion, because CNN-based approaches only target the human head. Therefore, CNN-based crowd counting methods are suitable for the counting dense crowds on subways.
To apply a CNN-based method to counting subway passengers, we developed a methodology and a dataset. We designed a novel multi-column atrous CNN that uses ResNet50 [
16] pre-trained on the ImageNet [
17] dataset as the backbone of the network to extract deep features. Previous works [
10,
11,
12] arrange the convolution layers of different convolution kernels into multiple columns to extract large-scale information. By contrast, we focus on using atrous spatial pyramid pooling (ASPP) [
18,
19,
20] to extract multi-scale features. Specifically, ASPP probes an incoming convolutional feature layer with filters at multiple sampling rates and effective fields of view. This module consists of atrous convolution with four different rates in parallel to capture objects and the context in images at multiple scales. Unlike methods based on arranging convolution layers into columns, our method uses filters with multiple sampling rates to extract information at a larger scale.
We also developed a new dataset that contains 346 images with 3475 labeled passengers for metro passenger analysis. The data was collected from video of Zhengzhou Metro Transportation (MT) Line 2, in China. Thus, we refer to it as the Zhengzhou MT dataset.
Figure 1 shows representative images of our dataset. Compared to existing crowd-counting datasets, our dataset offers distinct advantages. To our knowledge, the dataset is the first one designed for counting passengers inside a subway car. Furthermore, due to the narrow space in the car, there is considerable congestion in the images.
The contributions of this work can be summarized as follows. First, for the first time, we use a CNN-based crowd counting algorithm to count passengers in subway cars. Second, we designed a novel multi-scale architecture that extracts deep features and captures multi-scale information in images by using a row of atrous convolutions with different atrous rates. Third, we developed a dataset comprised of images of the interior of subway cars. The dataset is representative, with realistic images of challenging settings and crowded scenes for analysis in the field of intelligent transportation.
The reminder of the paper is organized as follows.
Section 2 presents recent related works.
Section 3 provides details of our proposed metro-passenger counting network (MPCNet). Experimental results are given and discussed in
Section 4. Finally,
Section 5 concludes the paper.
2. Related Work
A myriad of techniques in computer vision have been proposed to deal with task of crowd counting. They can be roughly categorized into traditional methods and CNN-based methods.
2.1. Traditional Methods
Most earlier research [
4,
5,
6,
7,
8] focus on detection-based methods, which consider a crowd as a group of detected individual pedestrians with a simple detection and summing process. Unfortunately, these detection-based methods are limited by occlusions and background clutter in crowded scenes. Since detection-based methods cannot be adapted to highly congested scenes, other methods [
21,
22] employ regression to learn the relations among extracted features from cropped image patches, and then calculate the number of particular objects. Idrees et al. [
23] designed a model that fuses features extracted with Fourier analysis, head detection, and scale-invariant feature transform (SIFT) [
24] interest-points-based counting in local patches. When executing a regression-based solution; however, spatial information in images of crowds is ignored. This can lead to inaccurate results in local regions. In works [
25,
26], a solution to this problem is proposed, with linear mapping between the features and object density maps in a local region.
2.2. CNN-Based Methods
CNN-based methods exploit density maps, owing to their success at classification and recognition [
17,
27]. A comprehensive survey of CNN-based counting approaches is given in the work [
28]. Wang et al. [
9] modified AlexNet [
17] to predict counts directly. In the work [
10], a simple but effective multi-column convolutional neural network (MCNN) is proposed that tackles large-scale variation in crowded scenes. Similarly, Onoro and Sastre [
11] proposed a multi-scale model, called Hydra CNN, to extract features at different scales. Cao et al. [
12] proposed an encoder–decoder network, called SANet, which employs scaled aggregation modules in an encoder. Their method improves the representation ability and scale diversity of features. Sam et al. [
13] proposed Switching-CNN, which utilizes VGG-16 [
29] as a density-level classifier to assign different regressors for particular input patches. Li et al. [
14] proposed CSRNet [
16] by combining VGG-16 [
29] and dilated convolution layers to aggregate multi-scale contextual information. Recently, Wang [
15] designed SFCN to encode spatial contextual information based on VGG-16 [
29] or ResNet-101 [
16].
Based on the research above, we found that by combining deep learning, CNN-based solutions are better able to perform this task, and indeed outperform traditional methods. In particular, networks based on AlexNet, VGG, and ResNet show excellent performance. Thus, we propose a network with ResNet as the front end.
3. Proposed Method
The fundamental idea for the proposed method is to deploy a multi-column atrous CNN to capture high-level features with larger receptive fields, and to generate high-quality density maps. In this section, we first describe the ASPP module in detail and introduce the architecture of the proposed method. Then, we present the corresponding training details. Finally, we describe the method for generating the ground truth.
3.1. ASPP Module
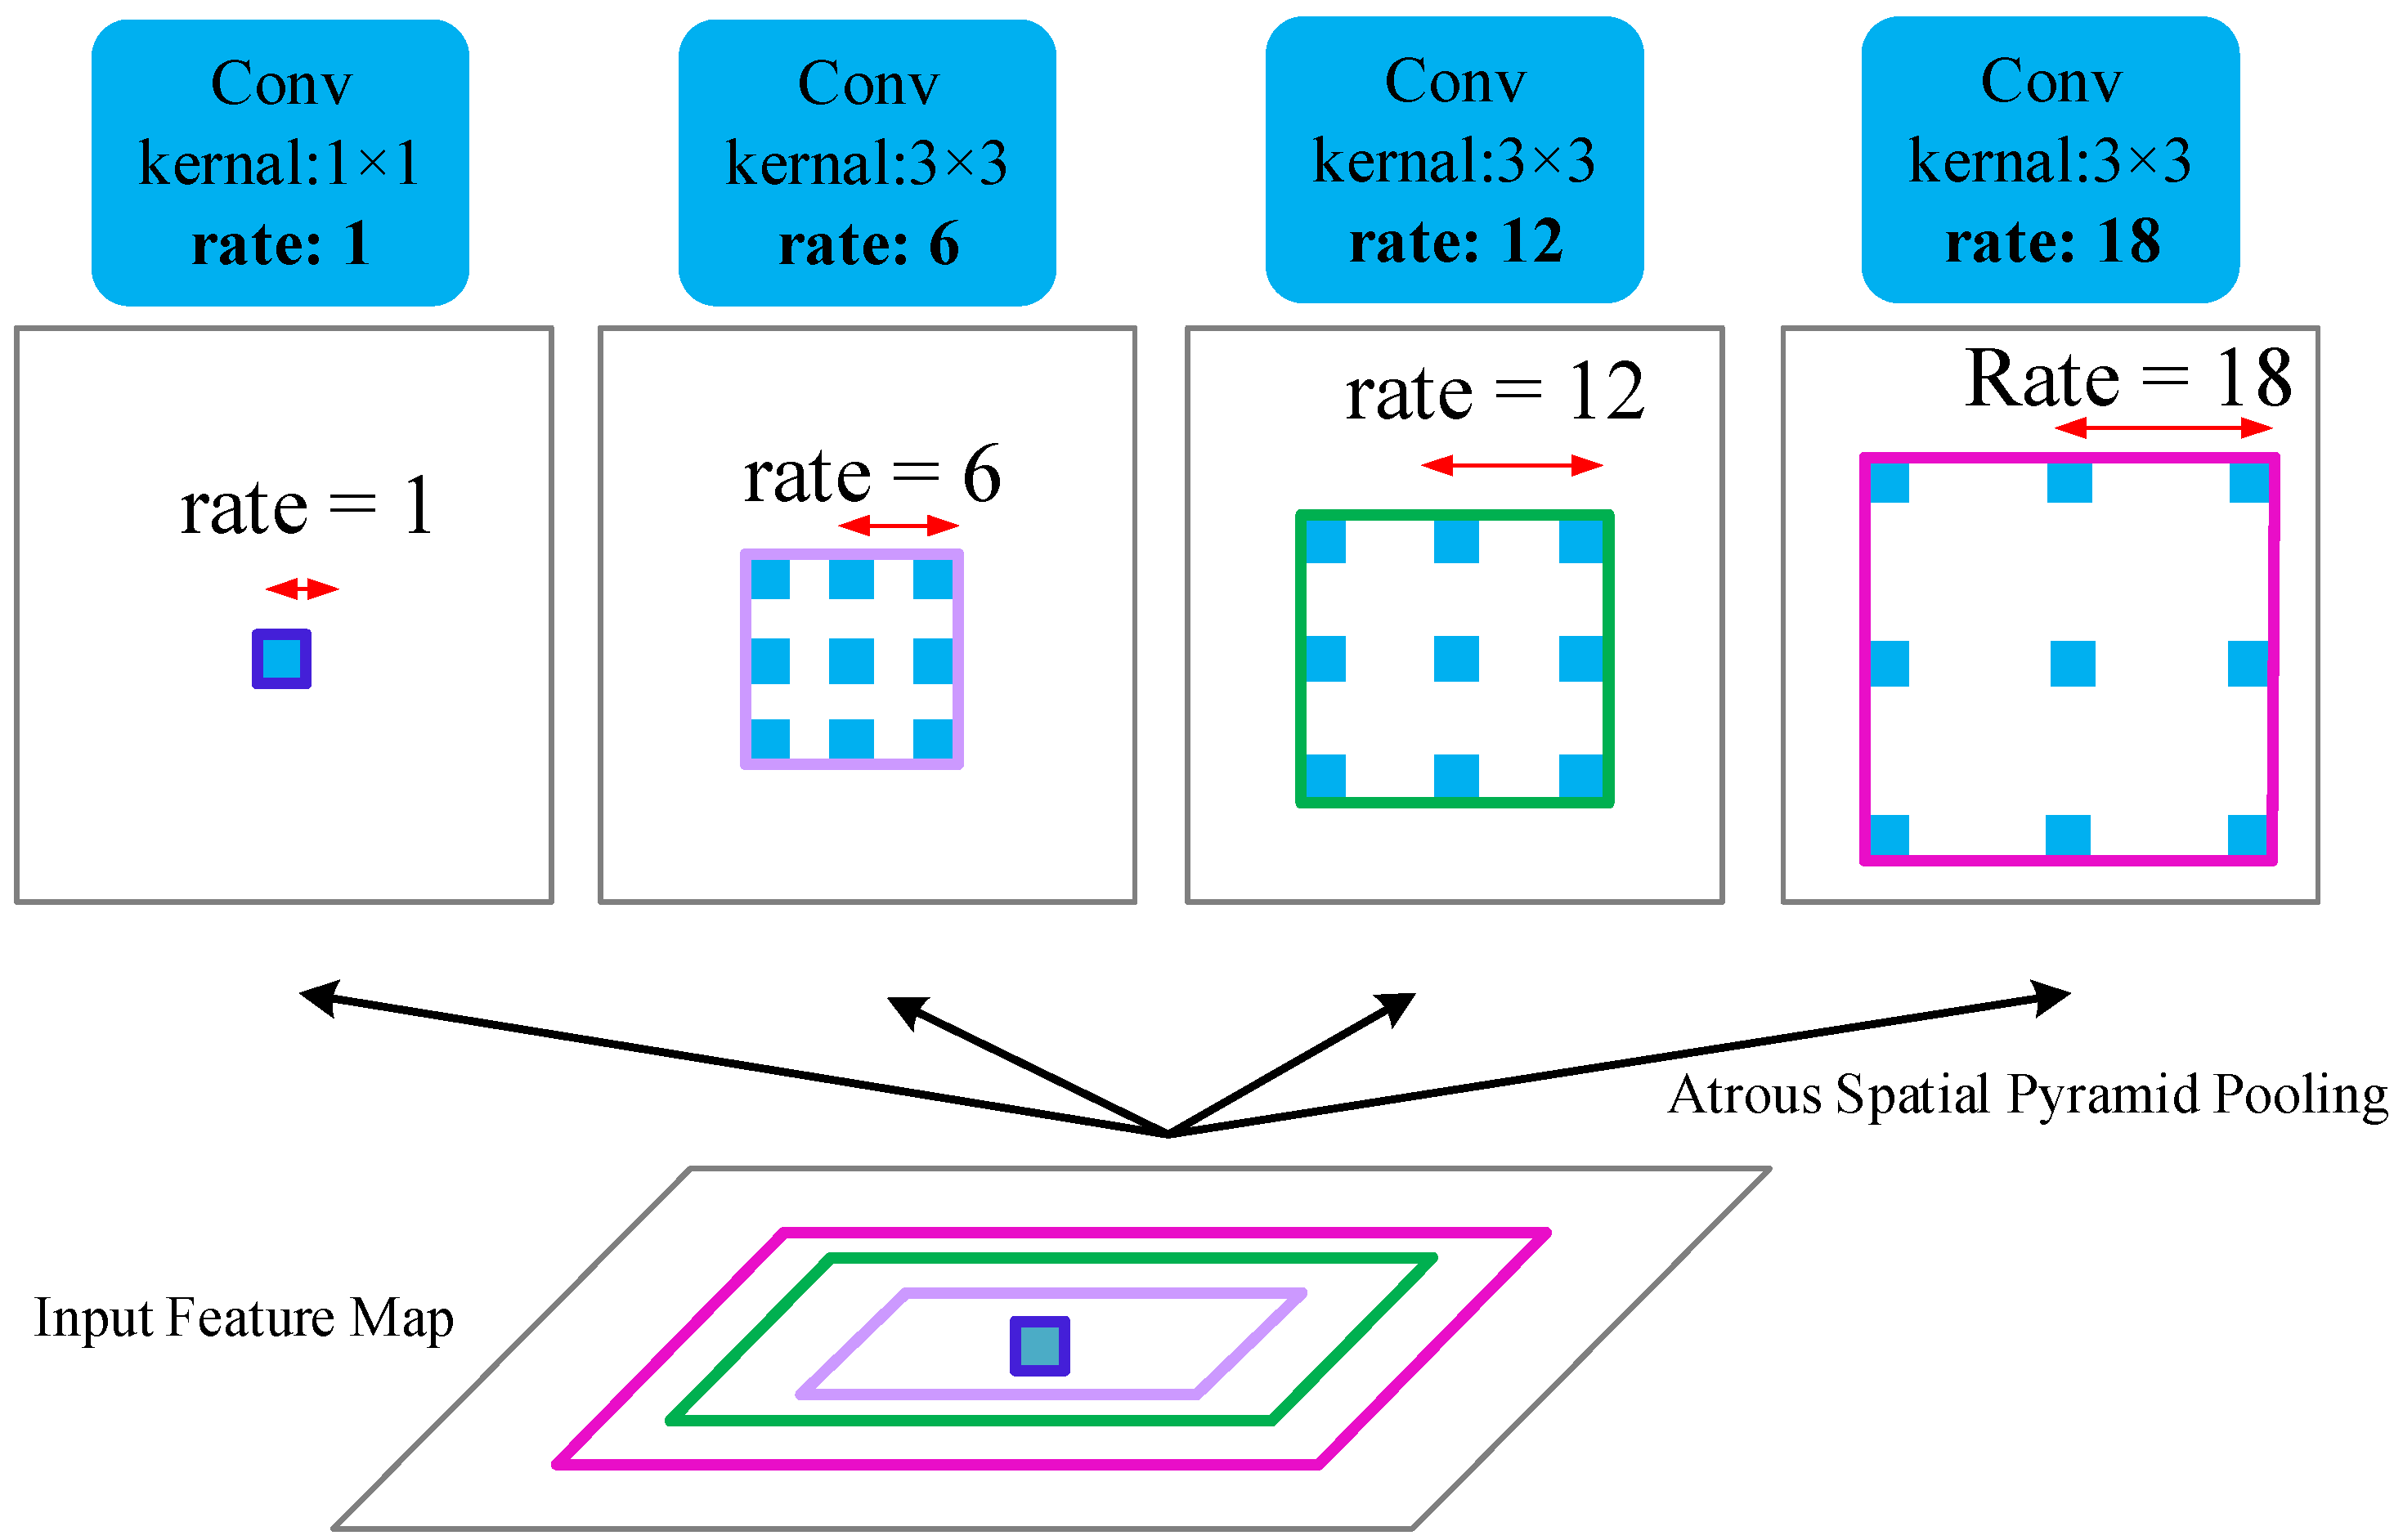
One of the critical components of our design is the ASPP module. As can be shown in
Figure 2, the ASPP consists of a 1 × 1 convolution and three 3 × 3 atrous convolutions, where the rate = (6,12,18). An atrous [
30] convolution can be defined as follows:
where
Y(
l,
w) is the output of the atrous convolution from input
x(
l,
w) and a filter
f(
i,
j),
L and
W denote the length and width, respectively, and
r is the dilation rate. When r = 1, an atrous convolution becomes a normal convolution. The ASPP has been applied to segmentation tasks, demonstrating a significant improvement of accuracy [
18,
19,
20], and it is effective at extracting multi-scale contextual information. Although multi-column CNNs [
10,
11,
12] are widely used for extracting multi-scale contextual information, they also dramatically increase the number of parameters, owing to a larger convolution kernel. The ASPP can extract multi-scale contextual information with atrous convolution, adaptively modifying a filter’s field of view by changing the rate value. With atrous convolution, a small-sized kernel with a
k ×
k filter is enlarged to
k + (
k − 1) (
r − 1) with dilated value
r. Thus, it can flexibly aggregate the multi-scale contextual information. This characteristic enlarges the receptive field without increasing the number of parameters or the amount of computation. (Note: expanding the convolution kernel size can indeed make larger receptive fields, but doing so introduces more operations).
3.2. MPCNet Architecture
Following the work [
15], we selected ResNet50 as the front end of MPCNet as shown in
Figure 3, owing to its excellent high-resolution feature-extraction capability and its flexible architecture, which can easily concatenate the back end to generate density maps. However, atrous convolution requires a large number of high-resolution feature maps. Therefore, it is necessary to extract advanced features through ResNet before performing atrous convolution. To do so, we reserve the first three residual modules in ResNet50 and build the proposed MPCNet with multi-column atrous convolutional layers. In this front-end network, there are 1024 output channels. If we were to continue to stack more residual modules, then more output channels would be needed, increasing the required training time for the network. The size of feature maps is reduced by 8 times in ResNet50, and there is no down sampling in other processes. The parameter stride before the third residual module of ResNet50 has adopted the default value (the stride of 7 × 7 Conv and max pooling is 2, the stride of the first residual module is 1, the stride of the second residual module is 2). The size of feature maps has been reduced by 8 times. If they are reduced again, it will lead to a large amount of information loss. In order to extract more detailed information and obtain high-resolution feature maps, we changed the stride of the third residual module from 2 to 1.
The resulting features from all of the ASPP branches are then concatenated and passed through another 1 × 1 convolution with 128 channels, before the 1 × 1 convolution with one channel. Finally, bilinear interpolation is performed at a factor of 8 as the last layer of our MPCNet. This ensures that the output shares the same resolution as the input image. Notably, our network uses a fully convolutional network. It can accept images of any size, without the risk of distortion.
3.3. Training Details
We trained the proposed MPCNet in an end-to-end manner. Weighted parameters for ResNet50 pre-trained on ImageNet were used to initialize the feature-extraction CNN. The Adam optimizer [
31] with a learning rate of 10
−5 was used to train the model. The Euclidean distance was used to measure the difference between the ground truth and the estimated density map, similar to other works [
10,
11,
14]. The loss function is defined as follows:
where
is a set of learnable parameters in the proposed MPCNet,
N is the number of training imag,
is the input image,
is the ground-truth density map generated by MPCNet parameterized with
for the sample
, and
is the loss between the ground-truth density map and the estimated density map.
3.4. Ground-Truth Generation
In this section, we describe the method of converting an image labeled with people’s heads to a density map. Supposing there is a head annotation at pixel
in a labeled image of a crowd, we represent it as a delta function
and describe its distribution with a Gaussian kernel [
26]
, such that the density map with
N heads is derived as follows:
The above method is generally applicable to sparse scenes. Following the method of generating density maps in the work [
10], we use geometry-adaptive kernels to tackle highly congested scenes. Thus, we generate a density map via geometry-adaptive kernels:
where
depends on the average distance
between the head and its nearest
k neighbors. In the experiment, we followed the configuration in the work [
10], where
β = 0.3 and
k = 3. The sum of all pixel values gives the crowd count of the input image. Here,
C denotes the crowd count, defined as follows:
where
L and
W are the length and width of the density map, respectively, and
is the pixel at (
l,
w) in the generated density map.
4. Experiments and Results
In this section, we introduce our dataset, and we describe two standard datasets for crowd counting. Then, the evaluation metrics are introduced. Finally, we presents the experiment results to answer our research problems.
4.1. Datasets
Existing crowd-counting datasets are not designed specifically for public transportation systems, even though crowd counting is important in the field of intelligent transportation. Therefore, we collected new data and compiled a new dataset, called Zhengzhou MT(Metro Transportation), where the number of heads in an image varies between 1 and 20. We show crowd histograms of the images in our dataset in
Figure 4. All images were taken from the Zhengzhou MT, in China. The size of each image is 576 × 704 pixels. The time span of the dataset is from 7:00 am to 9:00 pm, when congestion is variable. Therefore this dataset is similar to other datasets used in practical applications. Accordingly, the Zhengzhou MT dataset can be considered a valuable and representative dataset. For our evaluation, we used 288 images from the dataset for training and 58 images for testing. The details are listed in
Table 1.
The ShanghaiTech Part B dataset was introduced by Zhang et al. [
10], and it contains 716 annotated images of sparse scenes taken from the streets of Shanghai, comprising a total of 88,488 people. These images were divided into training and test datasets, with 400 images in the training set and 316 images in the test set. With reference to the work [
10], we fixed the size of the Gaussian kernel to 15, where σ = 3, to generate density maps of this dataset.
The SmartCity dataset [
32] contains 50 images collected from ten city scenes, including office entrances, sidewalks, atriums, and shopping malls. The dataset has few pedestrians in the images and consists of both outdoor and indoor scenes. We used this dataset to test the generalizability of the proposed method for sparsely crowded scenes. With reference to the work [
32], we used geometrically adaptive kernels to generate the density maps of the Smartcity dataset.
4.2. Evaluation Metrics
In accordance with previous research [
10,
12,
14], we used the mean absolute error (MAE) and the mean squared error (MSE) to evaluate the proposed method:
where
N is the number of test images,
is the actual number of people in the
i-th image, and
is the estimated number of people in the
i-th image. The
MAE indicates the accuracy of the estimate, and the
MSE indicates the robustness of the estimate. Because the
MSE is sensitive to outliers, its value will be high if the model performs poorly on some samples.
4.3. Experimental Results and Comparison
The implementation of our method is based on the Pytorch [
33] framework. Our experiments were performed on an NVIDIA RTX2080Ti GPU with a batch size of 1. Extensive experiments were performed on a variety of datasets to endorse the validity of results.
4.3.1. Results on the Zhengzhou MT Dataset
We compared our method to state-of-the-art methods. To effectively assess the performance of our method, we implemented two recent crowd-counting algorithms [
10,
14] capable of extracting multi-scale features. The MCNN [
10] is a multi-column CNN that uses several CNN branches with different receptive fields to extract multi-scale features. CSRNet [
14] deploys the first ten layers from VGG-16 as the front end and arranges single column atrous convolution layers as the back end to enlarge the receptive fields. Detailed results of the comparison are given in
Table 2. The results indicate that the proposed MPCNet outperforms MCNN but not CSRNet. Specifically, the proposed method had an MAE of 0.1 higher and an MSE of 0.2 higher than CSRNet.
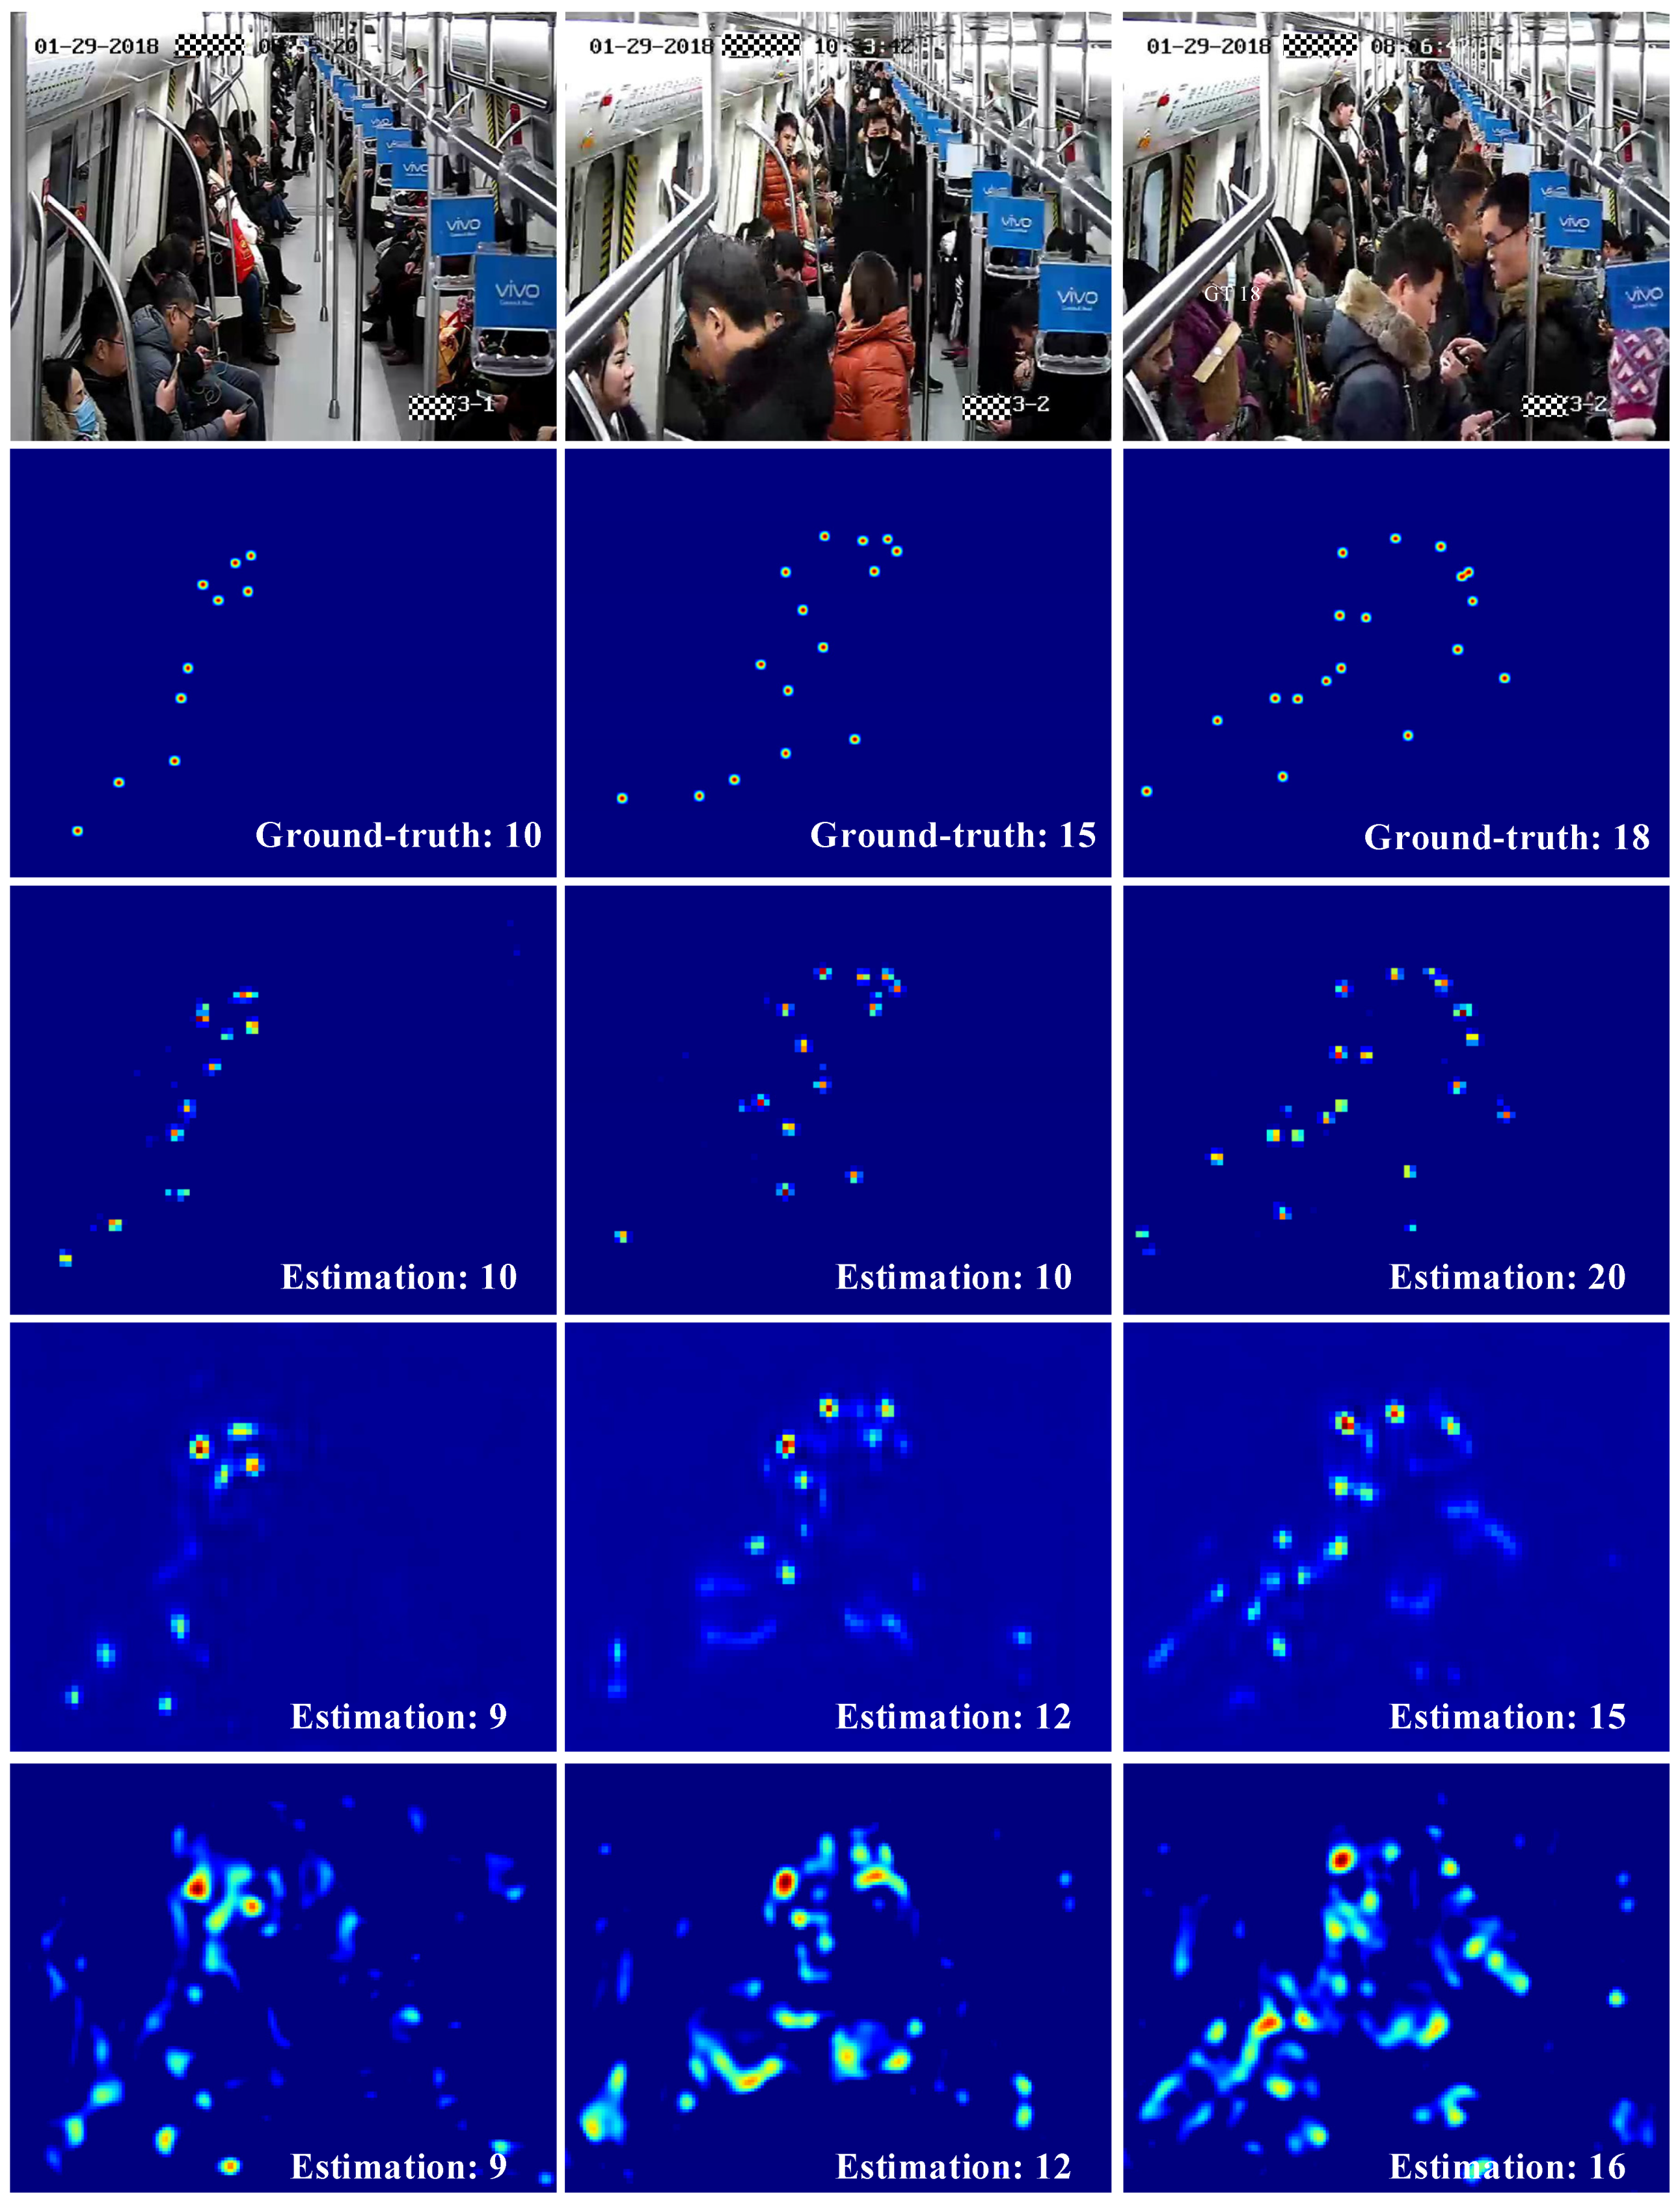
Figure 5 shows the density map results obtained from the three methods. Rows 1 and 2 show test images and ground-truth images, respectively. Rows 3 to 5 show density maps generated from MPCNet, CSRNet, and MCNN, respectively. The proposed method was highly accurate when the subway cars were crowded. In addition, it produced density maps of higher quality than the other two methods. The distribution of passengers in a subway car can be accurately obtained from these high-quality density maps. Consequently, administrators can improve the service quality of the subway system.
We also compared four levels of congestion. We designed an experiment to verify the robustness of the proposed algorithm, MCNN, and CSRNet under four congestion levels. Such an evaluation is of great significance to practical applications. Specifically, we selected some images from the test set of Zhengzhou MT and split them into four groups in ascending order according to the crowd counts to simulate scenes with four levels of congestion in a subway car. From the plots in
Figure 6, we can see that the three algorithms performed well with the first two levels of congestion, owing to the small number of people. However, with an increase in the number of people, the subway became crowded, and occlusions between people were more serious. This compromised the accuracy of all three algorithms. In general; however, our algorithm performed comparably well relative to the two state-of-the-art algorithms.
4.3.2. Results on the ShanghaiTech Part B Dataset
We performed an ablation study on the ShanghaiTech Part B dataset. One of the important features of our method is the ASPP [
18,
19,
20] module. Therefore, it is necessary to compare the performance of the method with and without the ASPP module. We removed the ASPP module from MPCNet and tested it on the ShanghaiTech part B, because it contains scenes with varying scales. In addition, we performed an ablation study to analyze the three configurations of ASPP. This evaluation was designed to demonstrate the necessity of using the ASPP module. By using the ASPP module, the performance on this dataset improved, with an MAE/MSE of 0.1/1.4 lower than without the ASPP module. However, the different atrous rates of the ASPP affected the performance. We show these four architectures and the evaluation results in
Table 3. The architecture with the atrous convolution rate (1,6,12,18) was the most accurate. Therefore, we used this architecture for the proposed MPCNet.
To visualize the ability of the ASPP model, we show density maps generated from the four different architectures in
Figure 7. The first row shows test images, and the second row shows ground-truth images. Rows 3 to 6, respectively, show density maps generated from the four architectures in
Table 3. As this figure shows, the architectures without the ASPP module tended to overestimate the count, owing to the interference of the background with the crowds. When the ASPP module was added, this interference was eliminated. These results demonstrate the need for the ASPP module.
Next, we compared our MPCNet with existing state-of-the-art methods on the ShanghaiTech Part B. The results are shown in
Table 4. Zhang et al. [
9] first used a CNN for density map generation, and their network outputs both density maps and counts. Based on MCNN [
10], Sam et al. [
13] added a switch classifier to assign a regressor to an image, improving the performance compared to the MCNN. Sindagi et al. [
34] proposed a variation to the MCNN as a density map estimator, combining global and local contextual information with multi-scale features. Adversarial loss is utilized to generate high-quality density maps and significant improvements. In the work [
35], multi-task learning is applied to combined features learned from different tasks. Their results on the ShanghaiTech Part B dataset are close to the results in the work [
34]. Liu et al. [
36] proposed a novel crowd-counting method that uses a large number of unlabeled crowd imagery in a learning-to-rank framework. The self-supervised task improved the results significantly compared to a network trained only on annotated data. Li et al. [
14] arranged cascading dilated convolution layers as the back end of the CSRNet to enlarge the receptive fields. However, a single-column dilated convolution model does not work well with MPCNet, which uses a multi-column dilated convolution network. The MAE of the proposed MPCNet was 0.9 lower than the CSRNet on the ShanghaiTech Part B dataset. However, our method was not the best among the existing methods. In the work [
12], an approach arranges general convolutions into multiple columns and it also incorporates multi-scale contextual information directly into an end-to-end trainable crowd-counting pipeline. Their algorithm outperformed state-of-the-art crowd-counting methods.
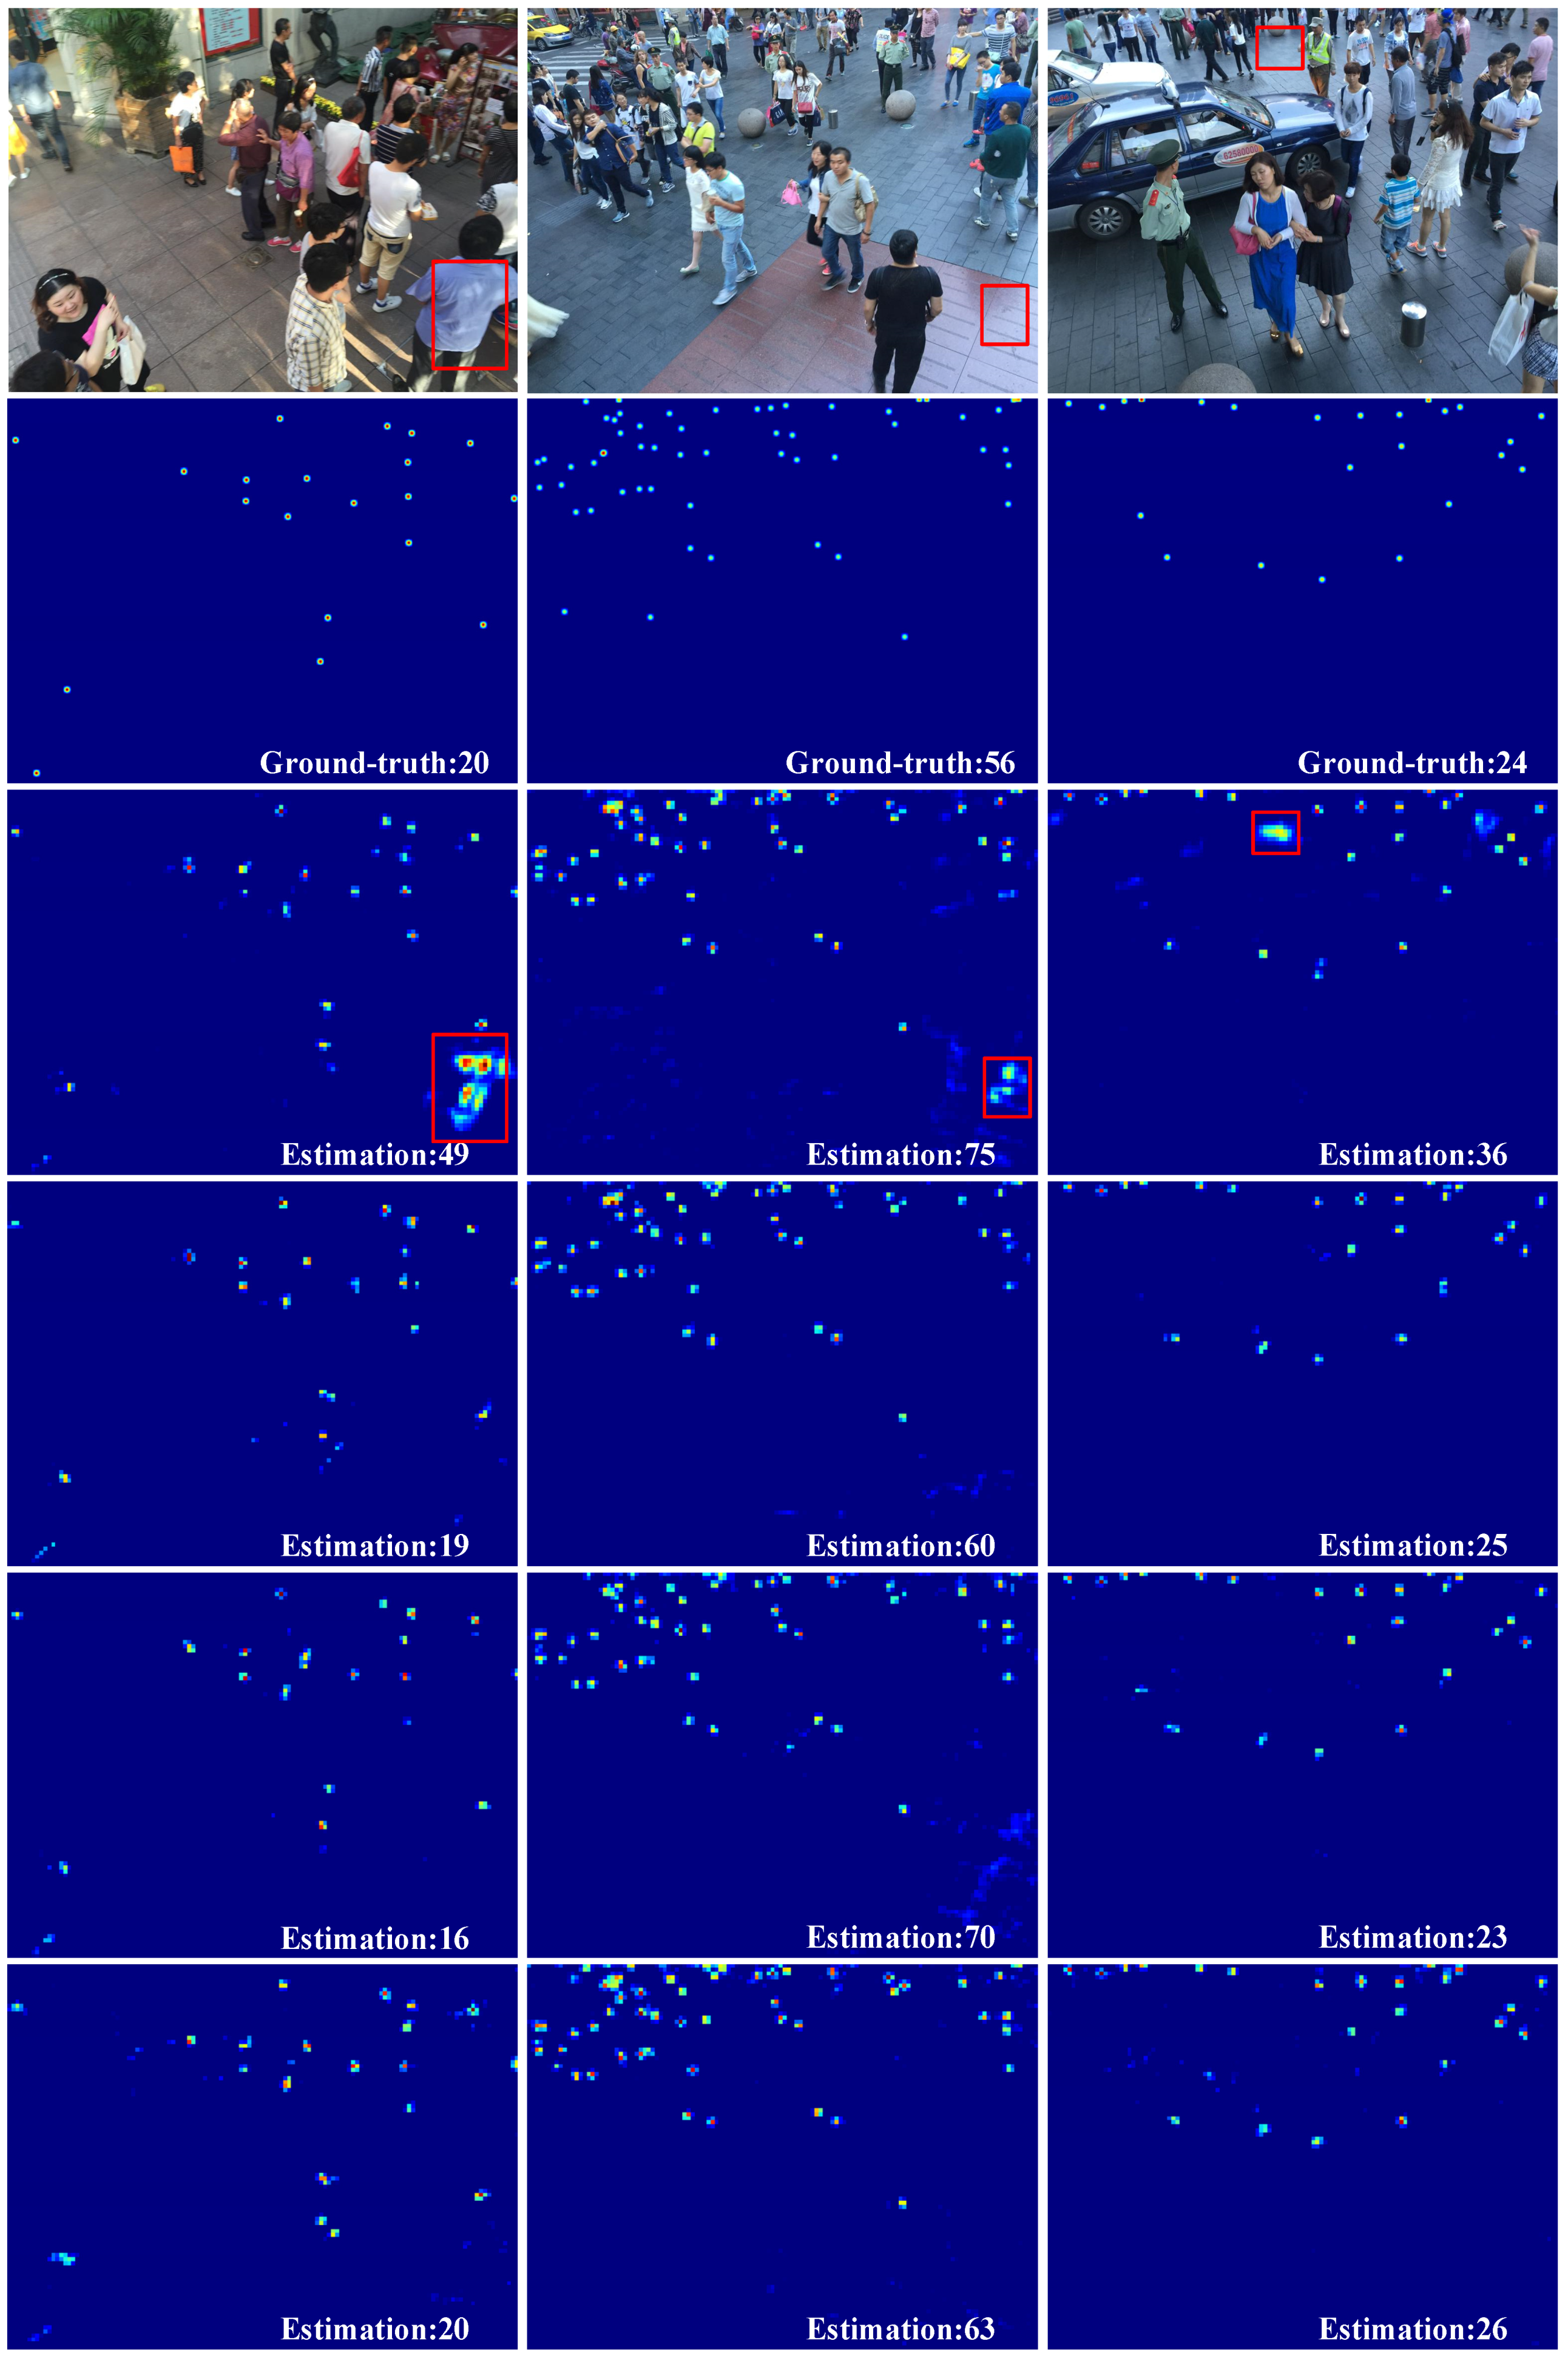
Figure 8 shows the density map results obtained from the three methods. Rows 1 and 2 show test images and ground-truth images, respectively. Rows 3 to 5 show density maps generated from MPCNet, CSRNet, and MCNN, respectively. We can find that the accuracy of our method is higher and the density map generated is clearer.
4.3.3. Results on the Smartcity Dataset
To demonstrate that our method can perform counting tasks on extremely dense crowds alongside tasks on relative sparse scenes, we compared our MPCNet with previous state-of-the-art methods on the Smartcity dataset. We also tried to test CSRNet and MCNN on this dataset. For a fair comparison, we trained MPCNet, CSRNet, and MCNN on the ShanghaiTech Part B dataset and tested it on Smartcity. We compared our method to the other four methods, and the results are shown in
Table 5. Our method achieved the lowest MAE (the highest accuracy) among the methods. Specifically, the MAE of the proposed method was 7% lower than that of SaCNN. Samples of the test cases can be found in
Figure 9 which shows the density map results obtained from the three methods. Rows 1 and 2 show test images and ground-truth images, respectively. Rows 3 to 5 show density maps generated from MPCNet, CSRNet, and MCNN, respectively. We can find that density maps generated by our method are more similar to the crowd distributions in the real images.
5. Conclusions
In this paper, we proposed a method of counting metro passengers, called MPCNet. The proposed method automatically estimates density maps and the number of passengers in images of crowded scenes. We used multi-column atrous convolutional layers to aggregate the multi-scale contextual information in the congested scenes. By exploiting these layers, MPCNet expands the receptive field without losing resolution. To evaluate the effectiveness of the proposed method in the field of intelligent transportation, we collected and labeled a new dataset, called Zhengzhou MT, consisting of 346 images and 3475 annotated people. To our knowledge, this is the first dataset with annotated heads designed for counting metro passengers. Extensive experiments with the new dataset and standard crowd-counting datasets demonstrate the efficiency and effectiveness of the proposed method.
Although our model can extract the multi-scale contextual information in the congested scenes, we hope our model can be more flexible to adapt to the changes of scene scale. Therefore, our future work will still focus on the multi-scale topic in crowd counting, and further explore how to extract more effective multi-scale features of adaptive scene scale changes. Moreover, in order to apply our method to practical engineering, we will also explore the relationship between the number of passengers in the car and the degree of passenger congestion.
Author Contributions
Conceptualization, methodology, J.Z.; software, validation, formal analysis, investigation, resources, data curation, writing—original draft preparation, writing—review and editing, visualization, G.Z.; supervision, project administration, funding acquisition, Z.W. All authors have read and agreed to the published version of the manuscript.
Funding
This research was funded by the National Natural Science Foundation of China (NSFC) General Program, grant number 61673353.
Acknowledgments
We thank Zhengzhou Metro Group Co., Ltd. for providing us with video data.
Conflicts of Interest
The authors declare no conflict of interest.
References
- Qian, X.; Yu, X.; Fa, C. The passenger flow counting research of subway video based on image processing. In Proceedings of the 2017 29th Chinese Control and Decision Conference (CCDC), Chongqing, China, 28–30 May 2017; pp. 5195–5198. [Google Scholar]
- Chato, P.; Chipantasi, D.J.M.; Velasco, N.; Rea, S.; Hallo, V.; Constante, P. Image processing and artificial neural network for counting people inside public transport. In Proceedings of the 2018 IEEE Third Ecuador Technical Chapters Meeting (ETCM), Cuenca, Ecuador, 15–19 October 2018; pp. 1–5. [Google Scholar]
- Sheng, Z.; Tian, K.; Tian, Q.; Qu, H. A Faster R-CNN Based High-Normalization Sample Calibration Method for Dense Subway Passenger Flow Detection. In Proceedings of the 2018 11th International Congress on Image and Signal Processing, BioMedical Engineering and Informatics (CISP-BMEI), Beijing, China, 13–15 October 2018; pp. 1–5. [Google Scholar]
- Li, M.; Zhang, Z.; Huang, K.; Tan, T. Estimating the number of people in crowded scenes by mid based foreground segmentation and head-shoulder detection. In Proceedings of the 2008 19th International Conference on Pattern Recognition, Tampa, FL, USA, 8–11 December 2008; pp. 1–4. [Google Scholar]
- Ge, W.; Collins, R.T. Marked point processes for crowd counting. In Proceedings of the 2009 IEEE Conference on Computer Vision and Pattern Recognition, Miami, FL, USA, 20–25 June 2009; pp. 2913–2920. [Google Scholar]
- Felzenszwalb, P.F.; Girshick, R.B.; McAllester, D.; Ramanan, D. Object detection with discriminatively trained part-based models. IEEE Trans. Pattern Anal. Mach. Intell. 2009, 32, 1627–1645. [Google Scholar] [CrossRef] [PubMed] [Green Version]
- Leibe, B.; Seemann, E.; Schiele, B. Pedestrian detection in crowded scenes. In Proceedings of the 2005 IEEE Computer Society Conference on Computer Vision and Pattern Recognition (CVPR’05), San Diego, CA, USA, 20–25 June 2005; pp. 878–885. [Google Scholar]
- Dollar, P.; Wojek, C.; Schiele, B.; Perona, P. Pedestrian detection: An evaluation of the state of the art. IEEE Trans. Pattern Anal. Mach. Intell. 2011, 34, 743–761. [Google Scholar] [CrossRef] [PubMed]
- Zhang, C.; Li, H.; Wang, X.; Yang, X. Cross-scene crowd counting via deep convolutional neural networks. In Proceedings of the 2015 IEEE Conference on Computer Vision and Pattern Recognition, Boston, MA, USA, 7−12 June 2015; pp. 833–841. [Google Scholar]
- Zhang, Y.; Zhou, D.; Chen, S.; Gao, S.; Yi, M. Single-Image Crowd Counting via Multi-Column Convolutional Neural Network. In Proceedings of the 2016 IEEE Conference on Computer Vision and Pattern Recognition (CVPR), Las Vegas, NV, USA, 27–30 June 2016. [Google Scholar]
- Oñoro-Rubio, D.; López-Sastre, R.J. Towards Perspective-Free Object Counting with Deep Learning. In European Conference on Computer Vision (ECCV); Springer: Cham, Switzerland, 2016. [Google Scholar]
- Cao, X.; Wang, Z.; Zhao, Y.; Su, F. Scale aggregation network for accurate and efficient crowd counting. In Proceedings of the European Conference on Computer Vision (ECCV), Munich, Germany, 8–14 September 2018; pp. 734–750. [Google Scholar]
- Sam, D.B.; Surya, S.; Babu, R.V. Switching Convolutional Neural Network for Crowd Counting. In Proceedings of the 2017 IEEE Conference on Computer Vision and Pattern Recognition (CVPR), Honolulu, HI, USA, 21–26 July 2017; pp. 4031–4039. [Google Scholar]
- Li, Y.; Zhang, X.; Chen, D. CSRNet: Dilated Convolutional Neural Networks for Understanding the Highly Congested Scenes. In Proceedings of the 2018 IEEE Conference on Computer Vision and Pattern Recognition, Salt Lake City, UT, USA, 18–23 June 2018; pp. 1091–1100. [Google Scholar]
- Wang, Q.; Gao, J.; Lin, W.; Yuan, Y. Learning from Synthetic Data for Crowd Counting in the Wild. In Proceedings of the 2019 IEEE Conference on Computer Vision and Pattern Recognition, Long Beach, CA, USA, 15–20 June 2019; pp. 8198–8207. [Google Scholar]
- He, K.; Zhang, X.; Ren, S.; Sun, J. Deep Residual Learning for Image Recognition. In Proceedings of the 2016 IEEE Conference on Computer Vision and Pattern Recognition (CVPR), Las Vegas, NV, USA, 27–30 June 2016; pp. 770–778. [Google Scholar]
- Krizhevsky, A.; Sutskever, I.; Hinton, G.E. Imagenet classification with deep convolutional neural networks. In Proceedings of the Advances in Neural Information Processing Systems, Lake Tahoe, CA, USA, 16–21 June 2012; pp. 1097–1105. [Google Scholar]
- Chen, L.C.; Papandreou, G.; Kokkinos, I.; Murphy, K.; Yuille, A.L. DeepLab: Semantic Image Segmentation with Deep Convolutional Nets, Atrous Convolution, and Fully Connected CRFs. IEEE Trans. Pattern Anal. Mach. Intell. 2016, 40, 834–848. [Google Scholar] [CrossRef] [PubMed]
- Chen, L.-C.; Zhu, Y.; Papandreou, G.; Schroff, F.; Adam, H. Encoder-decoder with atrous separable convolution for semantic image segmentation. In Proceedings of the European Conference on Computer Vision (ECCV), Munich, Germany, 8–14 September 2018; pp. 801–818. [Google Scholar]
- Chen, L.C.; Papandreou, G.; Schroff, F.; Adam, H. Rethinking Atrous Convolution for Semantic Image Segmentation. arXiv 2017, arXiv:1706.05587. [Google Scholar]
- Chan, A.B.; Vasconcelos, N. Bayesian poisson regression for crowd counting. In Proceedings of the 2009 IEEE 12th International Conference on Computer Vision, Kyoto, Japan, 29 September–2 October 2009; pp. 545–551. [Google Scholar]
- Ryan, D.; Denman, S.; Fookes, C.; Sridharan, S. Crowd counting using multiple local features. In Proceedings of the 2009 Digital Image Computing: Techniques and Applications, Melbourne, Australia, 1–3 December 2009; pp. 81–88. [Google Scholar]
- Idrees, H.; Saleemi, I.; Seibert, C.; Shah, M. Multi-source multi-scale counting in extremely dense crowd images. In Proceedings of the 2013 IEEE Conference on Computer Vision and Pattern Recognition, Portland, OR, USA, 23–28 June 2013; pp. 2547–2554. [Google Scholar]
- Ng, P.C.; Henikoff, S. SIFT: Predicting amino acid changes that affect protein function. Nucleic Acids Res. 2003, 31, 3812–3814. [Google Scholar] [CrossRef] [PubMed] [Green Version]
- Pham, V.-Q.; Kozakaya, T.; Yamaguchi, O.; Okada, R. Count Forest: Co-voting uncertain number of targets using random forest for crowd density estimation. In Proceedings of the 2015 IEEE International Conference on Computer Vision, Santiago, Chile, 7–13 December 2015; pp. 3253–3261. [Google Scholar]
- Lempitsky, V.; Zisserman, A. Learning to count objects in images. In Proceedings of the Advances in Neural Information Processing Systems, Vancouver, BC, Canada, 6–9 December 2010; pp. 1324–1332. [Google Scholar]
- Chollet, F. Xception: Deep learning with depthwise separable convolutions. In Proceedings of the 2017 IEEE Conference on Computer Vision and Pattern Recognition, Honolulu, HI, USA, 21–26 July 2017; pp. 1251–1258. [Google Scholar]
- Sindagi, V.A.; Patel, V.M. A survey of recent advances in cnn-based single image crowd counting and density estimation. Pattern Recognit. Lett. 2018, 107, 3–16. [Google Scholar] [CrossRef] [Green Version]
- Simonyan, K.; Zisserman, A. Very deep convolutional networks for large-scale image recognition. In Proceedings of the 2014 IEEE International Conference on Computer Vision, Santiago, Chile, 8–13 December 2014; pp. 1409–1556. [Google Scholar]
- Papandreou, G.; Kokkinos, I.; Savalle, P.-A. Modeling local and global deformations in deep learning: Epitomic convolution, multiple instance learning, and sliding window detection. In Proceedings of the 2015 IEEE Conference on Computer Vision and Pattern Recognition, Boston, MA, USA, 7–12 June 2015; pp. 390–399. [Google Scholar]
- Kingma, D.P.; Ba, J. Adam: A method for stochastic optimization. arXiv 2014, arXiv:1409.1556, 2014. [Google Scholar]
- Zhang, L.; Shi, M.; Chen, Q. Crowd counting via scale-adaptive convolutional neural network. In Proceedings of the 2018 IEEE Winter Conference on Applications of Computer Vision (WACV), Lake Tahoe, NV, USA, 12–15 March 2018; pp. 1113–1121. [Google Scholar]
- Paszke, A.; Gross, S.; Chintala, S.; Chanan, G. Pytorch: Tensors and dynamic neural networks in python with strong gpu acceleration. PyTorch Tensors Dyn. Neural Netw. Python Strong GPU Accel. 2017. [Google Scholar]
- Sindagi, V.A.; Patel, V.M. Generating High-Quality Crowd Density Maps using Contextual Pyramid CNNs. In Proceedings of the IEEE International Conference on Computer Vision, Venice, Italy, 22–29 October 2017; pp. 1861–1870. [Google Scholar]
- Sindagi, V.A.; Patel, V.M. CNN-based Cascaded Multi-task Learning of High-level Prior and Density Estimation for Crowd Counting. In Proceedings of the 2017 14th IEEE International Conference on Advanced Video and Signal Based Surveillance (AVSS), Lecce, Italy, 29 August–1 September 2017; pp. 1–6. [Google Scholar]
- Liu, X.; Weijer, J.V.D.; Bagdanov, A.D. Leveraging Unlabeled Data for Crowd Counting by Learning to Rank. In Proceedings of the 2018 IEEE/CVF Conference on Computer Vision and Pattern Recognition (CVPR), Boston, MA, USA, 18–23 June 2018; pp. 7661–7669. [Google Scholar]
© 2020 by the authors. Licensee MDPI, Basel, Switzerland. This article is an open access article distributed under the terms and conditions of the Creative Commons Attribution (CC BY) license (http://creativecommons.org/licenses/by/4.0/).


