1. Introduction
In agricultural production, soil, seed and water are basic requirements. Additionally, sunshine, insecticides, fertilizers, suitable climates and human labors are also needed. Of all these, water appears to be the most important requirement of agricultural management. The main impact of irrigation is in terms of the increased agricultural yield. These results affect different human environments, like social, cultural, economic and political, besides the agricultural development.Therefore, many studies are being conducted worldwide to improve and sustain water resources.
In India, the irrigated area consists of about 36% of the net source area. Presently, the agricultural sector account for about 83% of all water uses. Tamil Nadu covers 4% of the geographical area (13.01 million hectares) and caters to 5.96% of the population of the country with 7.21 crores people living along the 17 river basins. Tamil Nadu is a water stressed state and depends heavily on ground water for irrigation. There are various types of systems of irrigation practices in different parts of Tamil Nadu. Direct irrigation method and storage irrigation method, various types of irrigation techniques differ in the way that the water is obtained from the source and distributed within the field. In general, the goal is to supply the entire field uniformly with water, so that each plant has the amount of water it needs, neither too much nor too little. In olden days, irrigation in Tamil Nadu is carried out through gravity irrigation and lift irrigation.
In Tamil Nadu, ground water is considered as a main resource for irrigation. Here, the canal irrigation system is an important primary need of agriculture. It increases the groundwater level. Nowadays in India, ground water is used in the agriculture sector. In drought prone areas, the groundwater level is decreased, because of the rise in the population, development of industries, illegal well pumping, etc. These facts, along with recent drought, led to severe decrease of the groundwater level, especially the drought prone areas. In order to reduce this problem, the initiation of groundwater recharge research can be suitable solution. The water distribution system will help recharge ground water table and benefit farmers in Coimbatore, Erode and Tirupur districts.
2. Literature Review
There are several methods followed in MCDM techniques. See (
Table 1), a brief account of some important studies in MCDM methods related to our proposed methods.
Multi-criteria decision making (MCDM) is the process of selecting the most satisfactory optimal solution from a set of assorted types of criteria. One of the extension of fuzzy set is known as HFS, here decision makers psychological behavior are taken in to account when giving membership function. HF was introduced by Torra. Researchers have recently developed and made decisions that make decisions that are unclear and uncertainties in order to find solutions to practical issues recently. Kuang et al. (2015) [
23] approached grey numbers to handling uncertainty in MCDA. Zhang et al. (2019) [
24] described a MCDM problem in a fuzzy covering approximation space by the method of TOPSIS. Zhan et al. (2018) [
25] contributed to the field of fuzzy set theory by proposing some methods that benefit from some novel fuzzy rough set models. Chang, (2014) [
26] studied VIKOR method with linguistic variables parameterized by triangular fuzzy numbers for evaluating the hospital service quality under a fuzzy environment. In multi-objective optimization technique, MOORA procedure is one of the simplest method for selecting best alternative Stanujkic (2014) [
27]. Chen, (2000) [
28] proposed the compromised solution of fuzzy decision matrix in linear case. Farhadina, (2013) [
29] proposed several types of ranking method for hesitant fuzzy values for multiple attribute decision making.
Aggarwal, (2015) [
30] proposed new weight finding technique, here weights are calculate through its preferences. Torra, (2010) [
31] introduced Hesitant fuzzy set and its properties. Xu et al. (2011) [
32] developed some important aggregation operators and distance measure for aggregating the fuzzy information in MAGDM problems by use of HFS. Wu et al. (2018) [
33] developed compromise solutions for MAGDM under HFLTS. Xia and Xu, (2011) [
34] developed some aggregation operator for correlation of HFS. Kaya et al. (2019) [
35] reviewed some MCDM methodologies in energy policy making. Moradian et al. (2018) [
36] compared some MCDM methods MOORA, TOPSIS and VIKOR.
In water resource management various mathematical methods are developed with fuzzy decision making, like an interval-based fuzzy chance constrained have been developed for water allocation with double-sided fuzziness by Lee (2000) [
37]. In water management, water supply is an important role and scope of improvement in farmers water management decisions. Nowadays many water-saving irrigation models have been developed extremely in many areas. In agricultural water productivity, improving irrigation efficiency is becoming more important, therefore shallow groundwater plays an important role in irrigation water productivity. Some studies have reported a number of problems in irrigation districts. Irrigation has been developed as a strategy of reduce poverty and improve household income. Bjornlund et al. (2019) [
38] found the relationship between household decision-making and farm household in small-scale irrigation schemes in southern Africa. In the field of water management, irrigation district managers and farmers used few useful tools like artificial intelligence techniques to forecast irrigation depths at farm level in pressurized irrigation networks project investment. In many water resources problems, DM is the process of choosing and deciding the water supply scheme under the technical and operation risk. Fu et al. (2009) [
39] used fuzzy comprehensive model based on entropy weight to project investment. In order to reduce the water demand in drought prone areas, a hybrid TOPSIS-agent-based model is developed to find a solution for this problem (Ghazali et al., 2018) [
40].
At present, Tamil Nadu Government is taking new initiatives to provide electricity to the irrigation of agricultural produce in the drought prone areas. It is therefore imperative to analyze the water distribution system for these reasons and to choose the best water distribution system and sort the selected ones according to their importance of criteria. Hence irrigation management is aimed at obtaining electricity from renewable energy, which will be available throughout the year (Senjyu et al., 2005) [
41].
In recent times, floods and droughts in various parts of the world are causing serious problems (Ding et al., 2014) [
42]. Donaldson, (2013) [
43] developed a modernization of irrigation scheme. Opricovic and Tzeng, (2004) [
44] addressed the water management problem and gave the compromise solution of MCDM problem by the compared analysis of VIKOR and TOPSIS method. The reutilization of treated waste water for irrigation purposes is becoming more widespread in many drought prone places around the world. In varies countries, various water bodies and ground water irrigation companies have identified drought-prone areas in different districts. In all countries, many water saving irrigation models have been developed extremely in many areas. For example, in China, irrigation water management evaluated and released the new model for analyzed the investment decision making of water saving irrigation project (Fu, 2007) [
45]. In order to evaluate the ground water resources, the mathematical tool of Grey relational model based on AHP weight is used for applied to evaluate ground water resources carrying capacity of irrigation district (Gu and Xu, 2011) [
46]. It is desirable to create a sustainable water management system that will integrate multi-objective restructuring operation in balancing the water demand and balance of water concentration project in drought-prone areas. In recent years, there are several fuzzy control technology was separately studied in irrigation systems (Zhang et al., 2018; Walker et al., 2015; Jiang et al., 2020 [
47,
48,
49]). Therefore, in this research paper, we choose the HFMCDM method has been adopted as a best method in irrigation water management systems.
3. Motivation and Contributions
3.1. Motivation and Objective
Generally, in a water management plan, the selection of projects that involve a number of criteria is implemented under the problem solving section of MCDM. The motivation of this research paper is to provide these decision makers with potential value when making their decision-maker role in a problem-solving environment. These potential values represent the hesitant ambiguous elements of the decision maker. Therefore, to cope with the complexity of the many criteria in this complex problem, which are implemented to meet groundwater and drinking water requirements for drought-prone areas, the decision-maker is allowed to give his or her contribution by several possible values. Therefore, our main motivation of this research paper is to determine the best water supply system through MCDM system with hesitant fuzzy situation. Moreover, in this research paper, we extent the SDV weight finding method in hesitant fuzzy environments, and propose the three MCDM methods with this extended standard weight detection method to find the weights of the five criteria described in the review of literature, since the five weights are selected in hesitant fuzzy environments. In well-known and practiced multi criteria decision-making methods, weight detection methods with the standard deviation method did not consider the hesitant fuzzy situation. In order to fill this gap found in the literature, the present research article proposed three multi-criteria decision making systems with hesitant fuzzy scenarios: HFSDV-MOORA, HFSDV-TOPSIS and HFSDV-VIKOR. We have also analyzed the two cases in terms of the importance of the criteria in the sensitivity analysis.
3.2. Contribution
Our main contribution of this work is that it can capture hesitation thoughts of decision maker. Choosing the best water supply system for drought prone areas involves problem solving methods. In choosing the best water supply scheme, a special mathematical set theory is required in MCDM technique to give value to the hesitant and ambiguous thoughts of the decision maker. For our contribution to this article, we have chosen the hesitant fuzzy set introduced by Tora, (2010) [
31] and used it in the selection of water supply for drought prone areas along with the MCDM system. We have used a hesitant fuzzy set with the SDV weight finding technique in the weighting area, which is considered an important part of the MCDM method used here. Another important part of the MCDM system is the use of the hesitant fuzzy set in the MOORA mode in the ranking area. Therefore, our contribution includes the HFE in the selection of the best water supply system.
The well-known MCDM techniques with hesitant fuzzy environment: MOORA, TOPSIS and VIKOR are used to select the best water distribution system of drought-prone areas.
The first proposed method is to weights the criteria via extended standard deviation weighting technique, called as HFSDV-MOORA.
The second proposed method uses the extended standard deviation weighting technique to assign weights to the criteria under HFSDV-TOPSIS.
The third proposed method uses the extended standard deviation weighting technique to assign weights to the criteria under hesitant fuzzy environment in order to give a compromise solution, because it provides a maximum “group utility” of the “majority” and a minimum of the individual regret of the “opponent” called as HFSDV-VIKOR.
The ranking result concluded that the proposed SDV-MCDM methods have outperformed the existing WEM-MCDM in the literature review by giving compromise and best solution.
The comparison study shows that the proposed three methods(SDV-MOORA, TOPSIS, VIKOR) with hesitant fuzzy environment have perfect ranking.
The sensitivity analysis is to analyze the ranking order when changing the significance of objective weights by making two cases.
Testing and analyzing the two cases of sensitivity analysis with our proposed MCDM methods and provide the ranking order of comparison study of this sensitive part. And also test the correlation co-efficient between the proposed HFSDV-MOORA, HFSDV-TOPSIS and HFSDV-VIKOR by use of Spearman’s rank correlation method.
Our methods provide the best alternative water distribution system for the ground water irrigation scheme.The solution is rectifying the water problem in drought-prone areas of selected three district. Moreover, we compare our proposed SDV hesitant fuzzy MOORA method with some research articles Li, (2014); Xu, (2013); Liao, (2013) [
50,
51,
52]. And also compared our proposed weight finding results with entropy weights.
This research paper, we make water distribution system as a numerical problem for selecting the best alternative by use of HF-MCDM method. In Comparison section, we analysis our result with the correlation coefficients results. Discussion and conclusion are given in the final section.
4. Preliminaries
Definition 1. Let T be a finite reference set, a HFS A on T is in terms of a function when applied to T returns a subset of Torra (2010), which is described as the follows,where is a set of some values, which is in , denoting the possible membership degrees of the element to the set A; Here, hesitant fuzzy element (HFE) is denoted as . Example 1. Let and let , and considered as the three hesitant fuzzy elements of to a set H. Here, hesitant fuzzy set (HFS) is described as follows, Definition 2. Given three HFEs represented by h, , are define by Torra (2010) and Xia and Xu (2011) the following operations: Definition 3. For a HFE , the score function is defined as follows Xu and Xia (2011):where . Based on score function it is possible to make ranking of HFEs according to the following rules:
, if ;
, if ;
, if .
and are two elements in HFEs.
5. The MCDM Methods in Hesitant Environment with Standard Deviation Weights
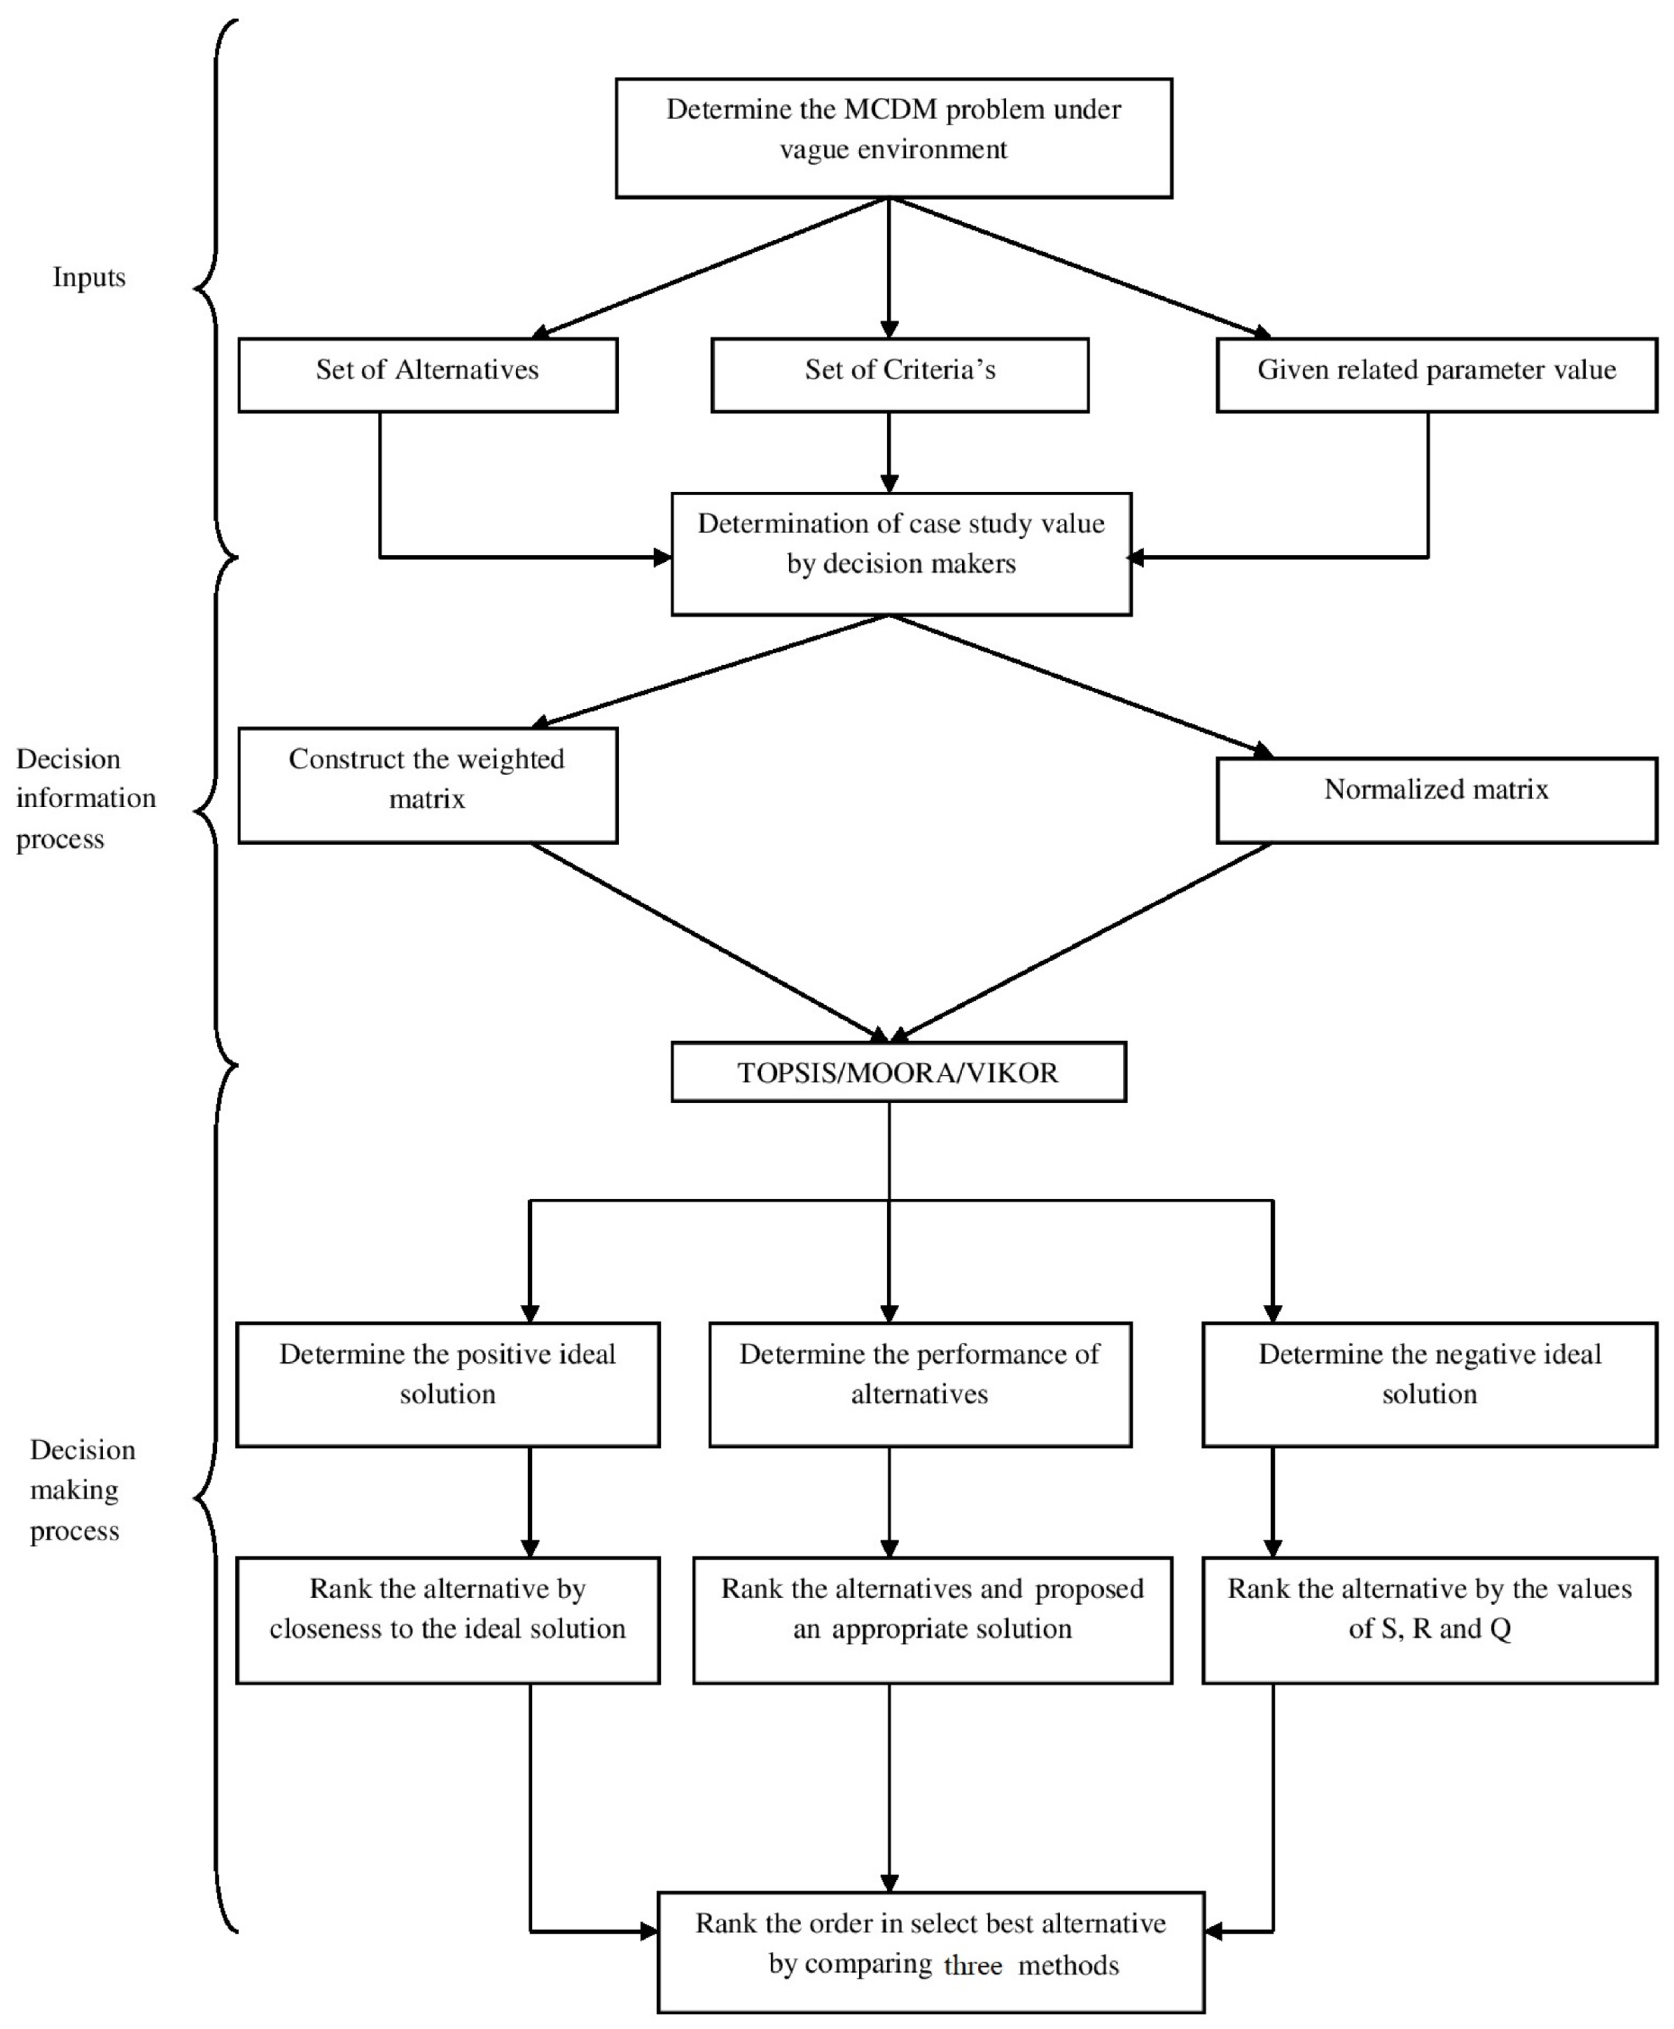
The proposed method can be seen in
Figure 1. It consists of three methods, namely hesitant fuzzy MOORA, hesitant fuzzy TOPSIS and hesitant fuzzy VIKOR with hesitant fuzzy standard deviation, which will be briefed in the following subsections.
5.1. HFSDV for Calculating Criteria Weights
In MCDM technique, the standard weight finding method measures the weights of each of the selected parameters, based on the standard deviation. In this section, we extend the weight finding method of SDV (Santawy and Ahmed, 2012) [
9] in hesitant fuzzy environment. The time of weight comparison, purpose of standard deviation was used to transform different scales and units among various criteria into common measurable units.
The score of HF number reflects the degree of ambiguity, we can calculate the SDV through hesitant fuzzy number score and then obtain the criteria weights. Let
be a set of
n alternatives,
be a set of
m criteria. The hesitant fuzzy decision matrix
H can be written as:
In this research paper, proposed SDV method under HF environment is used to manage hesitation situation of the decision makers in the selection of evaluation criteria. The algorithm of hesitant fuzzy SDV (HFSDV) as follows:
Step 1: In first, construct the score matrix (SM) by using (Definition 3), we get score values of given hesitant fuzzy elements.
here, max
denoted as maximum values of the criteria and min
denoted as minimum values of the criteria
j. Then, SD of each criteria is calculated by use of the following formula.
Here,
is the average values of
criterion and
. The weight of each criteria can be calculated as,
where, m denotes the number of indicators;
,
.
5.2. HFSDV-MOORA
Consider, water distribution system selection problem. Here, we consider m as alternatives and criteria . And proposed SDV-MOORA algorithm is framed with hesitant fuzzy elements (HFE).
Step 1:
Frame the HFDM. Here, the hesitant elements values are in acceding order. It is shown in the following
Table 2.
Step 2:
Determine score matrix of Hesitant fuzzy matrix, the score value is determined by use of Equation (
1).
Step 3:
The process of normalization is framed in to a range of [0, 1] by use of the following equation,
here,
denotes the hesitant fuzzy normalization matrix (HFNM) for
alternative and
criteria, here
and
.
Step 4:
Next we calculate the criteria weights by use of hesitant fuzzy preference value
,
and
respectively. Then, the score hesitant fuzzy (HF) preference
of each alternatives with respect to each criteria can be calculated by use of Equations (3) and (4). Therefore, the numerical water distribution problem can be clearly formated in the following resultant matrix format
Step 5:
The HF beneficial and non-benefcial criteria are denoted as
and
respectively. Finlay, the performance score (PS) of all alternatives is founded as
. It is calculated by use of hesitant weighted sum of beneficial and non-beneficial criteria.
where, m refer the number of criteria and it is to be maximized; n-m denotes the number of minimized criteria; weights of criteria is
.
In some situation, if we assume equal importance to all criteria than the proposed HFSDV-MOORA optimization algorithm becomes,
Step 6:
Based on performance score, we rank the each alternative . The best is select by the highest value of performance score value.
5.3. HFSDV-TOPSIS
Technique for Order Preference by Similarity to an Ideal Solution (TOPSIS) can be used to rank the different alternatives to the selected criteria. In the TOPSIS approach, an alternative that is nearest to the FPIS and farthest from the FNIS is chosen as optimal Beg and Rashid, (2013) [
12]. TOPSIS method is used for MCDM where the decision makers opinions about the criteria values are expressed in hesitant fuzzy values.
Step 1: Construct normalized score matrix
.
where
i = 1, 2, ...,
m and
j = 1, 2, ...,
n.
Step 2: Construct the weighted normalized matrix by multiplying each column of the normalized matrix by its associated weight.The weight values are find by using (4). Hence we get a new matrix
where
and
.
Step 3: Find the positive ideal solution (PIS)
Step 4: Find the negative ideal solution (NIS)
Step 5: Determine the separation from positive ideal solution
where
.
Step 6: Determine the separation from negative ideal solution
where
.
Step 7: Calculate the relative closeness to the ideal solution
where
and
.
Step 8: Based on the decrease order values of closeness to the ideal solution, alternatives are ranked from higher value to lower value.
5.4. HFSDV-VIKOR
The VIsekriterijumsko KOmpromisno Rangiranje (VIKOR) method was developed as an Multi-Criteria Decision Making (MCDM) method to solve a discrete problem with conflicting criteria. The purpose of this method is to determine a feasible solution for ranking criteria. This VIKOR method is used for MCDM where the decision makers opinions about the criteria values are expressed in hesitant fuzzy values Oppricovic et al. (2004) [
44].
Step 1: Construct normalized score matrix
.
where
and
.
Step 2: Calculate the positive ideal solution (PIS)
Step 3: Calculate the negative ideal solution (NIS)
Step 4: Calculate utility measures
. The weight values are find by using (4).
Step 5: Calculate utility measure(S) and regard measure(G) for each alternative
Step 6: Computation the index value
ith alternative as follows,
where
,
,
,
Step 7: These values are sorted by rank, it is based on S G and Q in decreasing order.
Step 8: Consider the alternative i, corresponding to as a trade-off solution if the two conditions given below are satisfied:
. Acceptable advantage:
, with n alternatives.
. Acceptable stability:
If condition is not met with, then a set of alternate solutions are proposed that consist of:
(i). Alternatives , where = only if the condition is is not satisfied.
(ii). Alternatives , , ..., if the condition is not fulfilled; is determined by the relation < for max k, where .
In ranking alternatives, the most preferred alternative should be select to the positive ideal solution for maximization criteria and will negative ideal solution for the minimization criteria.
6. Study Area
We consider drought prone areas of surrounding three districts viz. Erode, Coimbatore and in Tirupur, Tamil Nadu, India. Precipitation is just source of ground water and is separated as open well and bore well for irrigation.
People living in these regions are with agriculture as the fundamental occupation. Because of borewell burrowing and whimsical pumping of water by the populace, water table in the local has gone down enormously from 600 to 1500 feet underneath the ground level. Utilizing engine pumps brought about substantial utilization of electricity. Since water is exhausting at a quick pace, these disturbing circumstance soon will cause a man made calamity. It also will be an irreversible harm to environment and living condition. For rectifying this issue, we acknowledge the course of action from surplus water of Bhavani river.
Athikadavu-Avinashi drinking water supply-cum-irrigation scheme, which aims at managing the water resources in the Kongu region of Tamil Nadu. Athikadavu-Avinashi drinking water supply-cum-irrigation scheme focus to reroute the surplus water of Bhavani river to the lakes, ponds and other water bodies in the drought-prone zones of Coimbatore, Tiruppur and Erode districts as a lift to their ground water level. Around 1.5 TMC(Thousand Million Cubic) of surplus water will be pumped from the Kalingarayan anicut and used to fill the 32 tanks of the Public Works Department, 42 tanks of the Panchayat unions and 971 ponds in the three districts.
River Bhavani, a tributary of Cauvery, is a perennial river that rises in the Nilgiris. The river reaches Pillur dam before joining Cauvery in Erode district in Tamil Nadu and continues its journey to drain into the Bay of Bengal. Bhavani river majorly flows through Coimbatore and Erode districts and is a major resource for irrigation in West Tamil Nadu. The Bhavani river is fed by the rains received mainly during the southwest monsoon, which causes the river to swell during June-September season and flood its banks. Though Pillur dam and Bhavanisagar dam help in avoiding high water flow in the river during monsoon, more often than not, the dams also reach full capacity, leading to flooding downstream due to the shutters being opened. For conducive to overflow and wastage of water due to dams reaching full capacity. To avoid this, the Athikadavu—Avinashi project was proposed [
53,
54,
55,
56,
57,
58,
59,
60].
In this paper, we selecting the issue of ground water irrigation as a mathematical problem. Here we make a decision about this problem. For that we select decision making process, because decision making provides excellent way to prefer the best alternative from selected alternatives. Here four alternatives are selected depending on various criteria like social, economics, environmental, effectiveness and technical operations. Towards this, we use MCDM method.
In this case, decision making procedure could be unfairly impacted by the information both while assessing alternatives and thinking about gaining from experts. Thus, in an uncertainty decision condition of MCDM process, the experts advice to use the vague set theory. In an accurate way to reflect upon the information given by the different experts, the information is displayed in the type of hesitant fuzzy elements. The root map of water distribution system of selected drought prone areas are shown in
Figure 2.
Hence, a HFMCDM approach has been used based on our proposed methods.
Description of Problem
The study area consists of four water distribution methods for drought prone areas. Different water resource methods were used in various studies in setting the criteria on decision model. Since the aim of the mathematical problem is to find one of the best water distribution method for water irrigation system, we identify four alternatives and five criteria.
The criteria are separated in two categories viz., the qualitative criteria and the quantitative criteria. The information of criteria are collected through field surveys, questionnaires from the public and interviews of the representatives of the affected region.
The Alternatives are:
Comparison when the water transported through this closed concrete pipe line system, the speed of water is uniform, making it an ideal way to distribute feeder water to the pools and ponds located in the panoramic union of each creek. It is also a closed system of transporting water. So water theft and water pollution are unlikely. In addition, the panels that are used in this project can be combined into a series of maps and pipeline through the agricultural lands. So that every village can be used in conjunction with this scheme. It is also considered a cost effective pipeline system to reduce the water transport distance. In this system, the conversation is considered the best alternative system. Since pits are placed beneath the agricultural land and buried in the closed concrete pipeline and carried to the water, thereby causing no harm to agricultural land and agriculture.
In this alternative, closed concrete pipes are consider and laid along the road sides of national highway. The national highway to suit drinking water supplies. Moreover the national highway is the best choice when it comes to drinking and sewerage purposes. The water distribution system along the national highway has to be explored on a number of issues as we examine the criteria taken in this research article. Because of the bridge and road safety systems are found on the national highway, this is considered to be risk of the water distribution system. And it has to be up while receiving permits from the officials of the national highway. Further, the decision to construct this water supply system is important considering on environment safety, costs and the maintenance.
In our research work, the open canal system with concrete will be considering one of the alternatives. The water supply system with concrete structure on either side of the open canals is consider to be very effective for evaporation loss, seepage, theft of water by illegal pumping. Although this type of water distribution can be seen to be better for agriculture and groundwater recharge. This alternative need to be explored in terms of social acceptance, costs, environment and maintenance.
The first consideration is when water is transported through an open canal system, which may be used for certain factories rather than for cultivation of agree land and groundwater recharge. This distribution structure is only considered suitable for seasons where the water source is high. When viewed positively, there is a possibility that groundwater will rise in the area on both sides of the canal along the way through agricultural land. When viewed negatively the cost of safety and maintenance of this water distribution system will out weight the other alternative. Also open canal system through agricultural land can result more land actuation.
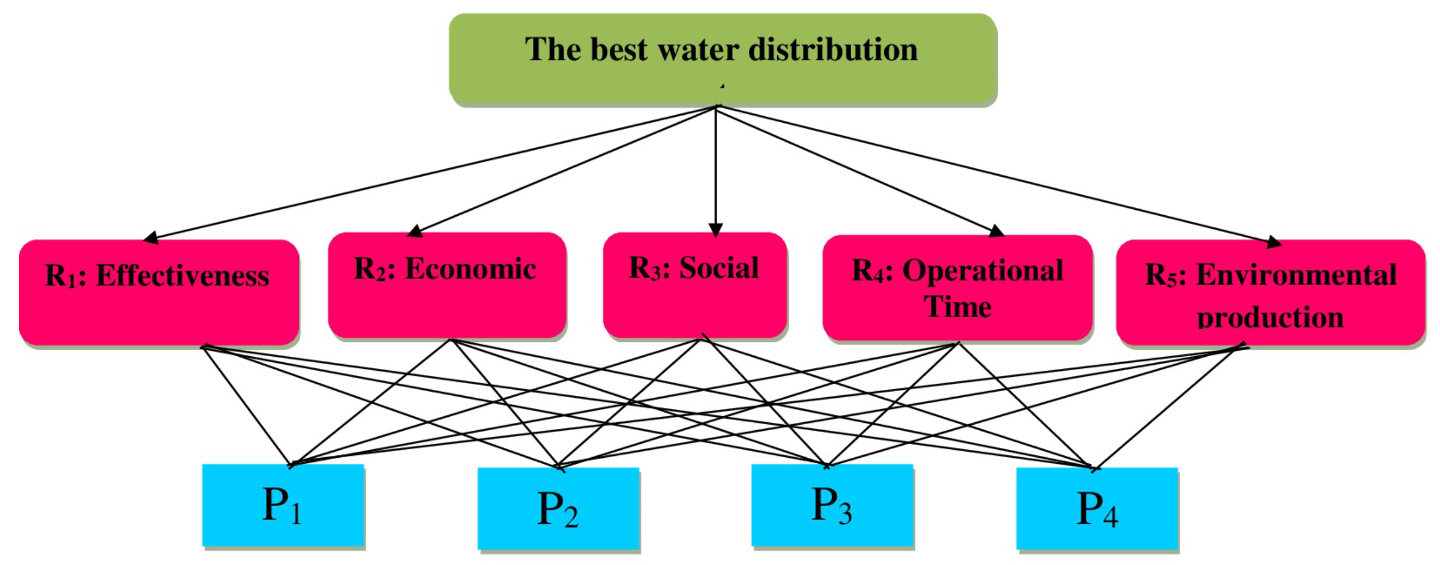
The description of the alternatives are shown in
Figure 3. For evaluating these four alternatives we select five criteria on the basis of expected impacts of canal improvement, and from opinions of public sectors include farmers’ benefits of the concerned districts.The hierarchical structure of selected criteria are shown in
Figure 4.
The criteria are:
This criterion solves the amount of minimizing risk due to the application of the scheme. The effectiveness criterion is a quantitative criterion. The critical assessment model is to improve the living condition of the people in the drought prone area to improve the current situation of the selected location.
In the economic criteria, we consider rural income and increasing employment opportunity. It is also concentrated among poor agricultural production, poor income, poor standard of living and poverty.
The improvement of dynamic crop production, the increase in livestock capital and build up of processing industries are encouraged also from the improvement of infrastructures.
Social criterion helps assess the level of attitudes of people in the selected area and the rate of the urbanization in the region. This qualitative criteria is based on sale of land, entitlement and migration.
This quantitative criterion is one of most difficult criteria to compare the others. This technical operation time considers the risk of selected water distribution method. The possibilities for using renewable energy sources to be taken from the river to project need to be examined.
Environmental production should be constructed in a way that does not affect people in the environment and to promote the environment. This production among ground water should be unpolluted at the same time it should increase the groundwater level.
7. Numerical Evaluation
In this section, we make a numerical evaluation from the study area. In the drought prone ares of three district, they have planned four types of water distribution system. Here, we consider these four types of water distribution system as the alternatives. The four alternatives are (Closed concrete pipes laid along agricultural land), (Closed concrete pipes laid along roadsides of national highway), (Concrete canal through agricultural land) and (Earthen canal through agricultural land). These four alternatives choose based among the following five criteria. (Effectiveness), (Economic), (Social), (Operational time) and (Environmental production).
The
is the matrix whose elements reveal the value of different alternatives for the respective criteria. The index
i denoted for different alternatives, while the index
j denoted for the different criteria.
Table 3 shows the numerical calibration for the study area.
The hesitant fuzzy decision matrix (HFDM):
Calculation of HFSDV and HFSDV-MOORA:
Step 1:
We determine the hesitant score matrix (HSM)
based on Equation (
1).
Step 2:
We construct the normalized matrix by using (5).
Step 3:
The hesitant SDV for all criteria are calculated by using (3).
Step 4:
By using Equation (
4), we calculate each criteria weights as follows and the resultant values of weighted criteria are shown in the following
Figure 5Step 5: Here, the HF- benefcial and HF-non benefcial criteria value are calculated by using (3) & (4). Here, Effectiveness
, Social
and Environmental production
are the benefcial criteria; Economic
and Operational time
are the non-benefcial criteria values are give as follows,
The weighted normalization matrix is calculated as follows,
Then, determine The performance of alternative values are determined with benefcial and non-benefcial criteria by using (6). The resultant values are presented as follows,
, , , .
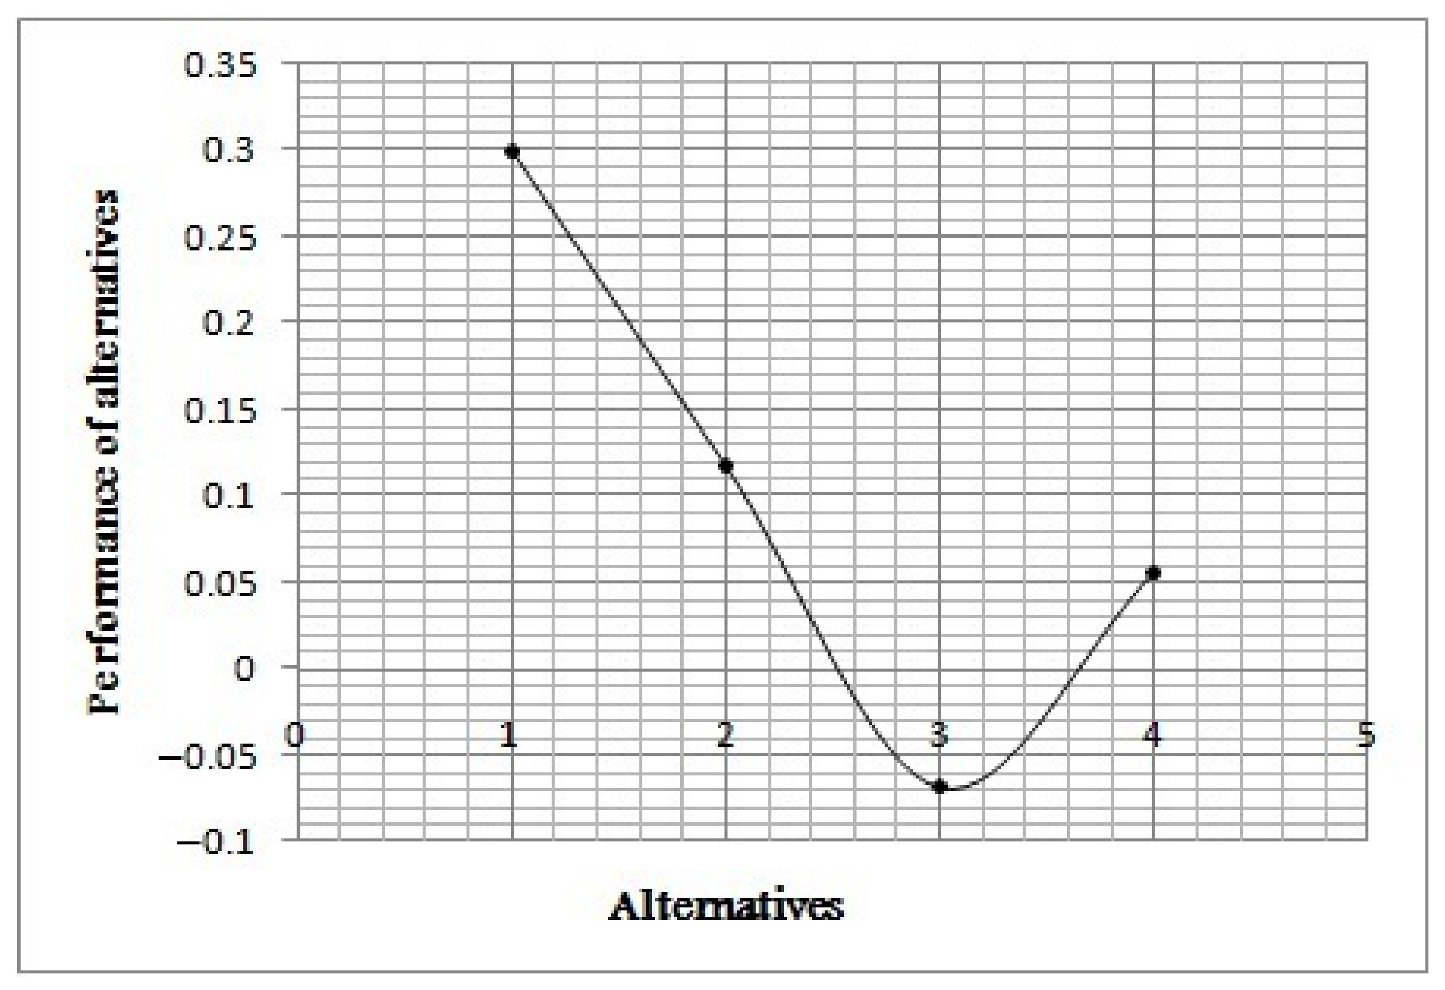
Step 6: By use of performance of alternatives, the selected alternatives are ranked in decreasing order. The resultant alternative values are shown in
Table 4. Here,
is considered as one of the best water distribution system. Also, the result is shown in the
Figure 6. Thus, we conclude that one of the most suitable water distribution system is Closed concrete pipes laid along agricultural land.
Calculation of HFSDV-TOPSIS:
Step 1:
In first, the hesitant score matrix (HSM) is framed by use of selected hesitant fuzzy values based on (1).
Step 2:
Next, the normalize score matrix (NHSM) is calculated by use of (8).
Step 3:
Weights of selected criteria are calculated by using (4) the hesitant fuzzy standard deviation weights are mentioned above in (23).
Step 4:
Then the hesitant normalized score matrix is multiply by standard deviation using(9).
Step 5:
Utilize Equations (10) and (11) to calculate the hesitant fuzzy positive ideal solution
and negative ideal solution
. The result of positive and negative ideal solution are shown in
Figure 6.
Step 6:
Utilize Equations (12) and (13) to calculate the separation measures alternative from the hesitant fuzzy positive ideal solution
and negative ideal solution
. The separation measures of positive and negative ideal solution are given as follows,
Step 7:
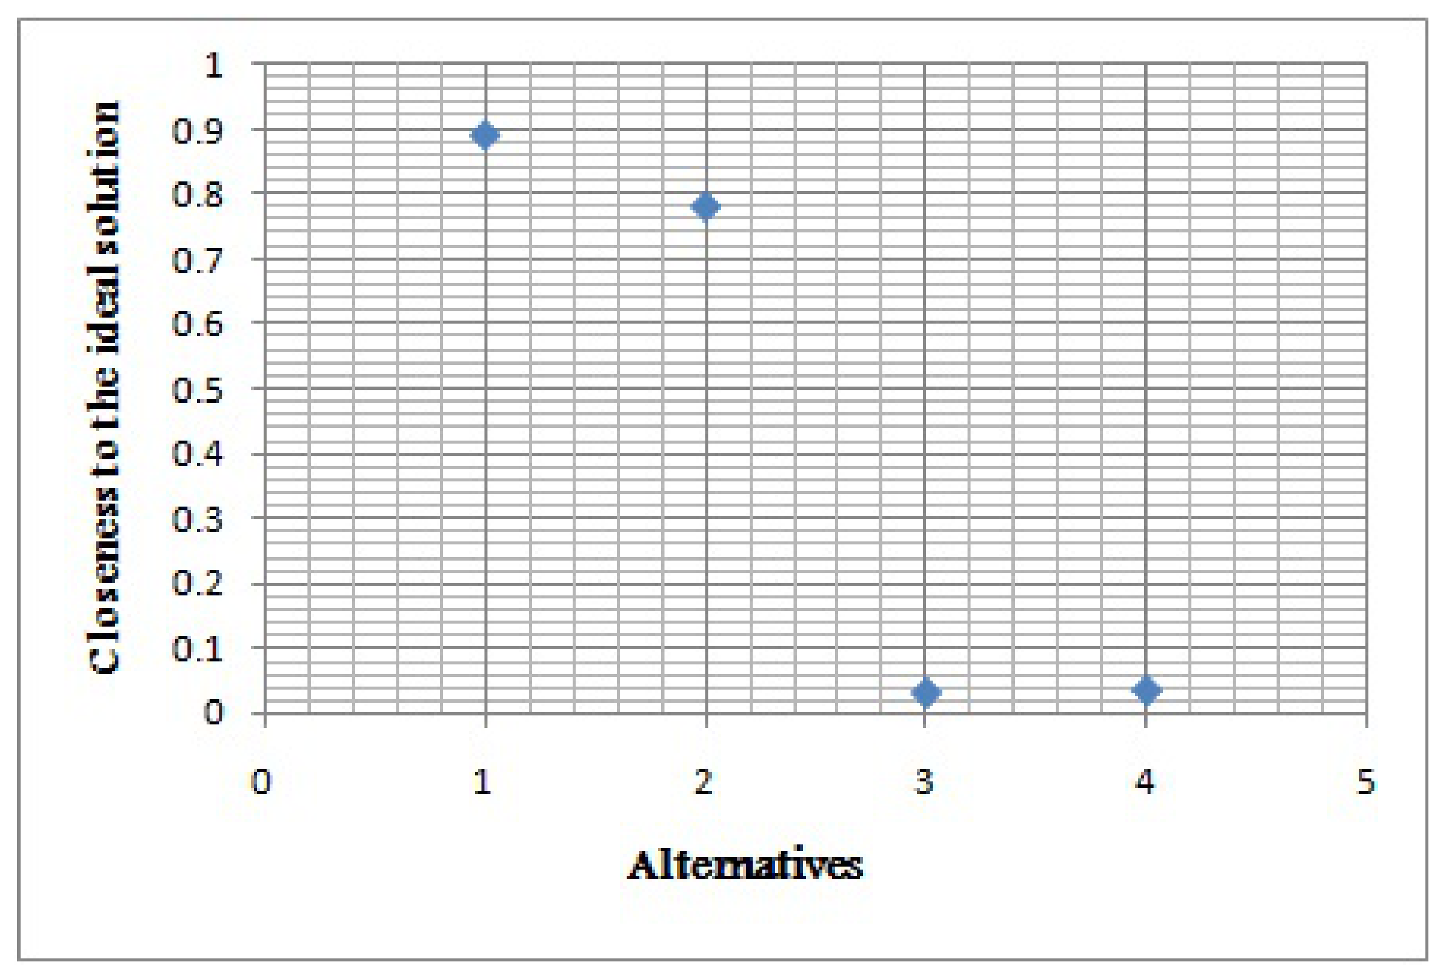
Utilize equation(17) to calculate the relative closeness coefficient of an alternative
with respect to the hesitant fuzzy positive ideal solution
Rank the alternatives according to the closeness coefficient:
Thus the highly preferable alternative is
so, closed concrete pipes laid along agricultural land is best for the selected problem. The result of TOPSIS values are shown in
Figure 7.
Calculation of HFSDV-VIKOR:
Step 1:
By using normalized score matrix with hesitant fuzzy elements, we calculate each positive and negative ideal solution of (16) and (17).
Step 2:
The utility measures for the founded score matrix
is determined by using (21) given in the following
Table 5.
Step 3:
We determined the regret measures (
G) by using (22).
Step 4:
Here, we determined utility measures (
S) by using (23).
Step 5:
And, we determined the value of index
for each selected alternative by using (24).
Step 6:
Finally, rank the alternatives by use of Q value in decreasing order, it gives
Here,
is best alternative for selected water distribution system. The final results are given in
Table 6. The result of regret measure
, utility measure
and index value
as shown in
Figure 8.
Step 7:
According to the condition
in
Section 5.4, We can get,
According to the condition
in
Section 5.4, rankings of S and R coincide with the classification of Q and thus satisfies the condition
.
8. Comparison Analysis
In this comparison part, we give some detailed comparison analysis between our proposed HFSDV-MCDM methods with the existing HFWEM-MCDM methods.
In weight detection techniques, the SDV method is considered the best method compared to the WEM method because the SDV weighing system that distributes the weight between the selected criteria.The standard deviation weight is appropriate to provide the most stable weights for the basic criteria of effectively selecting the options available at the end of the problem solving process. Therefore, in MCDM techniques, the SDV weighing method is better than the WEM method in the case of the efficient approach.
we compare the ranking results of proposed HFSDV-MOORA with existing HFWEM-MOORA, HFSDV-TOPSIS with HFWEM-TOPSIS and HFSDV-VIKOR with HFWEM-VIKOR, the results give the same ranking order. The comparison ranking results are given in the
Table 7 and
Table 8, from these comparison table, the four alternative ranking of proposed hesitant fuzzy MCDM methods with standard deviation weight finding technique is perfectly parallel to the sequence of existing hesitant fuzzy MCDM with weighted entropy measure weighting technique. Also the final results are shown in the following
Figure 9,
Figure 10 and
Figure 11. And also it exposed the reliability and authenticity of our proposed method. From the comparison
Table 7, the ranking places of proposed HFSDV-MCDM method is as follows,
In HFSDV-MOORA
In HFSDV-TOPSIS
In HFSDV-VIKOR
Moreover, in HFWEM-MCDM methods, the ranking results having minor differences when comparing MOORA with another two methods TOPSIS and VIKOR. In VIKOR method (
is prefer than
). In HFSDV-MOORA,
is prefer than
. The reason for the smallest difference is that, in MCDM problems, criteria weights are make an important role. Here, the weighting of criteria reflects their relative importance in the DM process. While the calculation of HFWEM-MOORA method, the ratio analysis gives importance of both beneficial criteria and non-beneficial criteria. In HFWEM-TOPSIS and HFWEM-VIKOR the ranking results are depends on the closeness to the “ideal” solution. Based on the comparison
Table 7, the ranking order of existing HFWEM-MCDM is as follows,
In HFWEM-MOORA
In HFWEM-TOPSIS
In HFWEM-VIKOR
The ranking result for each alternative is shown in
Table 8.
In this analysis part, Spearman’s rank correlation method Myers, (2006) was utilized to calculate the correlation coefficients between proposed MCDM methods with SDV weights. The resultant values are shown in the following
Table 9.
It’s shows that in this part, the value of correlation coefficient between all proposed methods gets the value 1, this is the value of high score of correlation coefficients. It shows that the proposed methods get perfect similar ranking results. The Spearman’s rank correlation method was utilized to find the correlation coefficients between comparison methods with WEM weights. The results are shown in the following
Table 10.
It’s shows that in this part, the value of correlation coefficient between all comparison methods gets the value 0.8, this is the acceptable score of correlation coefficients. It shows that the proposed methods get slightly similar ranking results. This test demonstrates the validity and reliability of our proposed methods.
Li, (2014) has already proposed the HF-MOORA for MCGDM, here we compare our HF-MCDM ranking results with proposed SDV weights with Li, (2014), the comparison results have been showing in the following
Table 11.
From the comparison table, we can see the SDV weights altered the ranking results of Li,(2014). And also he propose hesitant fuzzy MOORA method for group decision making. Here, we consider the hesitant fuzzy MOORA under single decision making problem.
Moreover, here we compare our HF-MCDM ranking results with proposed weights with Xu and Zhang, (2013). The comparison results have been showing in the following
Table 12, and the proposed standard deviation weights are altered the ranking results as follows.
And also we compare our HF-MCDM ranking results with proposed weights with Liao and Xu, (2013), the comparison results have been showing in the following
Table 13.
9. Sensitivity Analysis
In this sensitivity part, sensitivity analysis is conducted to investigate the impact levels of objective criteria weights. Our main purpose of sensitivity analysis is to analyze the ranking order when changing the significance of objective weights. When changing the importance of selected criteria, we have explain that what changes are happened in the order of alternatives and here, it has been showed by sensitivity analysis.
In our research paper, the sensitivity analysis is shown through following two cases.
Case 1: Equal importance for assigning weights: positive criteria = 0.5 and negative criteria = 0.5.
In our selected water distribution system problem, we have to analyze the alternatives belonging to the five criteria. In these considered criteria, effectiveness(
), social(
) and environmental production(
) are viewed as positive criteria. And economic(
), operational time(
) are taken as negative criteria. In this Case, the decision-maker selects the best water supply for drought-prone areas, with an emphasis on equity for two negative criteria, the cost and the time to select the best water distribution system. For this case, both positive and negative criteria have consider equal influence and obtain weight values. The weight values of the each criteria is assumed to be as follows,
for each criteria
,
,
,
and
respectively.
The weight values obtained at the end of this case are used in our proposed MCDM methods and the data results are shown in the
Table 14. And also the ranking result of this case are shown in the
Figure 12.
Case 2: Assigning weights when importance to positive criteria: positive criteria= 1 and negative criteria = 0.
We analyses here on basis of influence of criteria and measure of effectiveness when only positive criteria have maximum weights and others are in minimum weight. In other words, the sensitivity analysis is done by setting the values of positive criteria as 1 and for negative is 0.
In the case of water distribution application, we need to examine the back ground of several criteria to select the best water distribution system. The water scheme mentioned here focuses on the ground water recharge of the drought prone areas, therefore in this case, the higher weight (1) is given to the importance of effectiveness (
), social (
) and environmental production (
). In this Case, the decision-maker selects the best water supply for drought-prone areas, with only three positive criteria: effectiveness, social and environmental protection. Moreover, in this area, the importance of both negative and negative economic parameters, both economic and operational, has been completely ignored. The weight values of the each criteria is assumed to be as follows,
for each criteria
,
,
,
,
respectively.
Now we identifying the ranking order by use of our proposed MCDM methods with these modified criteria weights, the results of ranking values and alternatives order is given by the
Table 15. And also the final results are shown in the
Figure 12.
In this research paper we have proposed three methods to select the best method following several positive and a few negative criteria regarding the selection of ground water recharge and drinking water supply systems. And here is where the economy and utility of society should be taken into consideration. This is because these are considered the most central criteria for solving the problem of the peasantry. Both cost and time are a component of the water supply system and are not considered central. When choosing a water supply system for drought prone areas in general, we need to place more emphasis on Effectiveness, Social and Environmental protection to meet the area’s water needs. Conversely, both Cost and Operation Time are taken into account in implementing the project, but both are considered insignificant in terms of positive criteria. This is because the decision-maker considers both the Cost and Operation Time of the water supply system to be less important for drinking water and groundwater recharge. Therefore, Case- 2 of the sensitivity analysis we have taken here is considered correct. Weights for the criteria have been identified with the help of the proposed SDV weighting technique with emphasis on positive criteria in the region. And with the help of the HF-MOORA method one of the best water distribution system is selected.
10. Conclusions
In this paper, we proposed HFSDV- MOORA, HFSDV-TOPSIS and HFSDV-VIKOR for solving MCDM problems with HFE. The MOORA method is concentrate both positive and negative objectives and giving raking values. The VIKOR method gives compromised solution based on their performance and give utility measure, regret measure and index value. The TOPSIS method is based on PIS and NIS. Here, the above three methods are giving the same ranking for selecting the best alternative. In this regard, the mathematical model is an important tool for the evaluation of water distribution systems and illustrates an efficient implementation of groundwater recharge approach to the drought-prone areas.
HFS is recommended to handle the situation in uncertainty of the unstable set theory. DM gave their idea about the criteria of their corresponding alternatives by HFS. In this research paper, an MCDM is applied to a groundwater irrigation system in the hesitant fuzzy environment. Here, we evaluate four alternatives among five criteria in a hesitant fuzzy environment by use of hesitant fuzzy MOORA, hesitant fuzzy TOPSIS and hesitant fuzzy VIKOR. In our numerical evaluation, we conclude the best water distribution system of the selected problem. Based on a ranking model, we conclude the best water distribution system is closed concrete pipes laid along agricultural land.
Also, we proposed and investigated the SDV weight for manage integrating the values of measurements in different units. Also, we proposed three new MCDM methods with the extension with HFSDV weight. The results of comparison with existing weight finding method proved that the proposed approach is compatible with other MCDM methods. Moreover the proposed methods with HFSDV approach was more reasonable than other weight finding method. These proposed methods provide the best alternative water distribution system for the ground water irrigation scheme. The solution is rectifying the water problem in drought-prone areas of selected three districts.


