Article

An Integrated MCDM Approach to Train Derailment Risk Response Strategy Selection

1
School of Traffic and Transportation, Beijing Jiaotong University, Beijing 100044, China
2
Hexi Transportation Section, ShenShuo Railway Company, Yulin 719316, China
*
Author to whom correspondence should be addressed.
Symmetry 2020, 12(1), 47; https://doi.org/10.3390/sym12010047
Submission received: 25 November 2019 / Revised: 20 December 2019 / Accepted: 22 December 2019 / Published: 25 December 2019

Abstract

:
Train derailment can mainly cause not only economic losses in the shape of mangled rolling stock or infrastructure, but also more severely in causalities and disruptions of operations, yielding great impact on the sustainable development of railway industry. Considering various complex and symmetrical operational environments, as well as the characteristics of low frequency and high consequences of derailment accidents, risk response is undoubtedly underlined as one of the most critical components of risk management process. However, in practice, risk response does not receive enough attention in comparison with risk assessment that it lacks mature models and tools for selecting optimal strategy. This study constructs an integrated Multi Criteria Decision-Making (MCDM) model for the selection of optimum train derailment risk response strategy for the first time. In the model, decision making trial and evaluation laboratory (DEMATEL) technology is connected with analytical network process (ANP) to obtain evaluation criteria and their relative weights, and both of the two methods can deal with the complex coupling relationship between the indicators in the system. Then, technique for order performance by similarity to ideal solution (TOPSIS) is proposed to screen the optimum plan in the proposed model. Further, the Delphi method is used through the whole process to acquire expert advice. In the end, this model is used to select shunting derailment risk response strategies in Huangyangcheng station, and the final results demonstrate that this technology is simple and practical, and can provide a credible and practical tool for railway safety managers and engineers to choose the best risk response strategy.

Graphical Abstract

1. Introduction

Although train derailment incident is rare, it has attracted a lot of attention for its severe consequences and complex relationship between influencing factors [1]. When the vehicle departs from the track, accompanied by a huge symmetrical force between wheels and rails, the equipment such as locomotive and vehicle is bound to be damaged, causing a large amount of direct financial loss. Moreover, vehicle derailment can also result in the interruption of train operations and related delays, seriously affecting the quality and efficiency of transport production [2]. Therefore, much more attention should be paid to derailment risk management, such as human factors, rail parts failure, semaphore and control systems, vehicle-track interaction, and so on [1,3]. Risk response is the process to modify risk, and it is not only a crucial sub-process of risk management, but also one of the purposes of risk assessment [4,5]. If risk response cannot be implemented effectively, the effect of risk assessment will be affected, causing a negative impact on risk management. However, in risk practice, due to the lack of mature models and tools to choose appropriate response strategies, risk response does not receive enough attention in comparison with risk assessment [6,7], and this phenomenon is especially common in the railway industry.
Heinrich’s pyramid [8] reveals that shunting derailment accidents are usually caused by the interaction of a series of small errors and defects, which involve all aspects of the railway system, such as train operation organization, equipment quality, environmental impact, personnel quality, and fund investment. Therefore, we should find a method that fully considers and weighs the above factors to balance the relationship among benefits, costs, and risks when choosing risk coping strategies, and MCDM can solve the above problems. MCDM is known as a tool for supporting managers in utilizing available information, rethinking the connection, multiple dimensions, and complexity of various factors in the real world, and making it possible to make decisions in the context of different plans [9,10,11]. Currently, the commonly used MCDM technologies are DEMATEL, analytic hierarchy process (AHP), ANP, TOPSIS, simple multi-attribute rating technique etc. However, in many practical problems, it is usually necessary to combine or improve various methods to adapt to practical multi-criteria decision problems [12,13,14,15]. Nassereddine and Eskandari [16] set up a hybrid MCDM method to evaluate public transit systems, and the model used the Delphi approach, group AHP and preference ranking organization methodology to enhance the evaluation effect and provide a direction for the improvement of public transit service in the future. Celik et al. [17] put forward an integrated interval pype-2 fuzzy MCDM model based on TOPSIS and grey relational analysis to promote customer satisfaction in the Istanbul public transit system. Yucel et al. [18] used a MCDM model based on AHP and the best-worst method for the selection of railway system projects. Lin et al. [19] used a new fuzzy MCDM technology to select suitable site for car rental outlets. Kabak et al. [20] used a MCDM model based on GIS to evaluate the shared bike sites.
In the above literature review, we could find that the MCDM model was an efficient tool to settle the multi-criteria problems arising in engineering projects, military science, economic development, humanities, and social sciences. Nevertheless, traditional MCDM methodologies were based on the hypothesis of independence in the evaluation process and did not truly reflect the dependence and interaction relationships among evaluation elements. DEMATEL [21] was usually used to draw the intricate relationships of interplay in an evaluation index system to screen evaluation indicators, but it could not get the criteria weights, whereas ANP could. ANP was a MCDM method first proven by Saaty in 1996 and was applicable to non-independent hierarchies. Further, the ANP approach had two obvious merits. On the one hand, it reflected the complex dependency among various attributes of the system, rather than a simple hierarchy, on the other hand, it considered the relationship of mutual restriction and interaction among different levels and forms a more comprehensive analysis [22]. Many scholars have combined the two methods together to construct the multi-criteria decision model. Tadic et al. [23] built a MCDM model based on fuzzy DEMATEL, fuzzy ANP, and fuzzy VIKOR to solve the problem of urban physical distribution concept options, and the fuzzy ANP was put forward to analyze the criteria weights, while fuzzy DEMATEL was used to determine the strengths of the inner dependencies between the factors, and fuzzy VIKOR method was used to sort the options. Bongo et al. [24] established a fuzzy MCDM model based on fuzzy set, DEMATEL and ANP methods, and the model was used to reduce congestion at airports which gave negative impact on the punctuality of airlines, the reputation of airports and the travel experience of passengers. Pineda et al. [25] set up an integrated MCDM technology based on DANP, DEMATEL and VIKOR approach to improve airline operational and financial performance. Lu et al. [26] built a competitive large-scale airport performance analysis model, and DEMATEL was used to build an intricate lineage illustrated as a network impact diagram. In this approach, DANP was used to confirm the influential weights, and modified VIKOR was used to improve the operating efficiency of international airports. Chen [27] used a DEMATEL-ANP model to choose a quality improvement standard for airlines in Taiwan, and the study provided many suggestions for airlines to improve the service quality. The TOPSIS method, as a classical method for solving MCDM issues, with the characteristics of a clear concept in addition to simple and small computation, could rank the plans in the solution sets by virtue of virtual ideal solutions and negative ideal solutions [28]. Currently, the TOPSIS technology, combined with DEMATEL and ANP methods, has been applied to many domains. Buyukozkan and Çifci [29] put forward a new MCDM model using the fuzzy decision-making trial and evaluation laboratory, fuzzy ANP, and fuzzy TOPSIS to select green suppliers. Liu and Yin [30] used an integrated approach to select the optimal sustainable energy storing node from the perspective of benefits, opportunities, costs, and risks. Morteza et al. [31] developed an evaluation model by integrating ANP with fuzzy TOPSIS to get the optimal tourism site. Chen and Chen [32] used an integrated DEMATEL-Fuzzy ANP-TOPSIS model to evaluate higher education in Taiwan. Nilashi et al. [33] used a DEMATEL-Fuzzy TOPSIS approach to evaluate factors influencing medical tourism adoption in Malaysia. Hu et al. [34] developed a DEMATEL-ANP framework to improve air cargo terminal service quality.
Moreover, due to the complexity operating environment and lack of safety information in the railway industry, some difficulties are usually present for managers to analyze the security situation quantitatively, and sometimes it needs expert experience and engineering knowledge to make decisions. Delphi technology, as a prediction method proposed by the Rand Corporation, combines the experience of multiple experts and subjective judgment [35]. Its core is to conduct several rounds of anonymous consultation to solicit the ideas of experts [36]. After summarizing and sorting out the opinions of each round, the aggregated information is sent to each expert as reference materials for the experts to analyze, judge and propose new ideas, repeating this for a few times, the experts’ common ground gradually increase, and eventually can obtain a consensus [37,38]. Because of its simplicity and practicality, it is often used to solicit expert advice in the MCDM process.
Based on the above analysis, this paper set up a hybrid Delphi-DEMATEL-ANP-TOPSIS model for the selection of derailment risk response strategies. The main contributions of this paper were as follows:
First of all, from the point of literature review, a hybrid MCDM evaluation method was seldom used in train derailment risk response strategies selection, and this study filled the gap. In railway risk response practice, due to the limited resources and technical conditions, experts and scholars usually proposed specific countermeasures through qualitative analysis, but rarely developed specific evaluation models from the perspective of quantitative analysis. The model put forward in this paper could choose the optimal risk response strategy efficiently and quantitatively, providing an effective risk decision-making tool for railway managers.
Secondly, traditional MCDM method was based on the hypothesis of independence in evaluation process and did not truly reflect the dependence and interaction relationships among evaluation elements. The model combined DEMATEL with ANP could not only effectively construct interdependent connections among the risk response criteria, but also overcomed each other’s weaknesses to establish an efficient model. DEMATEL methodology was used to draw the complex “causal coupling” relationships in an evaluation index system to screen evaluation indicators, but it was not suitable for acquiring the criteria weights, whereas ANP could. The ANP approach obtained the weights by analyzing a lot of pair-wise comparison matrices to get the “influence of importance” among the criteria using the Super Decision software, and the calculation results could be used in the TOPSIS method to rank the response strategies.
Thirdly, this model deeply considered the role of secondary risk and residual risk in the process of evaluation criteria selection. In the railway risk practice, because of the cognitive bias on the train derailments, or the inherent mode of thinking, secondary or residual risks (including those not identified by the risk assessment) that might arise during the implementation of the response measures might be ignored, such as the damage of track bed and ecological environment, exposing the existing risk response strategies only considered the primary risks, and the secondary and residual risks might be caused by policy measures were not considered enough, which was easy to affect the achievement of risk response objectives. Risk tradeoff analysis could help us to find out the best strategy to solve problems under the constraints of resources and technology, so as to avoid the phenomenon of “solve one problem only to find another cropping up” [39]. This study applied tradeoff theory to balance the relationship among benefits, costs, and risks, and took secondary risk and residual risk as the risk response indicators to develop more comprehensive train derailment risk response strategies.
The remaining structure of this paper is as follows: Section 2 introduces the hybrid MCDM model of this study, including the introduction of Delphi, the process of DEMATEL method, the calculation process of ANP and TOPSIS methods. In 
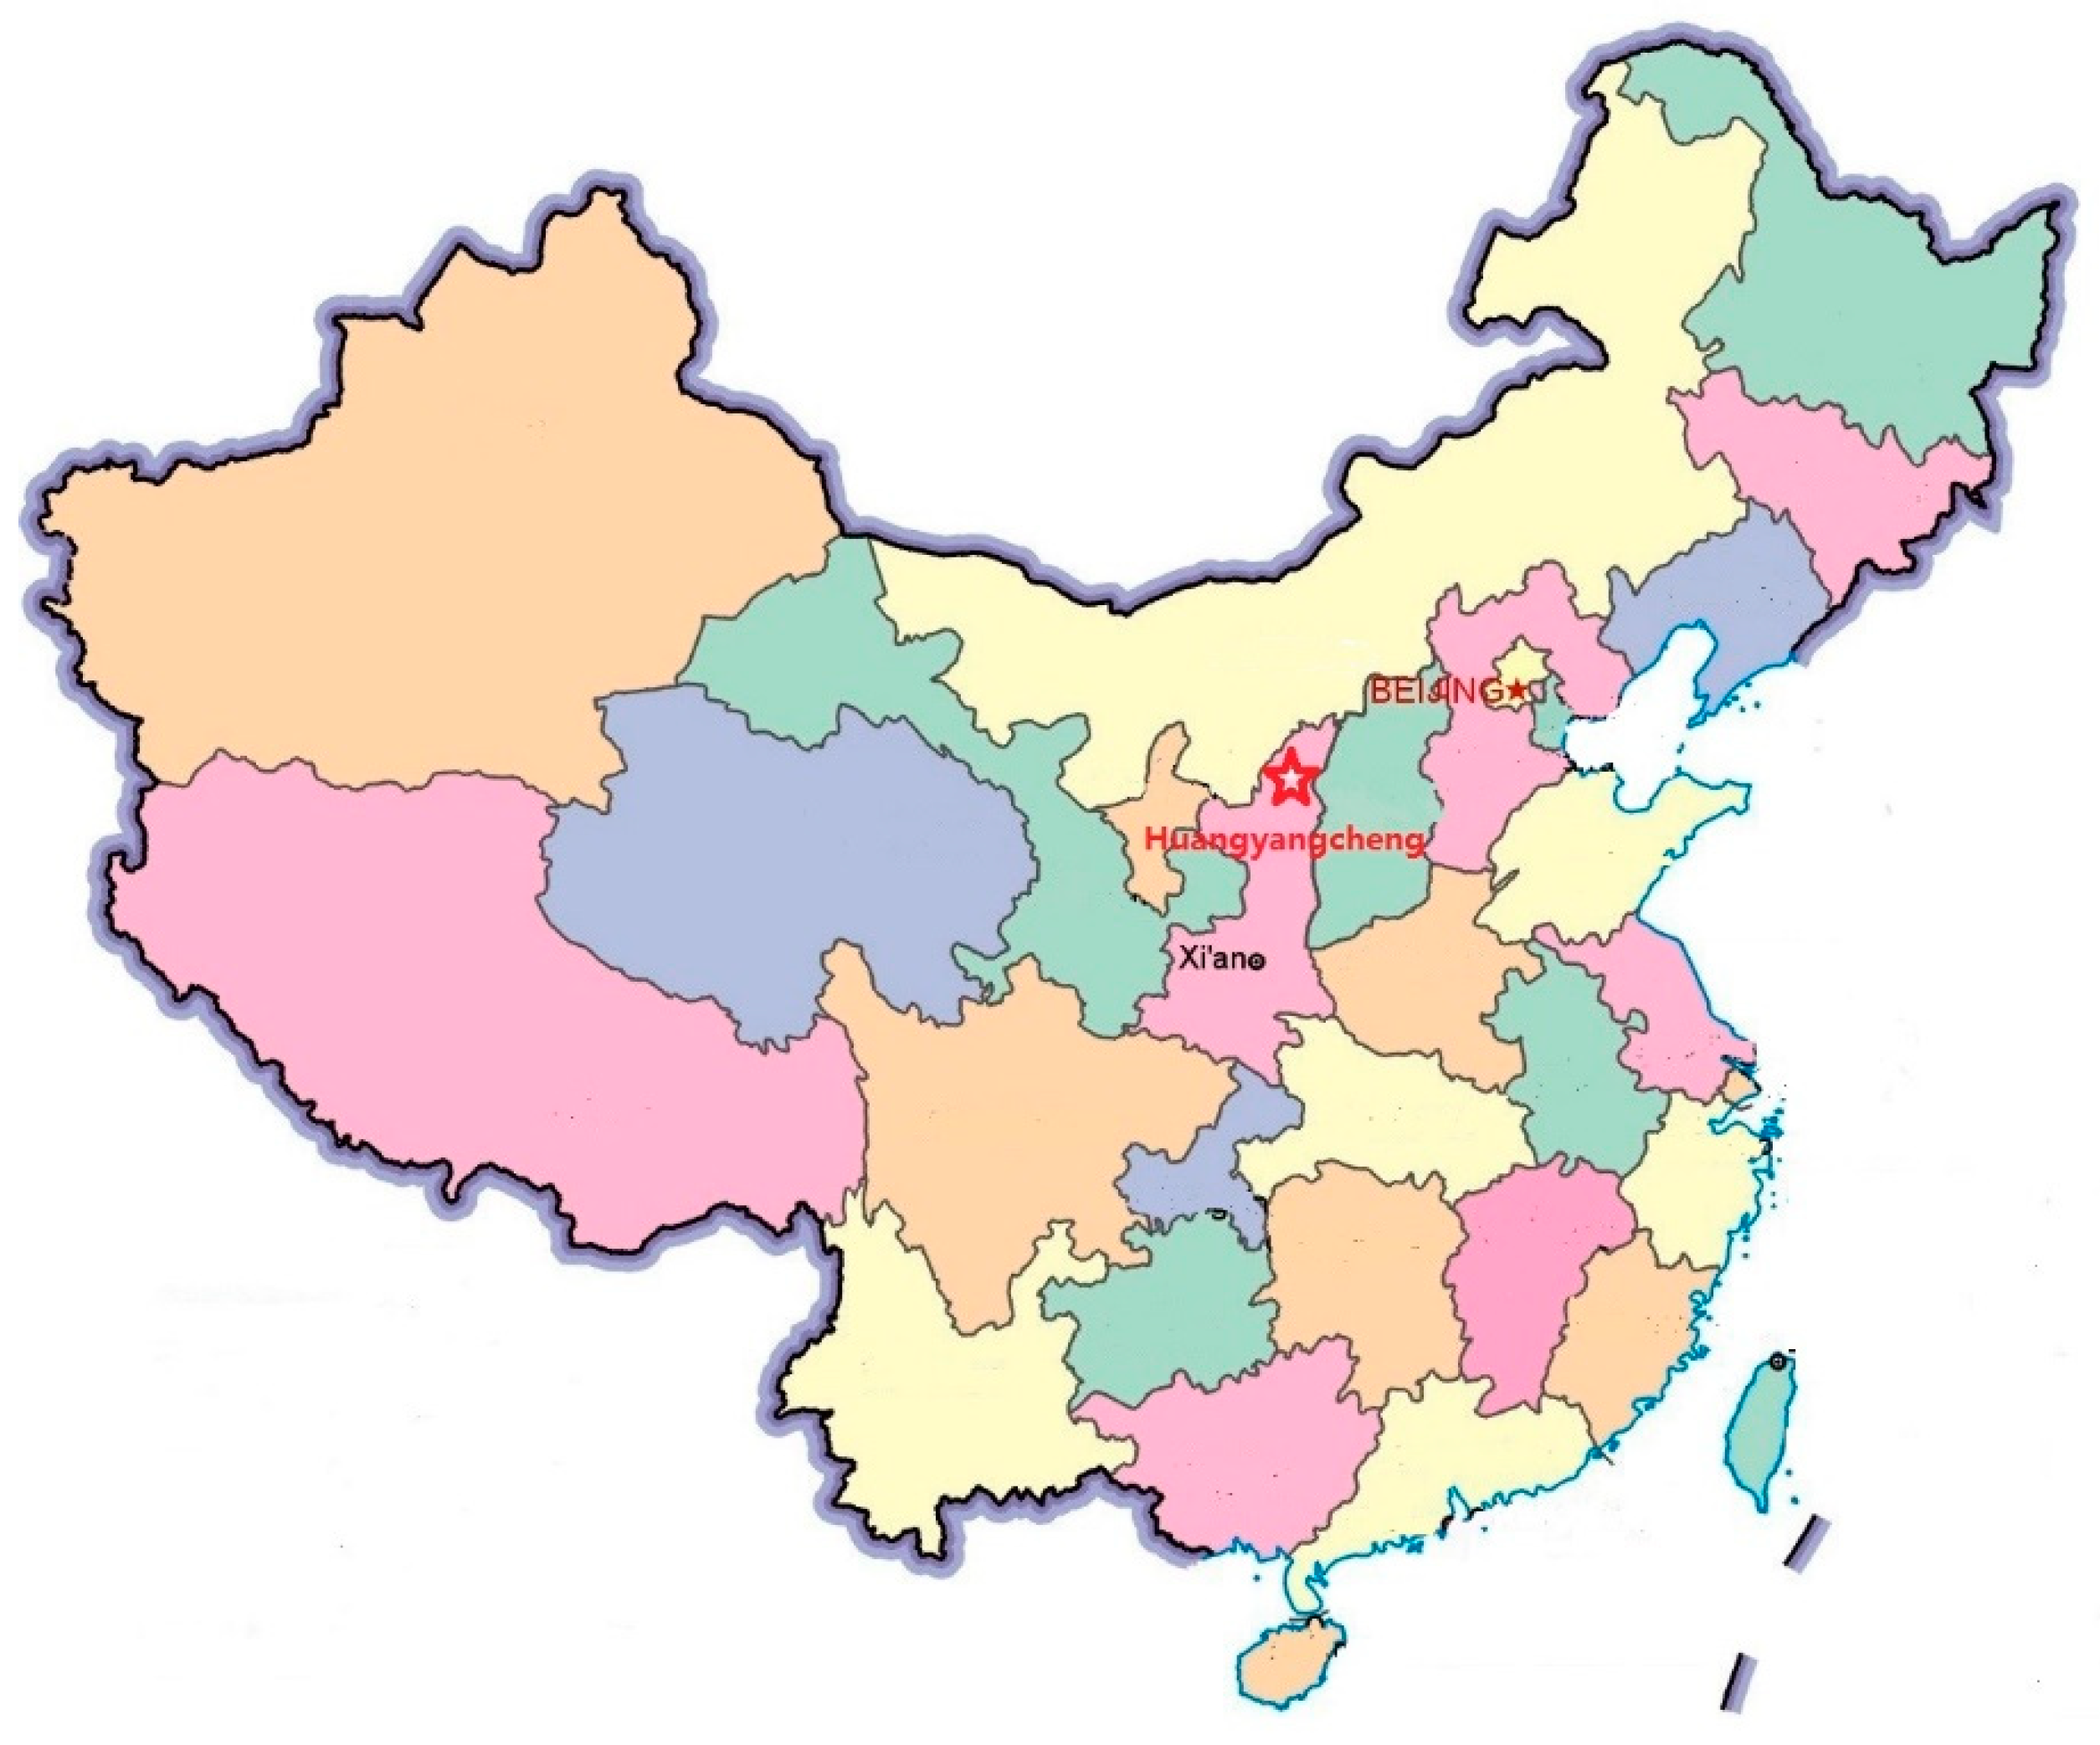
Section 3, the model is applied to select the shunting derailment risk countermeasures in Huangyangcheng station. Section 4 presents a discussion about the selection of risk response strategies. Section 5 summarizes the contributions of this research and analyzes the future research directions.

2. The Proposed MCDM Model

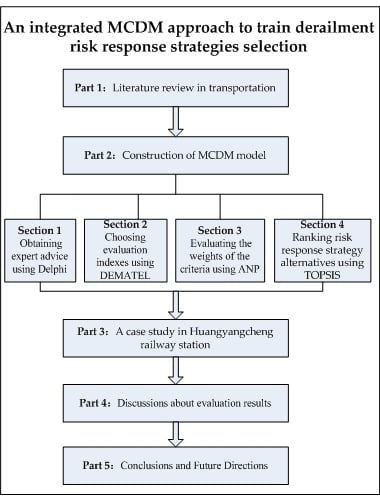
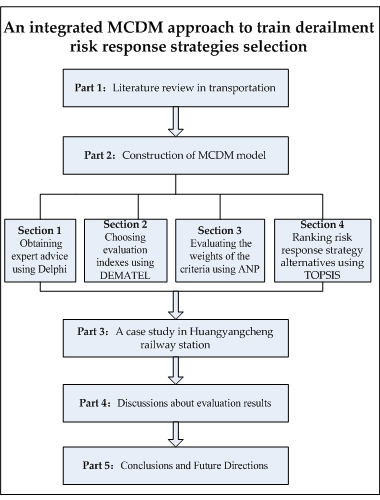
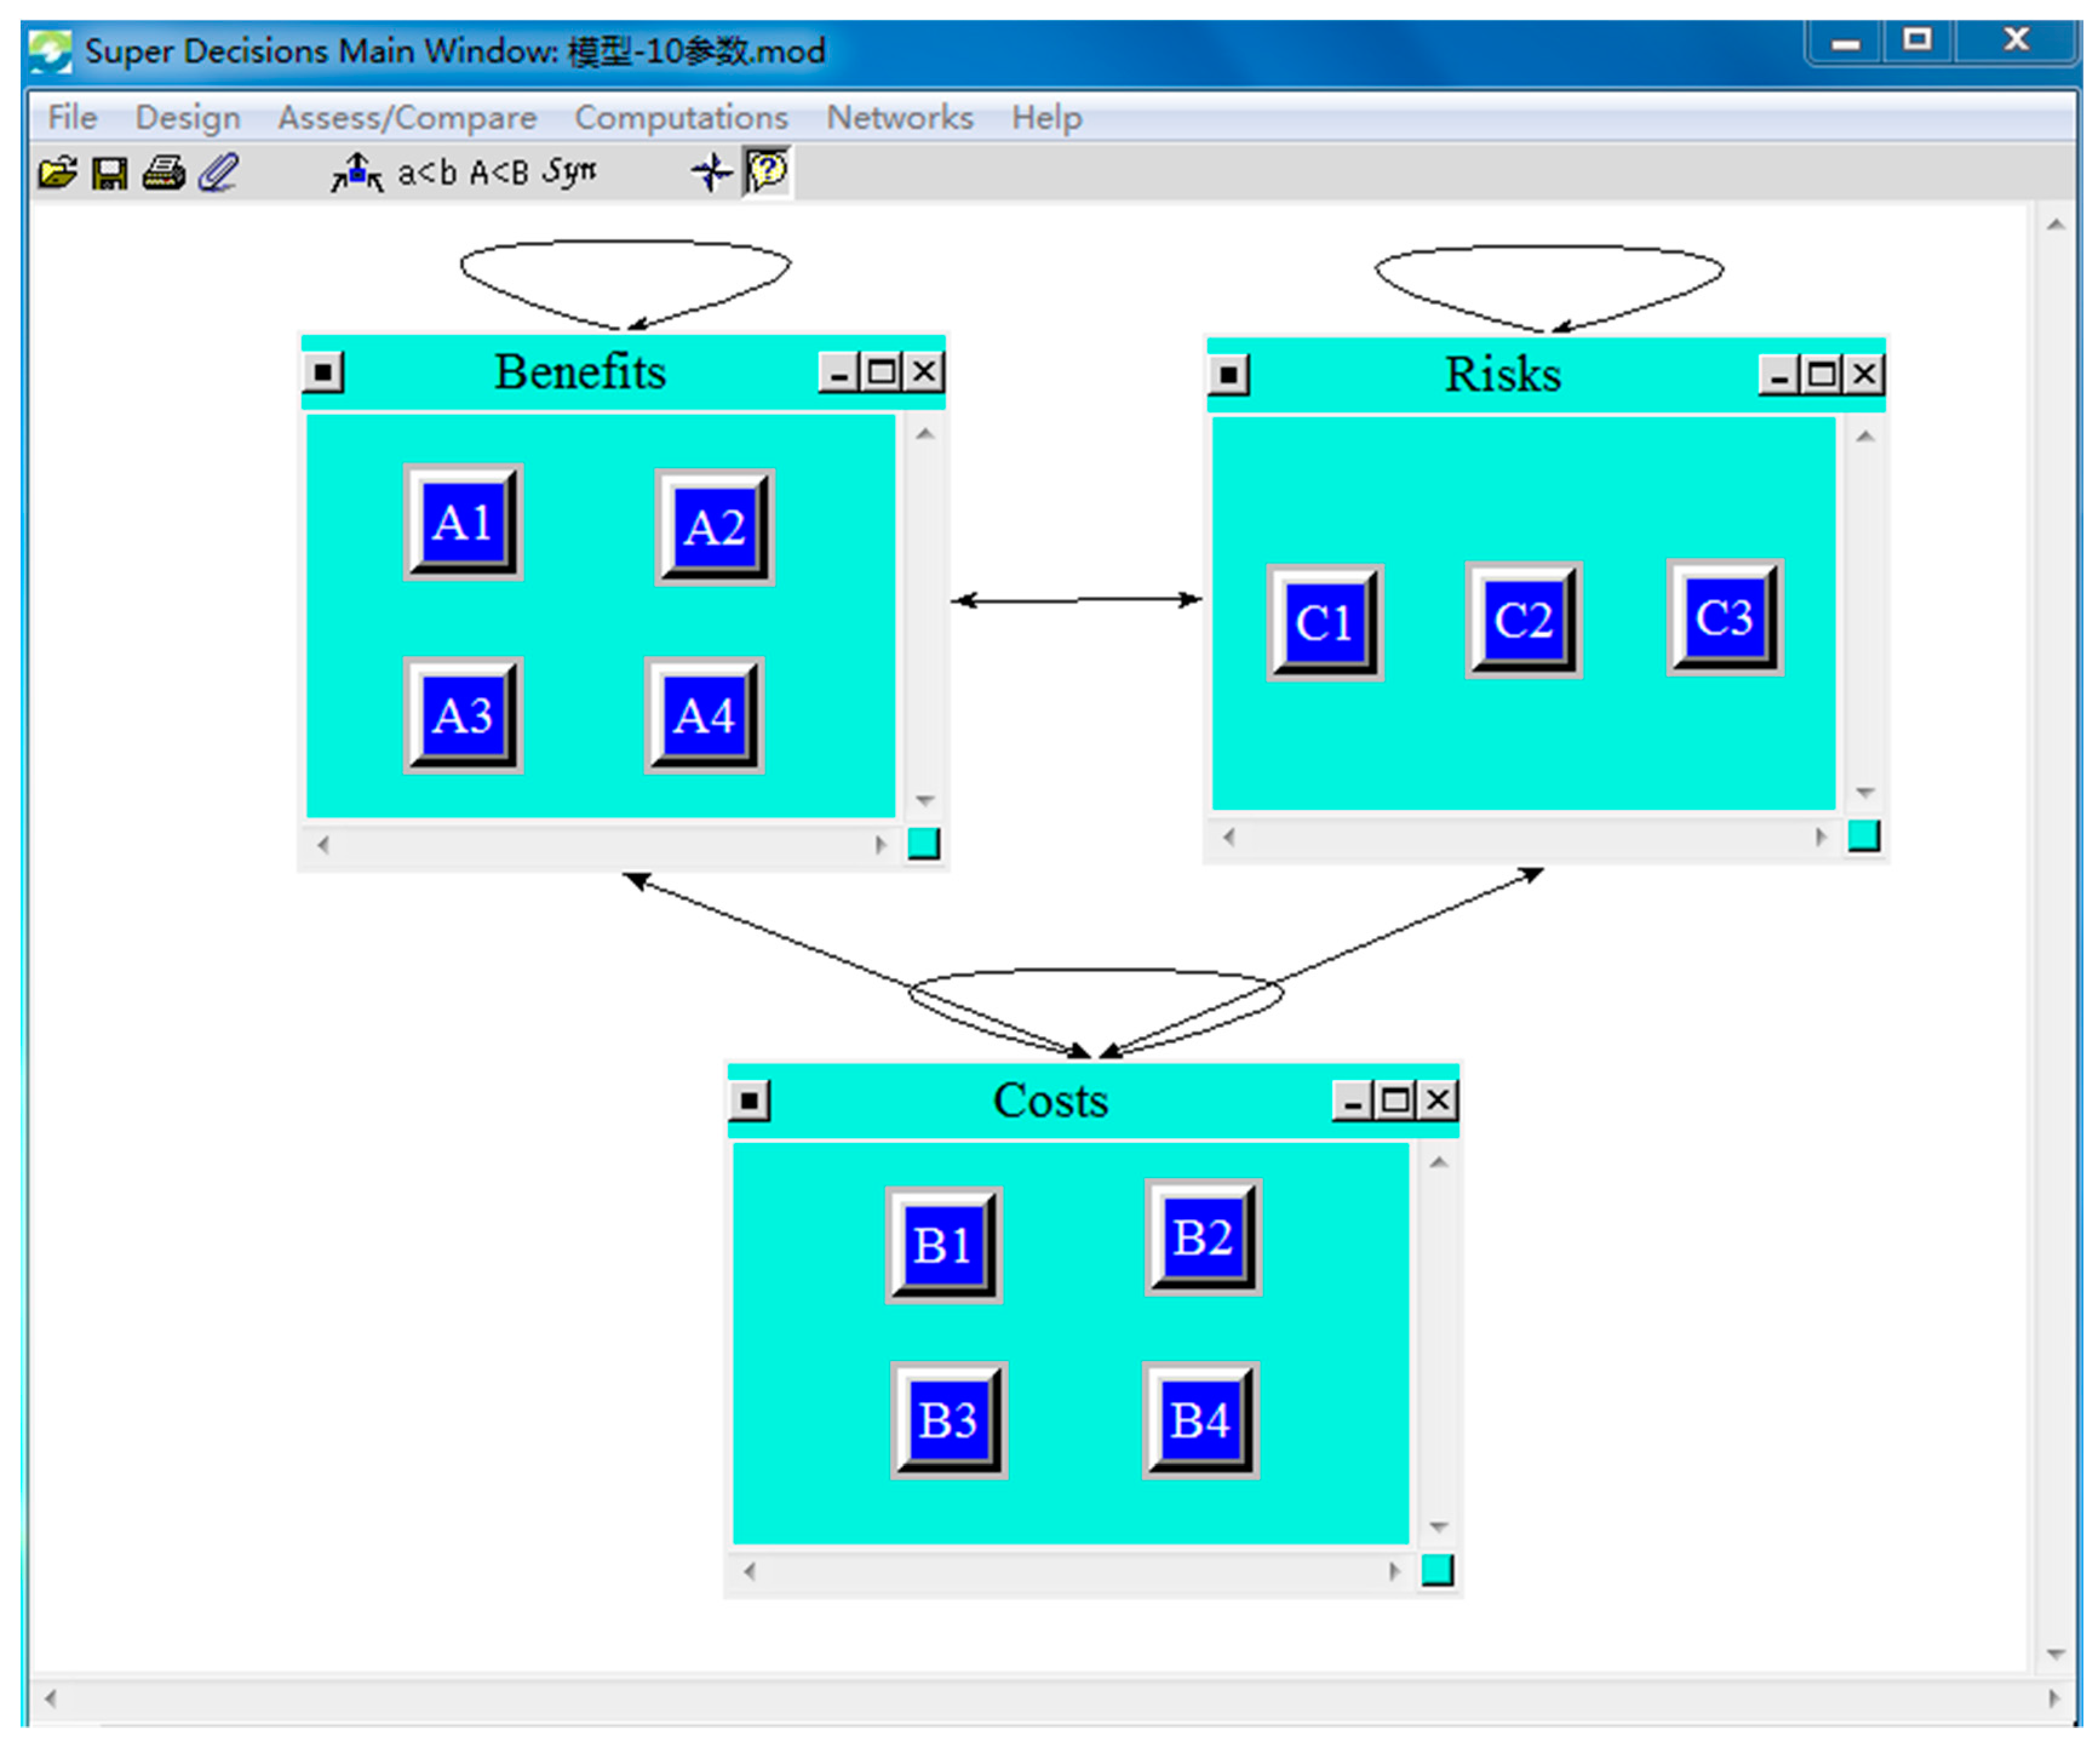
This paper proposed an integrated MCDM model based on Delphi, DEMATEL, ANP and TOPSIS to select sustainable derailment risk response strategy. In this model, the Delphi method was used to acquire expert advice to provide relevant suggestions throughout the whole process. DEMATEL was applied to identify the interdependency and feedback between criteria and finally confirm the key risk response strategy criteria. ANP was applied to acquire the influence of importance between the criteria in addition to deciding the criteria weights. Meanwhile, the TOPSIS approach was used to obtain the ranking of alternative solutions. The model was divided into four sections, and the specific framework was shown in Figure 1.

2.1. Obtaining Expert Advice Using Delphi

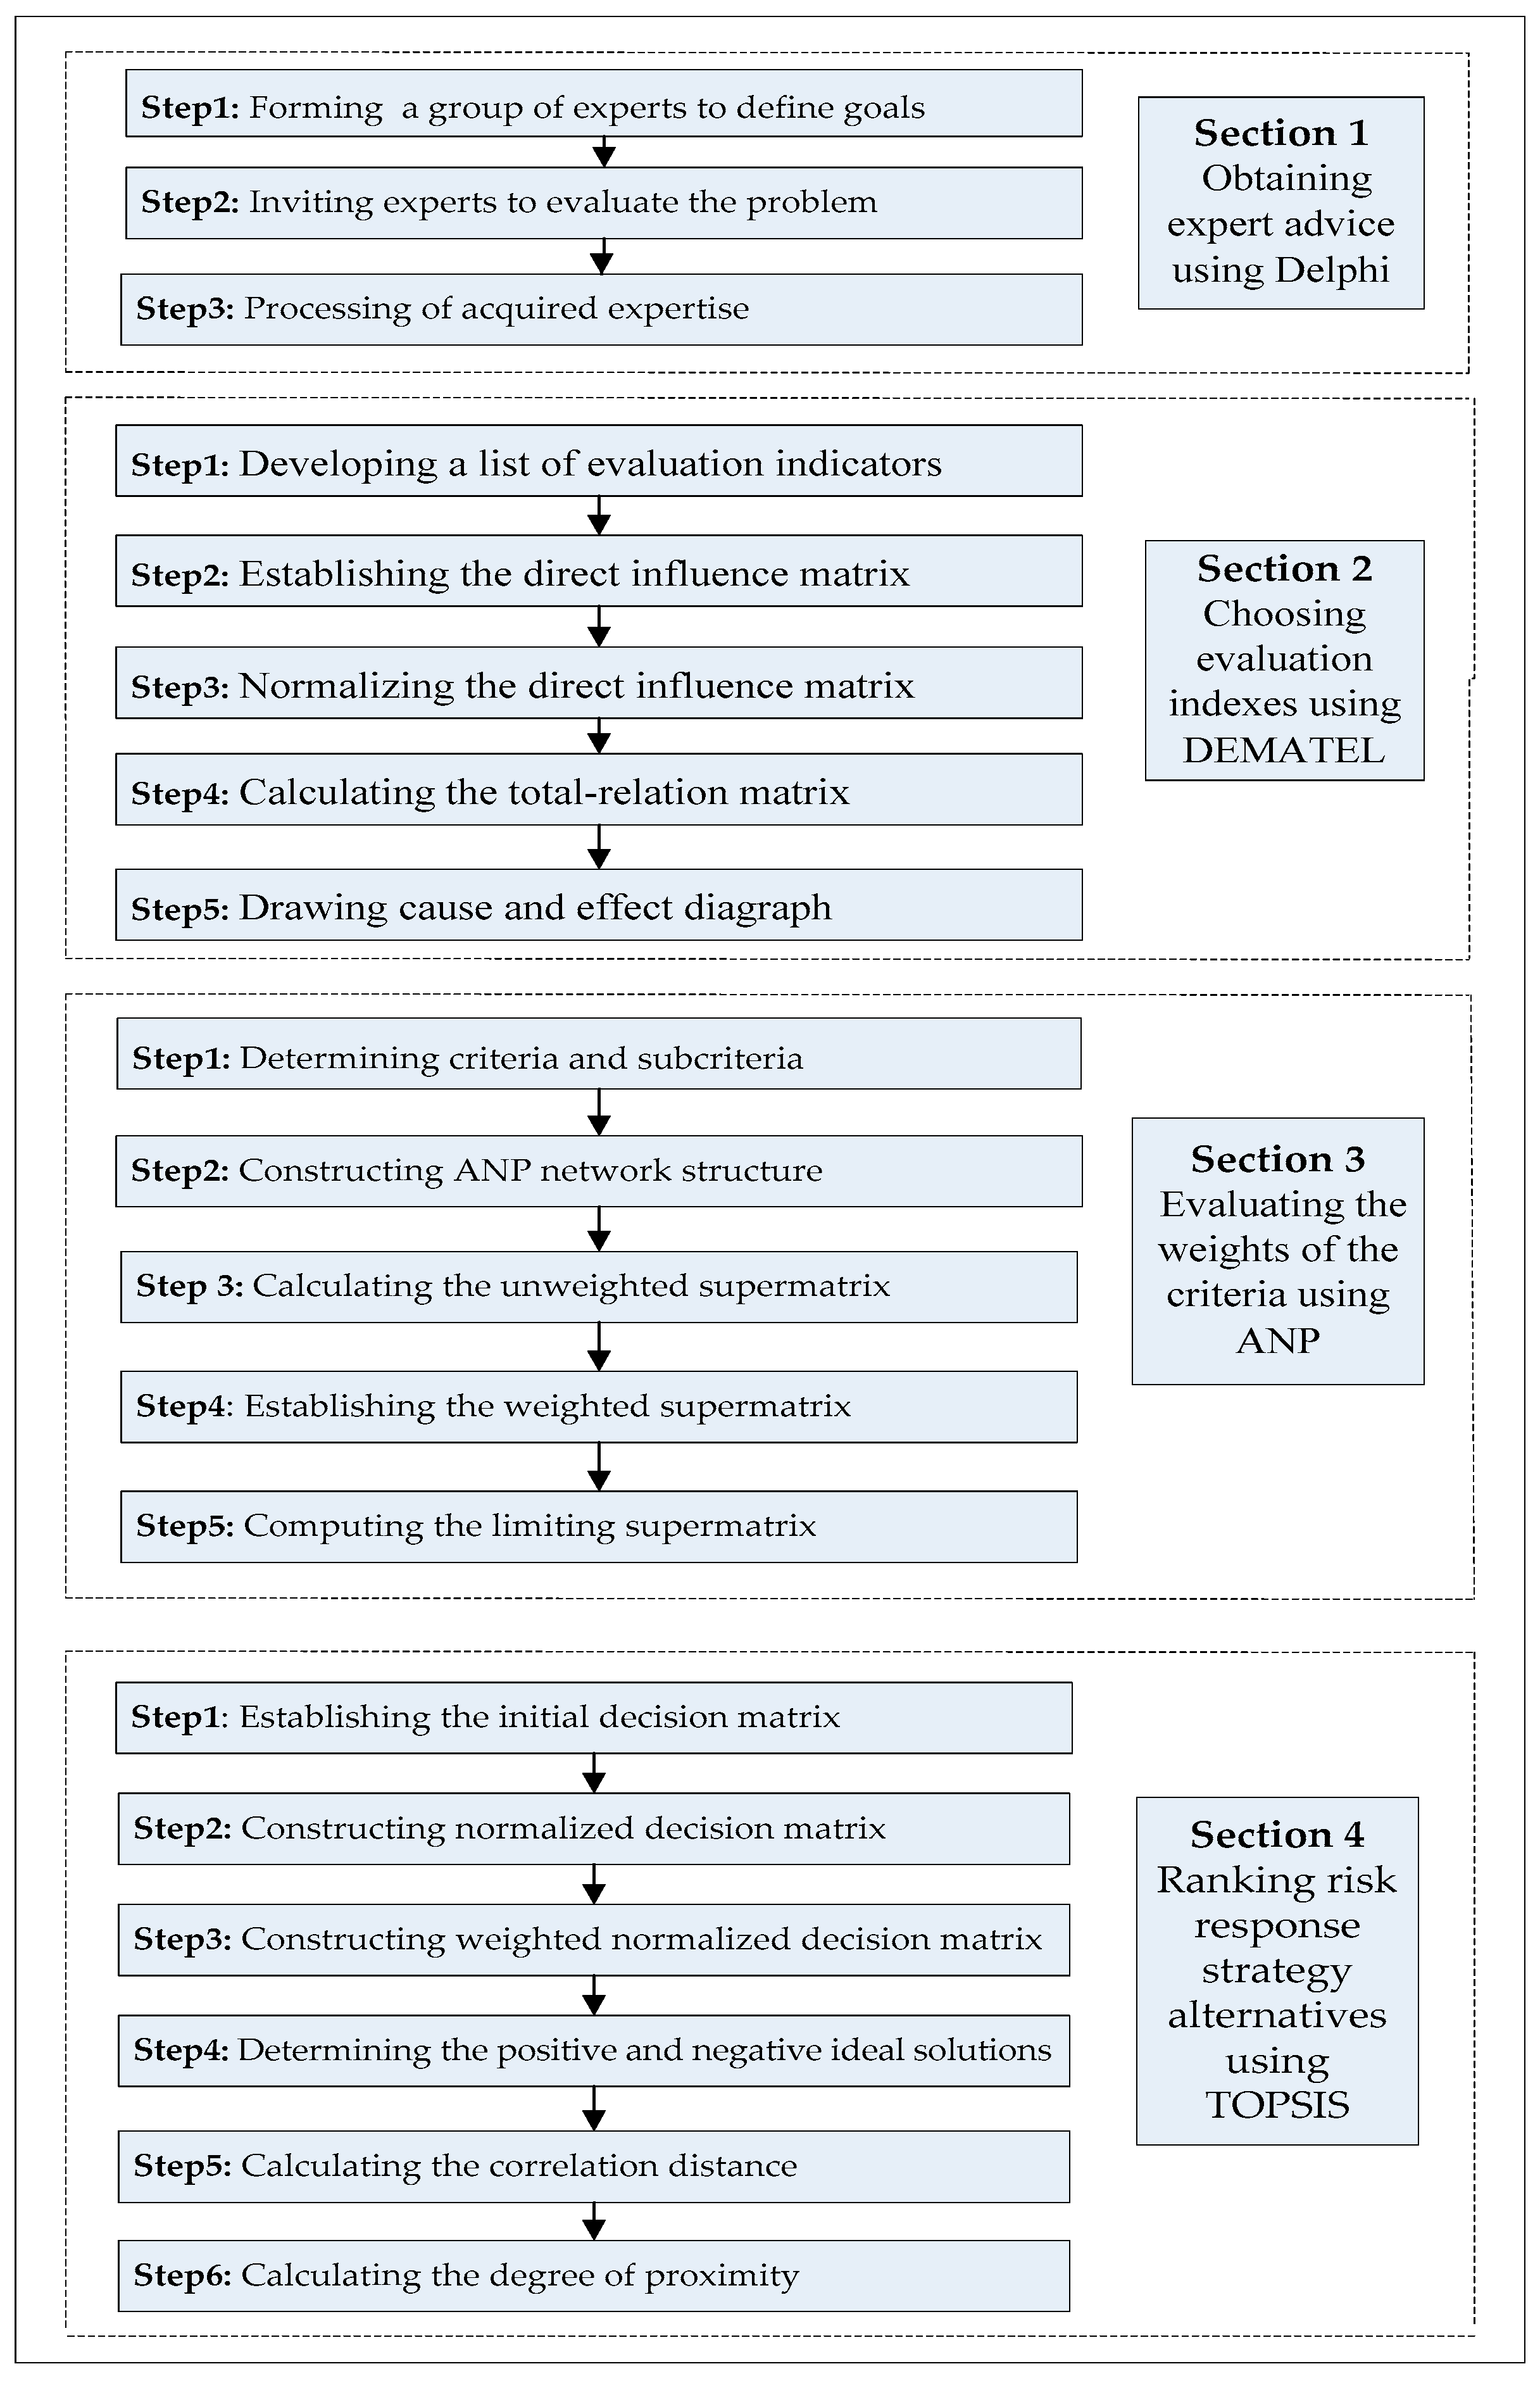
Due to the strong complexity and variability of railway safety, the frequency of some risk events in history was very low, certain railway accidents never happened or rarely happened, or due to the lack of data statistics, relevant information was not comprehensive enough to carry out for quantitative analysis. In such cases, semi-quantitative or qualitative analysis of the system security situation by experienced experts might be sufficient. Based on this, the Delphi method was used to provide expert advice during the process of DEMATEL, ANP, and TOPSIS. The specific process was as follows:
Step 1: Forming a group of experts to define the objectives. In this section, people’s cognitive characteristics were fully considered in the process of expert selection. The inherent decision-making mode of human brain would lead to systematic deviation in people’s judgment of problems, causing them to overestimate some attributes and underestimate others. We corrected this bias by selecting professionals at different levels of experience and theoretical knowledge in the industry to ensure correct advice and valuable judgments.
Step 2: Inviting experts to evaluate the problem. The experts conducted the evaluation anonymously or “back to back” to answer the questions according to the evaluation rules and explain the basis for answering the questions. Multiple rounds of questioning could be conducted on the same issue until a consensus was acquired.
Step 3: Processing of gathering experts’ knowledge. Based on the original opinions of experts, the authors comprehensively considered the factors of consistency and coordination and met the requirements of the convergence of the whole opinions to find the best advice for group decision-making and obtain the conclusion with a credibility index, achieving the purpose of experts’opinions integration.

2.2. Choosing Evaluation Indexes Using DEMATEL

In this stage, the collected risk information was analyzed by experts to preliminarily form a list of criteria, and then DEMATEL method was used to further analyze the coupling relationship and identify the key criteria in terms of their interaction intensity sequence of criteria. The specific steps were as follows:
Step 1: Developing a list of evaluation indicators. The collected train derailment risk data was used to analyze the indicators that affect the selection of derailment strategy by Delphi.
Step 2: Building the direct influence matrix. Assuming there existed the following express instructions: 0 = no influence, 1 = small influence, 2 = moderate influence, 3 = high influence, 4 = great influence. The selected experts were requested to give the degree of direct influence that factor i exerted on factor j , which was denoted by p i j , and the direct influence matrix P could be expressed by Equation (1):
P = ( p i j ) n × n = [ p 11 p 1 j p 1 n . . . . . . p i 1 p i j p i n . . . . . . p n 1 p n j p n n . ] ,   1 i n , 1 j n .
Step 3: Normalizing the direct influence matrix. Equations (2) and (3) were used for getting the normalized direct relation matrix D :
k = j = 1 m p i j 1 i n m a x .
D = 1 k P .
Step 4: Computation of the total relation matrix. Equation (4) was used to get the total relation matrix, where I was the identity matrix. The row sum and column sum from matrix T were shown in Equations (5) and (6).
T = D + D 2 + D 3 + + D n = D ( I D ) 1 = ( t i j ) n × n , i , j = 1 , 2 , n ,
R = ( r i ) n × 1 = j = 1 n t i j n × 1 ,
F = ( f j ) n × 1 = ( f j ) 1 × n = i = 1 n t i j 1 × n ,
where r i represented the row sum of the i th row in matrix T , and f j represented the column sum of the j th column in matrix T . ( r i + f j ) denoted the degree of the central role, representing the strength of influence that element i gave and received. If ( r i f j ) was positive, then element i was an affecting element, and if ( r i f j ) was negative, then element i was an affected element.
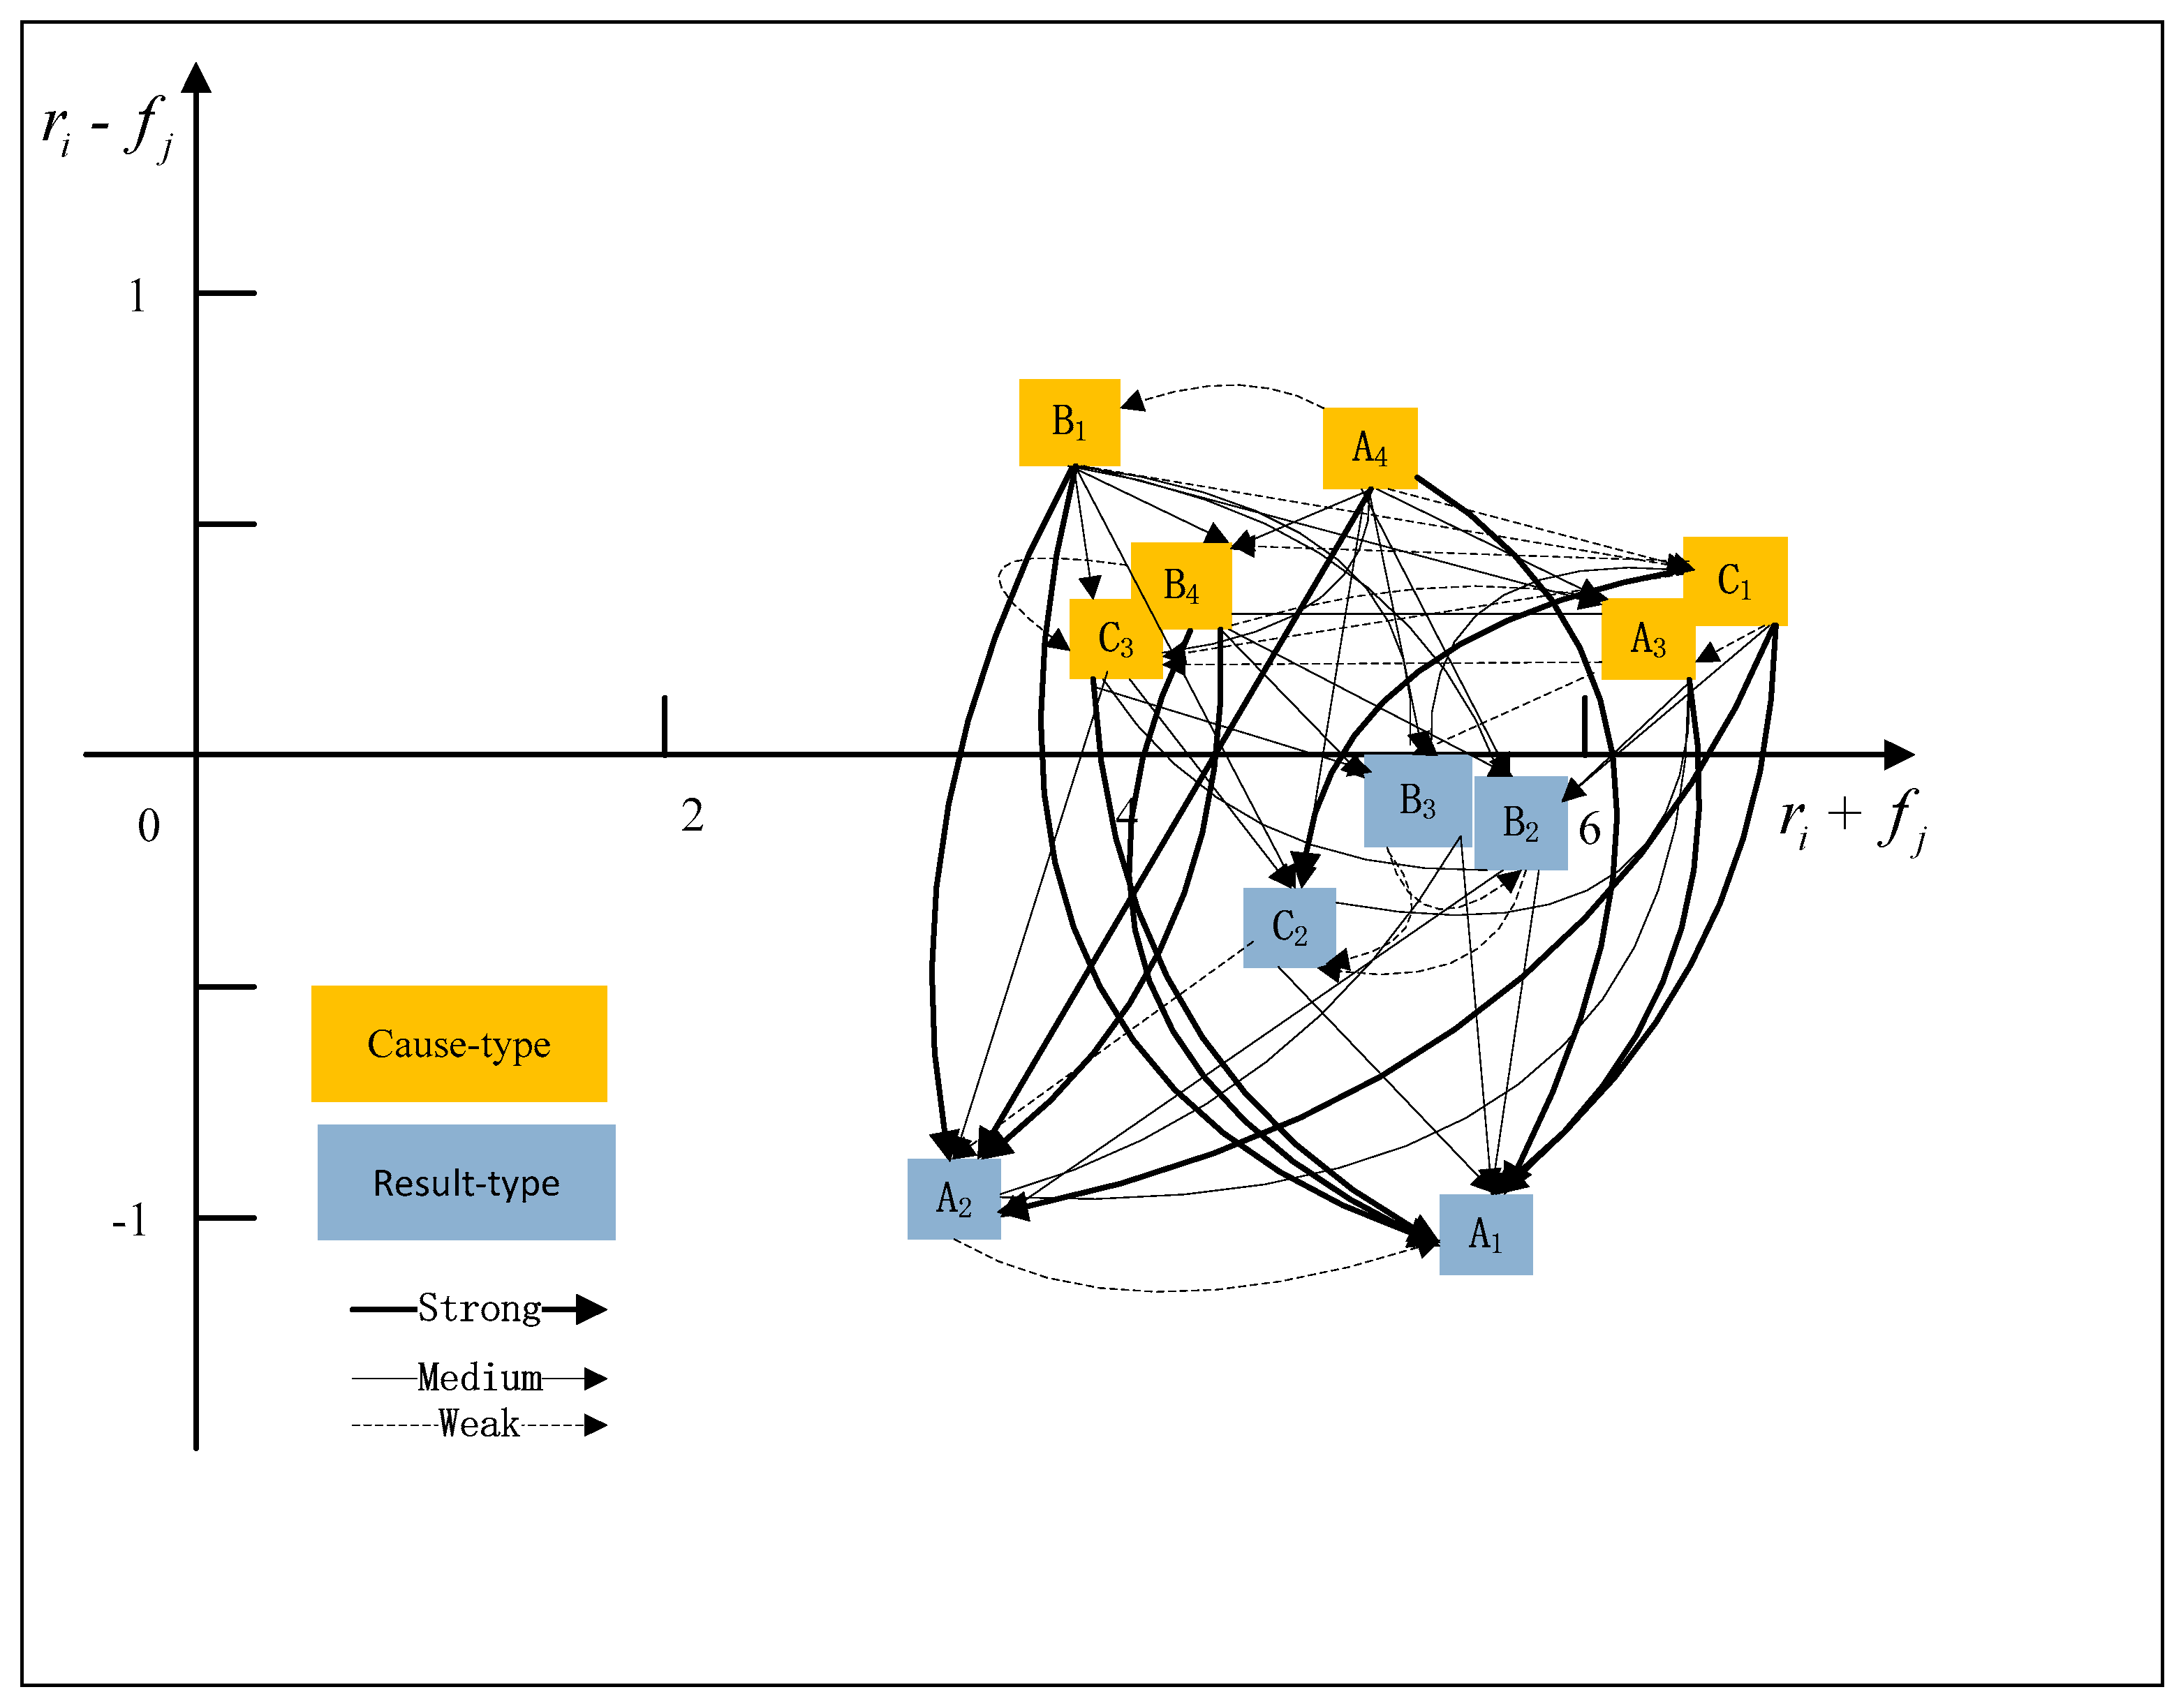
Step 5: Drawing a cause and effect diagraph. The graph was drawn using ( r i + f j ) as the horizontal axis and ( r i f j ) as the vertical axis, and the less influential factors were eliminated.

2.3. Evaluating the Weights of the Criteria Using ANP

The ANP method was a comprehensive decision-making technology, which analyzes the interdependence and feedback relationship among factors in the system with the help of network structure. Therefore, it was considered as a more applicable evaluation and decision-making tool that could more effectively solve complex system problems than AHP. The basic process was as follows:
Step 1: Determination of risk response criteria. Risk criteria were the terms of reference against which the significance of a risk was evaluated. Therefore, risk criteria should reflect the risk tolerance of the organization and reflect the values, goals and resources of the organization [40].
Step 2: Construction of the ANP network. The experts were required to give advice to determine the influence of sub-criteria on other criteria elements, or the relationship affected by other criteria elements.
Step 3: Calculation of the unweighted super-matrix. Supposing the network had factor sets C 1 , C 2 , C 3 , and e i 1 , e i 2 , e i 3 , e i 4 were the elements of set C i , i = 1 , 2 , 3 . The factors in criterion set C i were compared according to their influence on sub-criterion e j l , which belonged to set C j , so we could get the matrix W i j , as represented by Equation (7):
W i j = w i 1 j 1 w i 1 j 2 w i 1 j n j w i 2 j 1 w i 2 j 2 w i 2 j n j w i n i j 1 w i n i j 2 w i n i j n j ,
if factors in set C j were not influenced by factors in set C i , then W i j = 0 . For i = 1 , 2 , 3 ; j = 1 , 2 , 3 ; n = 1 , 2 , 3 , 4 , repeating the above steps to obtain the super-matrix under a single criterion, as shown in Formula (8):
W = ( W i j ) , i = 1 , 2 , 3 , j = 1 , 2 , 3 , n = 1 , 2 , 3 , 4 .
Step 4: Establishment of the weighted super-matrix. Taking a criterion set as a whole element, the pair-wise comparison was made on the relative importance of a criterion set, and the criterion set was obtained as a normalized weight vector of other criterion sets under a sub-criterion ( a 1 j , a 2 j , a 3 j ) T . Where, a i j represented the influence weight of the i th subset on the j th subset, and “0” meant no effect, i = 1 N a i j = 1 , the weighted super-matrix is shown by Formula (9):
W - = ( W i j - ) = a i j W i j , i = 1 , 2 , 3 , j = 1 , 2 , 3 .
Step 5: Computation of the limiting super-matrix. We could acquire the limit of each super-matrix relative sorting vector by Equation (10). If the limit was convergent and unique, the value of the corresponding row of the original matrix was the weight of each index.
W = l i m k ( 1 / N ) k = 1 N W k - .

2.4. Ranking Risk Response Strategy Alternatives Using TOPSIS

TOPSIS was proposed by Hwang and Yoon to help experts calculating positive and negative ideal solutions. The optimal alternative was the one with the least distance from the positive ideal solution and the greatest distance from the negative ideal solution. The steps were summarized as follows:
Step 1: Establishing the initial decision matrix. The initial decision matrix X = ( x i j ) m × n was constructed according to the original data in the solution set. Where x i j ( i = 1 , , m ; j = 1 , , n ) represented the value of the plan u i U under the criterion p j P , the matrix was shown in Equation (11):
X = [ x 11 x 1 j x 1 n . . . . . . x i 1 x i j x i n . . . . . . x m 1 x m j x m n . ] .
Step 2: Normalization of the evaluation matrix. Since there were different dimensions of data in the decision matrix, in order to eliminate the influence of dimensions, it was necessary to normalize the matrix data and obtain the normalized matrix R = ( r i j ) m × n in Equation (12):
r i j = x i j i = 1 m x i j 2 , i = 1 , , m ; j = 1 , , n .
Step 3: Construction of the weighted normalized decision matrix Z = ( z i j ) m × n in Equation (13). Where w i was given by 1 m w i = 1 .
z i j = w j y i j , i = 1 , , m , j = 1 , , n .
Step 4: Determination of the positive and negative ideal solutions. Since attribute indicators could be divided into benefit type and cost type, the solution method for these two types of attribute indicators was shown in Equations (14) and (15).
When a j A was a benefit indicator,
{ z j = ( z 1 , z 2 , , z n ) = m i n { z i j | 1 i m } z j + = ( z 1 + , z 2 + , , z n + ) = m a x { z i j | 1 i m } .
When a j A was a cost indicator,
{ z j = ( z 1 , z 2 , , z n ) = m a x { z i j | 1 i m } z j + = ( z 1 + , z 2 + , , z n + ) = m i n { z i j | 1 i m } .
Step 5: Calculation of the separation measure. The separation from the positive and negative ideal for each alternative could be obtained using the n-criteria Euclidean distance, expressed by Equations (16) and (17).
D i + = j = 1 n ( z i j z j + ) 2 .
D i = j = 1 n ( z i j z j ) 2 .
Step 6: Calculation of the relative closeness to the ideal solution C i * and sorting by priority. Obviously, C i * lied between 0 and 1, and the larger C i * was, the more appropriate the plan was, as shown in Equation (18).
C i * = D i D i + + D i , i = 1 , , m .

3. Case Study

Huangyangcheng station was located in Shenmu city, Shaanxi province as shown in Figure 2. It was a second-class freight station of ShenShuo Railway. The station owned ten tracks, dealing with the arrival, departure and passage of trains, decomposition of freight trains, as well as vehicle alignment, delivery and loading of Yujialiang coal mine special line. The transportation revenue of the station was ¥347 million in 2018. In reference [22], the authors assessed the risk of shunting derailment risk in Huangyangcheng station, which belonged to a tolerable risk. This study applied the assessment results of reference [22] to select a solution for the shunting derailment risk of Huangyangcheng station to verify the above model.

3.1. Forming a Team of Experts

In this paper, eight experts from the railway industry were selected to form an expert group to provide support in the calculation process of DEMATEL, ANP, and TOPSIS. Experts’ opinions could be required for many times for the specific issues involved until eight experts reached a relatively uniform opinion. The Delphi method was used throughout the whole process of this study. Specific application details were no longer described, and the experts’ information was shown in Table 1. In the ANP calculation process, the standpoint of experts was expressed by a nine-point scale as shown in Table 2 [41].

3.2. Choosing the Optimal Evaluation Criteria Using DEMATEL

In this stage, the DEMATEL method was used to further screen the evaluation criteria preliminarily determined by experts. The causal relationship strength between criteria was determined by expert assignment, and the center degree and cause degree of criteria were calculated by relevant formulas, and the less important criteria were removed. After the above steps, we could confirm the evaluation criteria.
Step 1: The criteria in this paper were divided into benefit and cost types. Benefit attribute referred to the attribute whose value was as large as possible, while cost type owned the attribute whose value was as small as possible. The expert group classified the dimensions and criteria respectively from the aspects of the importance, operability, and sensitivity of the criteria, and screened the following indicators in Table 3:
Step 2: Establishing a direct influence matrix. We gained consensus with respect to the intensity of “influence on interaction” among the criteria using the Delphi method, as shown in Table 4. The responses ranged from 0 to 4, and the higher the degree was, the more important of the criterion was in the system. From Table 4, we could find that average failure time delay (A3) and primary risk (C1) had great influence on other criteria, freight value (A1), and primary risk (C1) were greatly influenced by other criteria.
Step 3: Normalizing the direct influence matrix. After obtaining the direct influence matrix expressed by the expected value, we could get k = 22 by Equation (2), and the normalized direct impact matrix was obtained by Equation (3), as shown in Table 5.
Step 4: Calculating the total relation matrix. According to Equation (4), the total relation matrix was obtained, taking the threshold of the influence factor in the total relation matrix as 0.10, and no criterion value was below 0.10, as shown in Table 6.
Step 5: Calculation of center degree and cause degree. Using Equations (5) and (6) to get row sum and column sum, ( r i + f j ) and ( r i f j ) were shown in Table 7. The influence of elements was relatively large, and no index needed to be discarded.
Step 6: Drawing cause and result diagraph. The graph was constructed by ( r i + f j ) as the horizontal axis and ( r i f j ) as the vertical axis, as shown in Figure 3.
As shown in Figure 3, the eleven criteria influenced mutually. Arrows were pointed to criteria with low vertical axis values from criteria with high vertical axis values, the bigger the impact, the thicker the line. Thus, hidden danger correction rate (A4) affected the others (A4→B1, C1, B4, A3, C3, B3, B2, C2, A2, A1), other influence relationships were similar. This finding indicated that among the criteria that affect the selection of response strategies, hidden danger correction rate (A4) made the biggest influence on the other criteria and freight volume (A1) received the largest influence from the other criteria. A3, A4, B1, B4, C1, and C3 were the cause-type criteria, and A1, A2, B2, B3, and C2 were the result-type criteria.

3.3. Calculating the Weights of Criteria Using ANP

In this part, after getting the criteria with the help of DEMATEL, the ANP approach was applied to attain the weights of criteria, which were used in the TOPSIS method to get the weighted hyper-matrix. In the calculation process, due to the complex relationship among criteria, it needed to be carried out with the help of computer tools. Super Decision (SD) software was created to solve this problem. The software can be used to model and solve the complex network hierarchy, which greatly reduced the workload of the calculation process and was very helpful for the popularization of ANP. The calculation process was as follows.
Step 1: Construction of the ANP network. Experts were invited to judge the relationship among benefits, risks, costs and connect the related nodes to form a network hierarchy diagram by SD software, as shown in Figure 4. Experts believed that the relationships between benefits, costs, and risks were mutually reinforcing. In response to the target risk, we should simultaneously consider the influence of different strategies acting on secondary risk and residual risk to ensure a maximum economic benefit.
Step 2: Calculation of the unweighted super-matrix. By constructing the network hierarchy as shown in Figure 4, experts were invited to build pair-wise comparison matrix based on the importance intensity given in Table 2, and unweighted hyper-matrix was derived by SD software, as shown in Table 8.
Step 3: Establishment of the weighted super-matrix. According to Formula (9), the weighted hyper-matrix was constructed by SD software, as shown in Table 9.
Step 4: By calculating the weighted super-matrix and using Equation (9) to calculate the limit, the weight values of the limit matrix and each criterion could be derived with the help of SD software. The specific contents were shown in Table 10 and Table 11 respectively.
Table 11 listed the influential weights of 11criteria that affect the derailment risk response strategies selection, and we could find that average failure time delay (A3), hidden danger correction rate (A4), primary risk (C1) were the three most significant criteria. On the other hand, education and training cost (B1), freight volume (A1), and residual risk (C3) were the least important criteria in the system. These results verified the results of the DEMATEL analysis again where average failure time delay (A3), hidden danger correction rate (A4), primary risk (C1) demonstrated a relatively large center degree, while education and training cost (B1) and residual risk (C3) owned a relatively small center degree.

3.4. Ranking Risk Response Strategy Alternatives Using TOPSIS

In this part, the TOPSIS method was used to rank the plans in the solution set by virtue of virtual ideal solutions and negative ideal solutions. The interaction between the criteria and the weight values were applied in the TOPSIS calculation process.
Step 1: Establishing the initial decision matrix. After panel discussion, four risk response plans were provided. Plan 1 focused on benefits, plan 2 was more sensitive to costs, plan 3 paid more attention to risk control, and plan 4 comprehensively considered the effect of benefits, costs, and risks. Based on the statistical analysis of relevant data in the last three years, Table 12 was summarized as follows.
Step 2: Normalization of the evaluation matrix. The authors used Equation (12) to normalize each column of the initial decision matrix into Table 13:
Step 3: Constructing the weighted normalized decision matrix. The weighted normalized matrix could be obtained by Formula (13), as shown in Table 14.
Step 4: Calculating the positive and negative ideal solutions. According to Equations (14) and (15), the positive and negative ideal solutions could be obtained, as shown in Equations (19) and (20).
Z + = ( 0.012 , 0.019 , 0.033 , 0.055 , 0.004 , 0.016 , 0.021 , 0.012 , 0.023 , 0.012 , 0.010 )
Z = ( 0.010 , 0.023 , 0.051 , 0.048 , 0.009 , 0.020 , 0.028 , 0.014 , 0.040 , 0.024 , 0.013 )
Step 5: Equation (18) was used to calculate the closeness degree of each plan, and their order was shown in Table 15:
According to the relative closeness to the ideal solution C i * , the larger the value, the better the performance of the plan. Therefore, it was obvious that the ranking for the optimal strategies was plan 1, plan 3, plan 4 and plan 2. Therefore, under the conditions of existing technology and resources, the influence of average failure time delay (A3), hidden danger correction rate (A4) should be fully considered in the pursuit of maximum benefit.

4. Discussion

This study proposed a hybrid MCDM model using Delphi, DEMATEL, ANP, and TOPSIS methods to choose train derailment risk response strategies. The DEMATEL was employed to determine the interdependencies between criteria, and a network relation map and causal diagram were mapped, which were presented in Figure 3. According to the results obtained in Figure 3, the average failure time delay (A3) and primary risk (C1) were the most important criteria because they have the highest centre degree. This also reflected the fact that the failure time delay was the biggest factor influencing the benefits, while the target risk was the main risk of the system. According to the ANP analysis results, which were presented in Table 11, we could see the weights of the eleven criteria, and average failure time delay (A3), hidden danger correction rate (A4), primary risk (C1) owned relatively high weights. Thus, based on the viewpoints of experts, these factors were relatively important and should be taken into account when taking risk response measures. The ranking results of risk response strategies obtained by the TOPSIS method were shown in Table 15. According to the value of C*, the ranking results of the four plans were plan 1, plan 3, plan 4 and plan 2. The value of C* in plan 1 was 0.740, and plan 1 was the optimal plan. Experts believed that the shunting derailment risk of Huangyangcheng station was 7, which belonged to a tolerable risk level, and the risk was completely controllable. Therefore, it was the most appropriate risk response strategy to pursue the maximization of benefits within the reasonable scope of costs, and freight volume (A1), average failure time delay (A3), and hidden danger correction rate (A4) should be taken seriously. Although plan 3 was the second-best plan after plan 1, and the risk was within the range of “as low as reasonably practicable”, it was only necessary to control the risk and prevent it from exceeding the range of “ALARP”, and no more resources were required to invest to get an inappropriate input-output ratio. Although the benefits, costs, and risks were considered comprehensively in plan 4, the economic benefits were not very prominent, so it was not adopted. For plan 2, if the costs were blindly reduced, the risks might get out of control, and then affect the normal production order. Accordingly, plan 3 was the most undesirable plan.

5. Conclusions and Future Directions

Train derailment risk response was very important for the safe operation of railways. This paper applied a hybrid MCDM model to select the best derailment risk response strategy. First, the DEMATEL was used to acquire the complex coupling relationship among criteria, and the indicators with a relatively small influence were excluded. Then, ANP and TOPSIS methods were used in the decision-making process, and the weights obtained by the ANP approach were used as the input of the TOPSIS calculation and alternative priorities, thus determining the priority of criteria.
The following contributions were made in this study. Firstly, the technology presented in this paper provided a reliable and simple method for the selection of shunting derailment risk response plans, and realized the change of risk response strategy selection from qualitative to quantitative. Further, a useful tool for railway safety managers to choose the optimal risk response plan was presented. Secondly, many studies had neglected the complex causal relationships among criteria. In this study, the combination of DEMATEL and ANP was used to acquire the criteria and their weights, and a clear map was obtained showing the causal relationships among criteria. Thirdly, the model deeply considered the role of secondary risk and residual risk in the process of evaluation criteria selection. This study applied tradeoff theory to balance the relationship between benefits, costs, and risks, and took secondary risk and residual risk as the risk response indicators to develop more comprehensive train derailment risk response strategies.
Although this model optimized the selection of derailment risk response plans, there were some limitations that could be improved. First of all, the advice came from just eight experts and the experts’ opinions were different because of different knowledge backgrounds. In future work, we could use the fuzzy logic theory to further improve the accuracy of expert evaluation. Secondly, sensitivity analysis should be used to find out the key factors affecting the decision, so as to adopt more effective response strategies. Thirdly, through a comparison with various MCDM methods, we could get the most suitable methods for the selection of risk response strategies.

Author Contributions

Methodology, H.Z.; software, H.Z.; writing—original draft preparation, H.Z.; writing—review and editing, Q.S. All authors have read and agreed to the published version of the manuscript.

Funding

This research received no external funding.

Acknowledgments

The authors are greatly thankful to the reviewers and editor for their precious advice to improve the quality of the thesis.

Conflicts of Interest

The authors declare no conflict of interest.

References

  1. Martey, E.N.; Attoh-Okine, N. Analysis of train derailment severity using vine copula quantile regression modeling. Transp. Res. Part C 2019, 105, 485–503. [Google Scholar] [CrossRef]
  2. Dindar, S.; Kaewunruen, S. Assessment of Turnout-Related Derailments by Various Causes; International Congress and Exhibition Sustainable Civil Infrastructures: Innovative Infrastructure Geotechnology; Springer: Cham, Switzerland, 2017; pp. 27–39. [Google Scholar]
  3. Wilson, N.; Fries, R.; Witte, M.; Haigermoser, A.; Wrang, M.; Evans, J.; Orlova, A. Assessment of safety against derailment using simulations and vehicle acceptance tests: A worldwide comparison of state-of-the-art assessment methods. Veh. Syst. Dyn. 2011, 49, 1113–1157. [Google Scholar] [CrossRef]
  4. ISO. Risk Management Vocabulary: ISO Guide 73-2009; ISO: Geneva, Switzerland, 2009. [Google Scholar]
  5. Li, S. ISO Risk Management Standard Explanation; Posts & Telecom Press: Beijing, China, 2012; pp. 44–352. [Google Scholar]
  6. Zuo, F.; Zhang, K. Selection of risk response actions with consideration of secondary risks. Int. J. Proj. Manag. 2018, 36, 241–254. [Google Scholar] [CrossRef]
  7. Zhang, Y.; Fan, Z.P. An optimization method for selecting project risk response strategies. Int. J. Proj. Manag. 2014, 32, 412–422. [Google Scholar] [CrossRef]
  8. Marshall, P.; Hirmas, A.; Singer, M. Heinrich’s pyramid and occupational safety: A statistical validation methodology. Saf. Sci. 2018, 101, 180–189. [Google Scholar] [CrossRef] [Green Version]
  9. Baumann, M.; Weil, M.; Peters, J.F.; Chibeles-Martins, N.; Moniz, A.B. A review of multi-criteria decision making approaches for evaluating energy storage systems for grid applications. Renew. Sustain. Energy Rev. 2019, 107, 516–534. [Google Scholar] [CrossRef]
  10. Sasan, B.; Taha, M. Evaluation and selection of clustering methods using a hybrid group MCDM. Expert Syst. Appl. 2019, 138, 112817. [Google Scholar] [CrossRef]
  11. Zoran, S.; Dragisa, S.; Miljanović, I.; Milanović, D. Application of MCDM methods for flotation machine selection. Miner. Eng. 2019, 137, 140–146. [Google Scholar]
  12. Sierra, L.A.; Yepes, V.; Pellicer, E. A review of multi-criteria assessment of the social sustainability of infrastructures. J. Clean. Prod. 2018, 187, 496–513. [Google Scholar] [CrossRef]
  13. Rajak, M.; Shaw, K. Evaluation and selection of mobile health (mHealth) applications using AHP and fuzzy TOPSIS. Technol. Soc. 2019, 59, 101186. [Google Scholar] [CrossRef]
  14. Zhang, X.; Su, J. A combined fuzzy DEMATEL and TOPSIS approach for estimating participants in knowledge-intensive crowd sourcing. Comput. Ind. Eng. 2019, 137, 106085. [Google Scholar] [CrossRef]
  15. Dehdasht, G.; Mohamad, Z.R.; Ferwati, M.S.; Abdullahi, M.; Keyvanfar, A.; McCaffer, R. DEMATEL-ANP risk assessment in oil and gas construction projects. Sustainability 2017, 9, 1420. [Google Scholar] [CrossRef] [Green Version]
  16. Nassereddine, M.; Eskandari, H. An integrated MCDM approach to evaluate public transportation systems in Tehran. Transp. Res. Part A 2017, 106, 427–439. [Google Scholar] [CrossRef] [Green Version]
  17. Erkan, C.; Ozge, N.B.; Celik, E.; Bilisik, O.N.; Erdogan, M.; Gumus, A.T.; Baracli, H. An integrated novel interval type-2 fuzzy MCDM method to improve customer satisfaction in public transportation for Istanbul. Transp. Res. Part E 2013, 58, 28–51. [Google Scholar]
  18. Nihan, Y.; Semra, E.T. The Selection of Railway System Projects with Multi Criteria Decision Making Methods: A Case Study for Istanbul. Procedia Comput. Sci. 2019, 158, 382–393. [Google Scholar]
  19. Mingwei, L.; Chao, H.; Zeshui, H. MULTIMOORA based MCDM model for site selection of car sharing station under picture fuzzy environment. Sustain. Cities Soc. 2020, 53, 101873. [Google Scholar] [CrossRef]
  20. Kabak, M.; Erbaş, M.; Çetinkaya, C.; Özceylan, E. A GIS-based MCDM approach for the evaluation of bike-share stations. J. Clean. Prod. 2018, 201, 49–60. [Google Scholar] [CrossRef]
  21. Wu, K.J.; Chen, Q.; Qi, Y.; Jiang, X.; Gao, S.; Tseng, M.L. Sustainable Development Performance for Small and Medium Enterprises Using a Fuzzy Synthetic Method-DEMATEL. Sustainability 2019, 11, 4119. [Google Scholar] [CrossRef] [Green Version]
  22. Zhang, H.; Sun, Q. Risk Assessment of Shunting Derailment Based on Coupling. Symmetry 2019, 11, 1359. [Google Scholar] [CrossRef] [Green Version]
  23. Tadić, S.; Zečević, S.; Krstić, M. A novel hybrid MCDM model based on fuzzy DEMATEL, fuzzy ANP and fuzzy VIKOR for city logistics concept selection. Expert. Syst. Appl. 2014, 41, 8112–8128. [Google Scholar] [CrossRef]
  24. Bongo, M.F.; Ocampo, L.A. A hybrid fuzzy MCDM approach for mitigating airport congestion: A case in Ninoy Aquino International Airport. J. Air Transp. Manag. 2017, 63, 1–16. [Google Scholar] [CrossRef]
  25. Pineda, P.J.G.; Liou, J.J.H.; Hsu, C.C.; Chuang, Y.C. An integrated MCDM model for improving airline operational and financial performance. J. Air Transp. Manag. 2018, 68, 103–117. [Google Scholar] [CrossRef]
  26. Lu, M.T.; Hsu, C.C.; Liou, J.J.; Lo, H.W. A hybrid MCDM and sustainability-balanced scorecard model to establish sustainable performance evaluation for international airports. J. Air Transp. Manag. 2018, 71, 9–19. [Google Scholar] [CrossRef]
  27. Chen, I.S. A combined MCDM model based on DEMATEL and ANP for the selection of airline service quality improvement criteria: A study based on the Taiwanese airline industry. J. Air Transp. Manag. 2016, 57, 7–18. [Google Scholar] [CrossRef]
  28. Pham, T.; Kim, K.; Yeo, G.T. The Panama Canal Expansion and Its Impact on East–West Liner Shipping Route Selection. Sustainability 2018, 10, 4353. [Google Scholar] [CrossRef] [Green Version]
  29. Buyukozkan, G.; Çifçi, G. A novel hybrid MCDM approach based on fuzzy DEMATEL, fuzzy ANP and fuzzy TOPSIS to evaluate green suppliers. Expert Syst. Appl. 2012, 39, 3000–3011. [Google Scholar] [CrossRef]
  30. Liu, J.; Yin, Y. An integrated method for sustainable energy storing node optimization selection in China. Energy Convers. Manag. 2019, 199, 112049. [Google Scholar] [CrossRef]
  31. Morteza, Z.; Reza, F.M.; Seddiq, M.M.; Sharareh, P.; Jamal, G. Selection of the optimal tourism site using the ANP and fuzzy TOPSIS in the framework of Integrated Coastal Zone Management: A case of Qeshm Island. Ocean Coast. Manag. 2016, 130, 179–187. [Google Scholar] [CrossRef]
  32. Chen, J.K.; Chen, I.S. Using a novel conjunctive MCDM approach based on DEMATEL, fuzzy ANP, and TOPSIS as an innovation support system for Taiwanese higher education. Expert Syst. Appl. 2010, 37, 1981–1990. [Google Scholar] [CrossRef]
  33. Nilashi, M.; Samad, S.; Manaf, A.A.; Ahmadi, H.; Rashid, T.A.; Munshi, A.; Ahmed, O.H. Factors influencing medical tourism adoption in Malaysia: A DEMATEL Fuzzy TOPSIS approach. Comput. Ind. Eng. 2019, 137, 106005. [Google Scholar] [CrossRef]
  34. Hu, Y.C.; Lee, P.C.; Chuang, Y.S.; Chiu, Y.J. Improving the Sustainable Competitiveness of Service Quality within Air Cargo Terminals. Sustainability 2018, 10, 2319. [Google Scholar] [CrossRef] [Green Version]
  35. Belton, I.; MacDonald, A.; Wright, G.; Hamlin, I. Improving the practical application of the Delphi method in group-based judgment: A six-step prescription for a well-founded and defensible process. Technol. Forecast. Soc. Chang. 2019, 147, 72–82. [Google Scholar] [CrossRef]
  36. De Jesus, A.; Antunes, P.; Santos, R.; Mendonça, S. Eco-innovation pathways to a circular economy: Envisioning priorities through a Delphi approach. J. Clean. Prod. 2019, 228, 1493–1513. [Google Scholar] [CrossRef]
  37. Kudłak, R.; Szőcs, I.; Krumay, B.; Martinuzzi, A. The future of CSR—Selected findings from a Europe-wide Delphi study. J. Clean. Prod. 2018, 183, 282–291. [Google Scholar] [CrossRef]
  38. Tadic, S.; Krstic, M.; Roso, V.; Brnjac, N. Planning an intermodal terminal for the sustainable transport networks. Sustainability 2019, 11, 4102. [Google Scholar] [CrossRef] [Green Version]
  39. Graham, J.D.; Wiener, J.B. Risk versus risk: Tradeoffs in protecting health and the environment. JAMA J. Am. Med. Assoc. 1996, 275, 1134–1135. [Google Scholar]
  40. ISO. Risk Management–Risk Assessment Techniques: IEC 31010-2009; ISO: Geneva, Switzerland, 2009. [Google Scholar]
  41. Yazdani, M.; Chatterjee, P.; Montero-Simo, M.J.; Araque-Padilla, R.A. An Integrated Multi-Attribute Model for Evaluation of Sustainable Mobile Phone. Sustainability 2019, 11, 3704. [Google Scholar] [CrossRef] [Green Version]
Figure 1. The proposed MCDM model.
Symmetry 12 00047 g001
Figure 2. The location of Huangyangcheng station.
Symmetry 12 00047 g002
Figure 3. Sequence diagram of shunting derailment response criteria.
Symmetry 12 00047 g003
Figure 4. Shunting derailment risk response criteria network diagram.
Symmetry 12 00047 g004
Table 1. Basic information of selected experts.
ExpertsAgeEducation BackgroundProfessional TitleYears of Working
Expert 145Bachelor degreeEngineer title22 years
Expert 250Bachelor degreeSenior engineer28 years
Expert 330Graduate degreeEngineer title5 years
Expert 442Trade school diplomaEngineer title21years
Expert 535Trade school diplomaAssistant Engineer title14 years
Expert 645Bachelor degreeProfessor20 years
Expert 738Doctor degreeAssociate professor6 years
Expert 842Bachelor degreeAssociate professor18 years
Table 2. Nine-point intensity of importance scale and its definition.
ScaleDefinition
1Equal
2Equally to Moderately more dominant
3Moderately more dominant
4Moderately to Strongly more dominant
5Strongly more dominant
6Strongly to Very Strongly more dominant
7Very Strongly more dominant
8Very Strongly to Extremely more dominant
9Extremely more dominant
Table 3. Extracted risk response dimensions and criteria.
DimensionsCriteriaDescription
Benefits (A)Freight Volume (A1)Benefit attribute referred to the attribute whose value was as large as possible. A1 and A4, A5 were benefit attribute, the larger the better, while A2, A3 were cost attribute, the smaller the better. Statistical units, respectively, were tons, hours, minutes and percentages.
Stopping Time (A2)
Average Failure Time Delay (A3)
Hidden Danger Correction Rate (A4)
Costs (B)Education and Training Cost (B1)Cost referred to the expenditure to ensure and improve the level of safety production, or the loss caused by safety problems affecting production. B1, B2, B3, and B4 were cost attributes, the smaller the better, and the statistical units were million yuan.
Operation Cost (B2)
Maintain Expenditure (B3)
Emergency Rescue Cost (B4)
Risks (C)Primary Risk (C1)Risk referred to the impact of uncertainty on the target, which included primary risk, secondary risk, and residual risk. All of them were cost attribute, the smaller the better, and each risk size was a discrete variable.
Secondary Risk (C2)
Residual Risk (C3)
Table 4. Direct influence matrix.
IndicesA1A2A3A4B1B2B3B4C1C2C3
A101111232211
A240000100211
A343012332211
A421301221321
B121220121111
B201121000432
B321310002321
B421300200132
C132342231011
C221211112101
C311211221110
Table 5. Normalized direct influence matrix.
IndicesA1A2A3A4B1B2B3B4C1C2C3
A10.000.050.050.050.050.090.140.090.090.050.05
A20.180.000.000.000.000.050.000.000.090.050.05
A30.180.140.000.050.090.140.140.090.090.050.05
A40.090.050.140.000.050.090.090.050.140.090.05
B10.090.050.090.090.000.050.090.050.050.050.05
B20.000.050.050.090.050.000.000.000.180.140.09
B30.090.050.140.050.000.000.000.090.140.090.05
B40.090.050.140.000.000.090.000.000.050.140.09
C10.140.090.140.180.090.090.140.050.000.050.05
C20.090.050.090.050.050.050.050.090.050.000.05
C30.050.050.090.050.050.090.090.050.050.050.00
Table 6. Simplified composite impact matrix.
IndicesA1A2A3A4B1B2B3B4C1C2C3
A10.220.180.250.190.140.250.300.220.290.210.17
A20.300.000.120.000.000.150.120.000.210.140.12
A30.470.320.270.240.220.350.360.260.380.270.22
A40.360.220.370.180.170.290.310.210.380.280.19
B10.300.180.280.220.100.200.250.170.240.200.16
B20.220.180.240.240.150.170.180.130.360.280.20
B30.330.200.340.190.110.190.190.230.340.250.17
B40.290.180.300.130.100.250.160.120.230.270.20
C10.450.290.420.370.230.330.390.240.310.280.22
C20.280.170.260.160.130.190.200.200.220.140.15
C30.240.170.260.170.130.230.240.160.230.190.11
Table 7. Center degree and cause degree of criteria.
IndicesA1A2A3A4B1B2B3B4C1C2C3
( r i + f j ) 5.893.226.475.063.784.955.224.176.734.604.03
( r i f j ) −1.06−0.940.260.900.80−0.24−0.150.300.32−0.390.20
Table 8. Unweighted super-matrix of shunting derailment risk response criteria.
IndicesA1A2A3A4B1B2B3B4C1C2C3
A10.000.000.000.000.120.280.180.120.160.120.18
A20.160.000.250.250.190.140.110.190.100.190.11
A30.540.750.000.750.420.390.420.420.470.420.29
A40.300.250.750.000.270.200.300.270.280.270.42
B10.170.120.110.110.000.160.000.210.110.110.20
B20.260.220.160.350.400.000.670.240.280.350.33
B30.450.460.470.350.400.590.000.550.450.350.33
B40.120.200.260.190.200.250.330.000.160.190.14
C10.540.560.630.540.500.630.540.560.000.800.75
C20.300.320.240.300.250.240.300.320.670.000.25
C30.160.120.140.160.250.140.160.120.330.200.00
Table 9. Weighted super-matrix of shunting derailment risk response criteria.
IndicesA1A2A3A4B1B2B3B4C1C2C3
A10.000.000.000.000.060.14 0.09 0.06 0.08 0.06 0.09
A20.080.000.120.120.100.07 0.05 0.10 0.05 0.10 0.05
A30.270.380.000.380.210.20 0.21 0.21 0.23 0.21 0.15
A40.150.130.380.000.140.10 0.15 0.14 0.14 0.14 0.21
B10.040.030.030.030.000.04 0.00 0.05 0.03 0.03 0.05
B20.070.050.040.090.100.00 0.17 0.06 0.07 0.08 0.08
B30.110.110.110.080.100.15 0.00 0.14 0.11 0.09 0.08
B40.030.060.060.040.050.06 0.08 0.00 0.04 0.05 0.04
C10.130.140.160.130.130.16 0.13 0.14 0.00 0.20 0.19
C20.070.080.060.070.060.06 0.07 0.08 0.17 0.00 0.06
C30.040.030.030.040.060.03 0.04 0.03 0.08 0.05 0.00
Table 10. Limiting matrix of shunting derailment risk response criteria.
IndicesA1A2A3A4B1B2B3B4C1C2C3
A10.040.040.040.040.040.040.040.040.040.040.04
A20.080.080.080.080.080.080.080.080.080.080.08
A30.210.210.210.210.210.210.210.210.210.210.21
A40.160.160.160.160.160.160.160.160.160.160.16
B10.030.030.030.030.030.030.030.030.030.030.03
B20.070.070.070.070.070.070.070.070.070.070.07
B30.100.100.100.100.100.100.100.100.100.100.10
B40.050.050.050.050.050.050.050.050.050.050.05
C10.130.130.130.130.130.130.130.130.130.130.13
C20.080.080.080.080.080.080.080.080.080.080.08
C30.040.040.040.040.040.040.040.040.040.040.04
Table 11. Weights of shunting derailment risk response sub-criteria.
NameA1A2A3A4B1B2B3B4C1C2C3
Normalized by Cluster0.090.170.420.330.110.290.400.200.520.310.17
Limiting0.040.080.210.160.030.070.100.050.130.080.04
Table 12. Initial decision matrix for shunting derailment risk response.
PlansA1A2A3A4B1B2B3B4C1C2C3
Plan 11000824946044090048654
Plan 28009.537853539072045765
Plan 39008.528987048095055433
Plan 4850930935042080052655
Table 13. Normalized decision matrix for shunting derailment risk response.
PlansA1A2A3A4B1B2B3B4C1C2C3
Plan 10.2820.2290.2020.2540.2790.2540.2670.2400.2610.2630.235
Plan 20.2250.2710.3110.2300.1630.2250.2140.2250.3040.3160.294
Plan 30.2540.2430.2350.2650.3260.2770.2820.2750.1740.1580.176
Plan 40.2390.2570.2520.2510.2330.2430.2370.2600.2610.2630.294
Table 14. Weighted normalized decision matrix for shunting derailment risk response.
PlansA1A2A3A4B1B2B3B4C1C2C3
Plan 10.0120.0190.0330.0530.0080.0180.0260.0120.0340.0200.010
Plan 20.0100.0230.0510.0480.0040.0160.0210.0120.0400.0240.013
Plan 30.0110.0200.0390.0550.0090.0200.0280.0140.0230.0120.008
Plan 40.0100.0220.0420.0520.0060.0180.0230.0130.0340.0200.013
Table 15. The degree of alternatives closeness and ranking.
PlansD+D−C*Rank
Plan 10.0130.0370.7401
Plan 20.0290.0100.2494
Plan 30.0120.0260.6842
Plan 40.0200.0140.4123

