Structural Monitoring and Performance Assessment of Shield Tunnels during the Operation Period, Based on Distributed Optical-Fiber Sensors

 ,
,
Abstract
:1. Introduction
2. Distributed Optical-Fiber Sensor
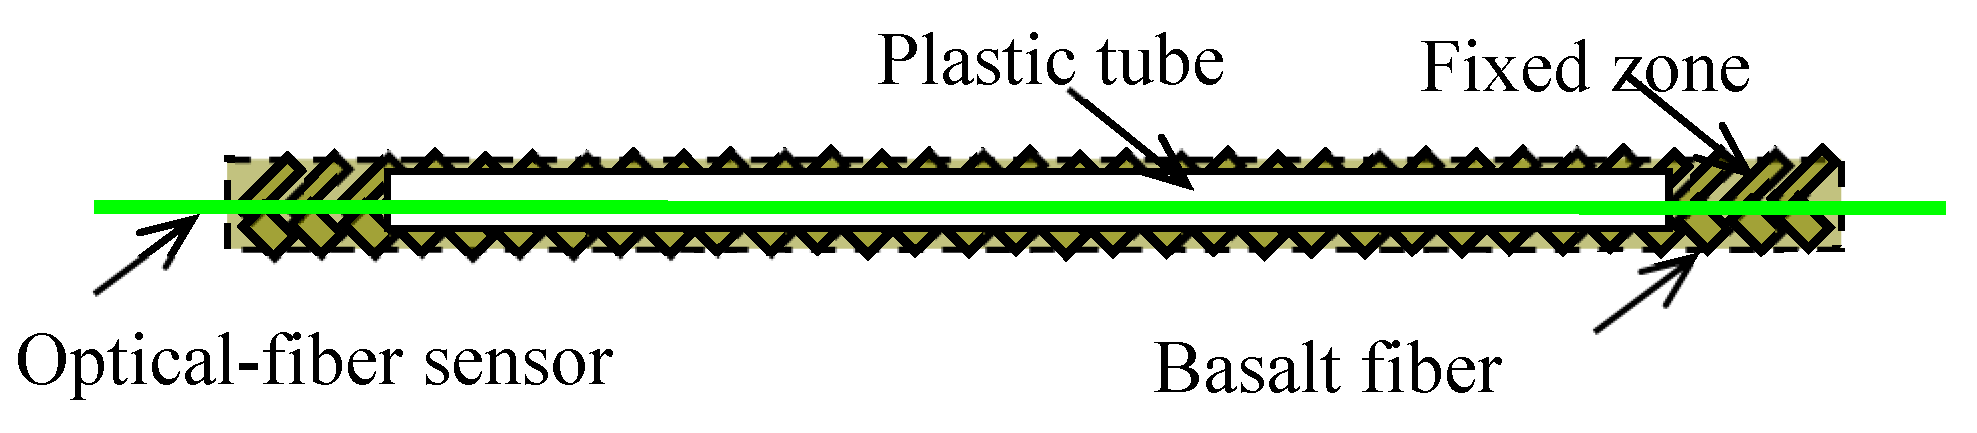
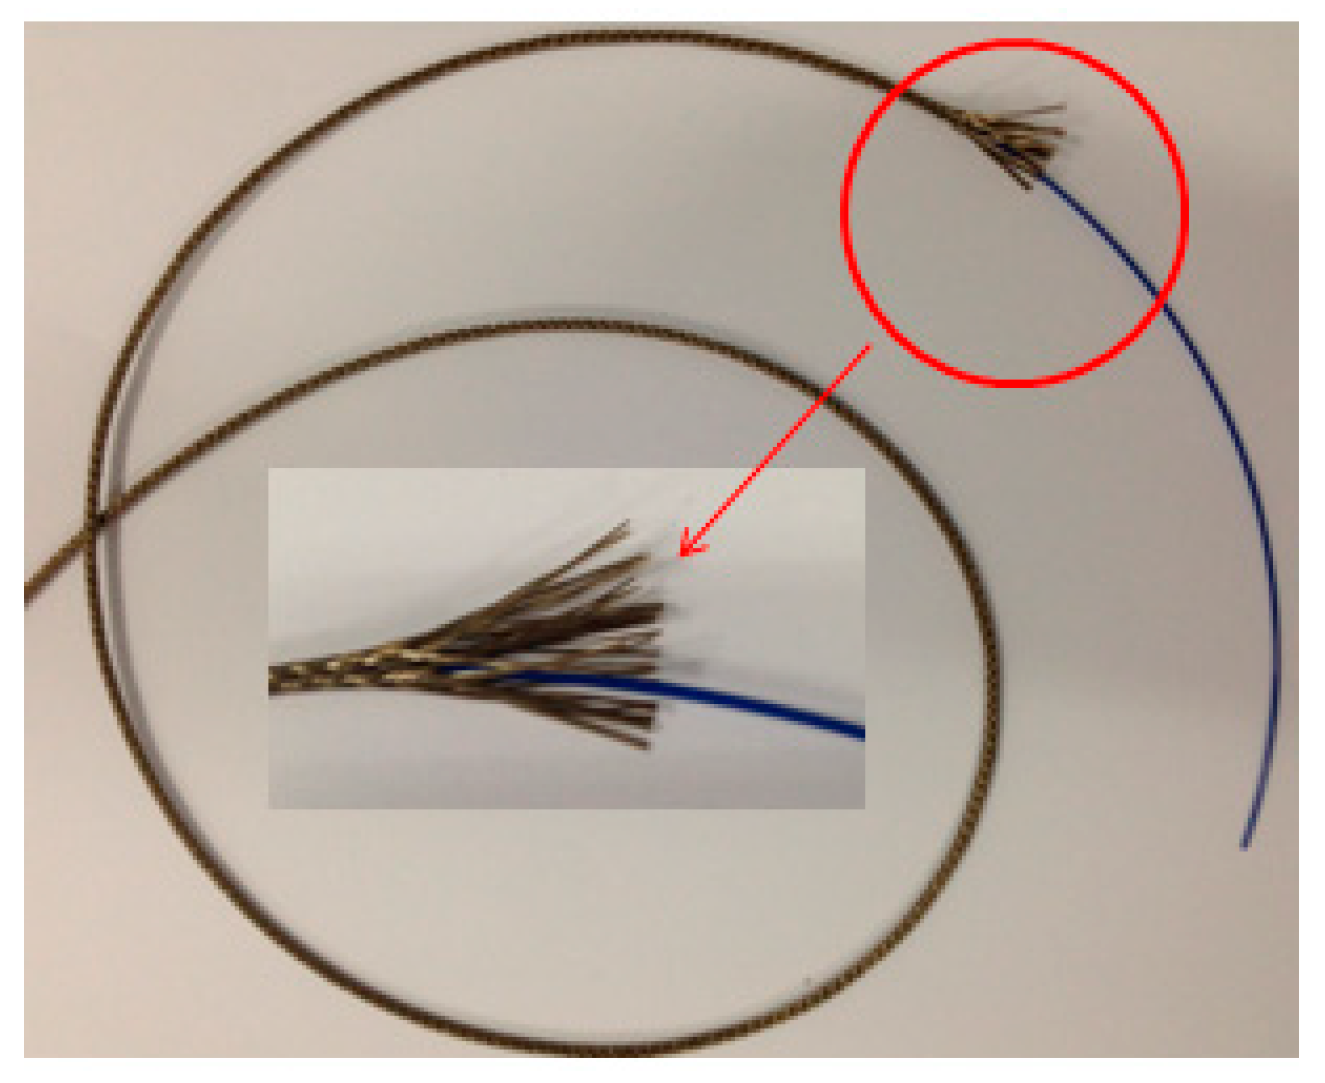
2.1. New Packaged Optical-Fiber Sensors
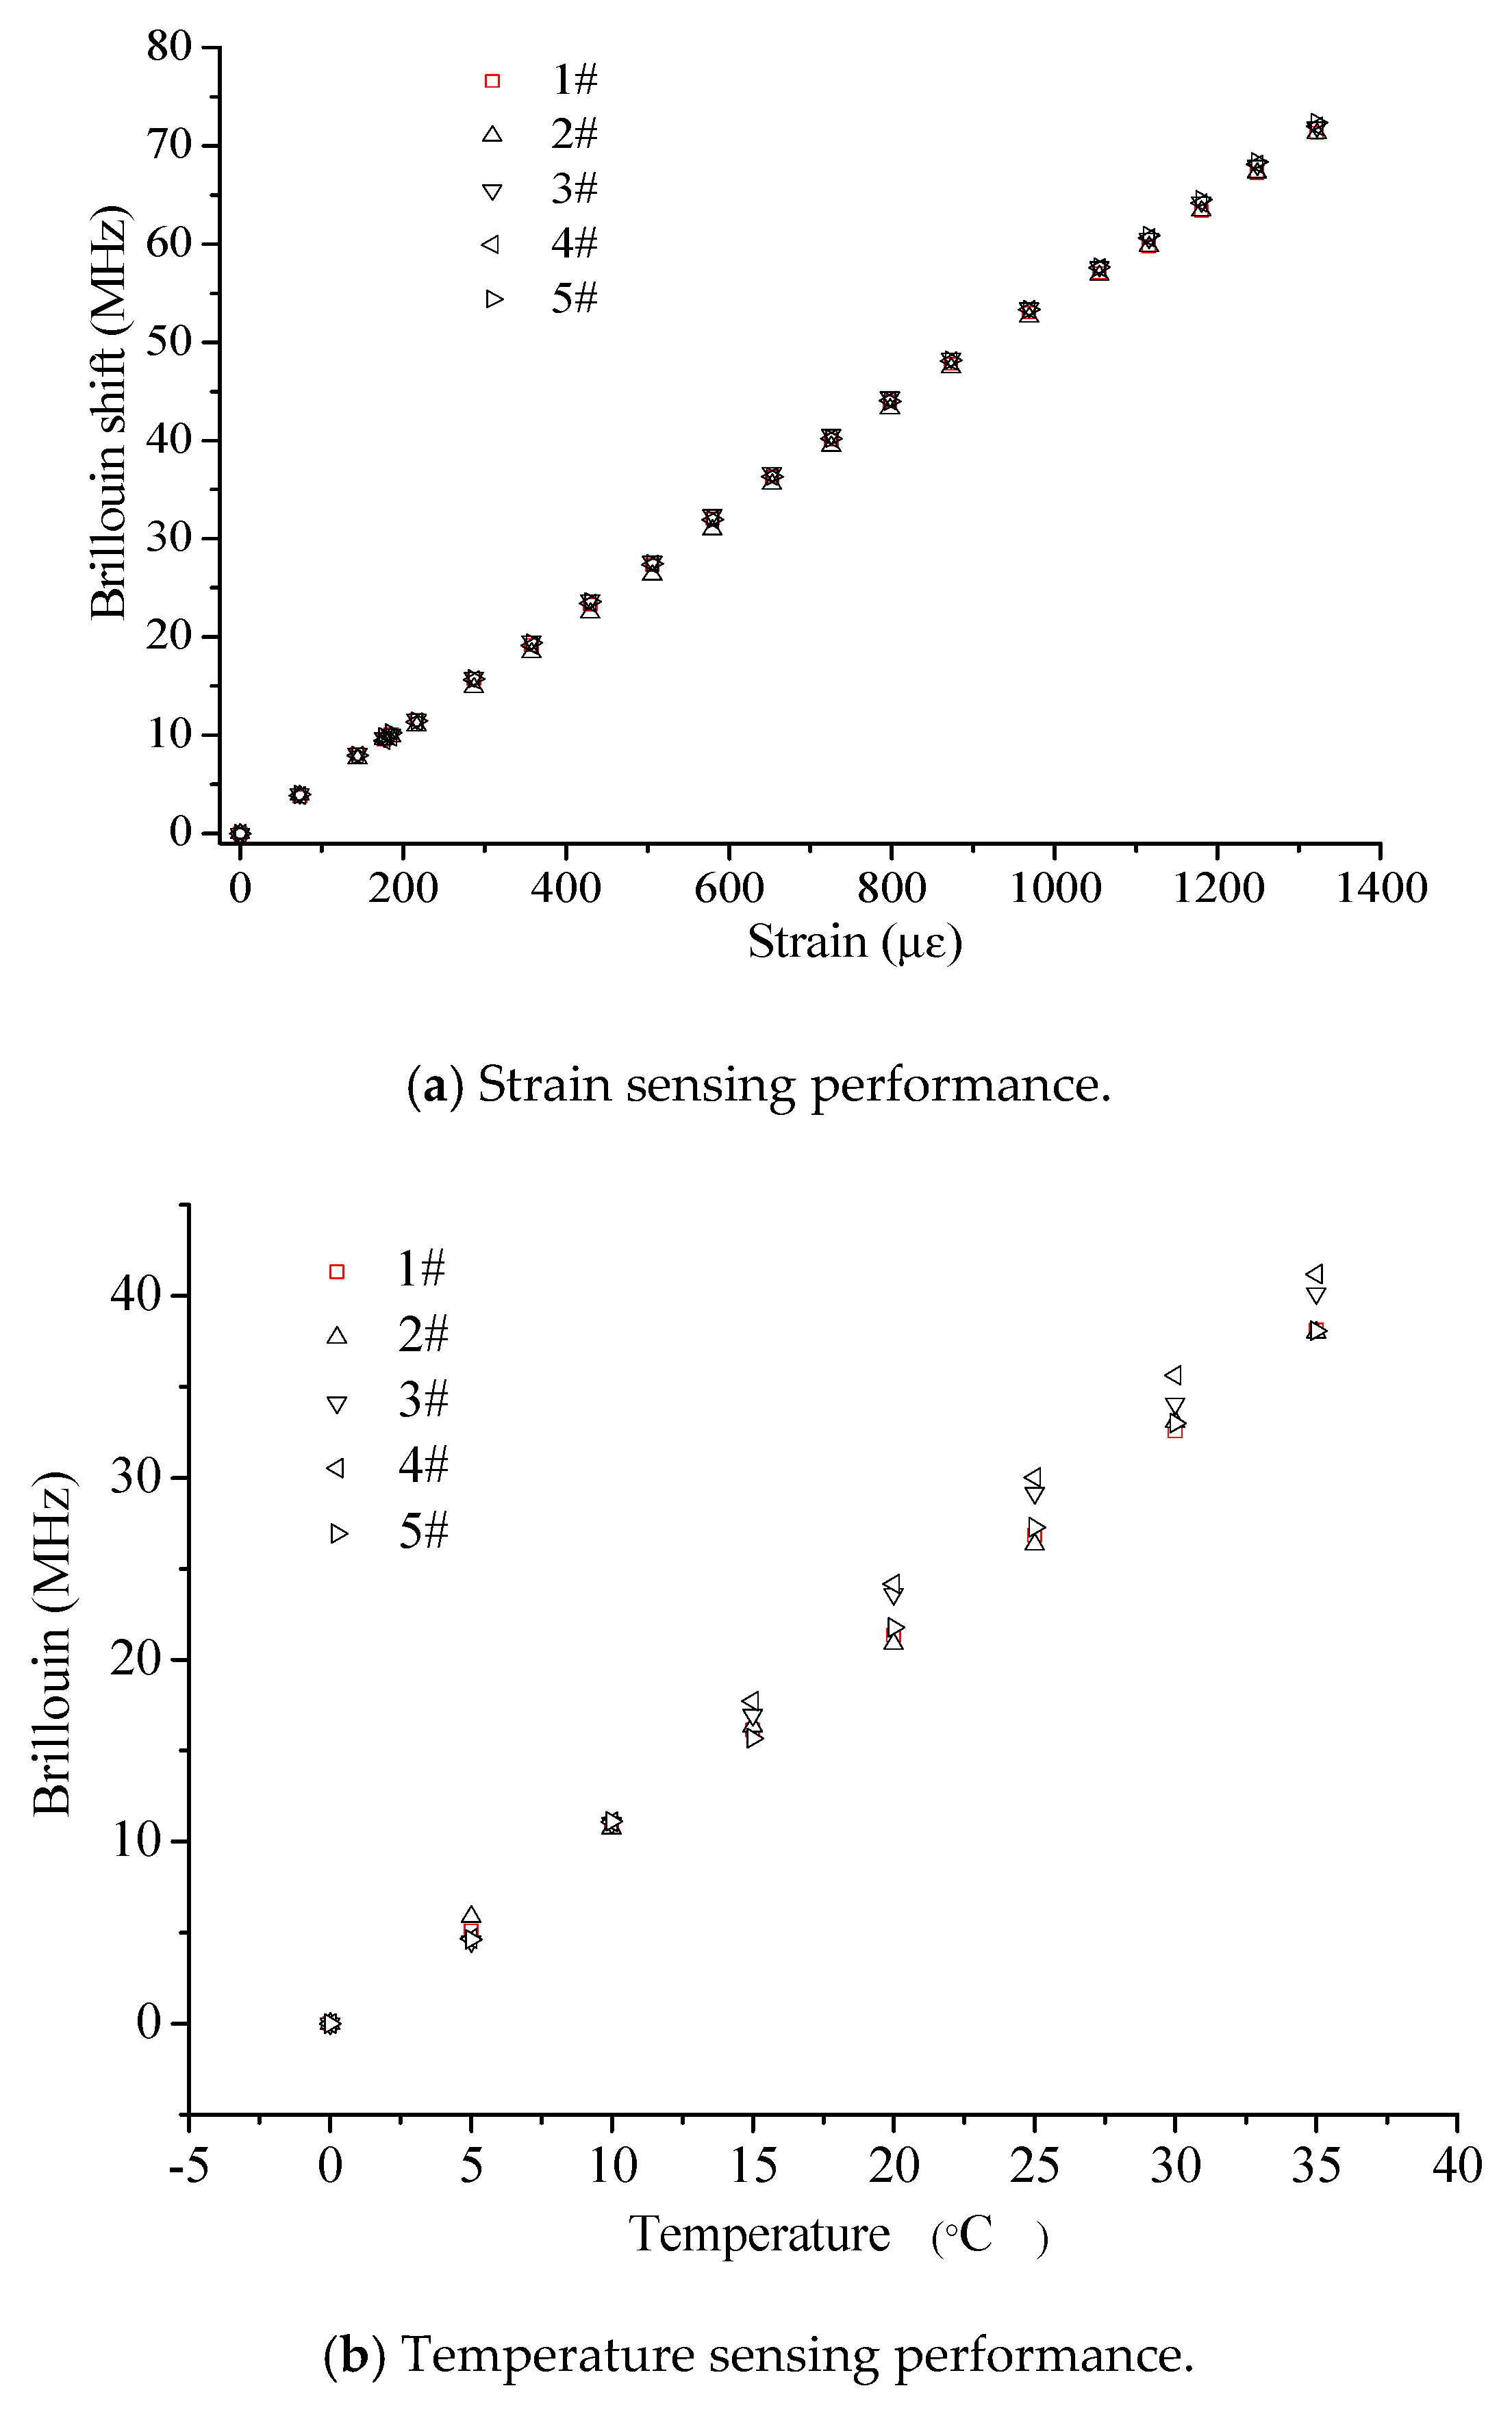
2.2. Sensing Performance of the Proposed Sensor
3. Structural Monitoring and Performance Assessment System of Shield Tunnels
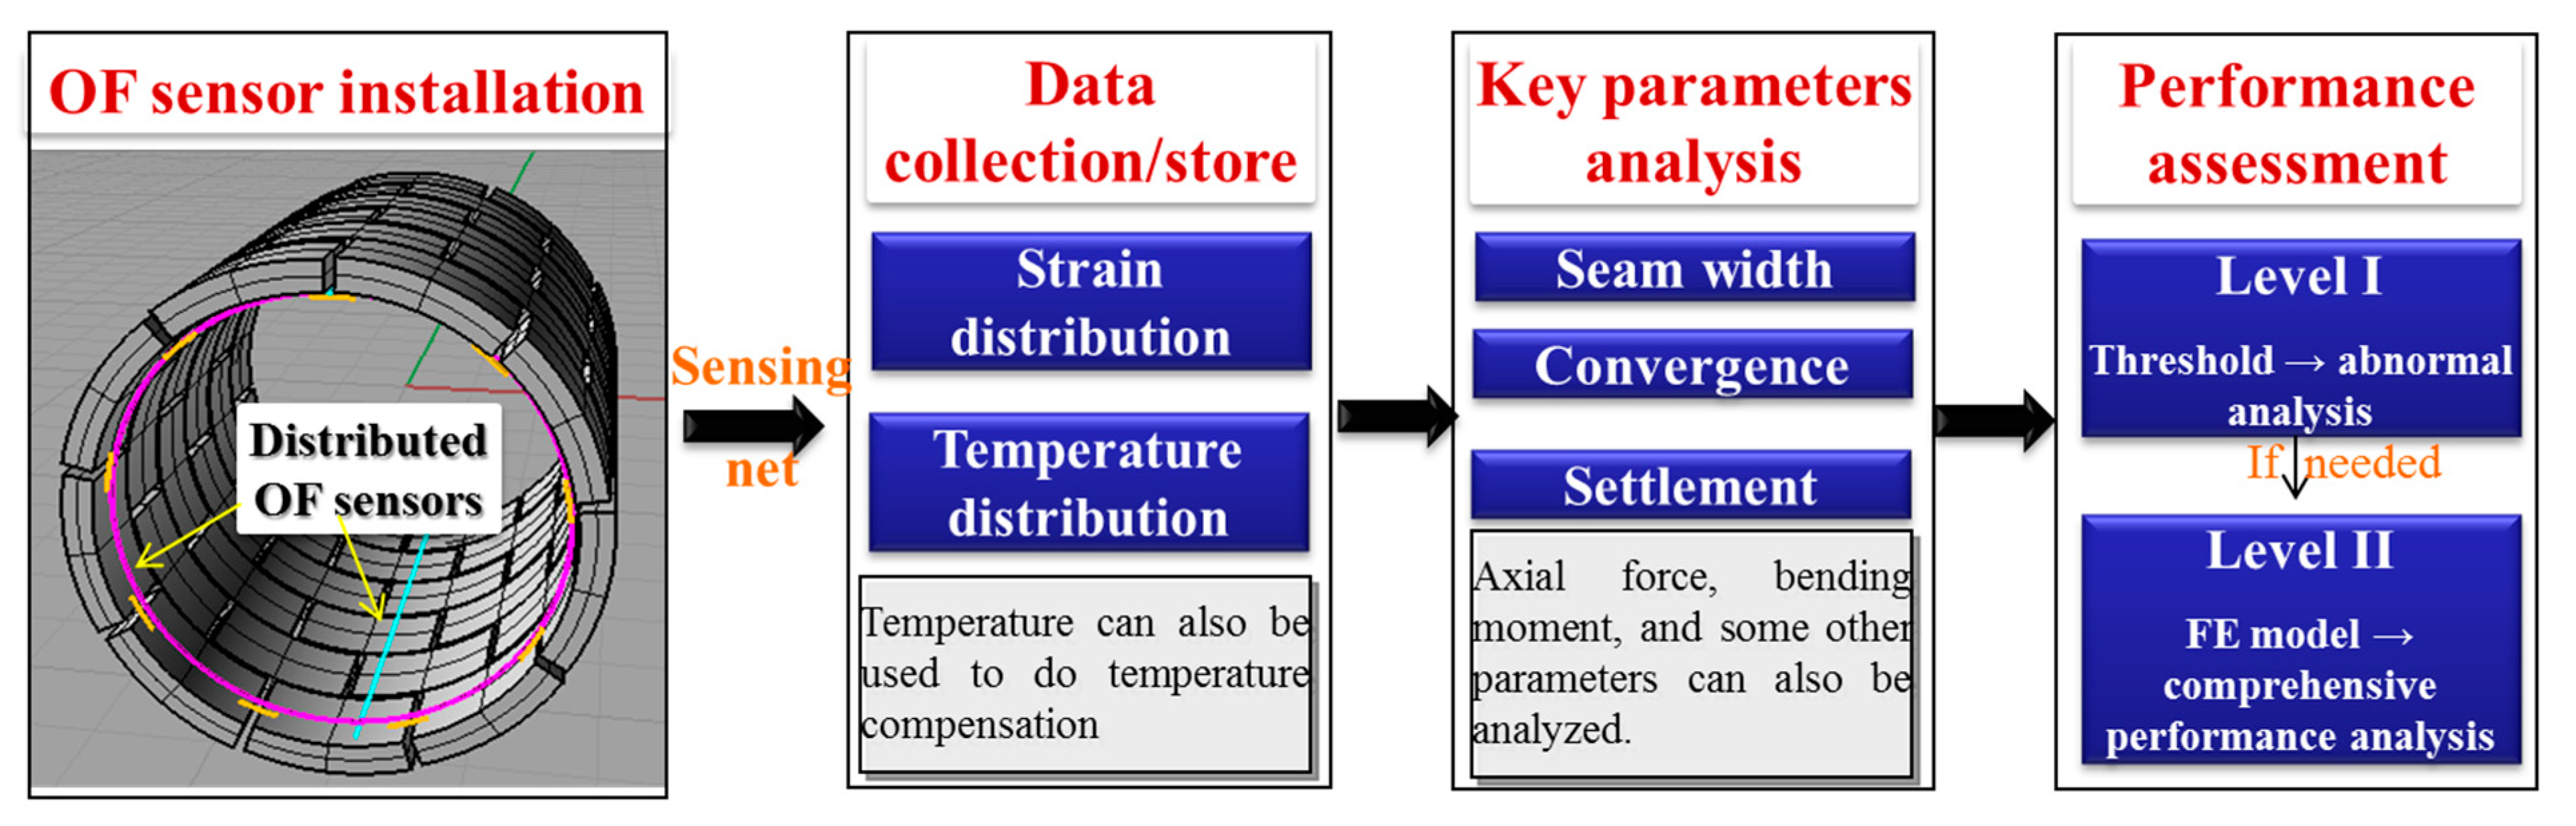
3.1. Framework of the Structural Health Monitoring System of Shield Tunnels
3.2. Key Theory and Technology for Structural Monitoring and Performance Assessment
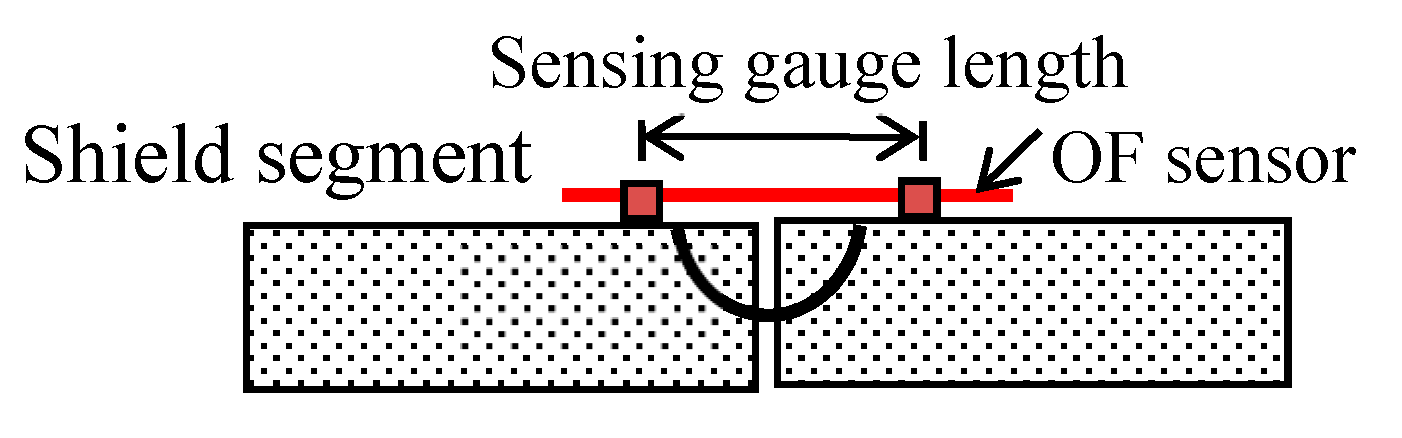
3.2.1. Seam Width Monitoring
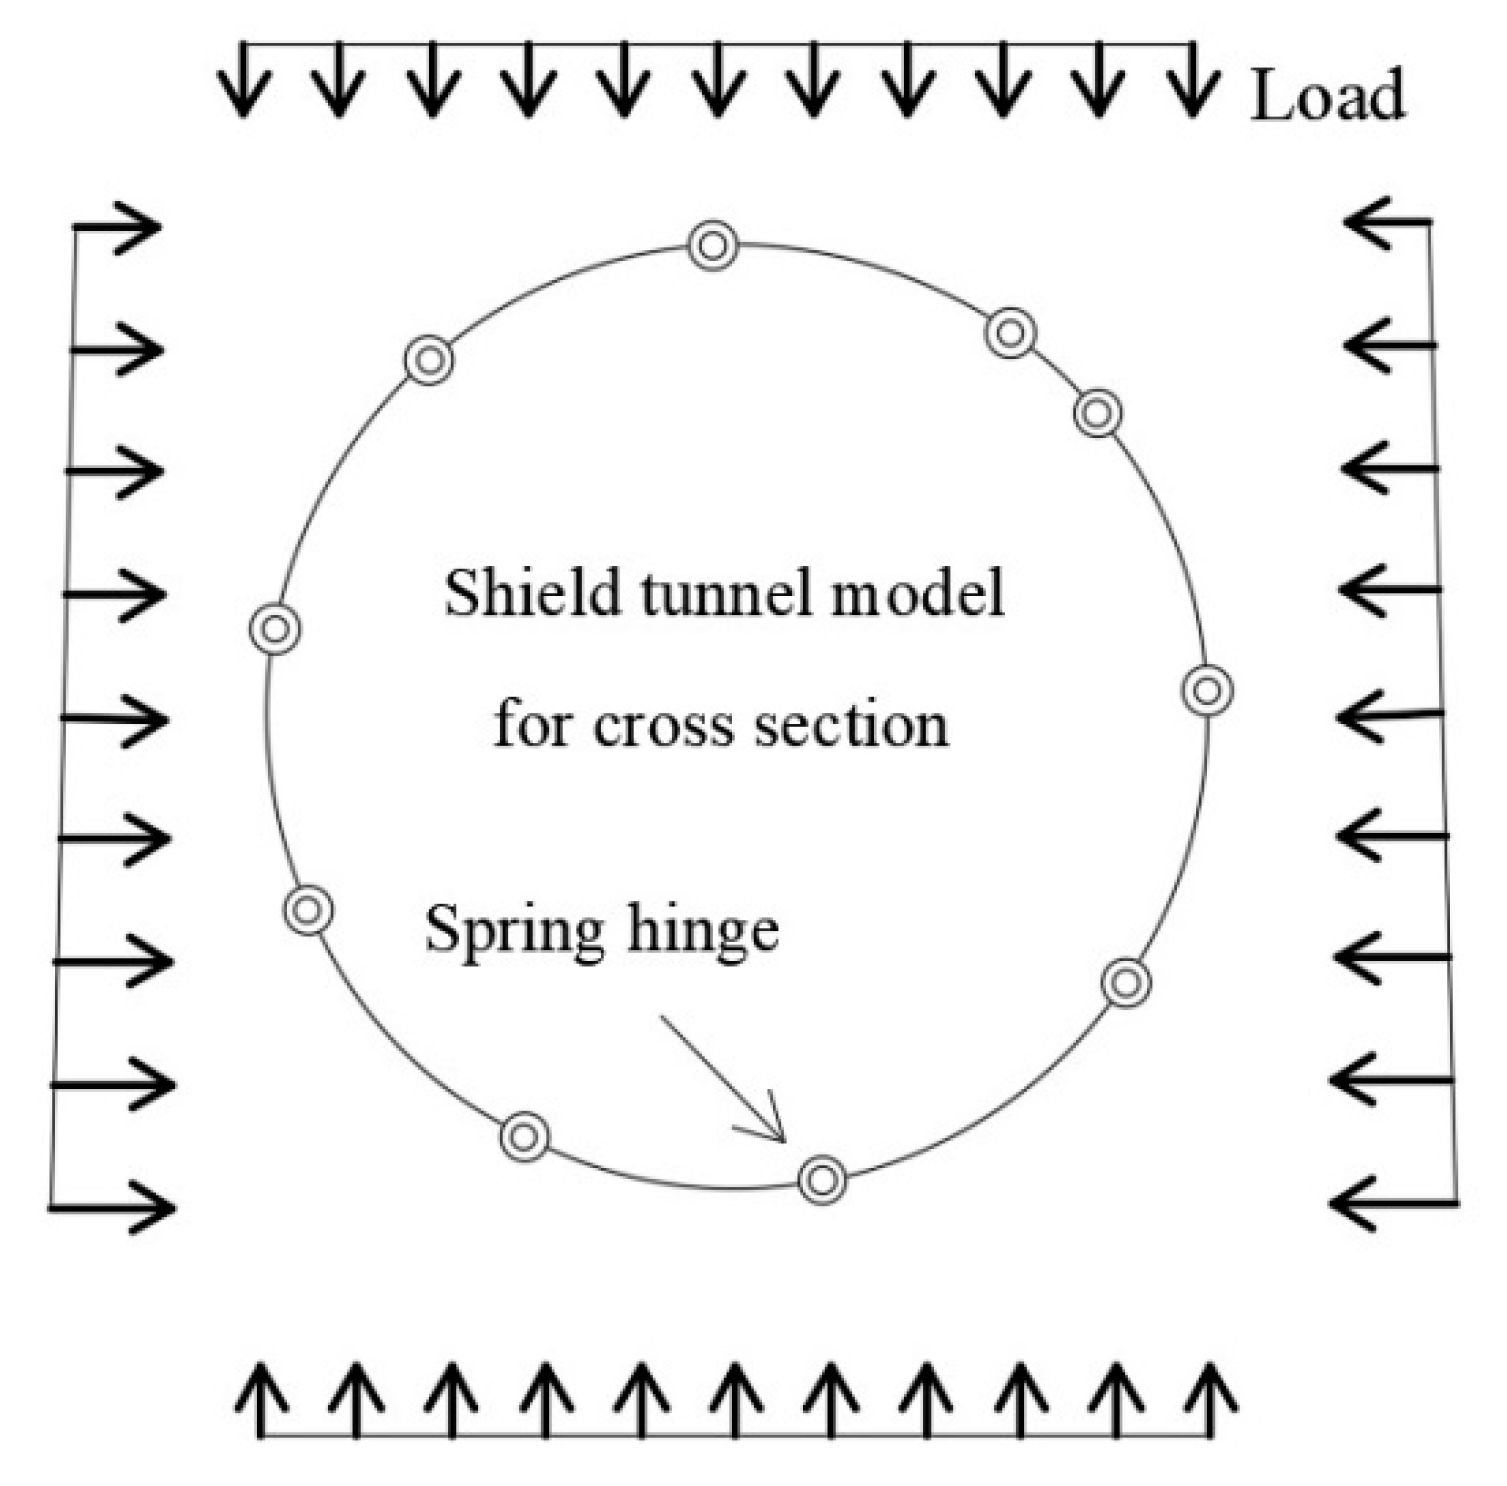
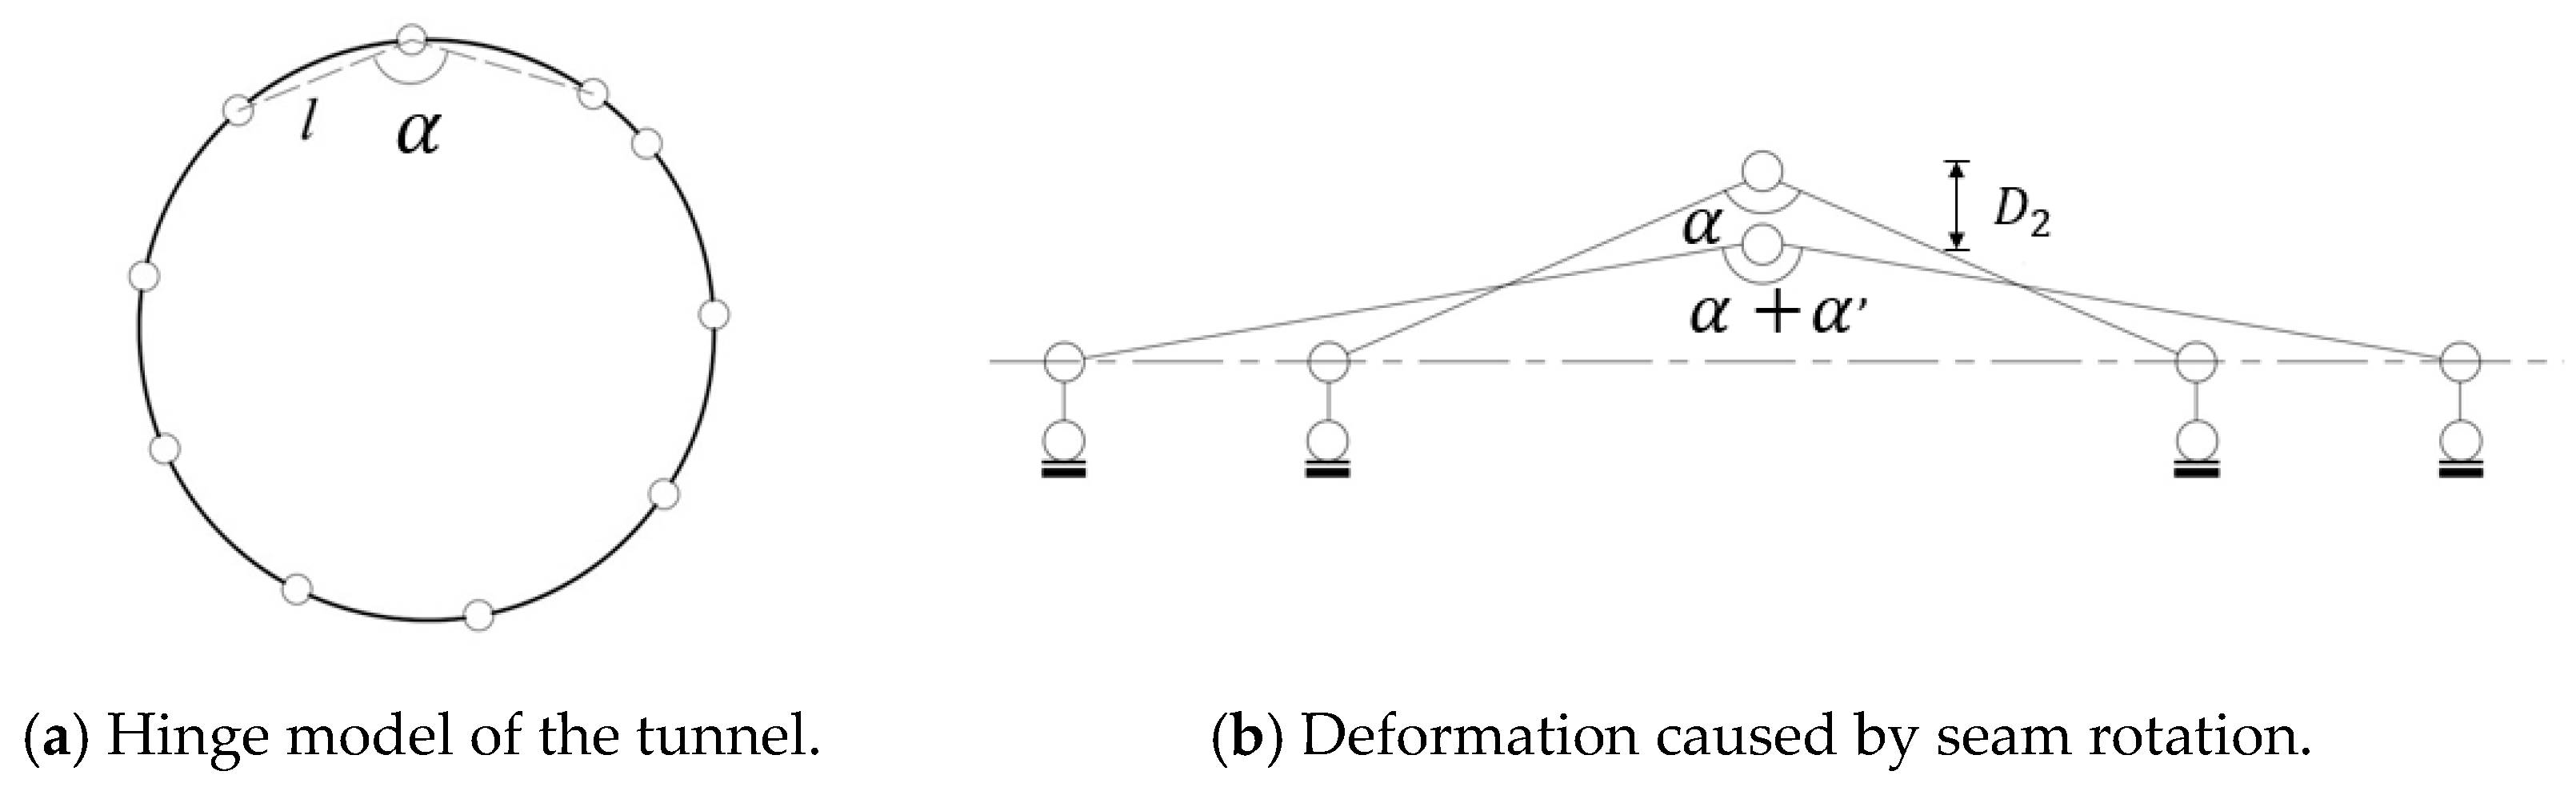
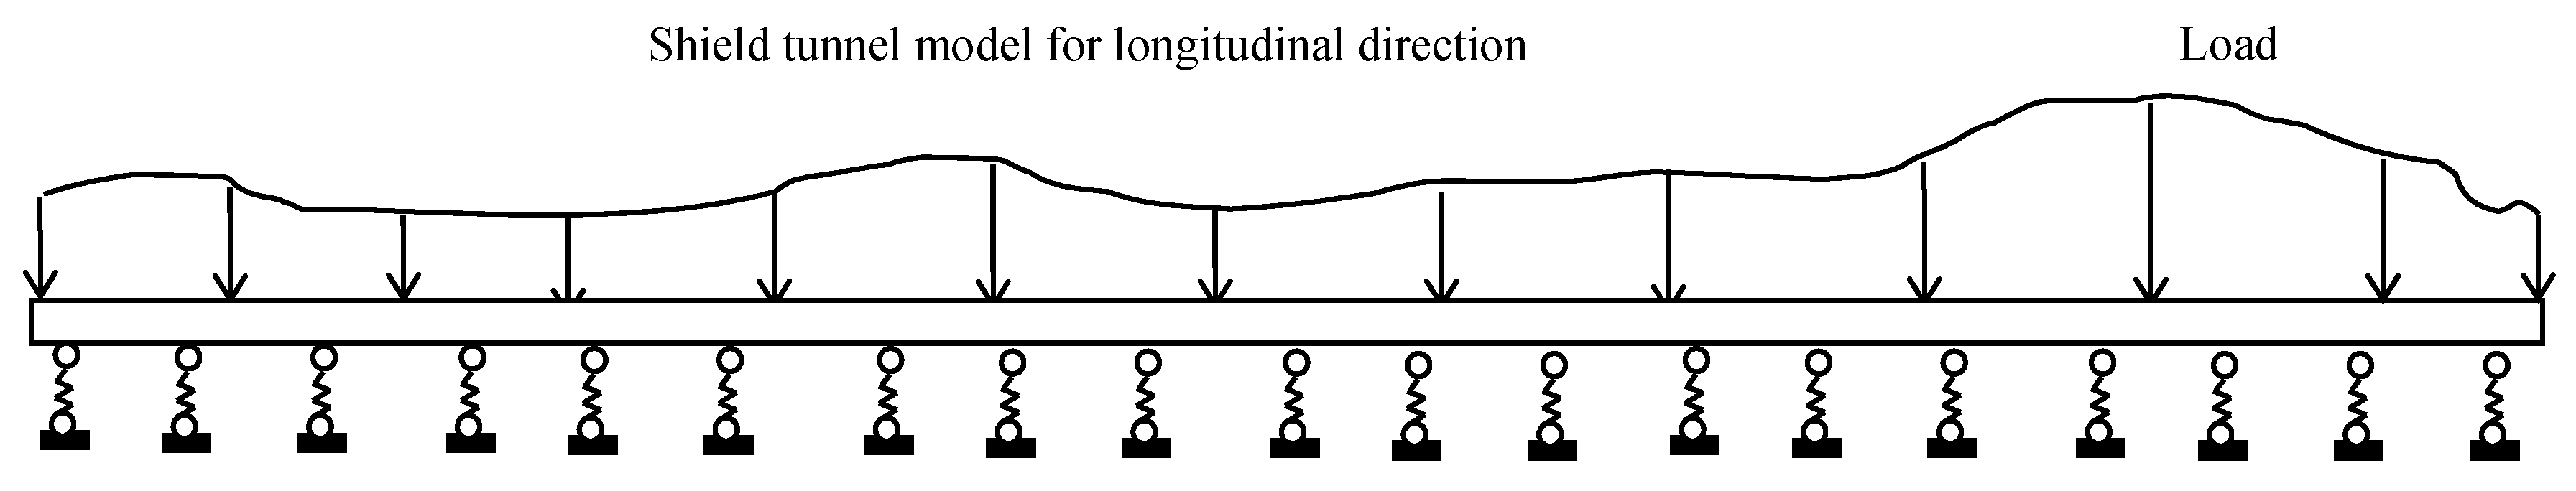
3.2.2. Convergence and Settlement Monitoring
3.2.3. Structural Performance Assessment Method
4. Field Experiments at the Nanjing Yangtze River Tunnel
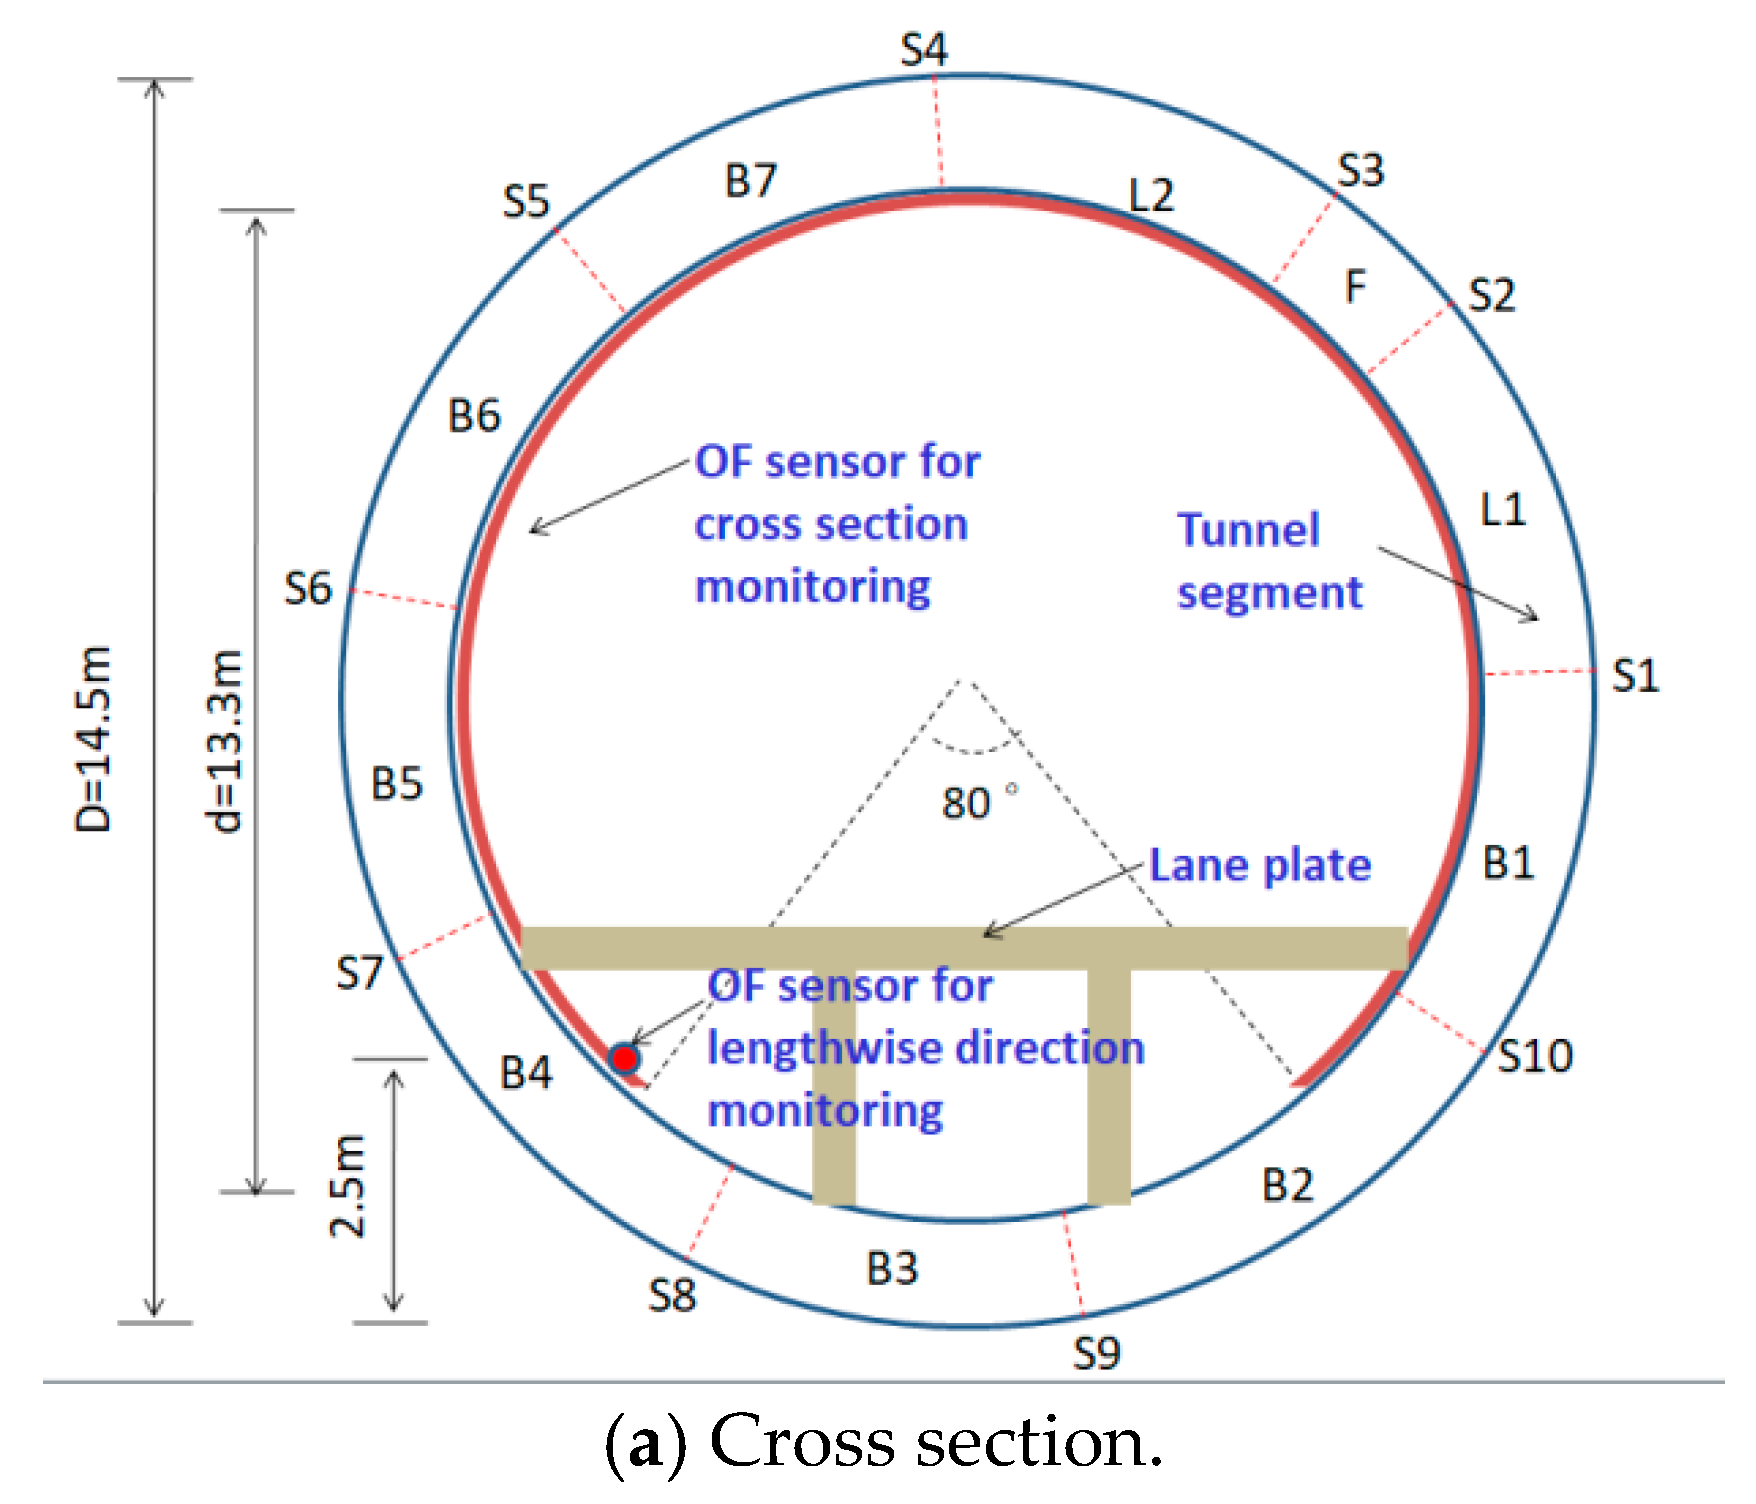
4.1. Experiment Description
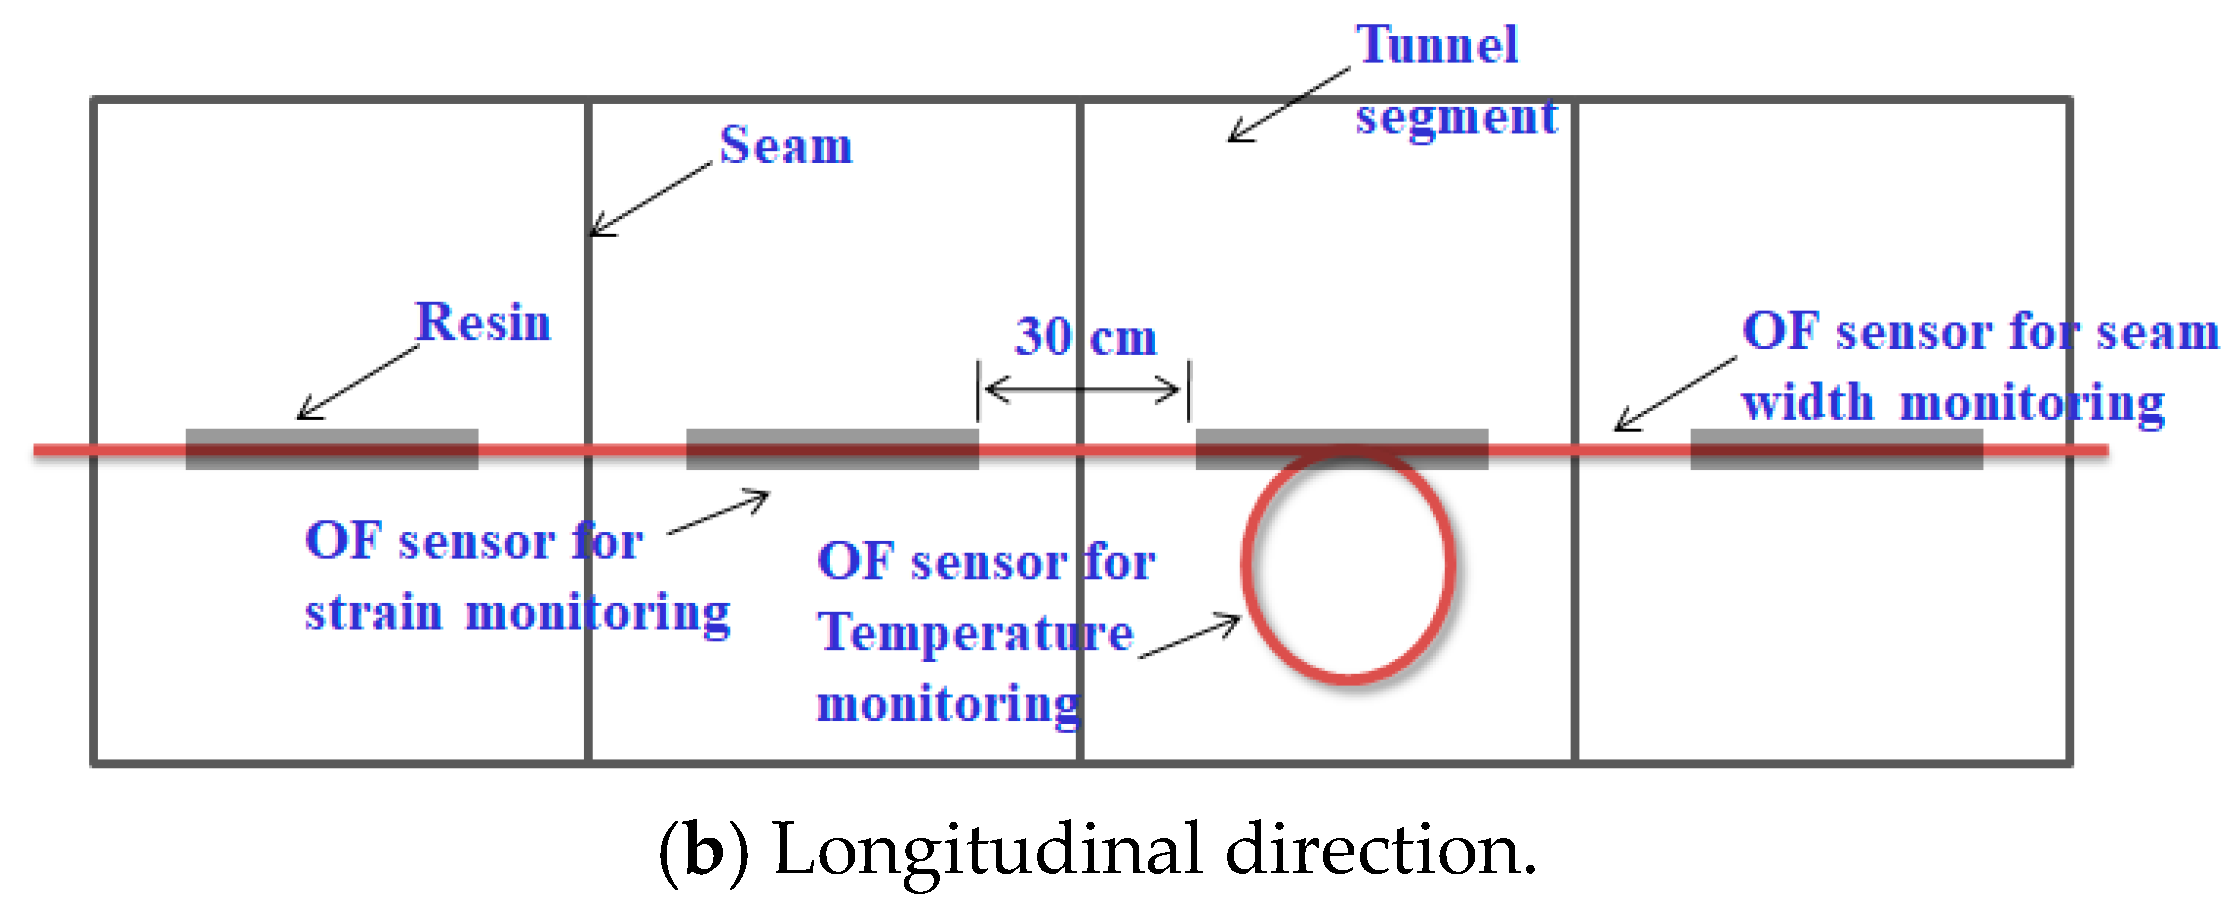
4.2. Sensor Installation
4.3. Monitoring Results of Some Key Parameters
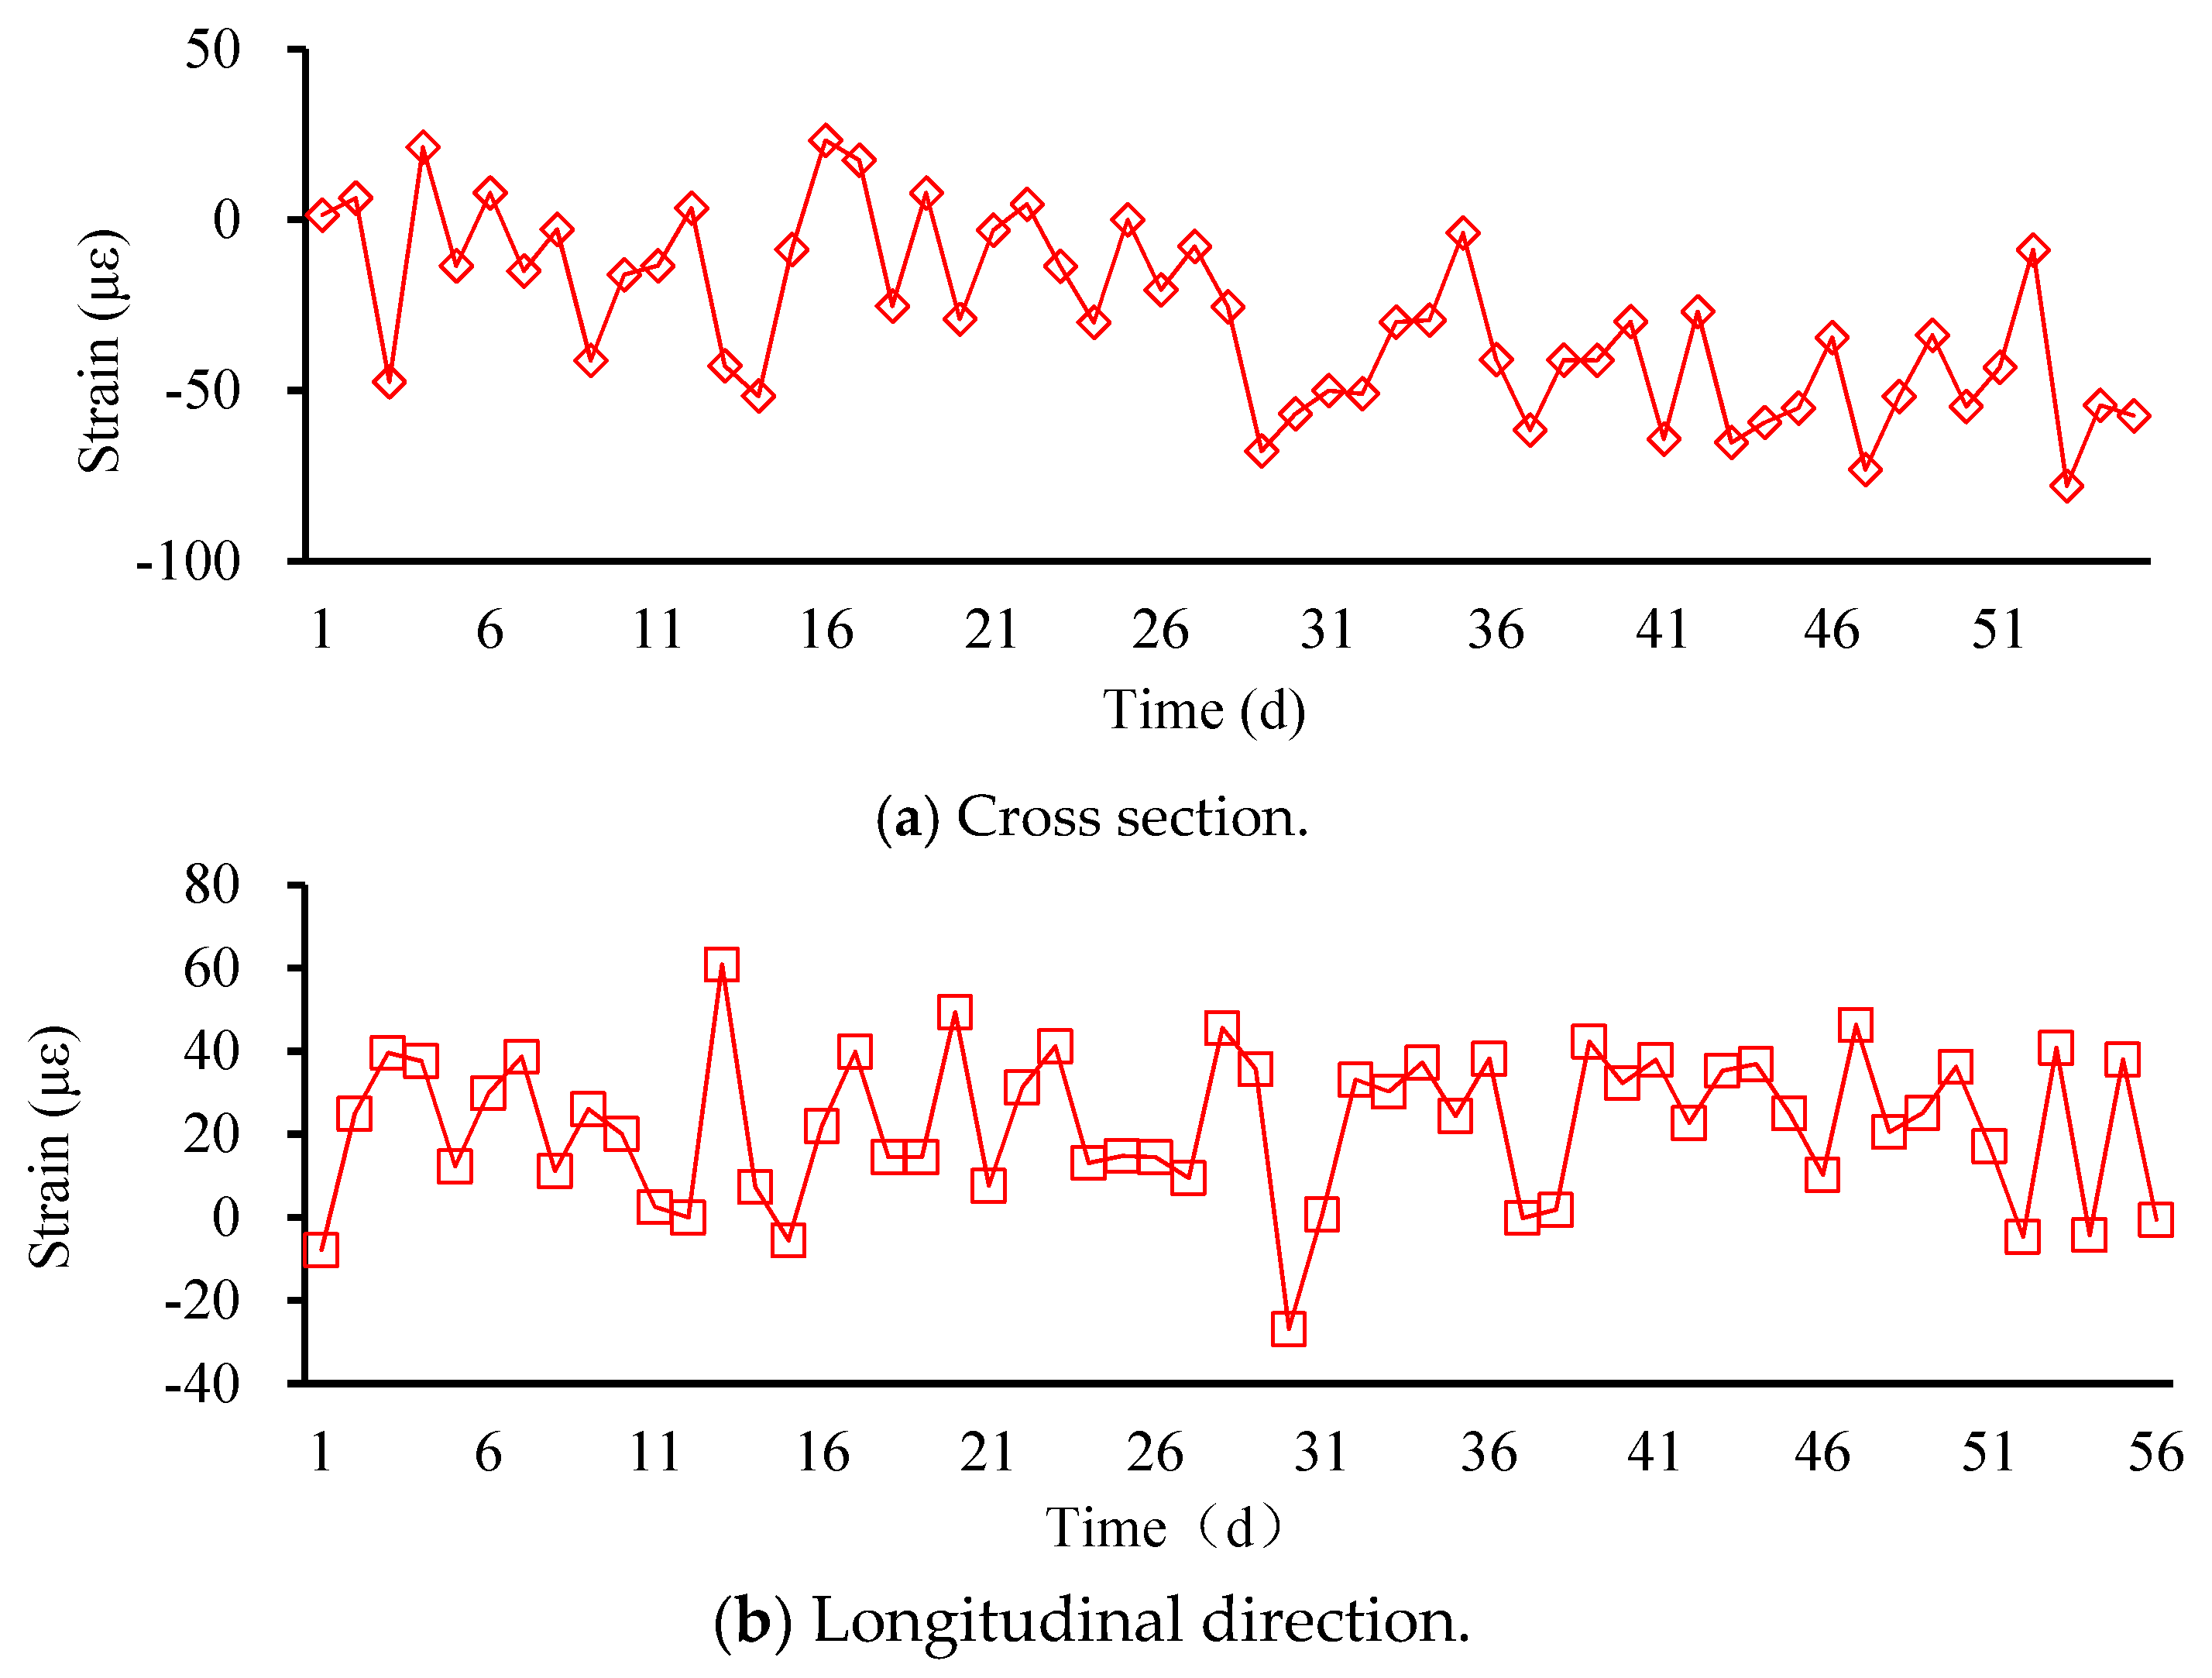
4.3.1. Strain
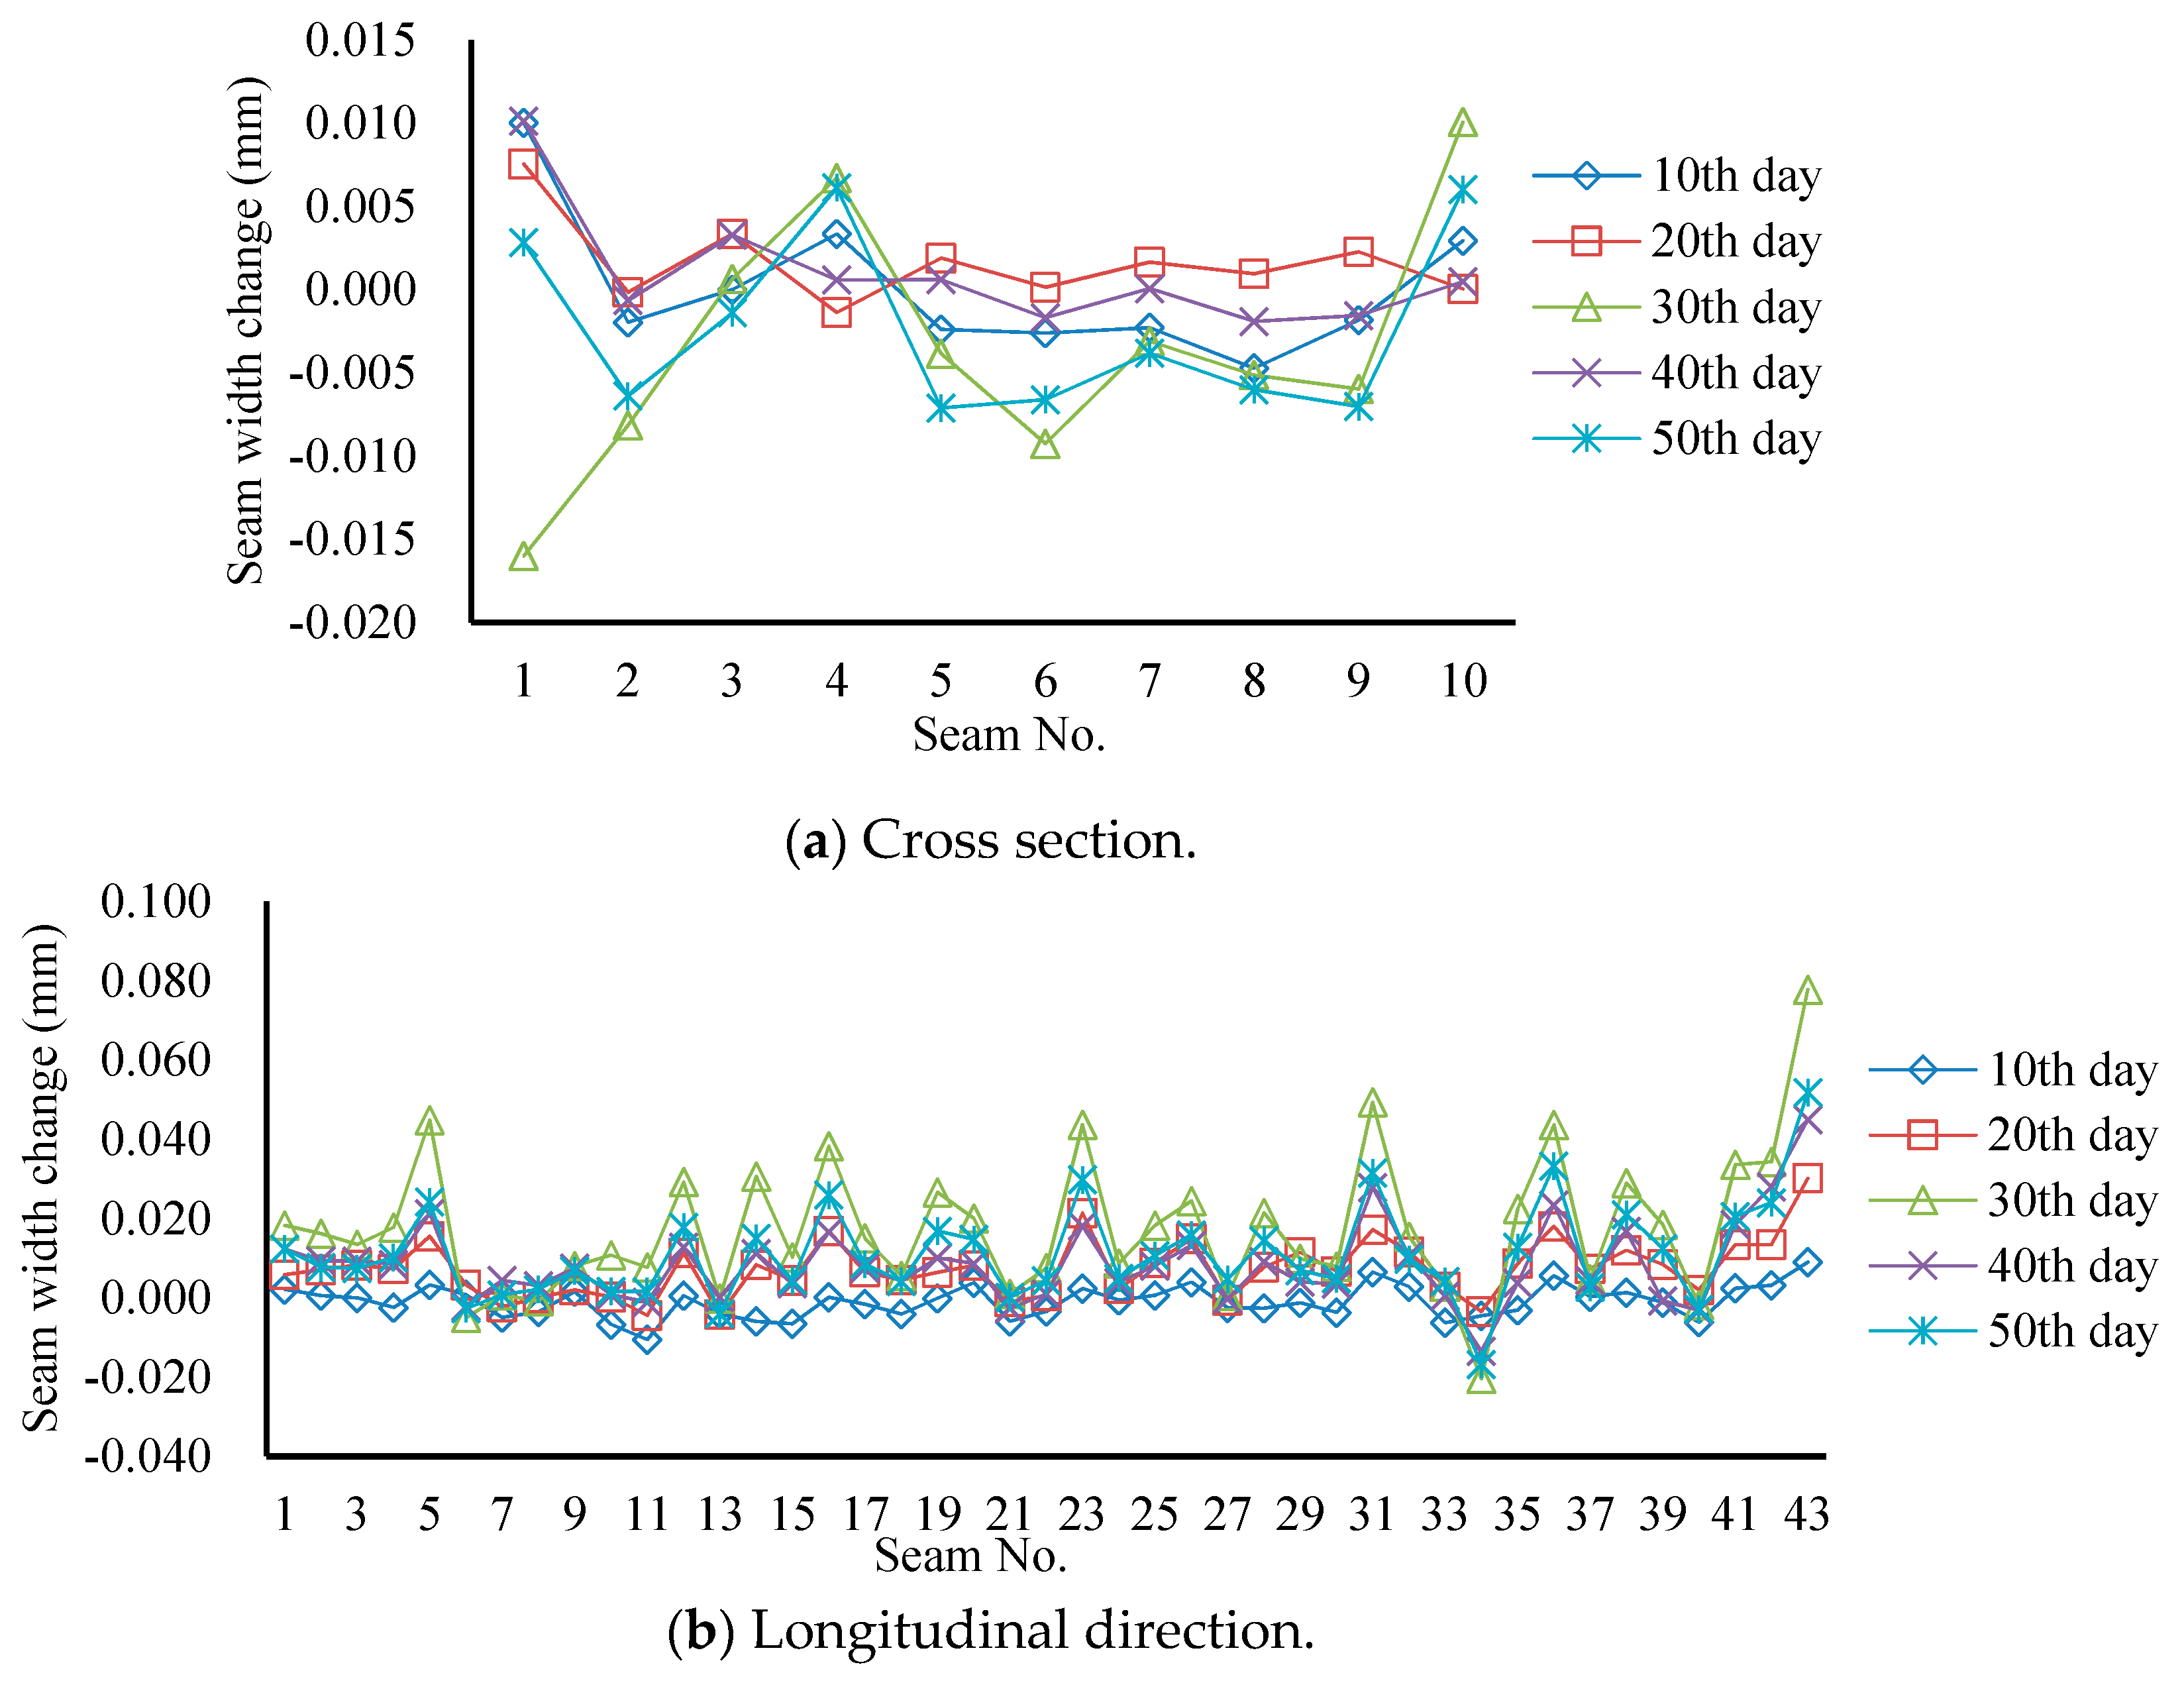
4.3.2. Seam Width
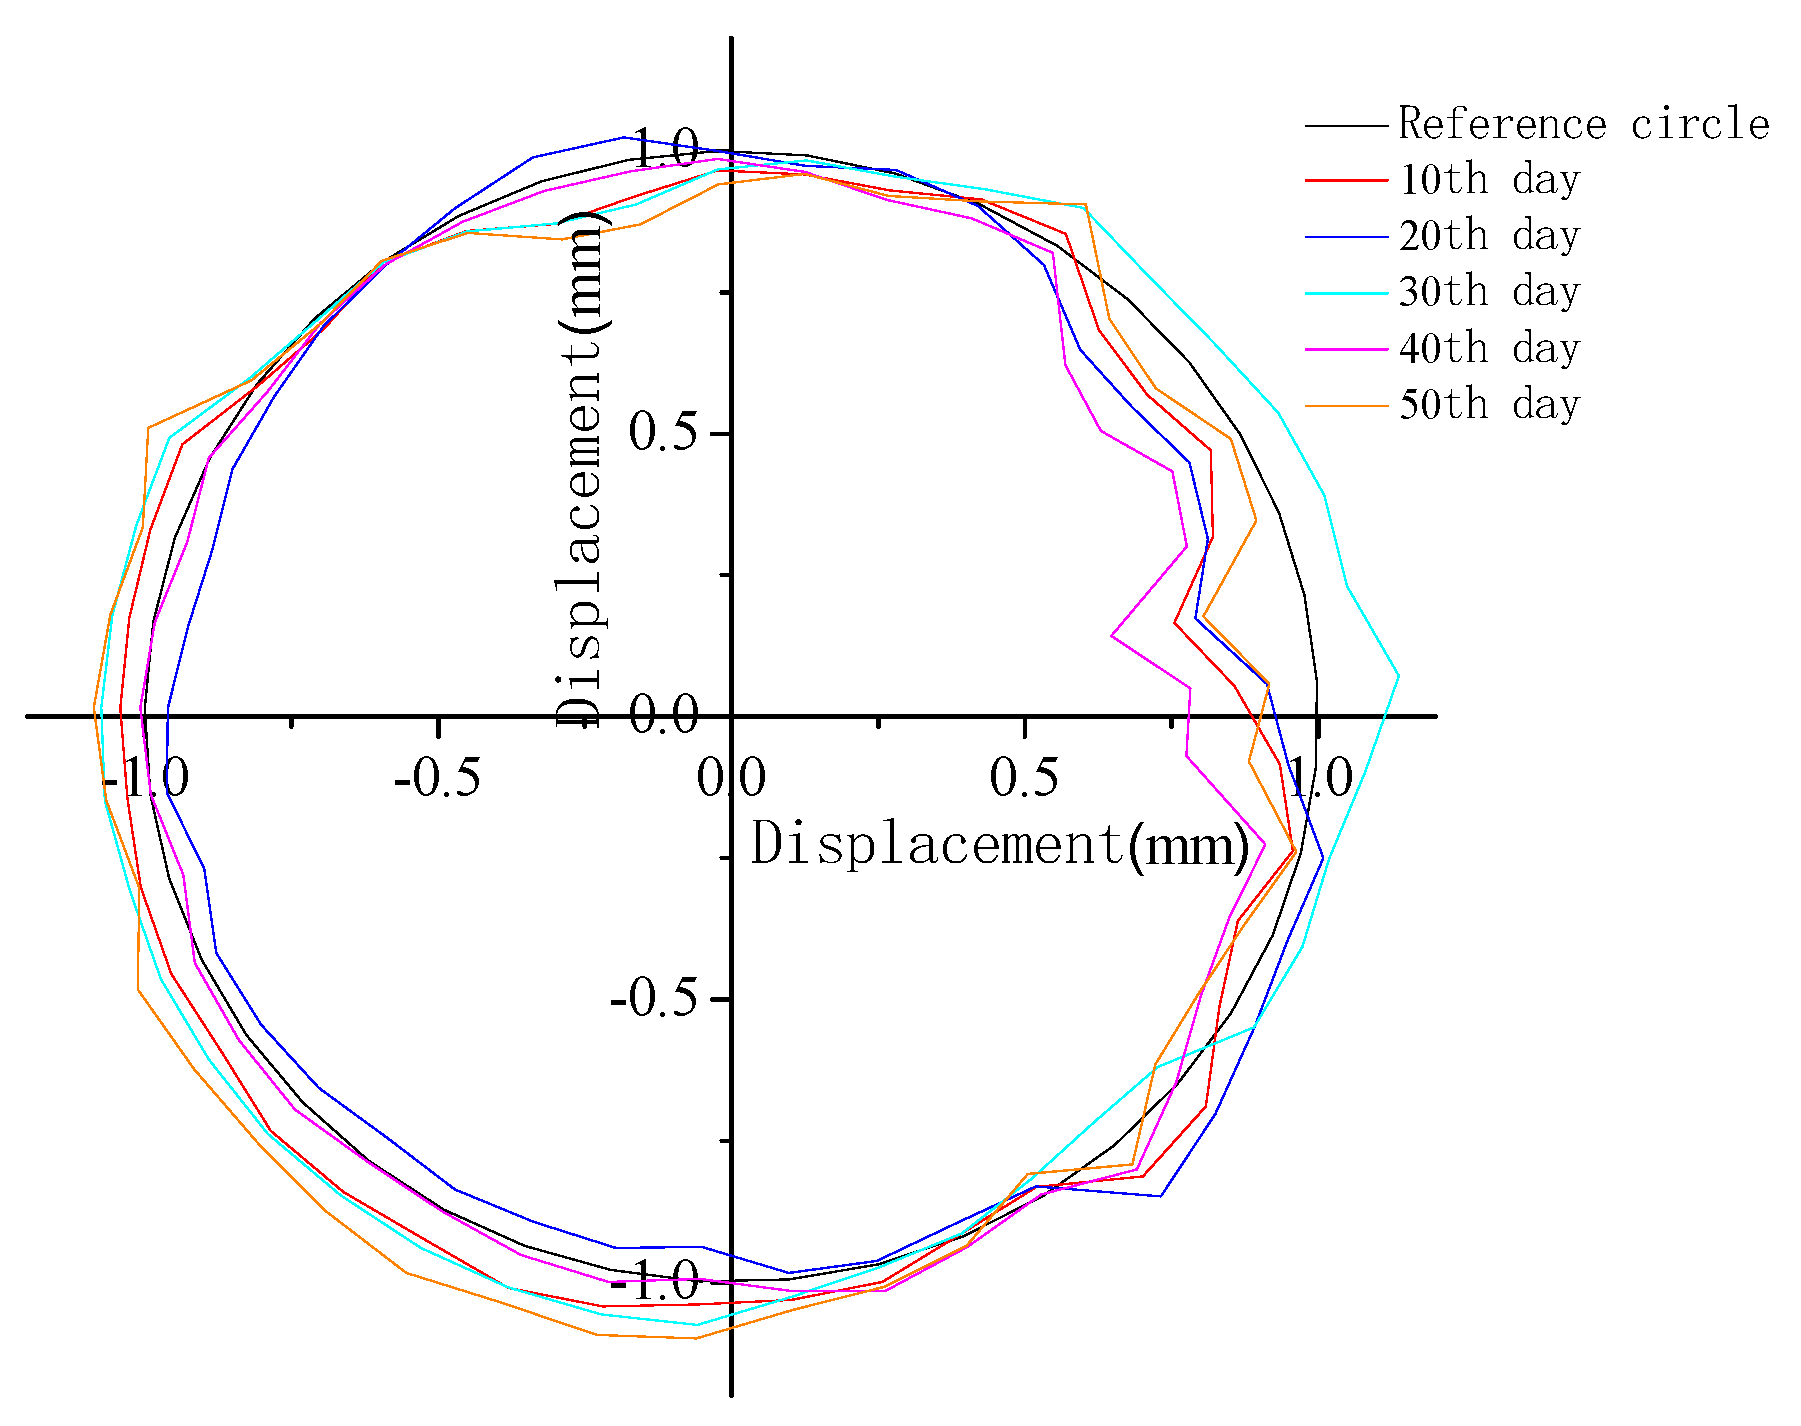
4.3.3. Convergence
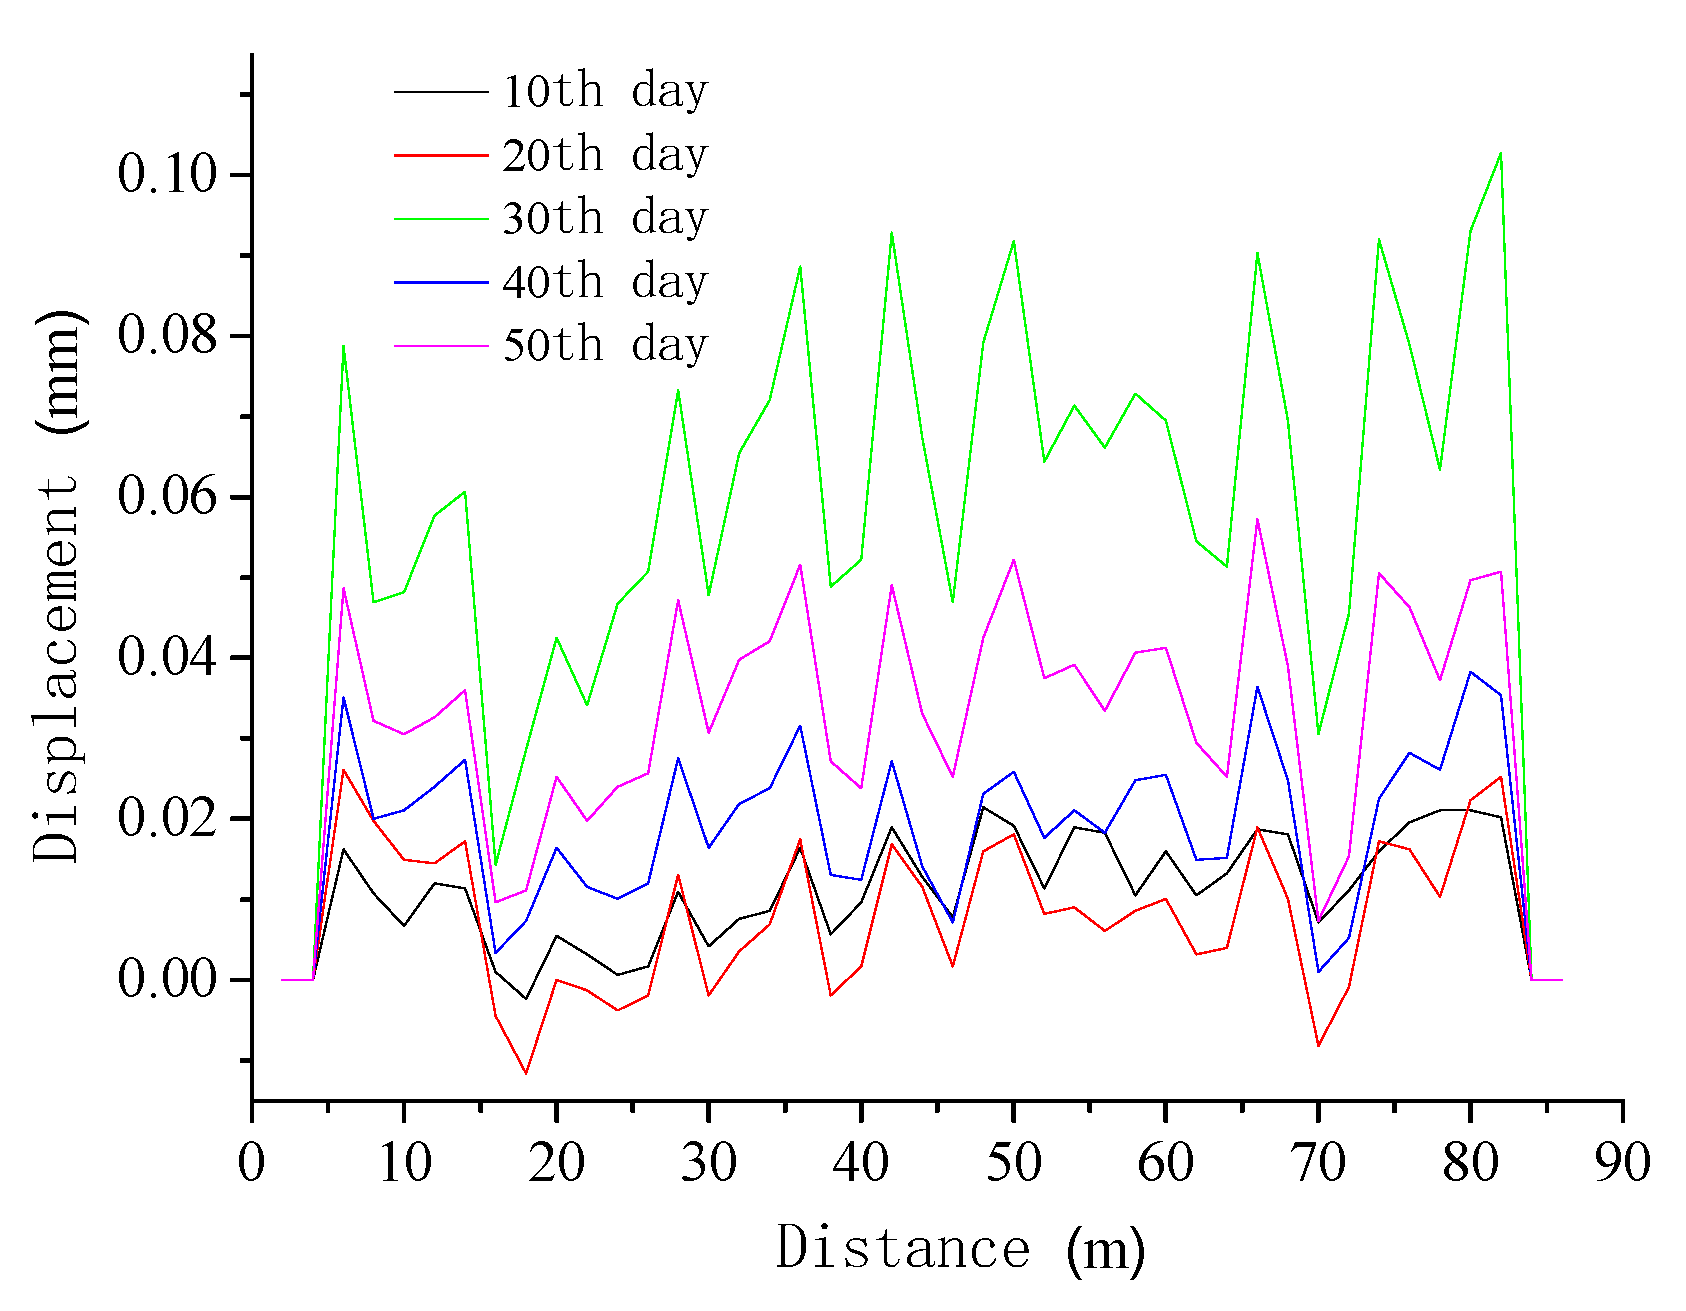
4.3.4. Settlement
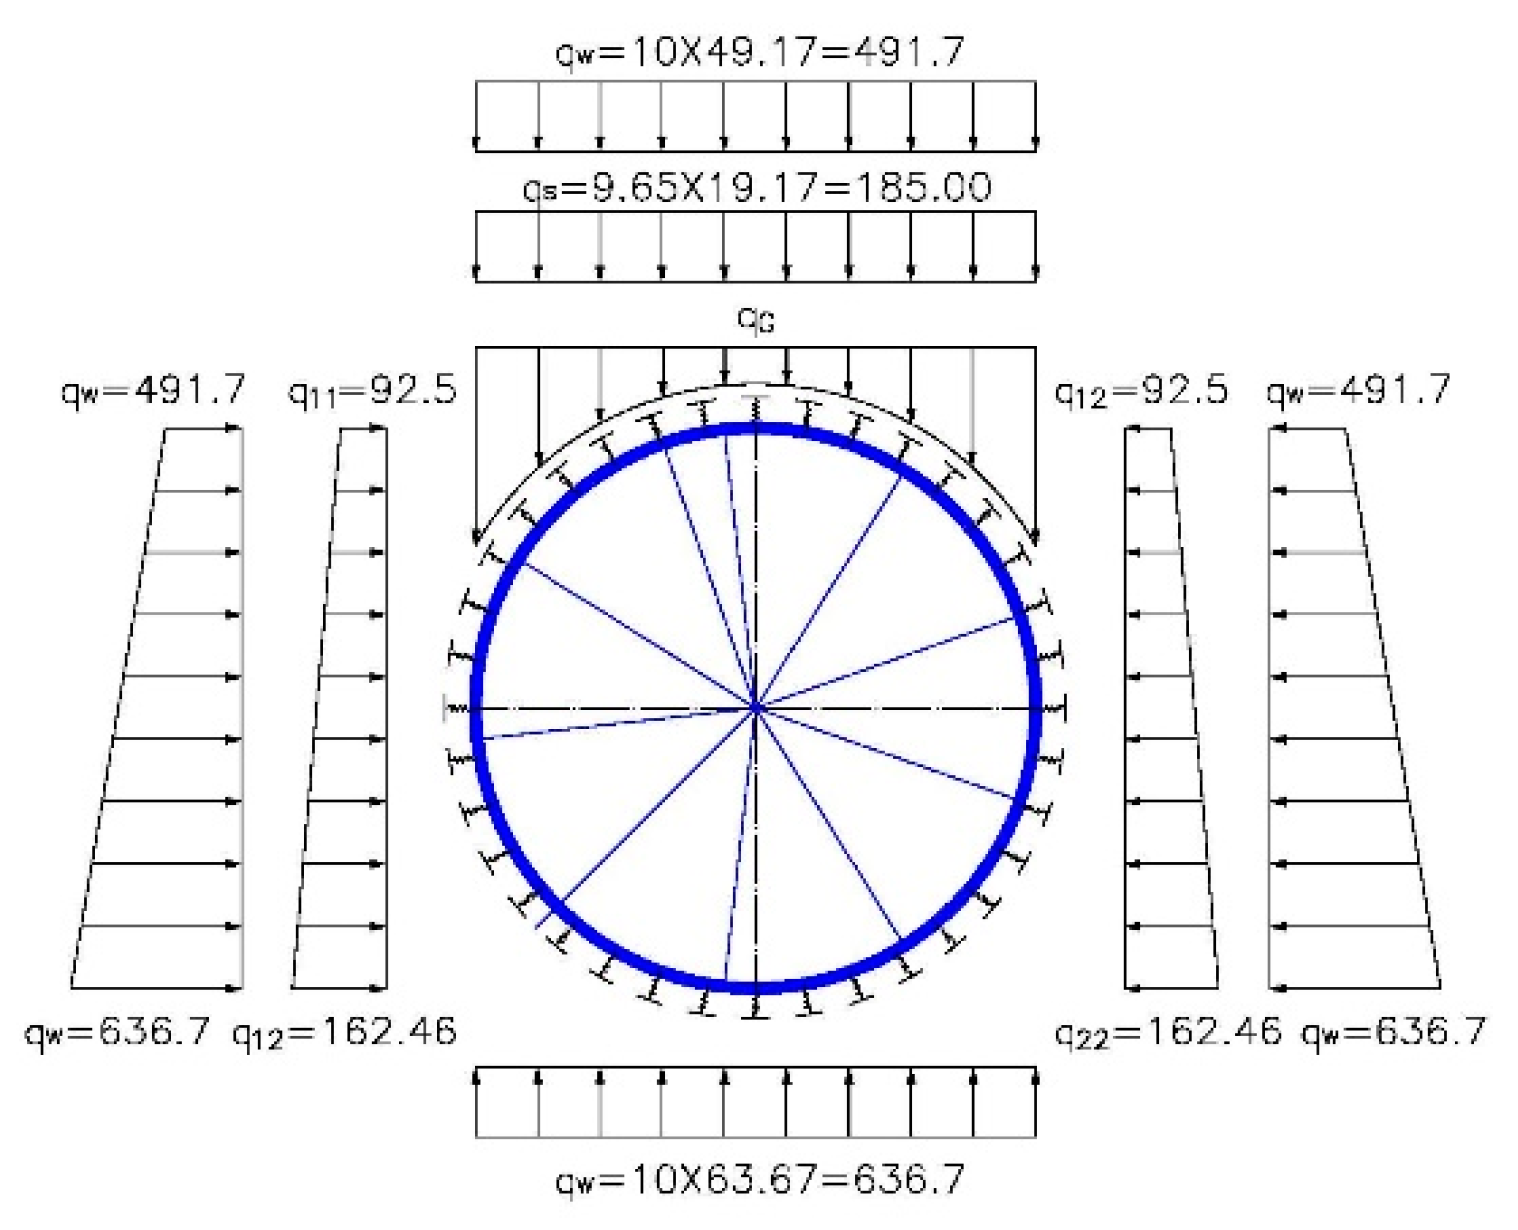
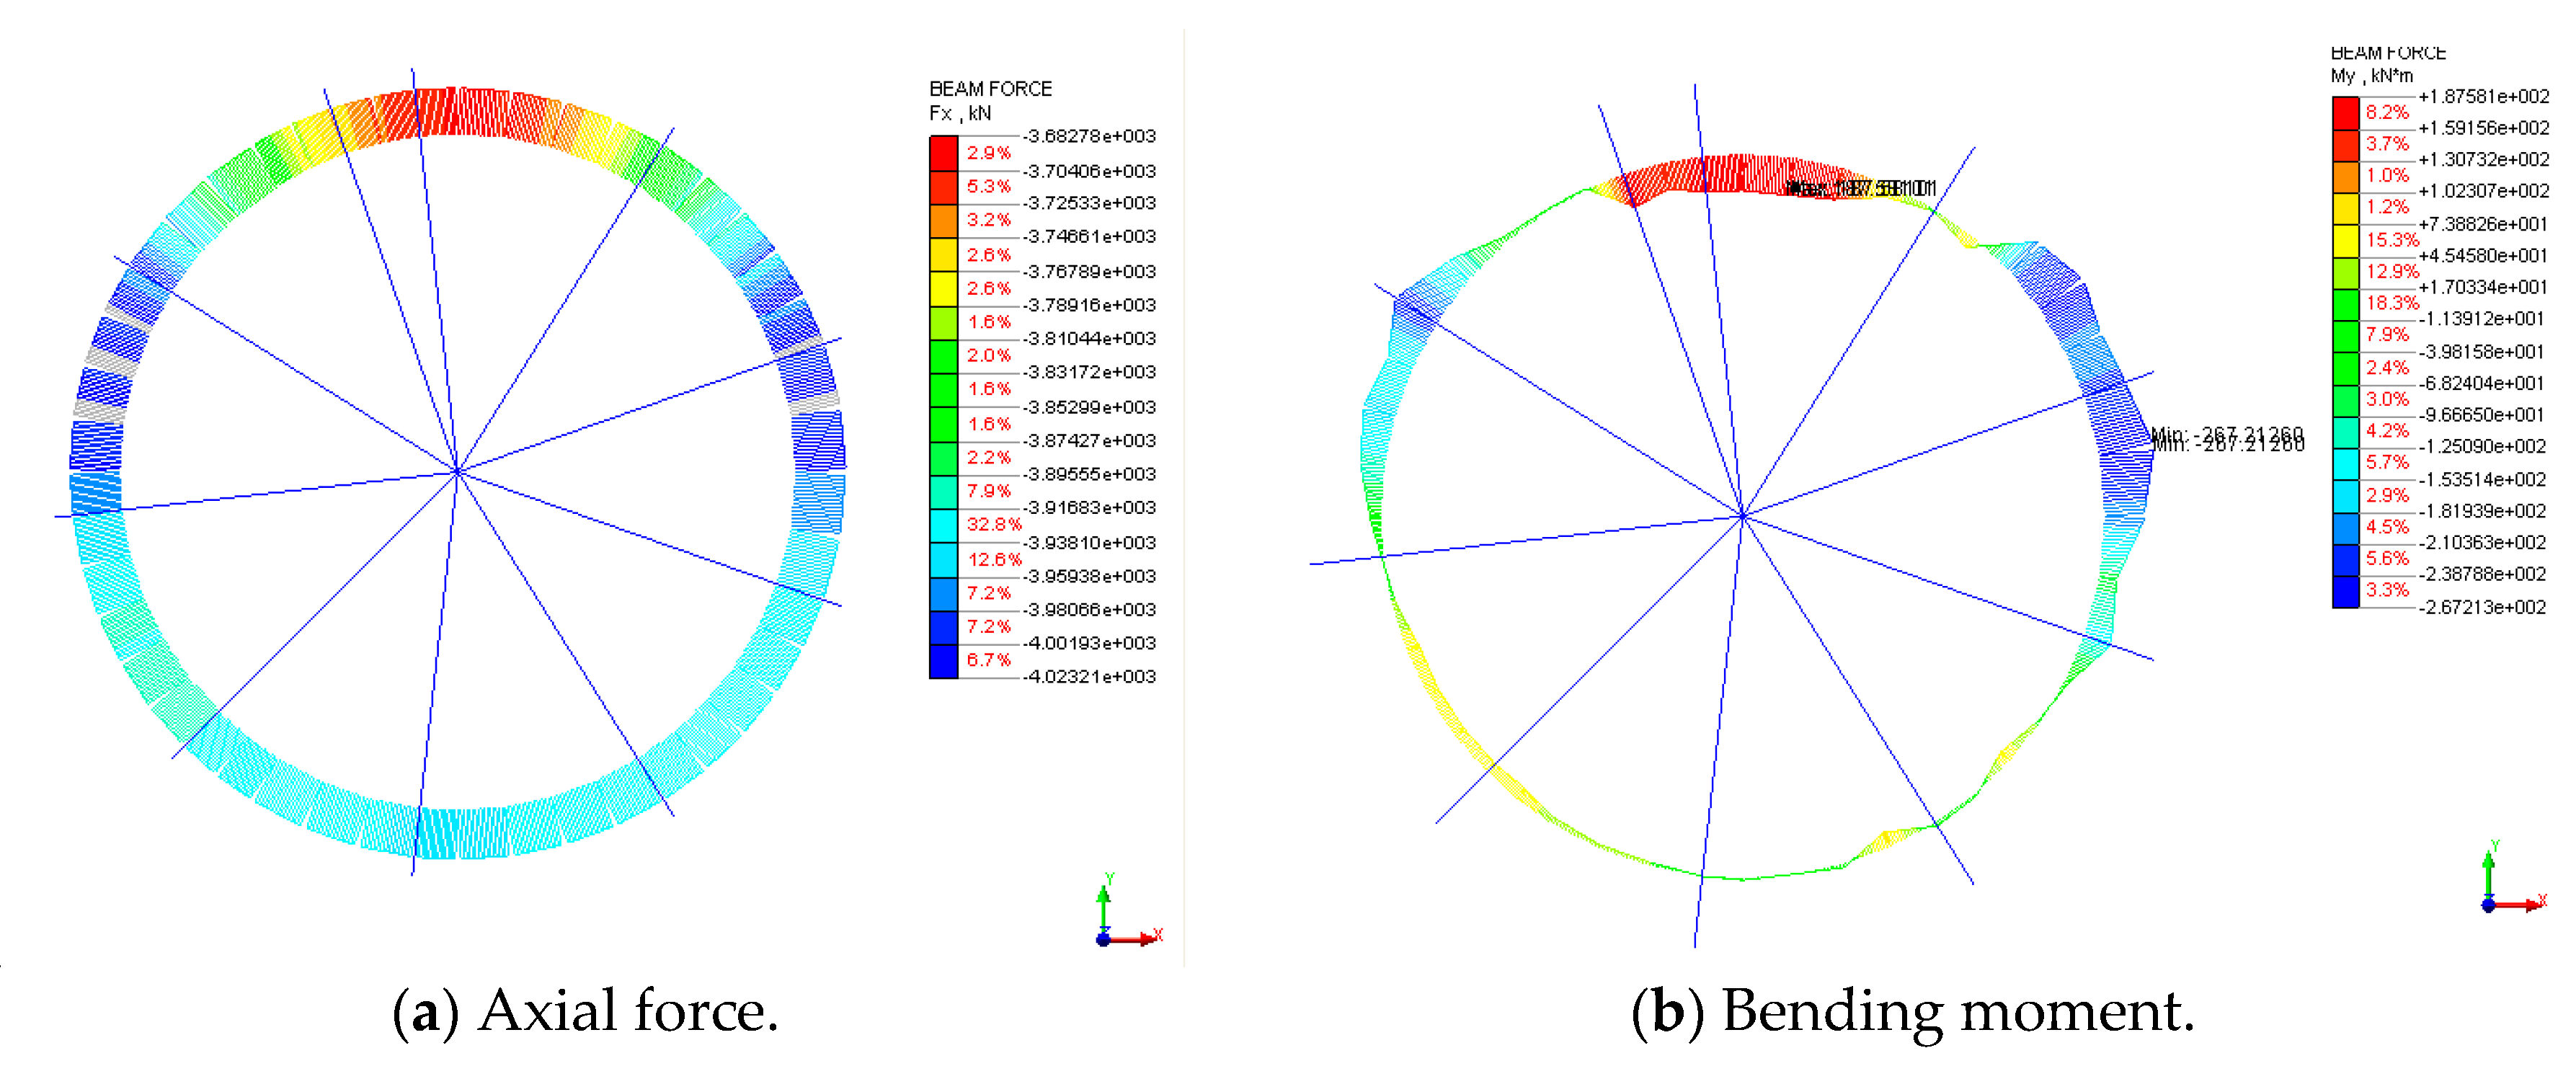
4.4. Structural Performance Assessment
5. Conclusions
Author Contributions
Funding
Conflicts of Interest
References
- Cardini, A.J.; Dewolf, J.T. Long-term structural health monitoring of a multi-girder steel composite bridge using strain data. Struct. Health Monit. 2008, 8, 47–58. [Google Scholar] [CrossRef]
- Ubertini, F.; Comanducci, G.; Cavalagli, N. Vibration-based structural health monitoring of a historic bell-tower using output-only measurements and multivariate statistical analysis. Struct. Health Monit. 2016, 15, 438–457. [Google Scholar] [CrossRef]
- Huynh, T.C.; Lee, S.Y.; Dang, N.L.; Kim, J.T. Vibration-based structural identification of caisson-foundation system via in-situ measurement and simplified model. Struct. Control. Health Monit. 2019, 26, e2315. [Google Scholar] [CrossRef]
- Kim, J.T.; Park, J.H.; Huynh, T.C.; Lee, K.S. Wind and traffic-induced variation of dynamic characteristics of a cable-stayed bridge-benchmark study. Smart Struct. Syst. 2016, 17, 491–522. [Google Scholar]
- Wan, C.; Zhao, L.; Ding, Y.; Xue, S. A two-phase ranging algorithm for sensor localization in structural health monitoring. Adv. Mech. Eng. 2016, 9, 1–8. [Google Scholar] [CrossRef]
- Su, J.; Zhang, D.; Niu, X.; Fang, Q. Research on design of subsea tunnel structural health monitoring. Chin. J. Rock Mech. Eng. 2007, 26, 3785–3792. [Google Scholar]
- Zhou, B.; Xie, X.Y.; Li, Y.S. A structural health assessment method for shield tunnels based on torsional wave speed. Sci. China Technol. Sci. 2014, 57, 1109–1120. [Google Scholar] [CrossRef]
- Liu, S.C.; Zhang, D.; Huang, J.; Zhang, C. Research and design on structural health monitoring system for large-scale shield tunnel. Chin. J. Undergr. Space Eng. 2011, 7, 741–748. [Google Scholar]
- Wang, B.; He, C.; Wu, D.X. Ideas of tunnel structure health monitoring system and its technology. J. Railw. Eng. Soc. 2012, 160, 67–72. [Google Scholar]
- Sakairi, Y.; Uchiyama, H.; Li, Z.X.; Adachi, S. A system for measuring temperature and strain separately by BOTDR and OTDR. In Advanced Sensor Systems and Applications, Proceedings of SPIE-The International Society for Optical Engineering, Shanghai, China, 9 September 2002; SPIE: Bellingham, WA, USA, 2002; Volume 4920, pp. 33–38. [Google Scholar]
- Kishida, K.; Li, C.H. Pulse pre-pump-BOTDA technology for new generation of distributed strain measuring system. Struct. Health Monit. Intell. Infrastruct. 2006, 471–477. [Google Scholar]
- Wei, H.; Zhao, X.; Kong, X.; Zhang, P.; Cui, Y.; Sun, C. The Performance Analysis of Distributed Brillouin Corrosion Sensors for Steel Reinforced Concrete Structures. Sensors 2014, 14, 431–442. [Google Scholar] [CrossRef] [PubMed]
- Wu, Z.; Xu, B.; Hayashi, K.; Machida, A. Distributed fibre optic sensing for a full-scale PC girder strengthened with prestressed PBO sheets. Eng. Struct. 2006, 28, 1049–1059. [Google Scholar] [CrossRef]
- Bastianini, F.; Rizzo, A.; Galati, N.; Deza, U.; Nanni, A. Discontinuous Brillouin strain monitoring of small concrete bridges:comparison between near-to-surface and “smart” FRP fibre installation techniques. In Smart Structures and Materials 2005: Sensors and Smart Structures Technologies for Civil, Mechanical, and Aerospace Systems, Proceedings of SPIE Smart Structures and Materials + Nondestructive Evaluation and Health Monitoring, San Diego, CA, USA, 17 May 2005; SPIE: Bellingham, WA, USA, 2005; Volume 5765, pp. 612–623. [Google Scholar]
- Ding, Y.; Shi, B.; Sui, H. Tunnel structural health monitoring system and fiber optic sensing technology. J. Disaster Prev. Mitig. Eng. 2005, 25, 375–380. [Google Scholar]


| Health Level | 1 | 2 | 3 | 4 |
|---|---|---|---|---|
| Settlement (mm/10 m) | s < 4 | 4 < s ≤ 10 | 10 < s ≤ 50 | s > 50 |
| Seam width (mm) | W < 6 | 6 < W ≤ 10 | 10 < W ≤ 30 | W > 30 |
| Convergence (mm) | D ≤ 50 | 50 < D ≤ 80 | 80 < D ≤ 200 | D > 200 |
© 2019 by the authors. Licensee MDPI, Basel, Switzerland. This article is an open access article distributed under the terms and conditions of the Creative Commons Attribution (CC BY) license (http://creativecommons.org/licenses/by/4.0/).
Share and Cite
Wang, T.; Shi, B.; Zhu, Y. Structural Monitoring and Performance Assessment of Shield Tunnels during the Operation Period, Based on Distributed Optical-Fiber Sensors. Symmetry 2019, 11, 940. https://doi.org/10.3390/sym11070940
Wang T, Shi B, Zhu Y. Structural Monitoring and Performance Assessment of Shield Tunnels during the Operation Period, Based on Distributed Optical-Fiber Sensors. Symmetry. 2019; 11(7):940. https://doi.org/10.3390/sym11070940
Chicago/Turabian StyleWang, Tao, Bin Shi, and Yihuan Zhu. 2019. "Structural Monitoring and Performance Assessment of Shield Tunnels during the Operation Period, Based on Distributed Optical-Fiber Sensors" Symmetry 11, no. 7: 940. https://doi.org/10.3390/sym11070940