Updated Constraints on the Variations of the Fine-Structure Constant from an Analysis of White-Dwarf Spectra


1
Division of Computational Physics, Institute for Computational Science, Ton Duc Thang University, Ho Chi Minh City 700000, Vietnam
2
Faculty of Applied Sciences, Ton Duc Thang University, Ho Chi Minh City 700000, Vietnam
Symmetry 2019, 11(7), 936; https://doi.org/10.3390/sym11070936
Submission received: 25 June 2019
/
Revised: 9 July 2019
/
Accepted: 16 July 2019
/
Published: 18 July 2019
Abstract
:I fused observed spectra from the white-dwarf star G191-B2B to constrain the spatial and temporal variation of the fine-structure constant, . The analysis was combined with laboratory-measured and astronomically observed lines in [Ni V] to find . The obtained result allows a symmetry of the related comparison with previous studies looking for cosmological variations of using spectra from Quasi Stellar Objects (QSOs). In this way, we can expect higher sensitivity from white-dwarf spectra than QSO spectra. Therefore, this study should have orders-of-magnitude higher sensitivity per system than previous quasar studies, and we should reduce statistical and systematic errors. The results of this study place a more stringent limit on than previous studies using the same data.
1. Introduction
One of the most interesting problems in modern physics, first questioned by Dirac and Milne [1,2], is the possibility of space-time variation in the fundamental constants. One example of such variation, which was determined based on the latest measurements of the absorption spectra of Quasi Stellar Objects (QSOs), proposes that the fine-structure constant may have had different values throughout the evolution of the Universe [3]. In recent years, the most frequent methods of analysis of these spectra have been the wavelength separations of alkaline-like ion doublets (the AD method) and the many-multiplet (MM) technique [4]. The best result using the AD method is , which was obtained from an analysis of robust nebular emission lines of [O III] (5007 Å and 4959 Å) in the Sloan Digital Sky Survey (SDSS) QSO system with redshifts 0.16 < z < 0.80 [4]. Murphy et al. applied the MM approach to analyze 21 [Si IV] doublets and obtained at zabs = 2.8 [5]. Additionally, Dzuba et al. and Webb et al. used the MM approach and obtained for z > 1 and for z < 1 [5,6,7]. Furthermore, Webb et al. used the MM technique on 128 systems with a redshift of 0.2 < z < 3.7, and obtained [8]. Using large sets of quasar echelle spectra with a high resolving power, Quast et al. found [9,10] and Chand et al. reported [11]. However, the drawback of the MM method is the estimation errors in , as the errors in the calibration wavelengths are typically not taken into account. The best estimates of , giving cosmological variations at the level of 10−6, comes from the work of Levshakov et al., who analyzed [Fe II] absorption lines at zabs = 1.15 and obtained [12,13,14], and from the work of Porsev et al., who found and at z = 1.84 by analyzing absorption lines of [Fe II] [15]. The differences between these results may stem from the fact that some poorly understood systematic effects and/or correlations between spectral doublets were not properly included in the final analysis. In particular, difficulties with the wavelength calibration of the complex [Fe II] absorption spectra and the different sensitivity of various transitions included in the analysis, coming from different atoms and molecules, affect the resulting error [16,17,18,19,20,21,22,23]. Another problem may arise from possible variety in the asymmetric isotopic abundance of the sources of the emitted radiation, which is hard to quantify.
In recent years, this topic has been of great interest, since the possibilities of spatial or temporal variation of α and have been studied using multidimensional models. Aguilar et al. and Berro et al. suggested that spatial or temporal variation in the fine-structure constant may have occurred at different places and times in the Universe. By using multidimensional models, Aguilar et al. and Berro et al. inferred a relationship between α/ and . From the analysis of the spectra of white-dwarf stars, they also found that the value of changed over cosmological time from the galactic cluster NGC6791 as and from the pulsating white-dwarf stars G117-B15A and R548 [24,25,26,27]. Moreover, Damour et al. obtained using timing data from the binary pulsar PSR1913+16 in the frameworks of Brans–Dicke theory. By re-analyzing the same data, Damour and Taylor obtained . Additionally, by combining this data and data from PSR B1855+09, Kaspi et al. found and [28,29,30]. By using different theories with varying and using six telescopes, Guenther et al. compared the p-mode spectra to find . Additionally, Thorsett [31,32] obtained a result of by estimating at 2σ. The most stringent limit of this value was obtained using multidimensional models, namely . Additionally, analysis of the Lunar Laser Ranging experiments found , white-dwarf asteroseismology was used to find , and Big Bang nucleosynthesis was used to find [33,34,35,36,37].
A new method has been proposed for the analysis of the optical spectra of quasars and white-dwarf stars, and has been applied to search for spatial and temporal variability of the fine-structure constant. Using this technique, recent studies [38,39] determined a change over cosmological time of from a comparison of laboratory spectra of [Fe V] with the spectra of the white-dwarf star G191-B2B with a gravitational redshift . This new approach allows the estimation of values of in the early stages of the Universe’s evolution from the spectra of white-dwarf stars, and has the advantage of being much more transparent and less subject to systematics than previous methods.
In this paper, I propose the use of observed absorption line spectra of [Ni V] from the white-dwarf star G191-B2B [39] to test the variations of the fine-structure constant with strong gravitational fields. With a better determination of laboratory-measured wavelengths and the inclusion of their errors in the error budget, this method has been shown to be a step toward obtaining a stronger limit on compared to previous methods [40].
2. Data Analysis
Hot white-dwarf stars represent a powerful tool to test the relationship between the fine-structure constant and strong gravitational fields. Such stars contain almost quadruply ionized iron [Fe V] and quadruply ionized nickel [Ni V], and the variation of the fine-structure constant will manifest as shifts in the observed wavelengths of the absorption lines. In previous studies, we predicted that the existence of scalar fields may influence the value of the fine-structure constant. The best way to detect such an influence is to make a measurement in a stronger gravitational field, where the scalar field should be more concentrated and the fine-structure constant may take a different value such as ), where , M is the mass of the white dwarf/Earth, r is the radius of the white dwarf/Earth, is the laboratory-derived value of the fine-structure constant, and is a sensitivity parameter. Therefore, hot white-dwarf stars may be ideal probes to investigate the relationship between and strong gravitational fields (e.g., [38,39]):
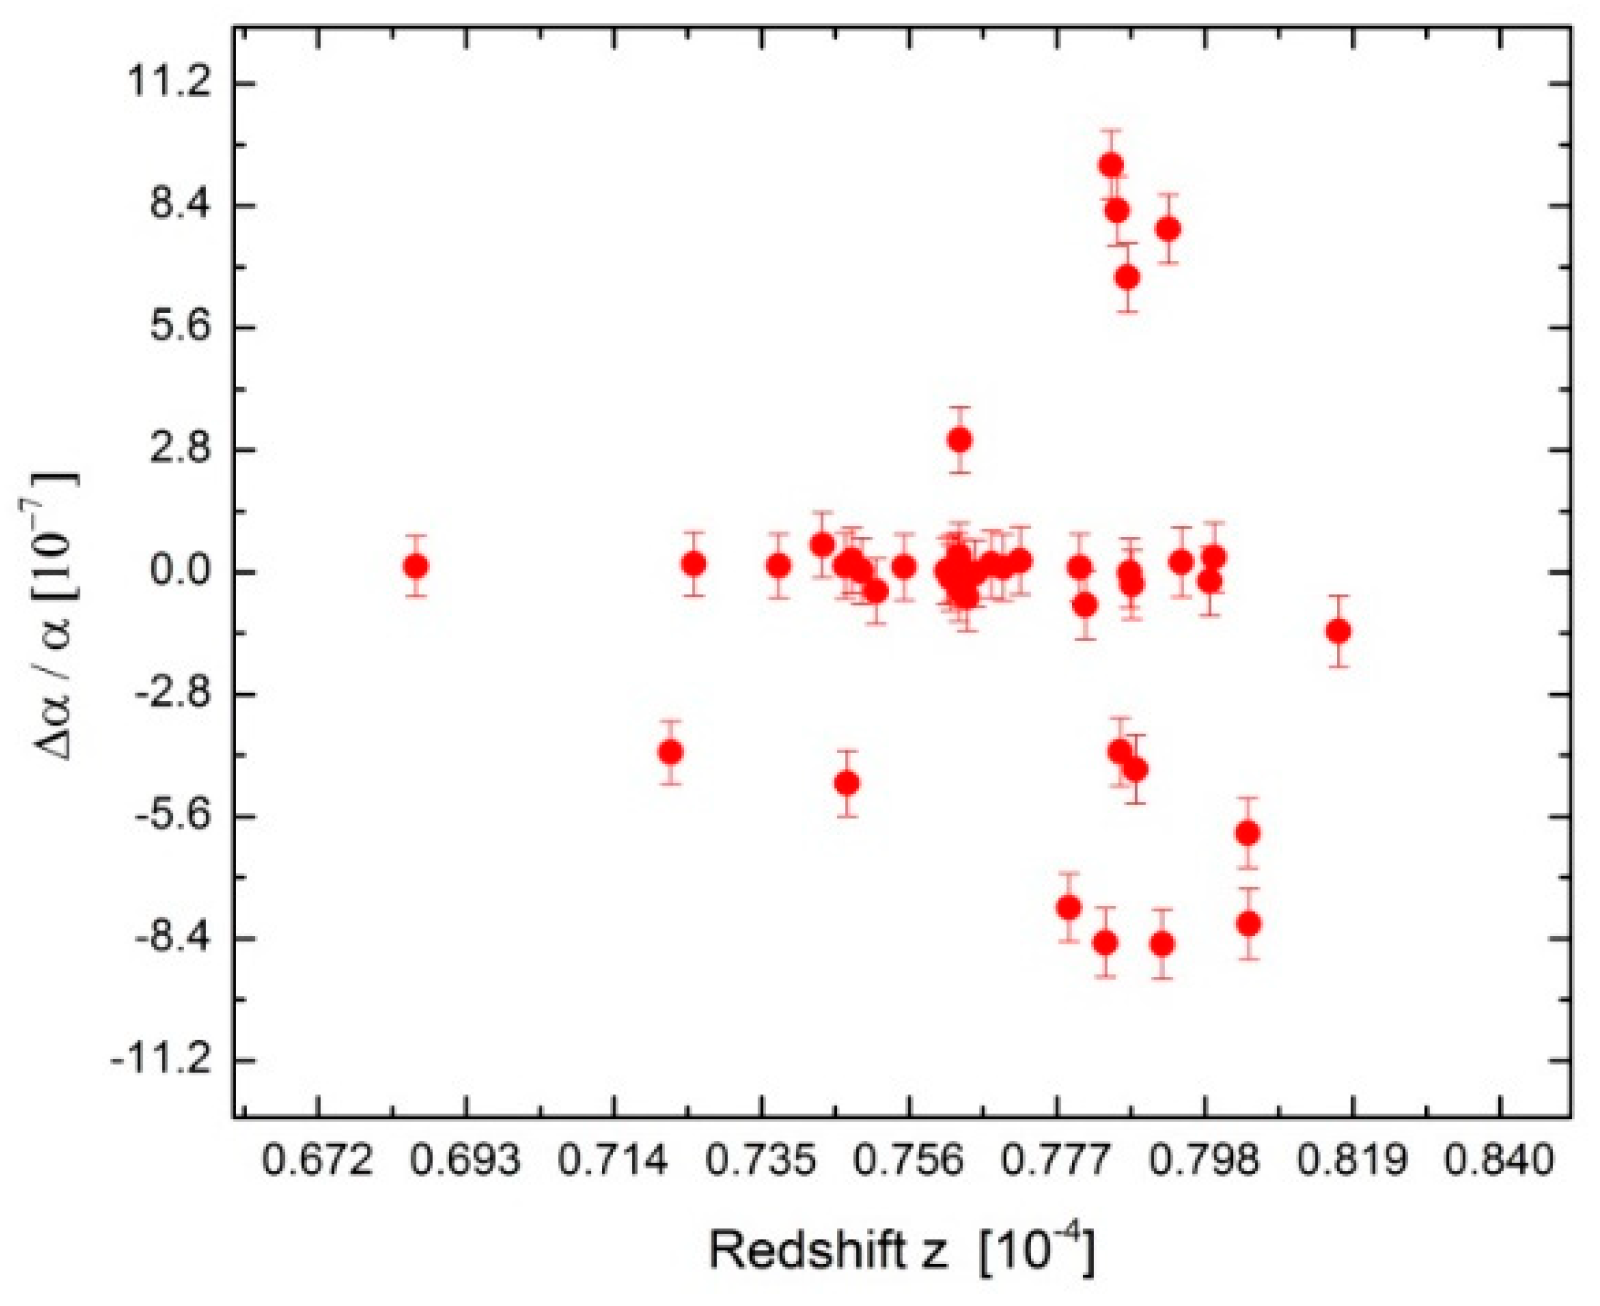
Accordingly, by evaluating the difference between measured wavelengths and from hot white-dwarf stars with the gravitational redshift z with the corresponding laboratory, it is possible to directly infer the possible variation of in different epochs, different area-time points, and different regions of the Universe, as well as the present value. The spectra used in this work are the same that were utilized in part of the work of Berengut et al., and the details of the experimental methods used in the present study can be found in their references [38,39,40]. However, the results obtained from the analysis of quadruply ionized nickel [Ni V] and quadruply ionized iron [Fe V] are inconsistent, and are based on a systematic effect in the laboratory wavelengths used. Therefore, we have improved the work of Berengut et al. by using new wavelengths [40,41,42,43]. These new wavelengths make it possible to investigate the suspected systematic gain calibration error that was suggested by Berengut et al. [40]. Moreover, we can identify the dependence of this effect on the transition wavelength, which can be used to directly infer a wavelength shift due to and the relationship between and gravitational potential. The examined spectra are of excellent quality, and the errors in the laboratory-measured values of [Ni V] were able to be determined with an uncertainty of about several and to be used to estimate systematic errors of . This approach was primarily based on the evaluation of [Ni V] and the level of ionization. Many multiplet lines originating within multiplet upper energy levels were analyzed, thus making the analysis independent of the physical conditions of the gas. Detailed discussions of possible sources of systematic and statical errors in this method are given in [11,12,13,14,15,16,17,18,19,20,21,22,23,24,25,26,27,28,29,30,31,32,33,34,35,36,37,38,39,40,41,42,43,44,45,46]. To create the simulated spectra and the real data, a nonlinear least-squares fitting program was used, which involved reducing the variation of as a function of for every absorber fitting. The fitting procedure depends on a set of free parameters describing the properties of the absorbing system, and a set of fixed values describing the atomic and molecular properties of the absorbing system. Additionally, the column density N, the absorption redshift , and the Doppler line width b were included in the fit. For all lines, I varied from to with a step of . Only () minimum () was accepted as the measured value of from the system. The minima of obtained from each of the fits were then plotted as a function of , as shown in Figure 1. The averaging of values results in , wherein the error is the standard deviation of the mean.
Figure 1 illustrates vs. gravitational redshift. This figure shows an example of our result from the analysis of 32 quadruply ionized nickel [Ni V] to constrain seen in the spectra of the hot white-dwarf star G191-B2B [40]. Error bars are 1σ. Figure 1 also shows that the statistical uncertainties grow as the absorption features increase. My result is consistent with various components in the analyses of Berengut et al. [40], which used spectral data of similar quality. A good fit was obtained for each value, which was achieved by using an individual transition line using minimization. On average, a slightly more negative was found for the low-z data.
3. Results and Discussions
In the previous study of Berengut et al., the authors used a spectroscopic [Ni V] ion in the local environment of the photosphere of the hot white-dwarf G191-B2B to search for the dependence of in a strong gravitational field [40]. However, their results indicate that the maximum variation of is only 10−5. Berengut et al. demonstrated that this limitation is caused by the systematic effect in the laboratory-measured wavelengths used rather than by a gravitational dependence of . Therefore, I have improved the study of Berengut et al. by refining their analytical methodology by incorporating robust techniques from previous asymmetric studies using the wavelength shifts of 32 quadruply ionized iron [Ni V] in the work of Berengut et al. [40]. The precision in the relative change in achieved in my analyses is three orders of magnitude greater than that achieved by Berengut et al. The results are given as , and the statistical and systematic errors are estimated with high accuracy compared with those of previous studies [10,11,12,13,14,17,18,19,21,22,23,24,25,26,27,28,29,30,31,32,33,34,35,36,37,38,39,40,41,42,43]. Recently, significant effort has been invested into improving the laboratory-measured wavelengths of transitions in [Ni V] multiplet lines, which can be utilized in my analyses. This will offer the most robust and constraining test of whether the fine-structure constant varies in gravitational fields, and will also allow further investigation of a large number of systems to reduce the final uncertainties [21,25,29,30,31,32,33,34,35,36,37,38,39,40,41,42,43]. This will improve the selection process of the satisfactory spectra of white-dwarf stars. Additionally, the high relative precision of this work reduces the potential for systematic effects, improves the dedication of , and reduces the number of spectra of white-dwarf stars in a sensitive way.
The works of Quast et al. [10], Chand et al. [11], Levshakov et al. [12,13,14], Murphy et al. [21,44], and Berengut et al. [40], all of which examined the optical spectra of quasars, are, at least in part, conflicting. The maximum values of Δα/α estimated in the literature are approximately 10−6. However, these estimations of are not explicitly utilized as fitting parameters. The most effective studies used the versus curve to obtain the best-fitting estimate of . The reasons for these disparities are not yet completely understood. However, similar to difficulties in wavelength calibration, problems with the technique used are probably the main reason for these disparities. In order to improve these disadvantages, my analysis was based completely on the main effect on the error budget range consisting of -independent line ratios, which allow us to perceive the real size of statistical and systematic errors and to determine the actual wavelength splitting of the line pairs. This method is most suitable for lines with small separations.
The key challenge in the method used in the present study relates to the fact that the potential cause of systematic errors may be the wavelength calibration based on laboratory estimations or observations. However, the errors could manifest merely as a general change in the measurements of the Doppler shift, which will not affect my results. Additionally, the gain calibration errors are based on the linear mapping related to the real wavelength separations as well as the measured wavelength separations, which permits us to identify the dependence of on gravitational fields. Moreover, other possible sources of error are observations and laboratory measurements [22,39,40,47]. In previous studies, the observations made did not include the identification of high-precision calibration to test for the variation of . Therefore, the present study used new observational data from HST/STIS echelle spectroscopy, which provided the best spectra and the wavelength accuracy of about 1 km s−1 that was required for the analysis. Utilizing these spectra allows us to increase the precision in the measurement of with uncertainties on the order of 10−6 for the observed wavelengths and 10−7 for laboratory-measured wavelengths.
In a previous study, we determined that the main source of error was the width separation ratio between observed and laboratory-measured . The determination of suitable centroid wavelengths depended on this profile so that the fitted line supports wavelength uncertainties of . and Therefore, the observed lines from white-dwarf stars, such as [Ni V], are important, since the change in potential is five orders of magnitude larger than what would be found in laboratory experiments. I identified and examined the spectral data of each object before fitting. I determined which [Ni V] transitions are useful and which [Ni V] lines contribute to the estimate of for our analysis [22,39,40,47]. Thus, we can determine the best way to estimate and minimize distortions. This is a major cause of the decreasing spectral sensitivity at the edges of echelle orders. As a result, we can determine the influence of hidden blends on the measurements of line position, which in turn allows us to determine factors such as the identical velocity structure of these transitions with high accuracy. I have applied the previous method which involves -independent line ratios. This method has the advantage that it can be used to more exactly estimate the statistical and systematic errors. Before modeling the absorption lines, I checked the spectral data of each object, which allowed one to determine the useful transitions of [Ni V] for the analysis. A physically realistic and statistically acceptable model of the observed absorption features was produced in the model. Almost all absorption features reflect sources that are expected for a single fitted profile, thus necessitating the use of multiple fitted profiles, such as velocity components, to achieve a statistically acceptable fit. Unfortunately, we have no way of knowing a priori how many components are required to obtain a statistically acceptable fit. The process of modeling the observed structure involves adding components until a physically realistic and statistically acceptable fit is achieved. I used our previous method of profile-fitting to estimate from observed absorption spectra [39,40,41,42]. Therefore, we apply for each object and then construct an initial fitting profile model to all relevant transitions of [Ni V] lines. We apply to a single velocity component and then apply our fitting model in the same way as for the relevant sections of our previous publications. By making use of the previous analysis method, the nonlinear least-squares optimization of the present profile can be applied to the selected spectral data. It explicitly includes as a free parameter. Our program includes the fitting parameters column density N, absorption redshift, the Doppler and line width b, and was computed to find the changes in with an assignment error of . The maximum change in was determined by , which was used to estimate the error in . The minimum obtained result using for each line was plotted as a general function of the changes in . For all the lines in my analysis with an average deviation of error approximately equal to the weighted mean (), I set a range from to with a step of . Then, I obtained the final result with the lowest statistical and systematic errors. As the statistical uncertainties were determined from the diagonal terms of the covariance matrix, the best-fitting solution and the uncertainties produced by my fitting method were verified using M arkov chain Monte Carlo simulations used in previous works [39,40,41,42,43,44,45,46,47].
4. Conclusions
In this paper, I used observed absorption line spectra of [Ni V] from the white-dwarf star G191-B2B to constrain the relationship between and the gravitational potential. The obtained result places tighter bounds on the variation of from the spectra of this white-dwarf star than those provided by Berengut et al. [40]. My method to determine the sensitivity of to gravitational fields, which is based on -independent line ratios, allows us to determine the size of statistical and systematic errors and the exact wavelength splitting of the line pairs, which is most suggested around the lines with small separations. Moreover, the method can be simply and effectively applied over a wide range of redshifts. By averaging over several values of , an accurate value of is reached. Using the method presented here, future studies of [Ni V]/[Fe V] in the photospheres of white-dwarf stars should provide further information on the possible variation of under strong gravitational fields.
The increasing improvement of the observation and analysis of both distant astronomical quasars and laboratory spectra, together with the technique utilized in this study, should ultimately offer a test of the equivalence principle of General Relativity, and could serve as an important tool for proving the validity of theoretical models of Grand Unification theory.
Funding
This research received no external funding.
Conflicts of Interest
The author declares no conflict of interest.
References
- Dirac, P.A.M. The Cosmological Constants. Nature 1937, 139, 323. [Google Scholar] [CrossRef]
- Milne, E.A. Kinematics, dynamics, and the scale of time. Proc. R. Soc. A 1937, 158, 324–348. [Google Scholar]
- Bahcall, J.N.; Schmidt, M. Does the Fine-Structure Constant Vary with Cosmic Time? Phys. Rev. Lett. 1967, 19, 1294–1295. [Google Scholar] [CrossRef] [Green Version]
- Bahcall, J.N.; Steinhardt, C.L.; Schlegel, D. Does the fine-structure constant vary with cosmological epoch? Astrophys. J. 2004, 600, 520–543. [Google Scholar] [CrossRef]
- Murphy, M.T.; Webb, J.K.; Flambaum, V.V. Further evidence for a variable fine structure constant from Keck/HIRES QSO absorption spectra. Mon. Not. R. Soc. 2003, 245, 609–638. [Google Scholar] [CrossRef]
- Dzuba, V.A.; Flambaum, V.V.; Webb, J.K. Calculations of the relativistic effects in many-electron atoms and space-time variation of fundamental constants. Phys. Rev. A 1999, 59, 230–237. [Google Scholar] [CrossRef] [Green Version]
- Webb, J.K.; Flambaum, V.V.; Christopher, W.; Drinkwater, M.J.; Barrow, J.D. Search for Time Variation of the Fine Structure Constant. Phys. Rev. Lett. 1999, 82, 888–891. [Google Scholar] [CrossRef]
- Webb, J.K.; Murphy, M.T.; Flambaum, V.V.; Curran, S.J. Does the fine structure constant vary? A third quasar absorption sample consistent with varying α. Astrophys. Space Sci. 2003, 283, 565–575. [Google Scholar] [CrossRef]
- Reimers, D.; Hagen, H.; Rodriguez, P.; Wisotzki, L. Detection of further UV-bright high-redshift QSOs. Astron. Astrophys. 1998, 334, 96–98. [Google Scholar]
- Quast, R.; Reimers, D.; Levshakov, S.A. Probing the variability of the fine-structure constant with the VLT/UVES. Astron. Astrophys. 2004, 415, L7–L11. [Google Scholar] [CrossRef]
- Chand, H.; Srianand, R.; Petitjean, P.; Aracil, B.; Quast, R.; Reimers, D. Variation of the fine-structure constant: Very high resolution spectrum of QSO HE 0515-4414. Astron. Astrophys. 2006, 451, 45–56. [Google Scholar] [CrossRef]
- Levshakov, S.A.; Centurión, M.; D’Odorico, S.; Reimers, D.; Quast, R.; Pollmann, M. Most precise single redshift bound to ∆α/α. Astron. Astrophys. 2006, 449, 879–889. [Google Scholar] [CrossRef]
- Levshakov, S.A.; Molaro, P.; Lopez, S.; D’Odorico, S.; Centurión, M.; Bonifacio, P.; Agafonova, I.I.; Reimers, D. A new measure of ∆α/α at redshift z = 1.84 from very high resolution spectra of Q 1101–264. Astron. Astrophys. 2007, 446, 1077–1082. [Google Scholar] [CrossRef]
- Levshakov, S.A.; Reimers, D.; Kozlov, M.G.; Porsev, S.G.; Molaro, P. A new approach for testing variations of fundamental constants over cosmic epochs using FIR fine-structure lines. Astron. Astrophys. 2008, 479, 719–723. [Google Scholar] [CrossRef] [Green Version]
- Porsev, S.G.; Koshelev, K.V.; Tupitsyn, I.I.; Kozlov, M.G.; Reimers, D.; Levshakov, S.A. Transition frequency shifts with fine-structure-constant variation for Fe II: Breit and core-valence correlation corrections. Phys. Rev. A 2007, 76, 052507. [Google Scholar] [CrossRef]
- Martinez, A.F.; Vladiloand, F.G.; Bonifacio, P. Search for alpha variation in UVES spectra: Analysis of C IV and Si IV doublets towards QSO 1101-264. Mem. Soc. Astron. Ital. Suppl. 2003, 3, 252–255. [Google Scholar]
- Levshakov, S.A.; Centurión, M.; Molaro, P.; D’Odorico, S. VLT/UVES constraints on the cosmological variability of the fine-structure constant. Astron. Astrophys. 2005, 434, 827–838. [Google Scholar] [CrossRef] [Green Version]
- Molaro, P.; Levshakov, S.A.; Monsai, S.; Centurión, M.; Bonifacio, S.; D’Odorico, S.; Monaco, L. UVES radial velocity accuracy from asteroid observations I. Implications for fine structure constant variability. Astron. Astrophys. 2008, 481, 559–569. [Google Scholar] [CrossRef]
- Molaro, P.; Reimers, D.; Irina, I.; Agafonova, I.I.; Levshakov, A.S. Bounds on the fine structure constant variability from FeII absorption lines in QSO spectra. Eur. Phys. J. ST 2008, 163, 173–189. [Google Scholar] [CrossRef]
- Grupe, D.; Pradhan, A.; Frank, S. Studying the Variation of the Fine-Structure Constant Using Emission-Line Multiplets. Astron. J. 2005, 130, 355–366. [Google Scholar] [CrossRef] [Green Version]
- Murphy, M.T.; Flambaum, V.V.; Muller, S.; Henkel, C. Strong limit on a variable proton-to-electron mass ratio from molecules in the distant universe. Science 2008, 320, 16111613. [Google Scholar] [CrossRef] [PubMed]
- Nave, G.; Sansonetti, C.J. Wavelengths of the 3d6(5D)4s a6D−3d6(5D)4py6P multiplet of Fe II (UV 8). Opt. Soc. Am. 2011, B28, 737–745. [Google Scholar] [CrossRef]
- Nave, G. Wavelengths of Fe II lines for studies of time variation of the fine-structure constant. Mon. Not. R. Soc. 2012, 420, 1570–1574. [Google Scholar] [CrossRef]
- Lorén-Aguilar, P.; García-Berro, E.; Isern, J.; Kubyshin, Y.A. Time variation of G and within models with extra dimensions. Class. Quant. Grav. 2003, 20, 3885–3896. [Google Scholar] [CrossRef]
- García-Berro, E.; Kubyshin, Y.; Loren-Aguilar, P.; Isern, J. The variation of the gravitational constant inferred from the Hubble diagram of Type Ia supernovae. Int. J. Mod. Phys. D 2006, 15, 1163–1174. [Google Scholar]
- García-Berro, E.; Lorén-Aguilar, P.; Torres, S.; Althaus, L.G.; Isern, J. An upper limit to the secular variation of the gravitational constant from white dwarf stars. J. Cosmol. Astropart. Phys. 2011, 5, 21. [Google Scholar]
- García-Berro, E.; Torres, S.; Althaus, L.G.; Córsico, A.H.; Lorén-Aguilar, P.; Romero, A.D.; Isern, J. White dwarf constraints on a varying G. Mem. Soc. Astron. Ital. 2014, 85, 118. [Google Scholar]
- Damour, T.; Gibbons, G.W.; Taylor, J.H. Limits on the variability of G using binary-pulsar data. Phys. Rev. Lett. 1988, 61, 1151–1154. [Google Scholar] [CrossRef] [PubMed]
- Damour, T.; Taylor, J.H. On the orbital period change of the binary pulsar PSR 1913 + 16. Astrophys. J. 1991, 366, 501. [Google Scholar] [CrossRef]
- Kaspi, V.M.; Taylor, J.H. High-precision timing of millisecond pulsars. 3: Long-term monitoring of PSRs B1855+09 and B1937+21. Astrophys. J. 1994, 428, 713. [Google Scholar] [CrossRef]
- Guenther, D.B.; Krauss, L.M.; Demarque, P. Testing the constancy of the gravitational constant using helioseismology. Astrophys. J. 1998, 498, 871. [Google Scholar] [CrossRef]
- Thorsett, S.E. The gravitational constant, the Chandrasekhar limit, and neutron star masses. Phys. Rev. Lett. 1996, 77, 1432. [Google Scholar] [CrossRef] [PubMed]
- Hofmann, F.; Muller, J.; Biskupek, L. Lunar laser ranging test of the Nordtvedt parameter and a possible variation in the gravitational constant. Astron. Astrophys. 2010, L5, 522. [Google Scholar] [CrossRef]
- Benvenuto, O.G.; García-Berro, E.; Isern, J. Asteroseismological bound on Ġ/G from pulsating white dwarfs. Phys. Rev. D 2004, 69, 082002. [Google Scholar] [CrossRef]
- Córsico, A.H.; Althaus, L.G.; García-Berro, E.; Romero, A.D. An independent constraint on the secular rate of variation of the gravitational constant from pulsating white dwarfs. J. Cosm. Astropart. Phys. 2013, 6, 032. [Google Scholar] [CrossRef]
- Copi, C.J.; Davis, A.N.; Krauss, L.M. New nucleosynthesis constraint on the variation of G. Phys. Rev. Lett. 2004, 92, 171301. [Google Scholar] [CrossRef] [PubMed]
- Bambi, C.; Giannotti, M.; Villante, F.L. Response of primordial abundances to a general modification of GN and/or of the early universe expansion rate. Phys. Rev. D 2005, 71, 123524. [Google Scholar] [CrossRef]
- Le, T.D. White Dwarf Spectra for Studies of Time Variation of the Fine Structure Constant. Braz. J. Phys. 2019, 49, 256. [Google Scholar] [CrossRef]
- Le, T.D. Wavelengths of [Fe II] from quasar J110325-264515 for a study of space-time variations in the fine-structure constant. Res. Phys. 2019, 12, 1035. [Google Scholar] [CrossRef]
- Berengut, J.C.; Flambaum, V.V.; Ong, A.; Webb, J.K.; Barrow, J.D.; Barstow, M.A.; Preval, S.P.; Holberg, J.B. Limits on the dependence of the fine-structure constant on gravitational potential from white-dwarf spectra. Phys. Rev. Lett. 2013, 111, 010801. [Google Scholar] [CrossRef]
- Le, T.D. An Updated Constraint on Variations of the Fine-Structure Constant Using Wavelengths of Fe II Absorption Line Multiplets. Symmetry 2018, 10, 722. [Google Scholar] [CrossRef]
- Le, T.D. A stringent limit on variation of the fine-structure constant using absorption line multiplets in the early universe. Astrophysics 2016, 59, 285. [Google Scholar] [CrossRef]
- Raassen, A.J.J.; van Kleff, T.A. Extended analysis and ionization potential of the fifth spectrum of nickel (Ni V). Physica B+C 1976, 85, 180–190. [Google Scholar] [CrossRef]
- Murphy, M.T.; Berengut, J.C. Laboratory atomic transition data for precise optical quasar absorption spectroscopy. Mon. Not. R. Soc. 2014, 438, 388–411. [Google Scholar] [CrossRef]
- Bainbridge, M.B.; Webb, J.K. Artificial intelligence applied to the automatic analysis of absorption spectra. Objective measurement of the fine structure constant. Mon. Not. R. Soc. 2017, 468, 1639–1670. [Google Scholar] [CrossRef]
- Webb, J.K.; King, J.A.; Flambaum, V.V.; Carswell, R.F.; Bainbridge, M.B. Indications of a Spatial Variation of the Fine Struture Constant. Phys. Rev. Lett. 2011, 107, 191101. [Google Scholar] [CrossRef] [PubMed]
- Kramida, A. Energy levels and spectral lines of quadruply ionized iron (Fe V). Astrophys. J. Suppl. Ser. 2014, 212, 11. [Google Scholar] [CrossRef]
Figure 1.
Plot for the components of [Ni V].

© 2019 by the author. Licensee MDPI, Basel, Switzerland. This article is an open access article distributed under the terms and conditions of the Creative Commons Attribution (CC BY) license (http://creativecommons.org/licenses/by/4.0/).
Share and Cite
MDPI and ACS Style
Le, T.D. Updated Constraints on the Variations of the Fine-Structure Constant from an Analysis of White-Dwarf Spectra. Symmetry 2019, 11, 936. https://doi.org/10.3390/sym11070936
AMA Style
Le TD. Updated Constraints on the Variations of the Fine-Structure Constant from an Analysis of White-Dwarf Spectra. Symmetry. 2019; 11(7):936. https://doi.org/10.3390/sym11070936
Chicago/Turabian StyleLe, T. D. 2019. "Updated Constraints on the Variations of the Fine-Structure Constant from an Analysis of White-Dwarf Spectra" Symmetry 11, no. 7: 936. https://doi.org/10.3390/sym11070936
Note that from the first issue of 2016, this journal uses article numbers instead of page numbers. See further details here.