1. Introduction
The optic cup is a depressed area in the central part of the optic papilla. It is an important tissue in the fundus and can be used to find diseases of the fundus, like glaucoma and congenital myopia. Glaucoma is an optic nerve disease caused by an increase in intra-ocular pressure. Glaucoma is irreversible and the rate of blindness is very high, second only to cataracts. Clinically, glaucoma can be initially diagnosed by measuring the optic cup-to-disc ratio (CDR), which is the area ratio of the optic cup area to the optic disc area [
1]. Therefore, accurate detection and segmentation of the optic cup is very important, not only to accurately calculate the cup-to-disc ratio, but also to establish a retinal coordinate system, which can further determine if the retina contains foreign tissue like drusen, exudate, or blood. Currently, research on optic cup segmentation is mainly divided into two categories: Optic cup segmentation based on traditional image processing techniques and optic cup segmentation based on deep learning.
Dutta et al. [
2] proposed a two-threshold-based method of optic cup segmentation based on the brightness characteristics of the optic cup. Zhao Qiuhong et al. [
3] proposed a threshold-based color image optic cup segmentation method. Mittapali et al. [
4] proposed an optic cup-based segmentation method based on threshold-based Fuzzy C-means FCM clustering. The method of optic cup segmentation in [
5] is based on super-pixel clustering. Alghmdi et al. [
6] proposed a method for the extraction of optic cups based on vascular bending features. Wong et al. [
7] based their method on blood vessels bending at the edge of the optic cup being the feature extraction of the optic cup. Fonton et al. [
8] proposed a method of segmentation based on the curvature of the vessel at the edge of the optic cup. The artificial design of the feature flow of this type of method is complicated and a series of complicated preprocessing steps is necessary before the optic cup is segmented.
Research on optic cup segmentation based on deep learning is abundant. Zilly et al. [
9] proposed an optic segmentation method based on the integrated learning-based convolutional neural network structure. Al-Bander et al. [
10] proposed a new network called Fully Convolutional FC-DenseNet that segments optic cups in color fundus images. Sevastopolsky et al. [
11] proposed a color fundus image segmentation method based on the Unity NetworkingU-Net network. One year later, the team improved this network and proposed a Stack-U-Net network structure [
12], which is based on a U-Net network image segmentation cascade network. Huazhu et al. [
13] designed the Multi-label Deep NetworkM-Net network to segment the optic cup. Deep learning methods require large-scale data sets, but due to particularities of medical imaging, it is difficult to meet such requirements. Therefore, existing optic cup segmentation methods still lack accuracy. Therefore, improving the accuracy of optic cup segmentation under small sample conditions is an urgent problem.
In this paper, a new color-based fundus image segmentation method based on deep learning is designed. The method uses existing small-scale data sets, combined with a migration-based learning strategy and network structure. The network uses channel weighting to separate high-level (semantic) and low-level (geometric) features.
The main contributions of this paper are as follows:
A new deep learning network, called Segmentation-ResNet Seg-ResNet, is proposed;
A residual block calculation is optimized to reduce the computational complexity of the algorithm and accelerate the convergence while maintaining accuracy;
A channel weighting unit module is designed to emphasize the more significant features in the feature map and suppress the less significant features.
2. Materials and Methods
This paper develops a deep learning method for optic cup segmentation and designs a new network architecture, Seg-ResNet, based on a residual structure. Considering the relationship between feature channels, squeeze-and-excitation (SE) is used to model the dependencies between channels by adaptively adjusting the characteristic response values of each channel. Feature selection is based on multiple-layer fusion, which finds pixel position information while capturing image semantic information. Because the data set used in this work is relatively small, it is necessary to use a migration learning strategy to initialize the weight of a convolutional layer and speed up the convergence.
2.1. Seg-ResNet Network Design
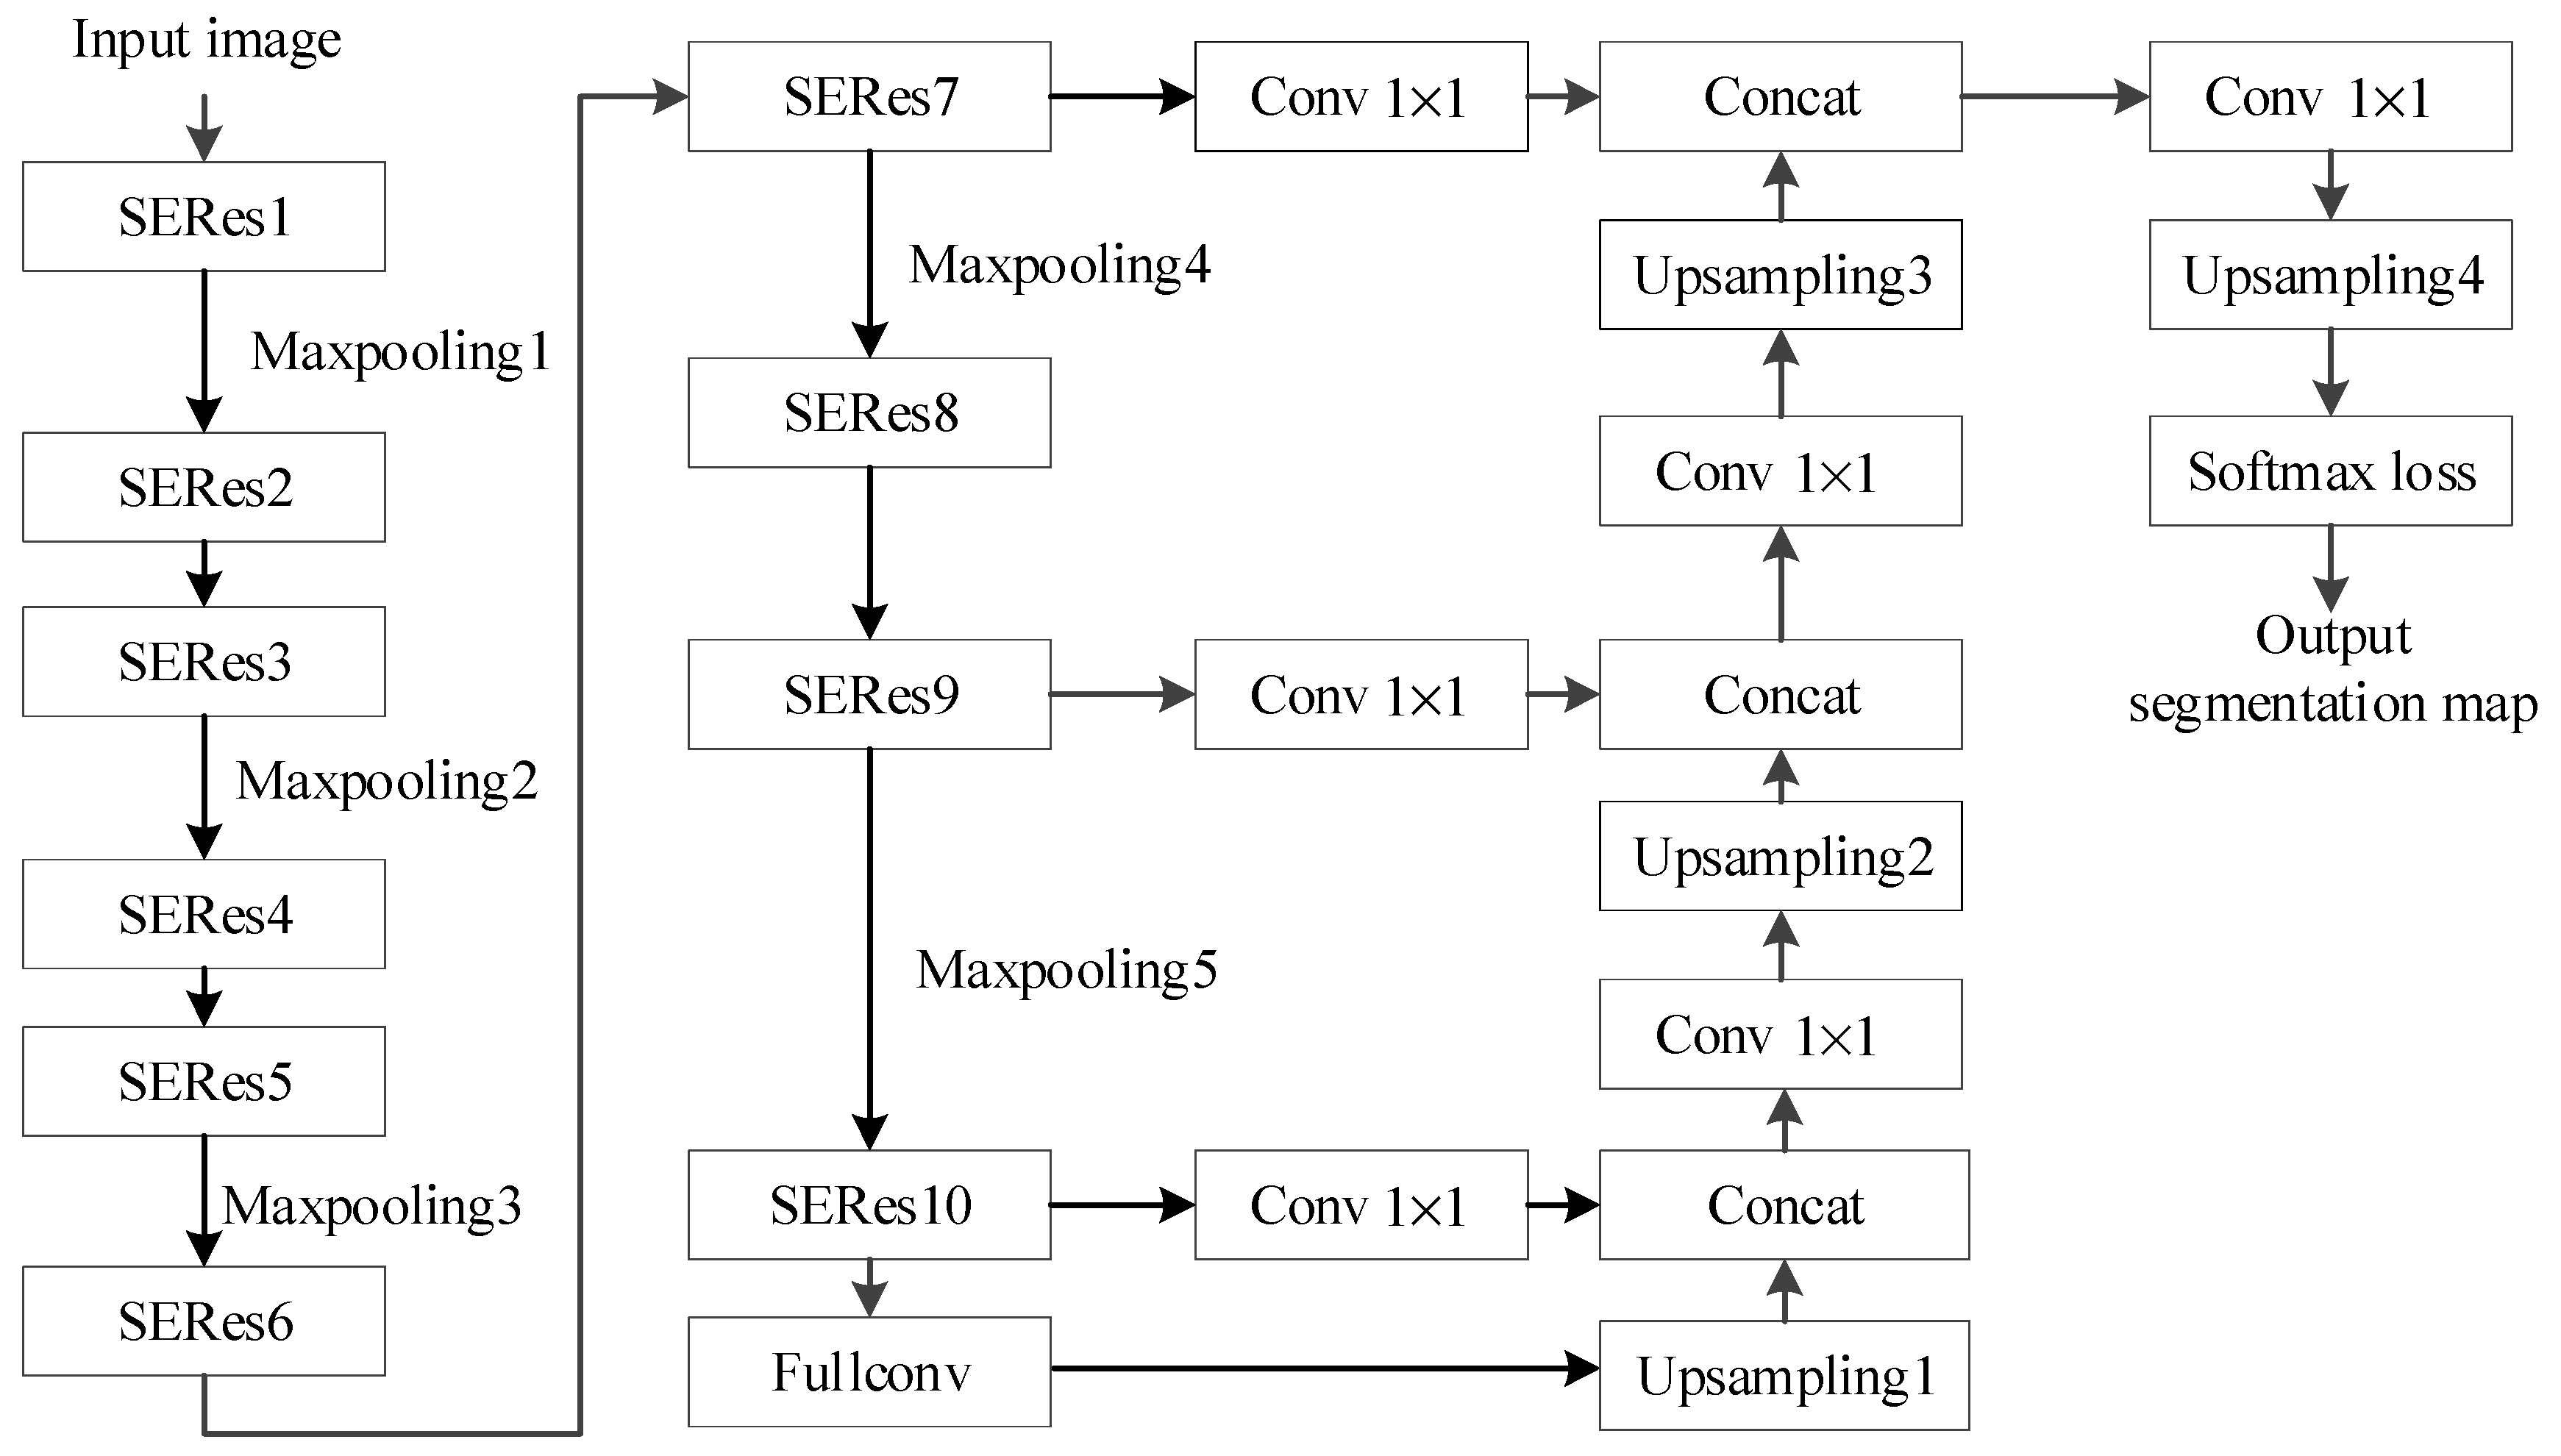
Researchers have found that increasing the depth of a network can facilitate feature expression, but the increase in network depth can lead to gradient explosion or disappearing gradients. Residual networks can help to solve this problem. The characteristics of optic cups in color fundus images are not obvious and, more often than not, optic cup edge information is weak. Therefore, learning optic cup edge features using a shallow network may fail. The Seg-ResNet network takes a residual structure as the main body, adopts an SE module, adjusts the channel dependency relationship by adding a learning step, re-calibrates channel feature weights, and integrates a set of low-level features with high-level features to combine high-resolution, low-level feature graphs and low-resolution, high-level feature graphs with strong semantic information. Compared with the ordinary ResNet, useful features are fully utilized so that the underlying network structure obtains a greater receptive field to some extent. The combination of the low-level and high-level features not only uses semantic features, extracted at the high level, but also uses pixel space information, extracted at the low level, to ensure features are weighted according to level of importance. The Seg-ResNet network combines the advantages of both layers, not only by considering levels of significance, but also by considering the degree of dependence of the feature channel, enhancing the robustness of the network.
The deep learning network structure Seg-ResNet designed in this paper is shown in
Figure 1.
Seg-ResNet includes a total of 10 Squeeze-and-Excitation ResNetSERes modules, 5 maximum pooling layers, 4 upsampling layers, and a Softmax loss layer. The convolution(Conv) kernel in the network has two sizes, 1 × 1 and 3 × 3, and the stride is 1. The non-linearity of the network is increased after activating each layer using the Rectified linear unit ReLU function. The maximum pooling layer has a convolution size of 2 × 2 and a stride of 2.
The Seg-ResNet network takes the residual structure as its main body and adopts an SE module to adjust channel dependence using a learning technique. The re-calibration of the channel features essentially fuses the low-level features of the network with the high-level features, which yields a high-resolution feature maps with strong semantic information. Compared with the ordinary ResNet, which only considers the importance of the feature channel, the re-calibration step of our channel features ensures that the underlying network obtains a greater receptive field to some extent. The combination of the low-level features and the high-level features combines the advantages of both geometric and semantic information to improve the robustness of the network.
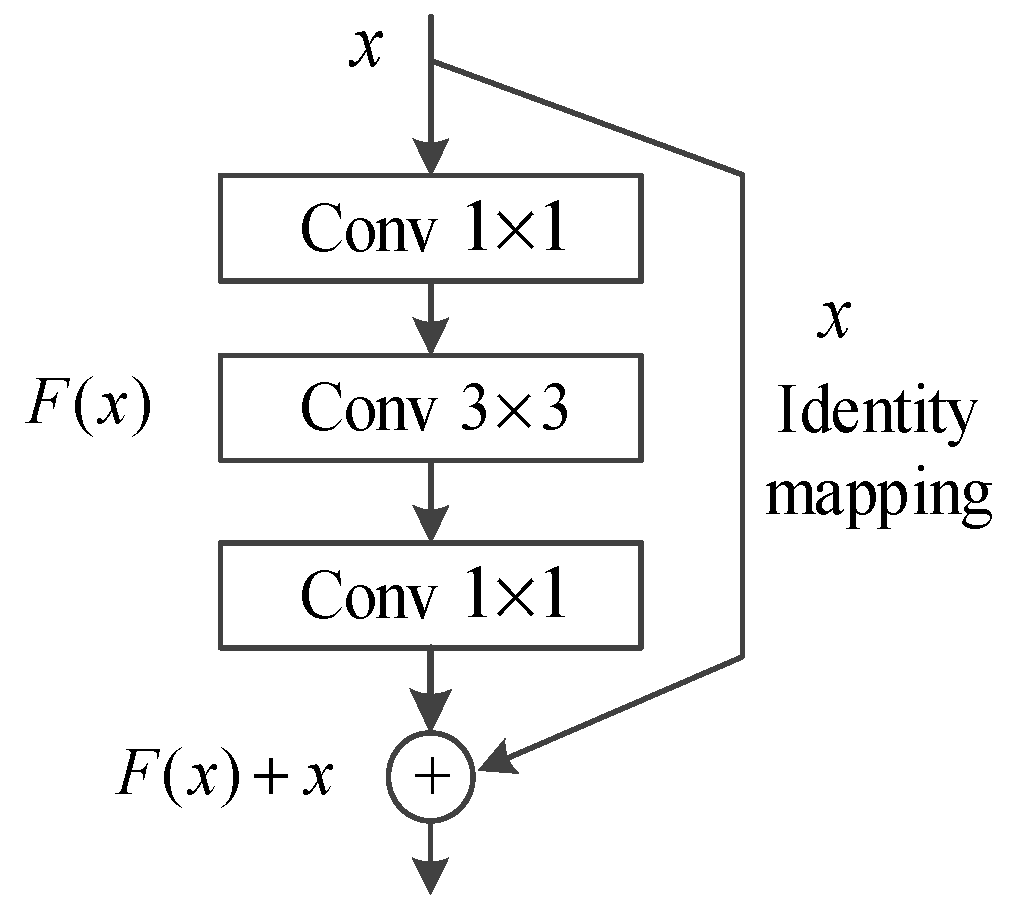
2.2. Residual Structure
The residual structure model uses an identity map to degrade the deep network into a shallow network. The network considers the computational cost and optimizes the residual block calculation, which is a two-layer convolution 3*3 of the three-layer convolution 1*1+3*3+1*1 replacement used. First, reducing the dimension, using a 1*1 convolution filter, reduces the computation and optimizes the intermediate 3*3 convolutional layer in the structure. The dimension is restored by adding a 1*1 convolution filter, which reduces the amount of computation and accelerates convergence, while maintaining accuracy. The optimized structure is shown in
Figure 2.
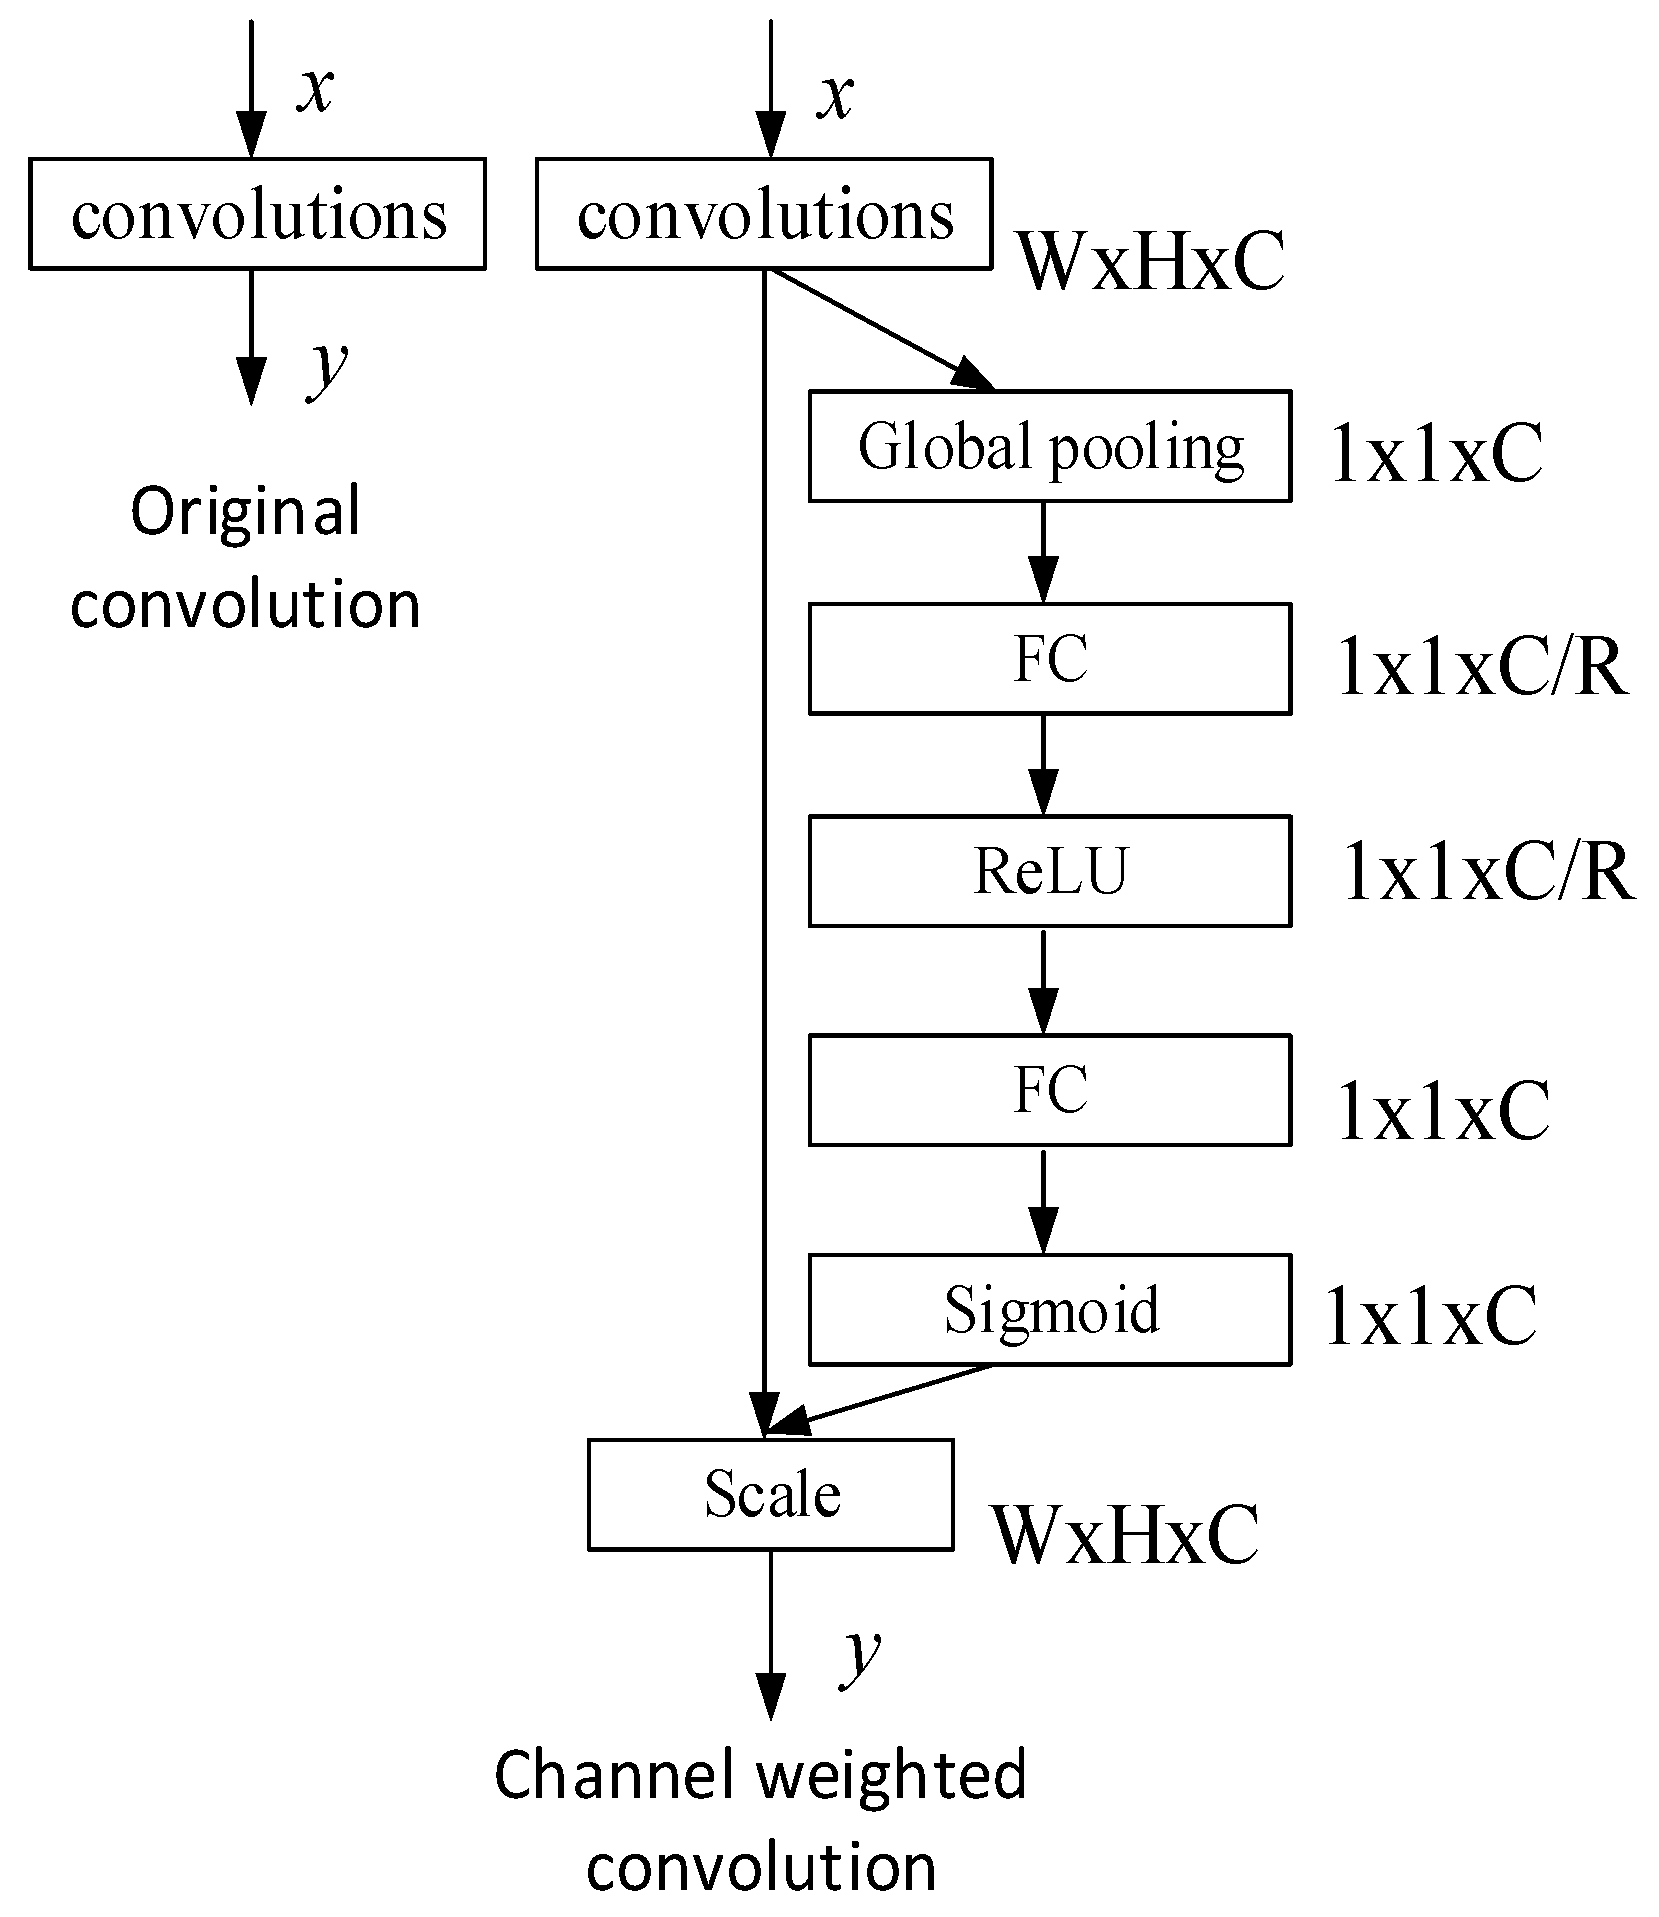
2.3. Channel Weighting
Channel weighting considers the dimension of the feature map, finds the dependence of each channel, calculates the importance of different feature channels by using learning techniques, and selectively enhances the main features to suppress the unimportant features. Seg-ResNet is based on the channel weighting unit module design, so that the useful features of the feature map are extracted via a network convolution and are more fully utilized while the useless features are suppressed. The schematic diagram of the SE module is shown in
Figure 3.
Figure 3 is the schematic diagram of the SE module. Where W is width, H is height, C is channels and R is hyperparameter. FC is Fully Convolutional. It shows that one set of features is directly outputted in the upper layer, while the other set of features uses weighting operations, such as compression and excitation. The process has the following three steps:
Squeeze. A global average pooling is used to compress the two-dimensional feature map outputted by each layer to one dimension. Then, a one-dimensional feature is obtained via compression, which reflects the global receptive field information of the input feature channel.
Excitation. A learnable weight is generated for the compressed feature channel (similar to the mechanism of a gate in a cyclical neural network). The correlation between the feature channels can be explicitly modeled nonlinearly via excitation.
Weighting. After steps 1 and 2, the resulting output weights represent the importance of each feature channel. As shown in
Figure 3, after a convolution is applied to the network, a set of features are directly outputted and the resulting weights are weighted by the scale-by-channel to the directly outputted features to complete the re-weighting of the original feature channels.
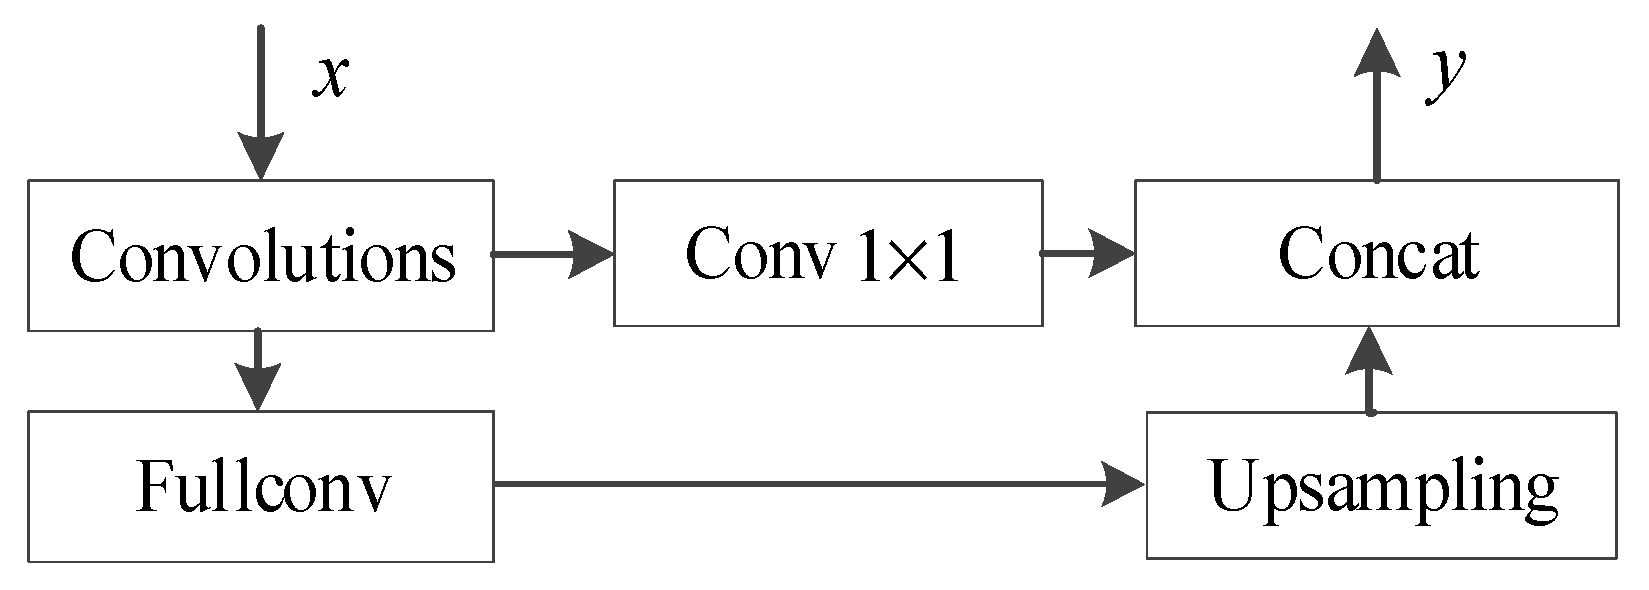
2.4. Feature Fusion
The convolutional neural network has translation invariance and the depth of the network layer is positively related to the degree of abstraction of the feature, so the output of the last layer is usually used as a feature representation. However, the features extracted at the higher levels may be too coarse in space and thus may lack location information for the pixels. At the pixel-level segmentation task, the position of each pixel is also very important. Conversely, a lower network layer can accurately find the location of a pixel, but cannot capture semantic information.
The interesting features learned by the network via training are distributed to each layer. To extract more refined features of the fundus in the fundus image, the Seg-ResNet network combines high-level features and low-level features. The specific operations are as follows:
Restore the feature map size at the decoding stage. At the decoding stage, the compressed feature map is restored by continuous upsampling to be consistent with the size of the underlying feature map to be fused;
Dimension reduction of the feature map at the coding stage. The feature map dimension at the coding stage is higher than the feature map at the decoding stage. The feature map of the bottom layer output of the 1 × 1 convolution kernel dimension reduction coding stage is used, which facilitates fusion with the feature map after high-layer recovery;
Fusion of the high level and underlying features. After the top and bottom feature maps reach the same size and dimension, they are merged using the ConcatenationConcat layer.
As shown in
Figure 4, the feature map of the full convolutional layer compression undergoes upsampling in the decoding stage, so that the image feature size is restored to the size before compression. The image after fusion is symmetrical with the original image, which has a great impact on our final result. The feature map is reduced by 1 × 1 convolution filtering prior to the full-convergence layer. Then, it is transformed into the same dimension as the feature map after upsampling. Finally, the features of the two layers are merged via the Concat layer.
3. Results
In this paper, the fundus images in the public databases GlaucaRepo and Drishti-GS were tested. The experimental results were analyzed from various aspects to verify the robustness of the depth-based learning optic cup segmentation method and the feasibility of the Seg-ResNet network design.
3.1. Experiment Platform
The work was done on a computer work station with a 1080 Ti Graphics Processing Unit GPU (GeForce GTX 1080 Ti) (NVIDIA, Santa Clara, California, USA) and a 3.4 GHz Central Processing Unit CPU (3.4 GHz Intel core). The work station was also equipped with 256 GB memory and a 480 GB solid state drive, which fully meets the requirements of deep neural network training.
A Ubuntu 16.04 operating system was used. The algorithm used C++ programming language and Matlab for linear algebra calculations. The main tool used to build the network was the open source learning framework Caffe. The dependent libraries used were Opencv, Compute Unified Device Architecture CUDA, cudnn, and Protubuf.
3.2. Experimental Data Set
The training set of this paper had 3256 color fundus photographs provided by a cooperative hospital. Each image size was different, the illumination brightness of each image was different, and the lesion characteristics were different, which ensured richness of the sample features. The test set used the Glaucoma Repo [
8] and Drishti-GS [
14] fundus data sets. Glaucoma Repo and Drishti-GS are both public glaucoma test data sets. The GlaucomaRepo data set contained 96 color fundus photographs taken from Puerta del Mar Hospital in Spain. The camera model was a TRC-50EX, which is a color camera manufactured by TOPCON in Japan. Each image size was 1960 × 1960, and the data set contained an optic disc and an optic cup that were manually labeled by two experts. The Drishti-GS data set image was collected at the Aravind Eye Hospital in India. It contained 101 images of different sizes and each image was 2047 × 1760. The image set contained images of normal eyes and eyes with glaucoma and they had manually-labeled optic cups.
3.3. Experimental Results
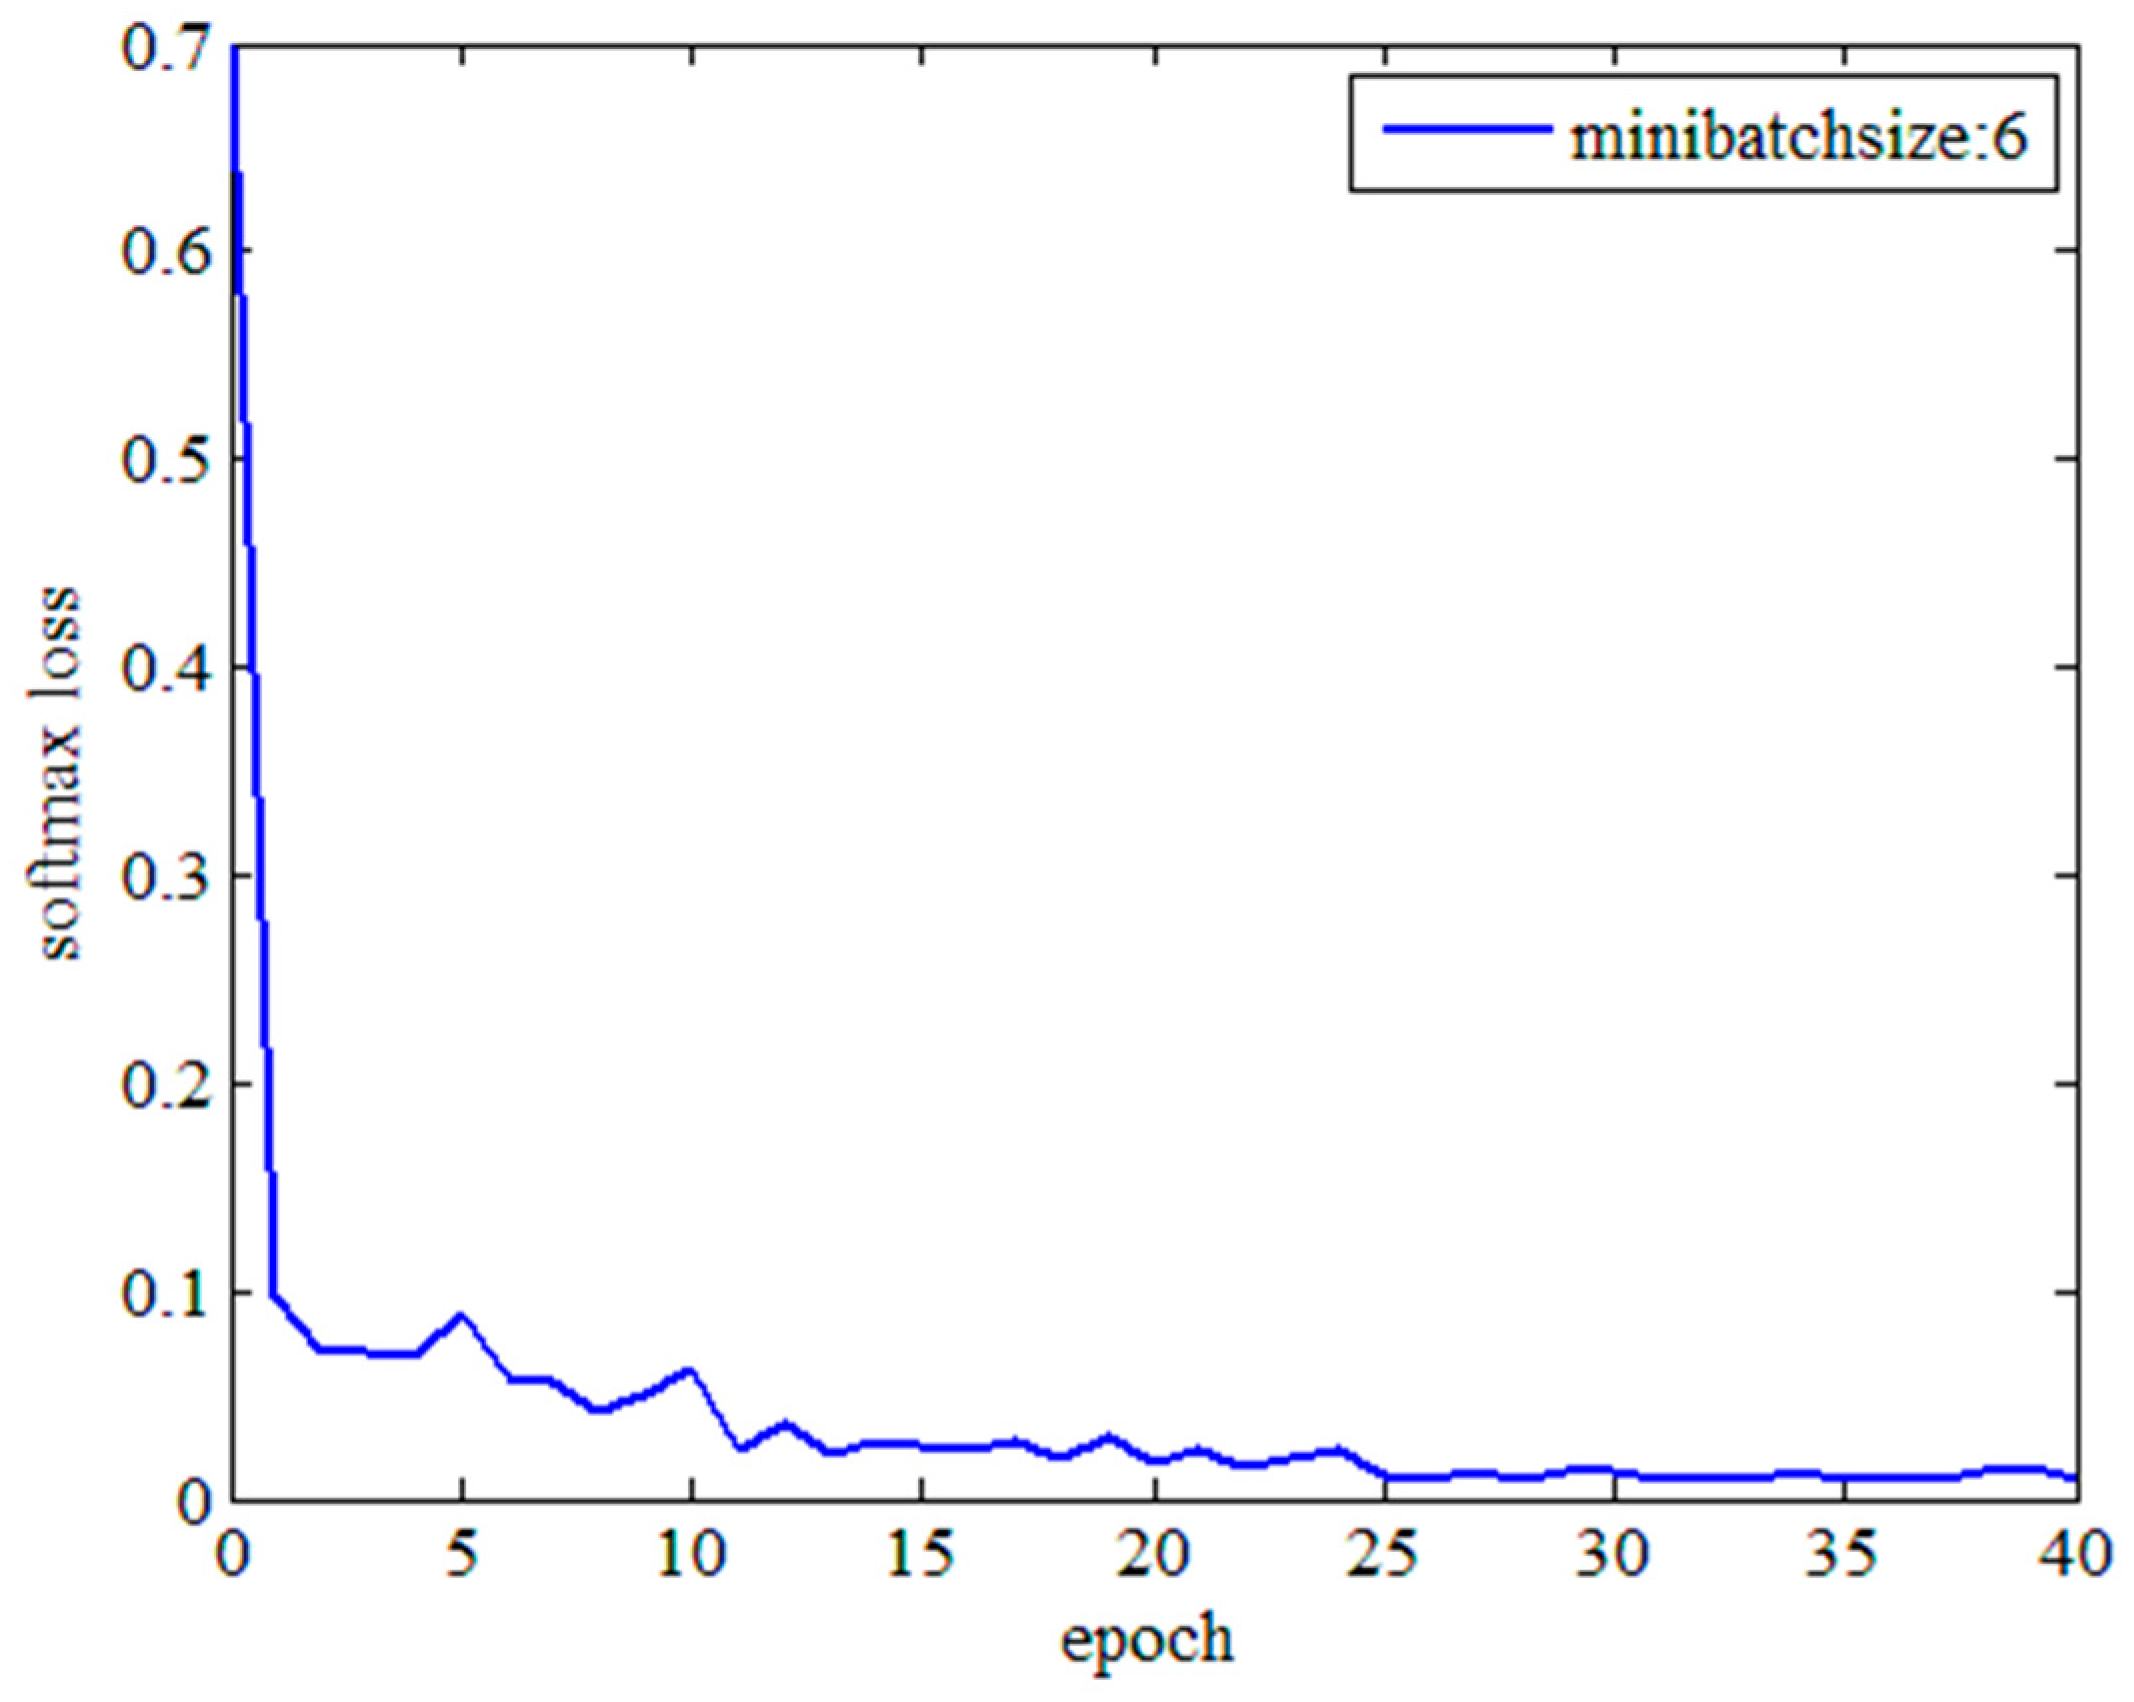
The parameters of the optic cup segmentation network were set as follows. The random gradient descent algorithm with momentum was used to optimize the training. The momentum value was 0.95 and the learning rate was set to 0.001.
Figure 5 shows the change in the loss value per epoch during network training. The loss value changed slowly from the 12th epoch, so the epoch value was 12.
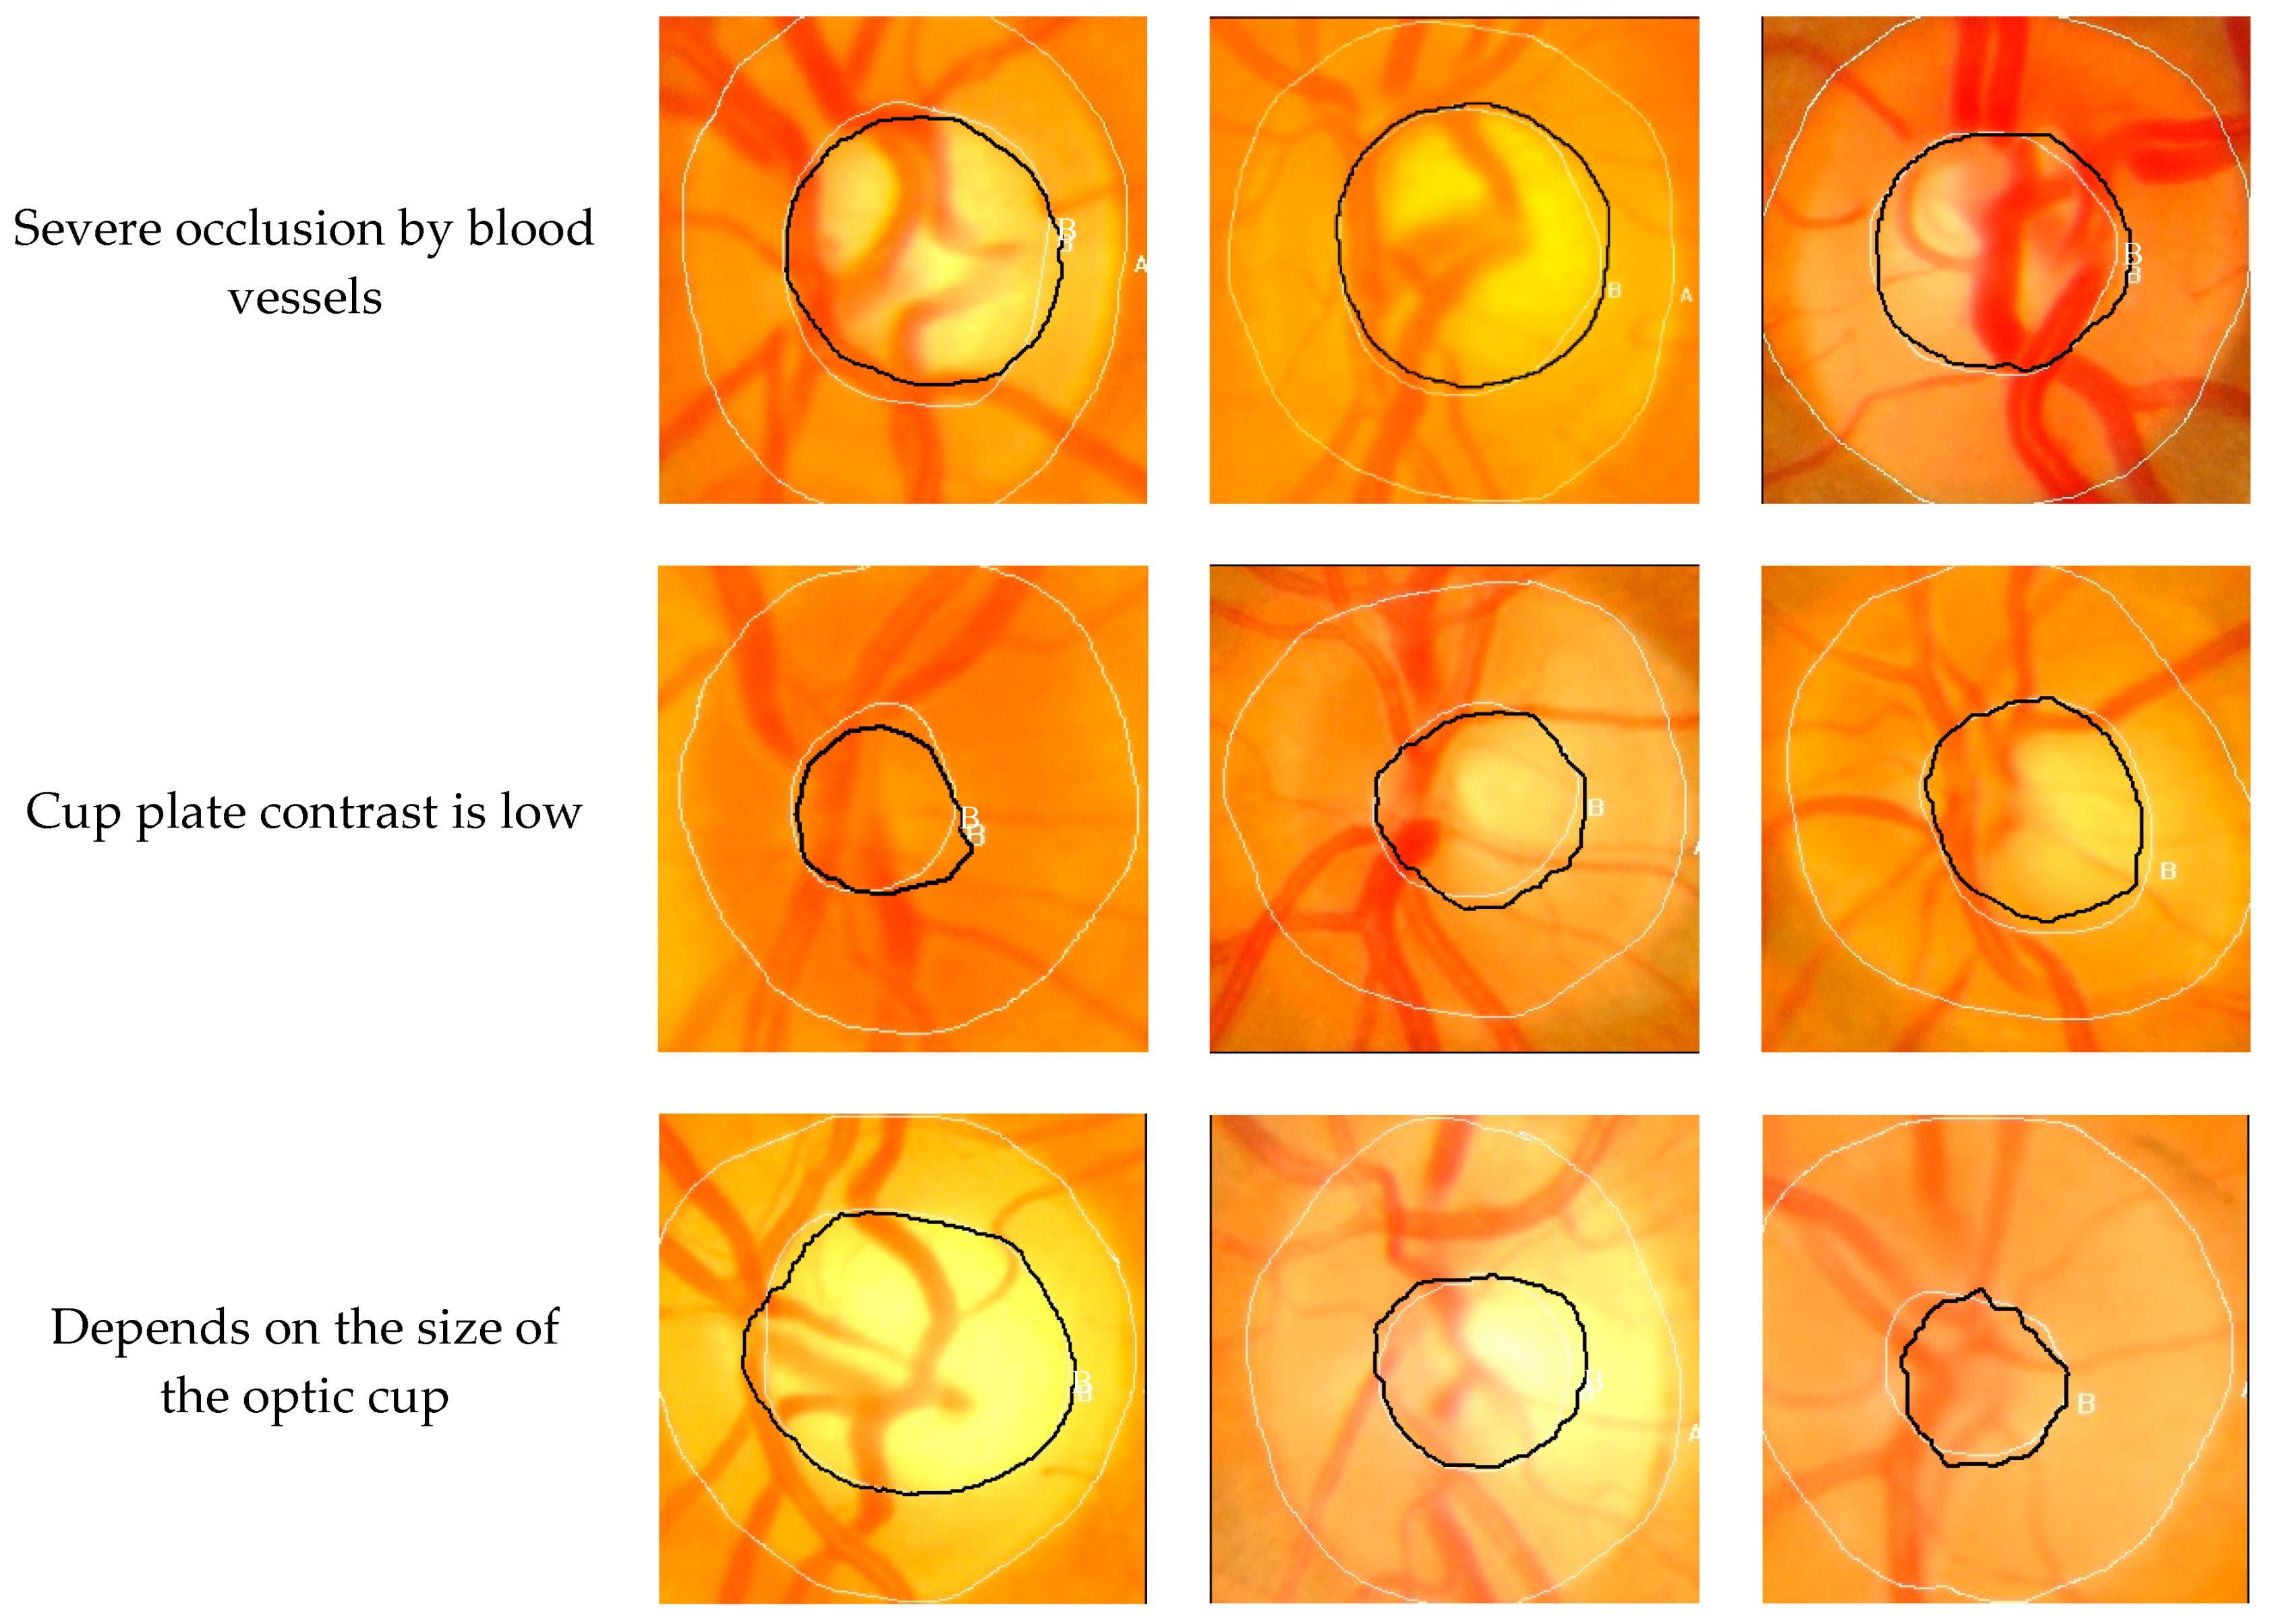
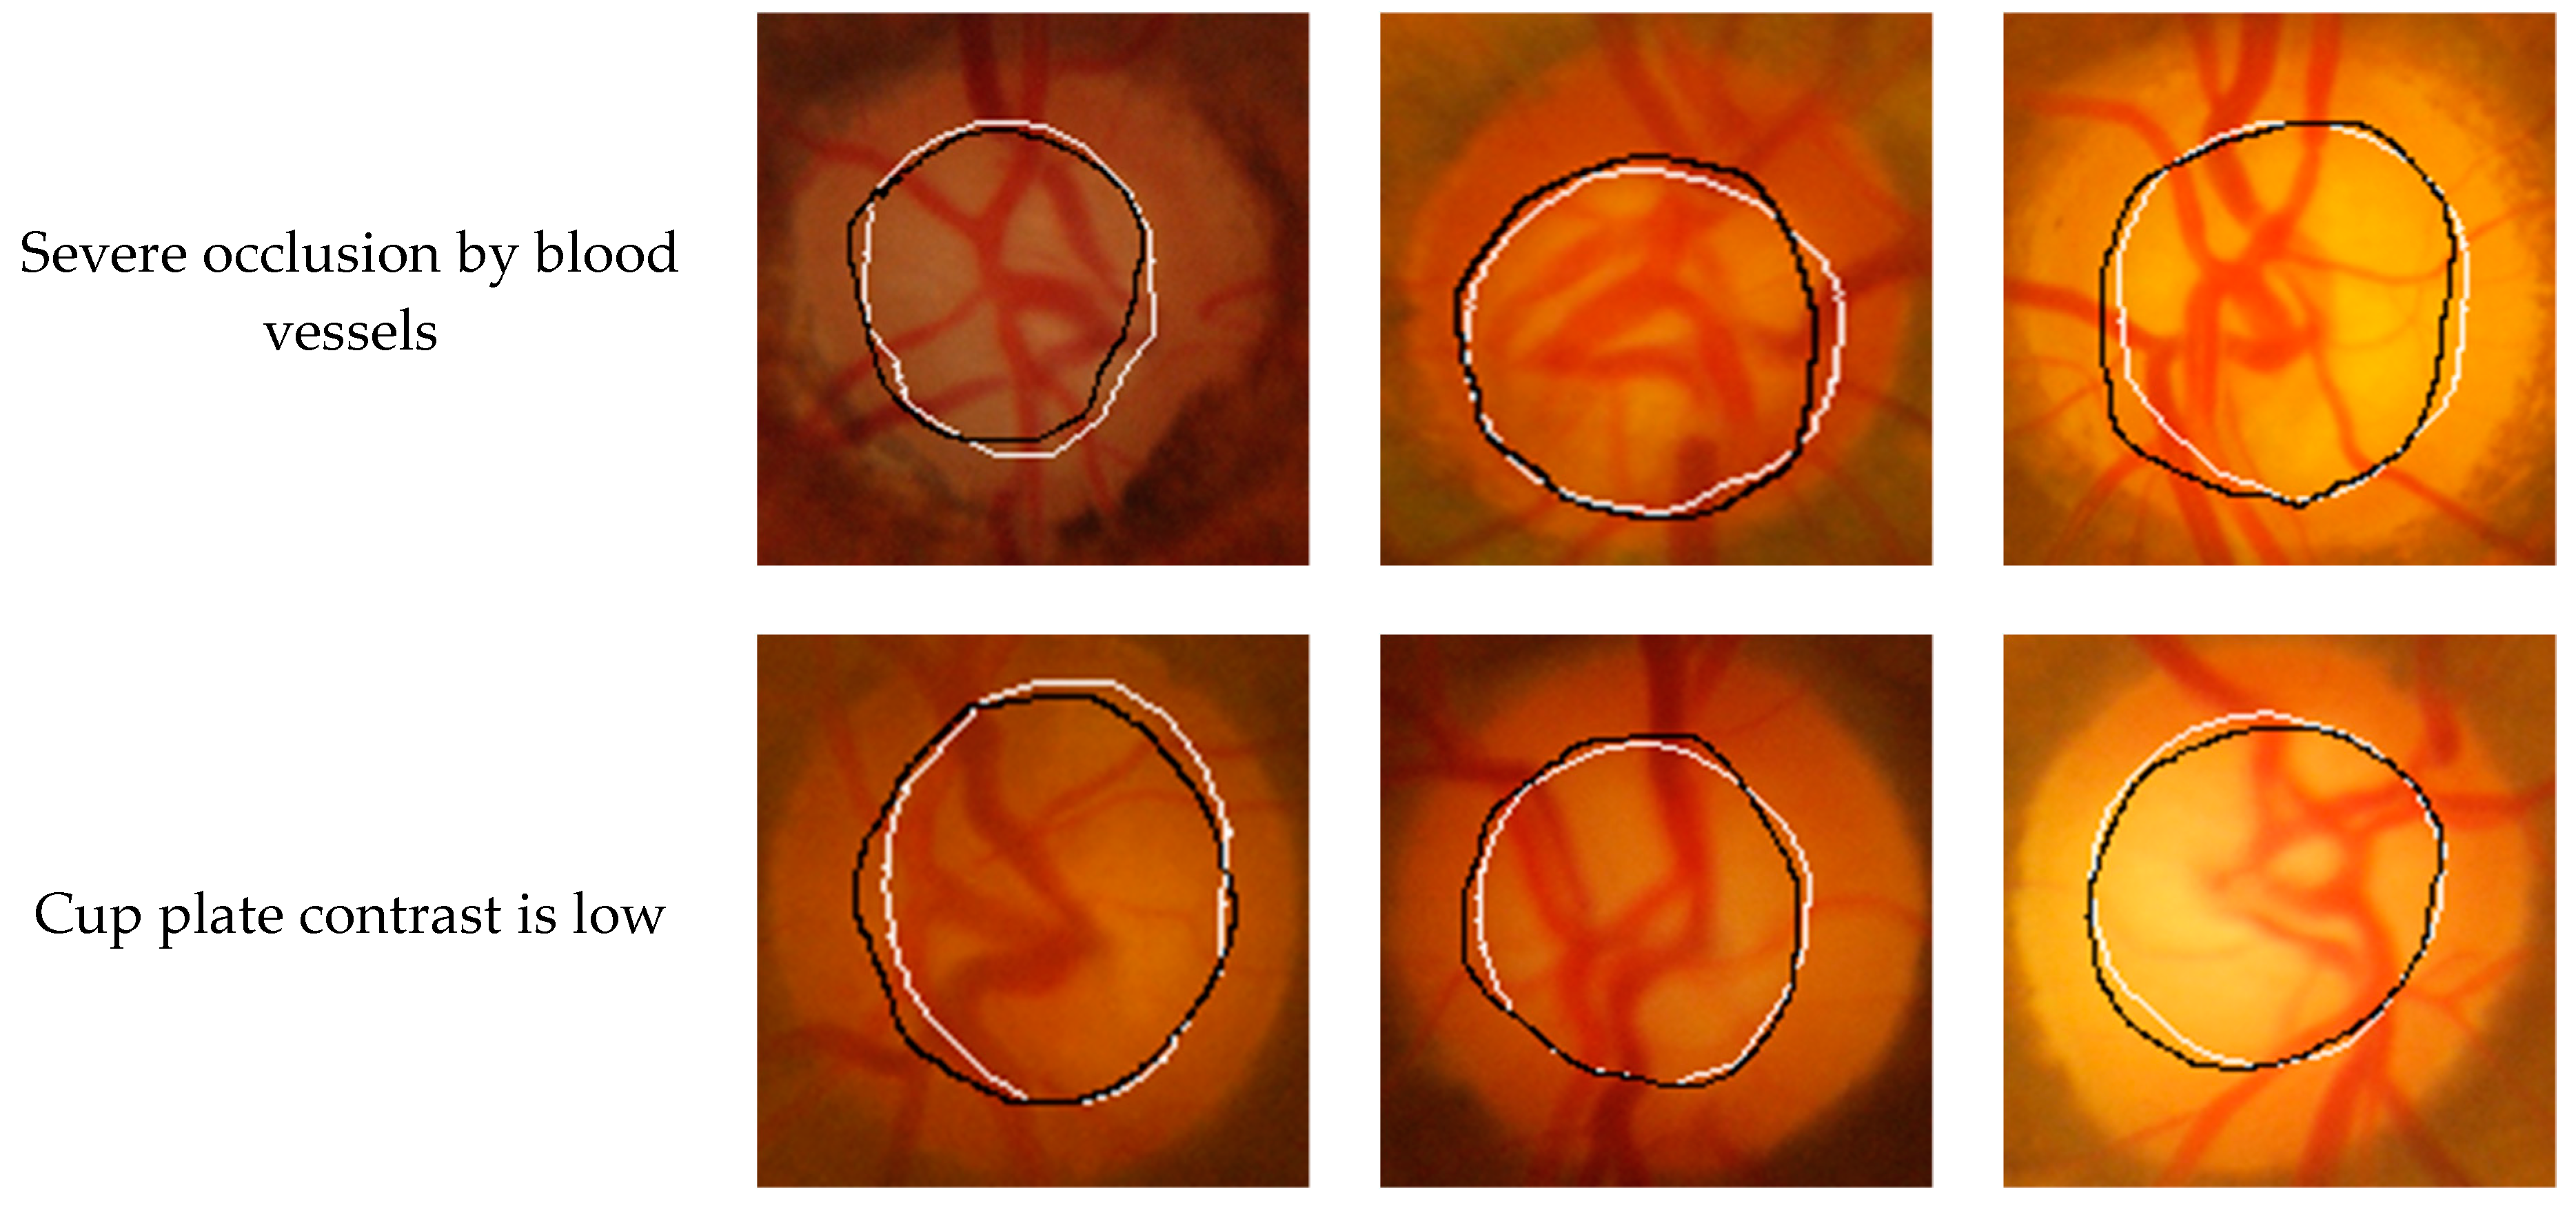
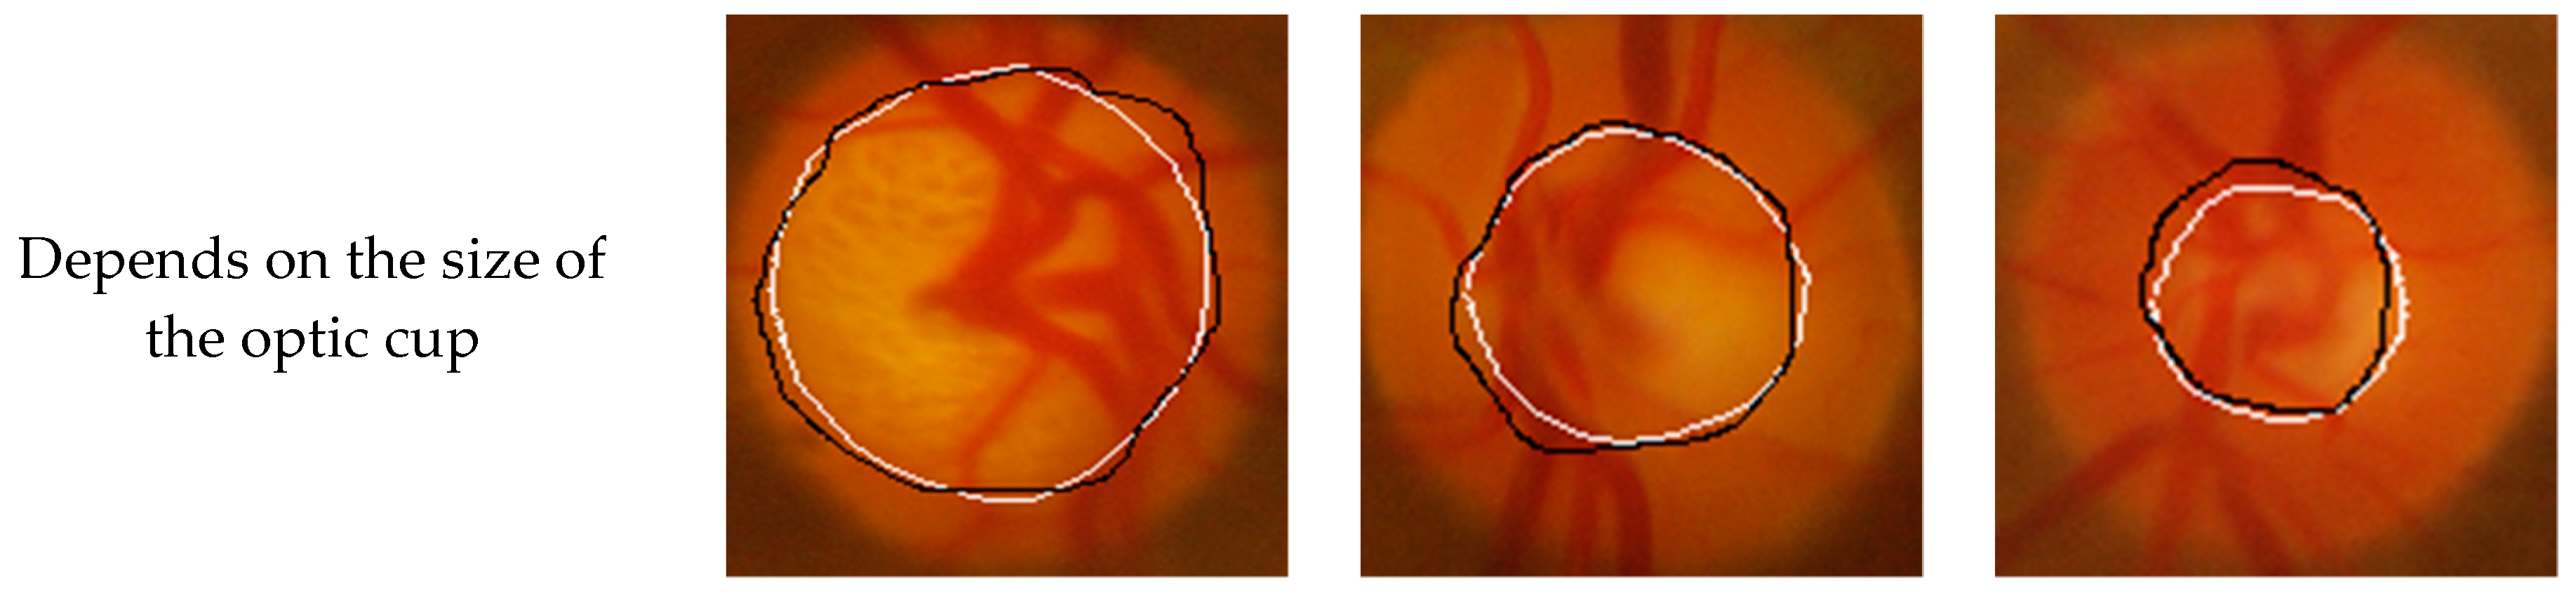
The fundus images were complex and diverse and the images were divided into three categories: Fundus images severely blocked by blood vessels; fundus images with low cup-contrast; and fundus images with different optic cup area images.
Figure 5 and
Figure 6 are the results of segmentation from the GlaucomaRepo and Drishti-GS data sets, respectively, using the deep learning-based Seg-ResNet network proposed in this work.
The optic cup has a small area in the fundus image. To judge the segmentation effect more intuitively and clearly, the edge of the segmentation result was fitted to the region of interest with expert annotation.
Figure 6 and
Figure 7 show the segmentation results of the GlaucomaRepo and Drishti-GS data sets using the Seg-ResNet network, respectively. The Seg-ResNet network training not only adaptively learned the brightness characteristics of the optic cup, but also learned the characteristics of the bending of the blood vessel when it entered and exited the optic cup. For an image of the optic cup blocked by a blood vessel, the blood vessel obstruction occupied half of the area of the optic cup. Therefore, our method accurately segmented the optic cup and was basically consistent with the expert labeling. For images with low contrast of the cup disc, even a trained expert could not distinguish the edge information of the optic cup, but our method still accurately identified the optic cup. For images with different optic cup sizes, the method still accurately segmented the optic cup. Moreover, this method achieved good results with the GlaucomaRepo and Drishti-GS data sets, which were basically consistent with the expert labeling. The experimental results show that, for images with severe occlusion of blood vessels, low cup plate contrast, and different sizes of optic cups, this method can accurately segment optic cups and obtain excellent segmentation results on different data sets. The method in this paper has high robustness.
3.4. Evaluation Standard
To measure the performance of the optic cup segmentation method, the segmentation results were evaluated via three factors: Accuracy (ACC), sensitivity (SE), and specificity (SP). The formula for each measure of performance is:
where TP refers to true positive, FN refers to false negative, TN refers to true negative, and FP refers to false positive. For fundus images, true positive means that the results given in this paper were consistent with the area marked by the expert and, conversely, if they were inconsistent, they were called false negatives. Similarly, if the expert diagnosed an area as having no optic cup where there was no optic cup, then the result was a true negative. If an optic cup was labeled as being in the image but it was not actually there, then the result was a false positive. Sensitivity refers to the proportion of pixels in the optic cup area that could be correctly classified. The higher the sensitivity, the lower the false negative rate. Specificity refers to the proportion of pixels outside the non-visual optic cup area that were not correctly classified by the optic cup. The higher the specificity, the lower the false positive rate. Accuracy refers to the proportion to all pixels in the image that were correctly classified. The higher the accuracy, the higher the sensitivity and specificity. The higher the value of the three evaluation indicators, the better the segmentation.
3.5. Comparison with Other Methods
To prove the validity and reliability of the Seg-ResNet network segmentation method, the following aspects were compared and analyzed:
Comparison with the segmentation methods of the unmodified ResNet network, ResNet+SE network, and ResNet+ feature fusion network, respectively;
Comparison of the optic cup segmentation method with FCM clustering;
Contrast with other reference segmentation methods.
3.5.1. Comparison of the Effect of the Optic Cup Segmentation with the Unmodified Basic Network
Since the Seg-ResNet segmentation network is based on the ResNet network for structural design, the channel weighting module was introduced at the same time and the high-level features of the network were merged with the underlying features. To verify the rationality of the Seg-ResNet network design, this section compares our network method results to the ResNet network, ResNet + SE network, and ResNet + feature fusion network segmentation method results.
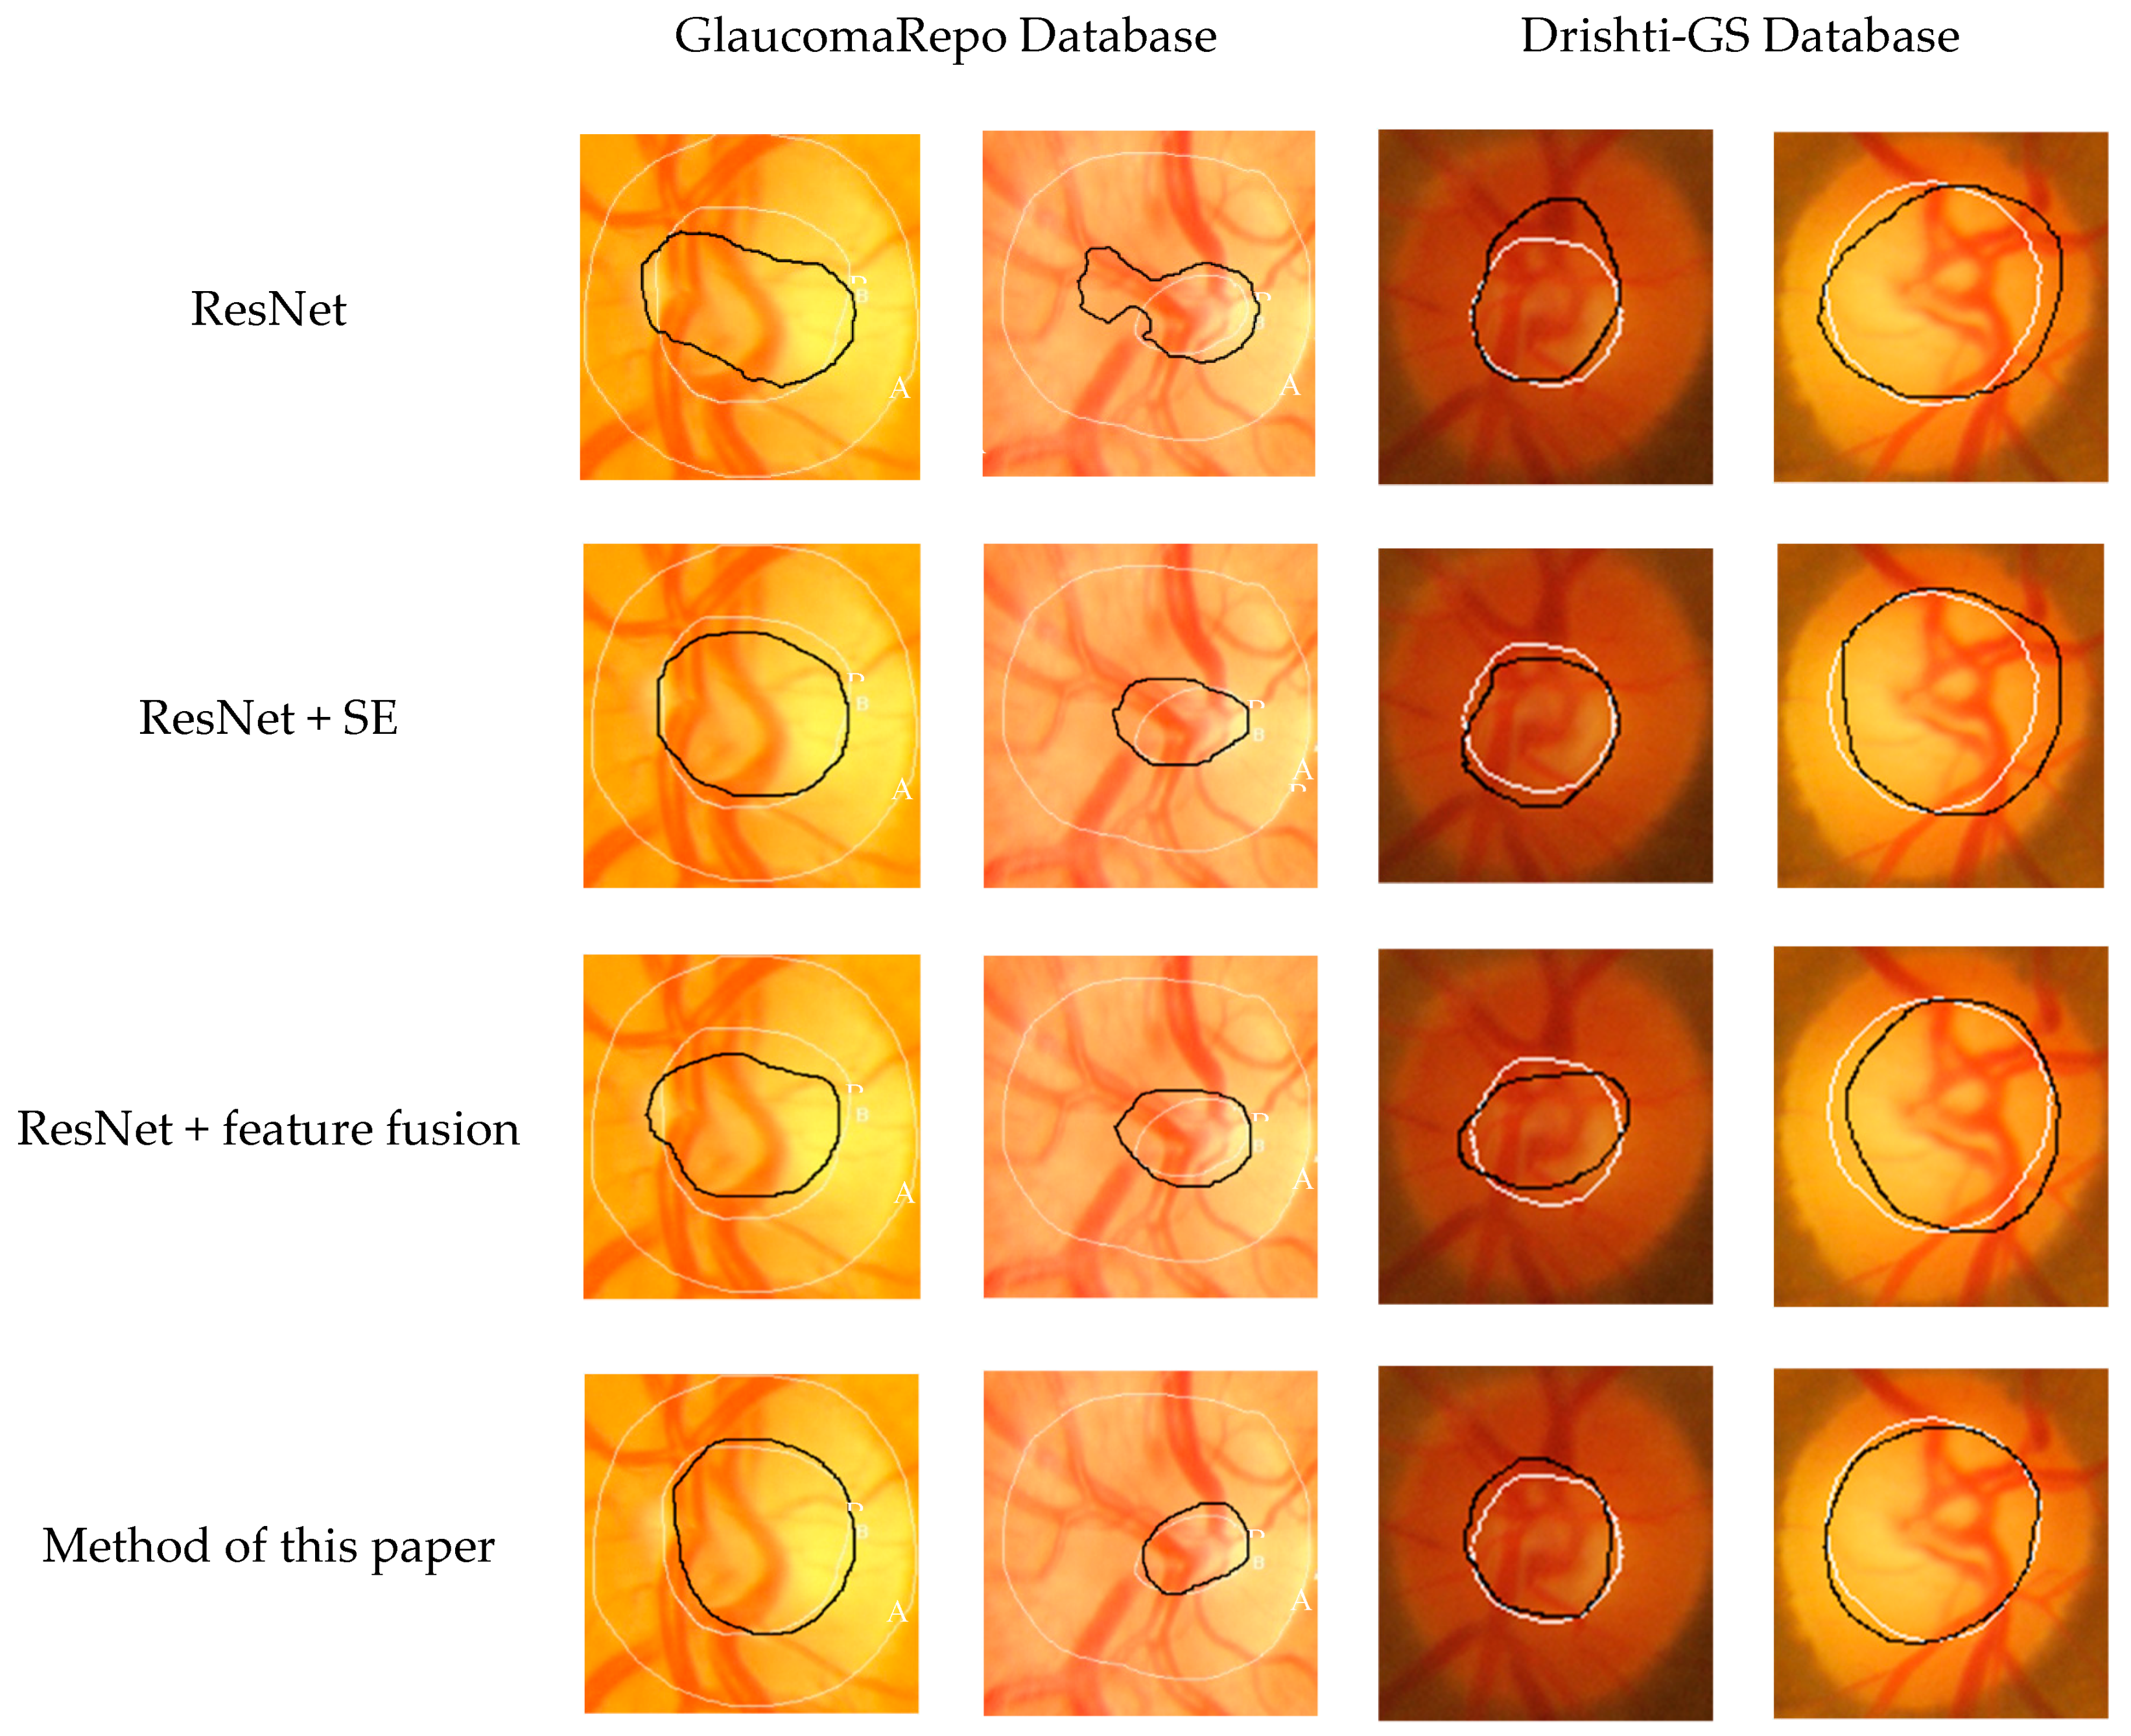
Figure 8 is a visual comparison of the Seg-ResNet network and the three network optic cup segments.
Figure 8 shows that the ResNet network segmentation fails for images with low contrast in the region where the cup lies and for images where the optic cup is obscured by a blood vessel; the segmentation effect of the ResNet network with channel weighting structure is improved. The channel weighting represents the dependence of the feature channels in the feature dimension, where the correlation of the feature channels is modeled using a learning method. The channel-weighted ResNet network segmentation result of the map edge of the optic cup is positioned at the blood vessel bending point. The ResNet network segmentation method uses a combination of high-level and low-level features. It is also significantly improved compared to the original ResNet network. This is because in the process of feature extraction in the network, the underlying network has detailed features, while the deep network has abstract features; therefore, the combination of features from the underlying and deep networks makes network learning more meaningful. Compared with the ordinary ResNet, the channel weighting re-adjusted the channel features, enhanced the useful features, obtained a larger receptive field from the upper layer network, and combined the underlying features with the deep features to make the features more prominent. The Seg-ResNet, which is proposed in this paper, combined the advantages of both, not only considering a wider receptive field, but also considering the degree of dependence of the feature dimension modeling feature channel, enhancing the robustness of the method, which improved the accuracy of the segmentation result. The edge of the optic cup was more accurately fitted to the blood vessel bending point, which was significantly better than the three segmentation networks. These methods had no significant difference when using the GlaucomaRepo database or the Drishti-GS database. Therefore, we verify that our learning based optic cup segmentation method improves robustness.
Table 1 and
Table 2 compare the segmentation results of the Seg-ResNet network, ResNet network, ResNet+SE network, and ResNet+ feature fusion network by testing each method on two different databases. By comparison, the Seg-ResNet network design had the highest measure of performance.
3.5.2. Comparison of the Effect of FCM Clustering on the Segmentation of the Optic Cup
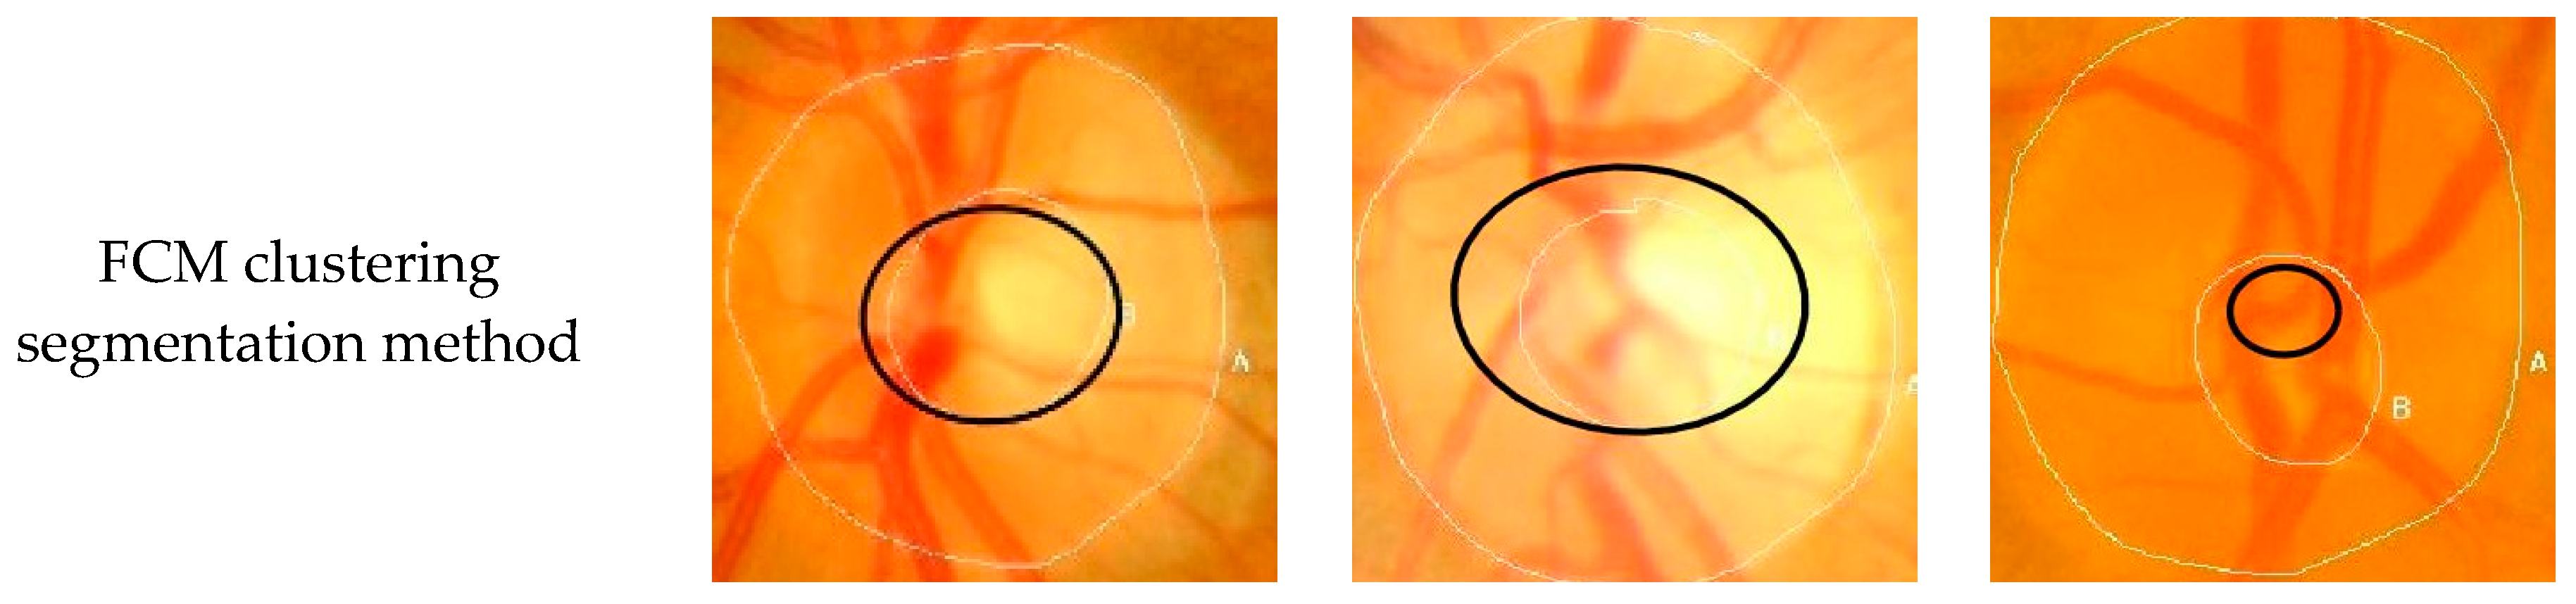
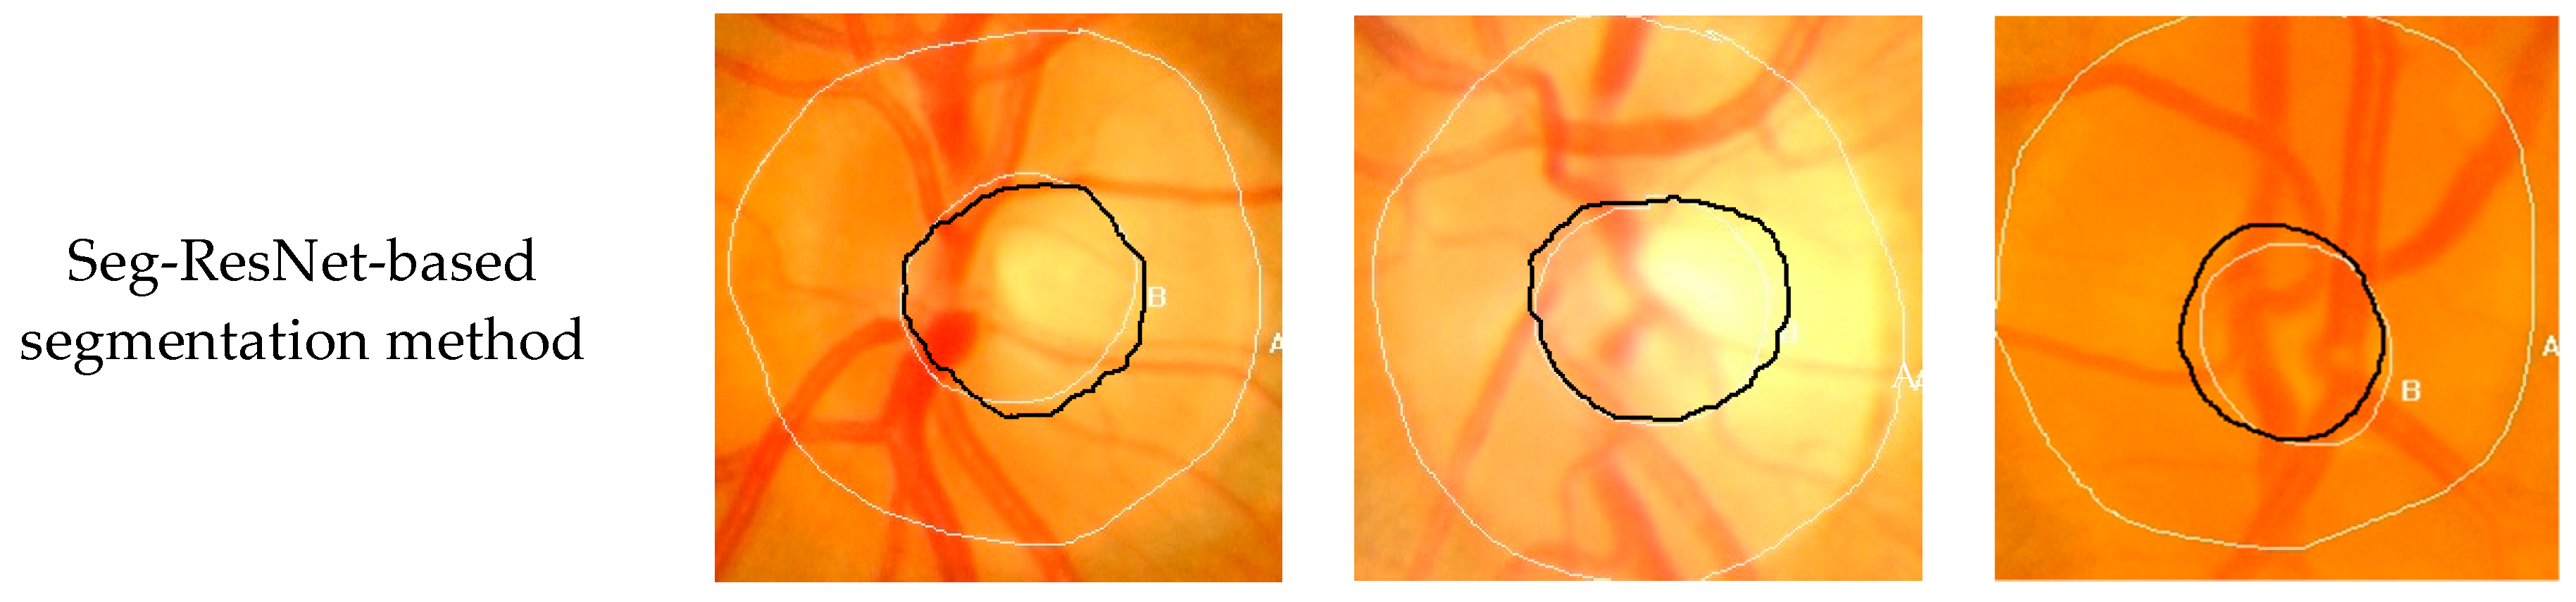
To verify the performance of the Seg-ResNet network-based optic cup segmentation method proposed in this paper, we compared our method to the FCM cluster segmentation method. The segmentation results are shown in
Figure 9 and
Figure 10.
The optic cup segmentation method, based on FCM clustering, fully considered the brightness information of the image and the characteristics of the blood vessel bending point falling on the edge of the optic cup. However, due to the complicated fundus image, the extraction of the optic cup needed to undergo a series of preprocessing steps, including disc segmentation, region of interest extraction, blood vessel extraction, blood vessel bending point detection, optic cup rough segmentation, and ellipse fitting. Each step was sequential, i.e., each operation was based on the previous operation. If the result of an operation was inaccurate, then it would have had a greater impact on the final result. The division of the optic cup by conventional methods would inevitably be compounded by each pre-processing operation.
Figure 9 and
Figure 10 show that the conventional method could not accurately divide the optic cup in cases of low cup plate contrast and severe vascular occlusion, while the segmentation effect on the Drishti-GS data set was poor. The results were likely affected by the fact that the GlaucomaRepo data set and the Drishti-GS data set were taken from different fundus cameras, thus the imaging quality varied greatly. The overall gray value of the Drishti-GS data set was low, the vascular occlusion was severe in most images, the method used for filling the neighborhood pixels was not obvious, the FCM optic cup clustering was affected by vascular interference, and the segmentation effect was below average. Traditional image processing techniques are difficult to change between these two data sets, so traditional image processing technology is less robust than the optic cup segmentation method. The depth-based learning method based on deep learning methods used a large number of data sets, where each image was taken from different cameras in different shooting environments. Thus, the feature extraction method had strong adaptability and also showed excellent segmentation effects in different test sets.
Figure 9 and
Figure 10 show optic cup segmentation using a depth-based learning method, which not only learned the brightness characteristics of the optic cup, but also learned the characteristics of blood vessel bending at the edge of the optic cup. This was seen in both the GlaucomaRepo data set and the Drishti-GS data set; this information could be used to accurately divide the optic cup.
Table 3 and
Table 4 compare the segmentation performance of the deep learning methods using two different traditional databases. Overall, optic cup segmentation based on depth-based learning methods had higher precision and robustness over the traditional image processing technology.
3.5.3. Contrast with Other Reference Segmentation Methods
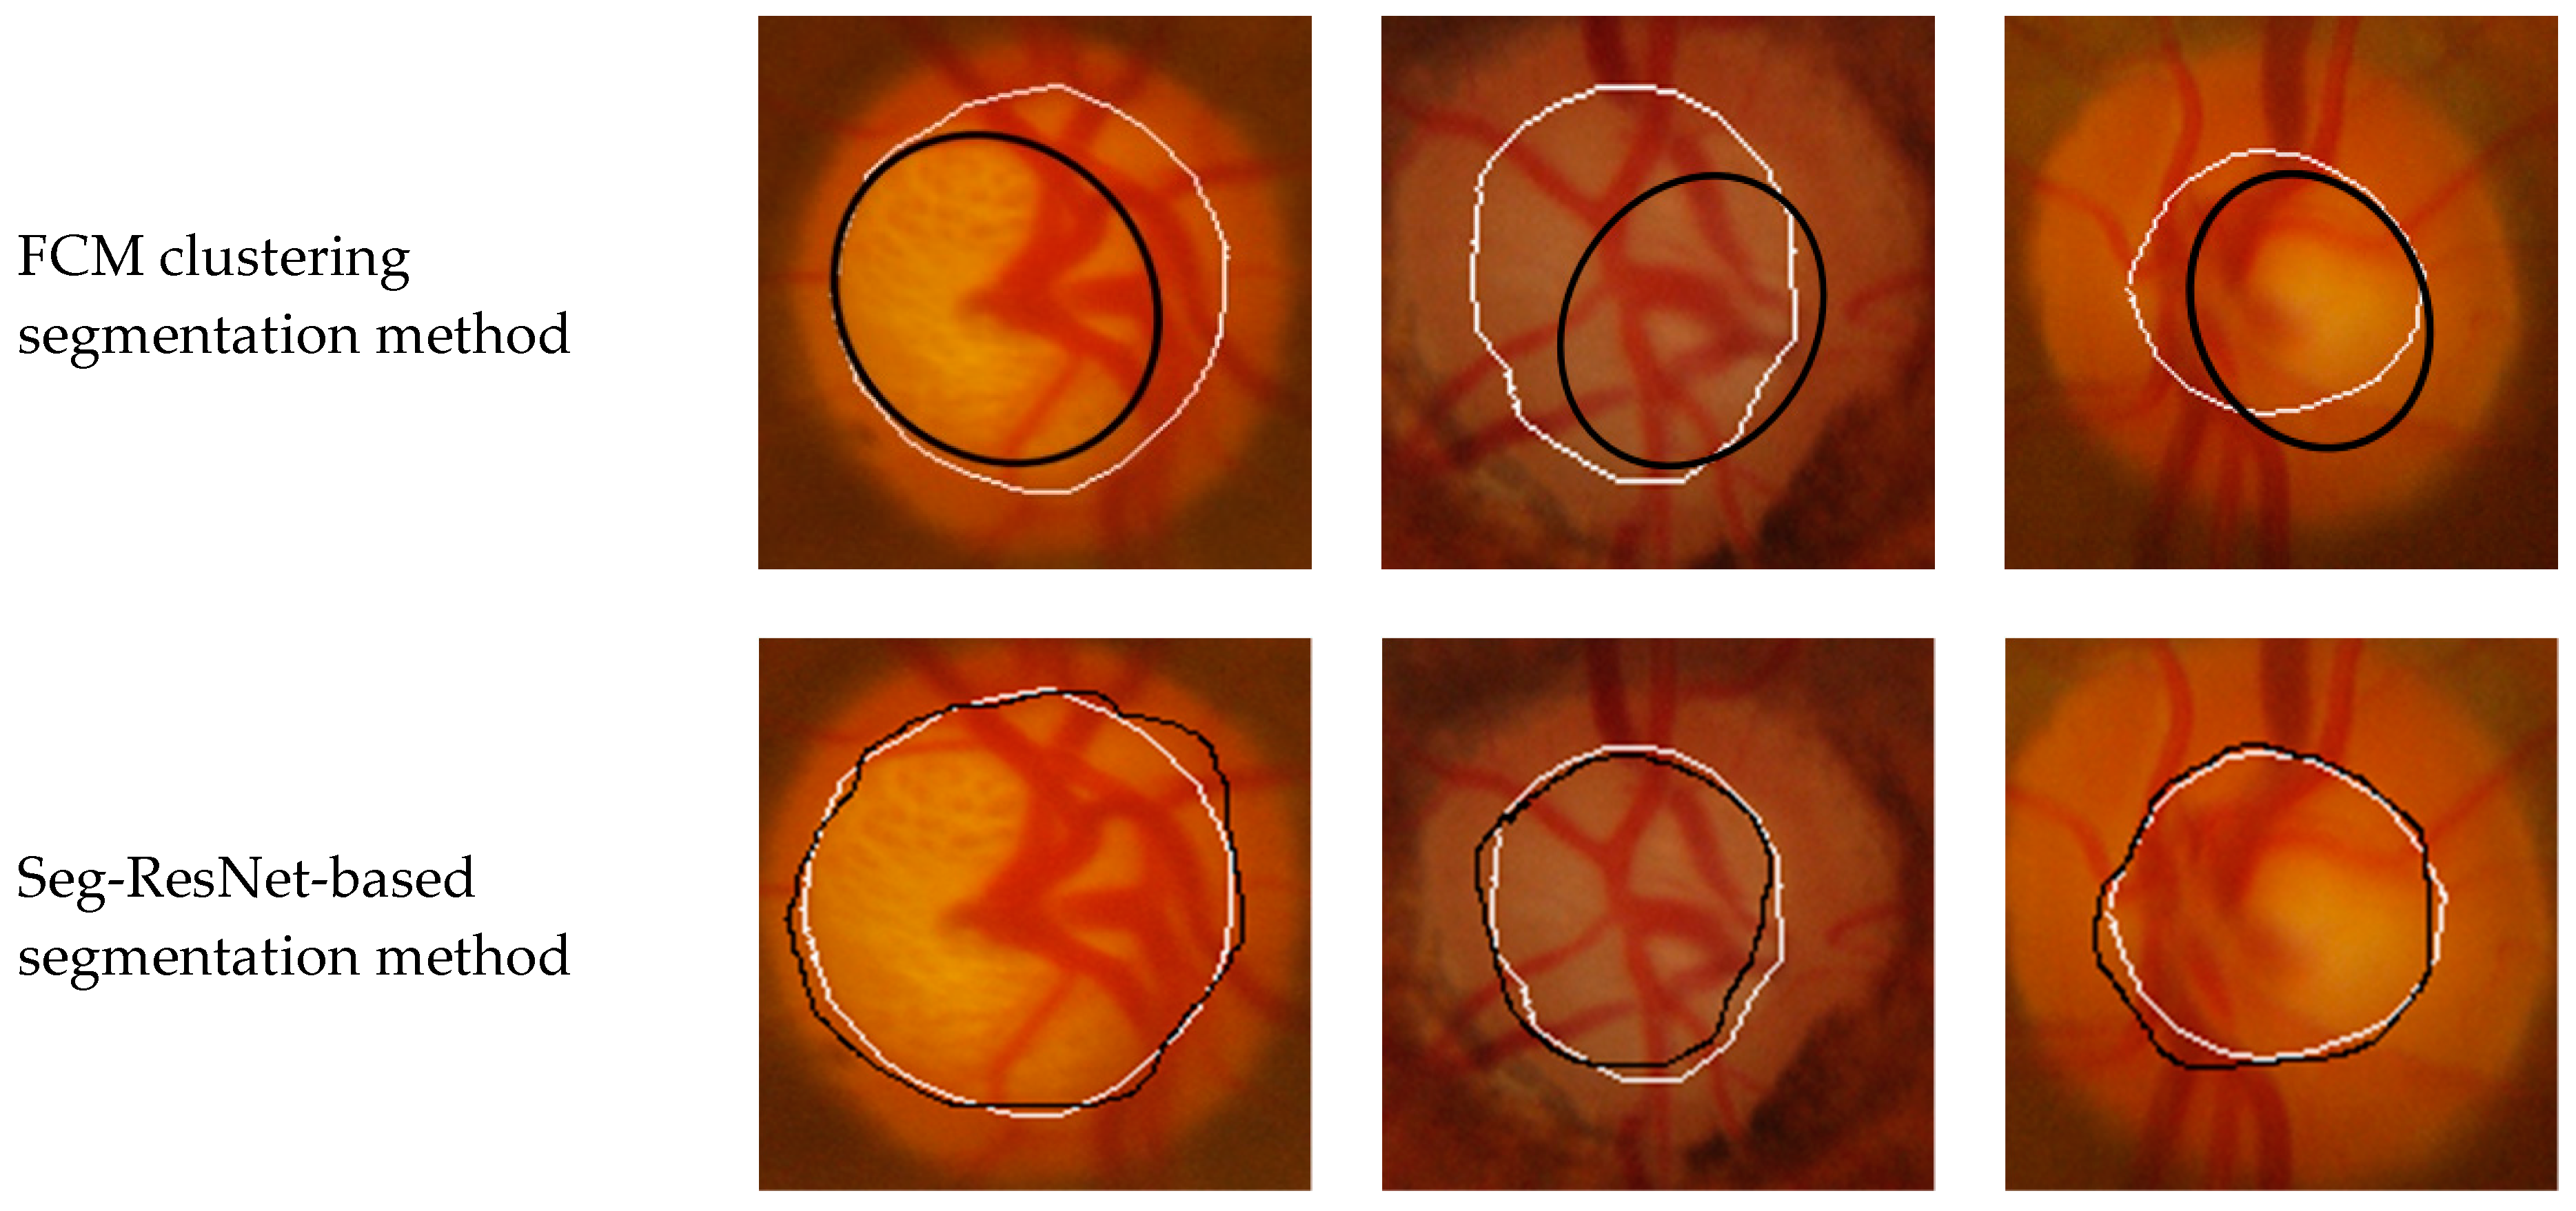
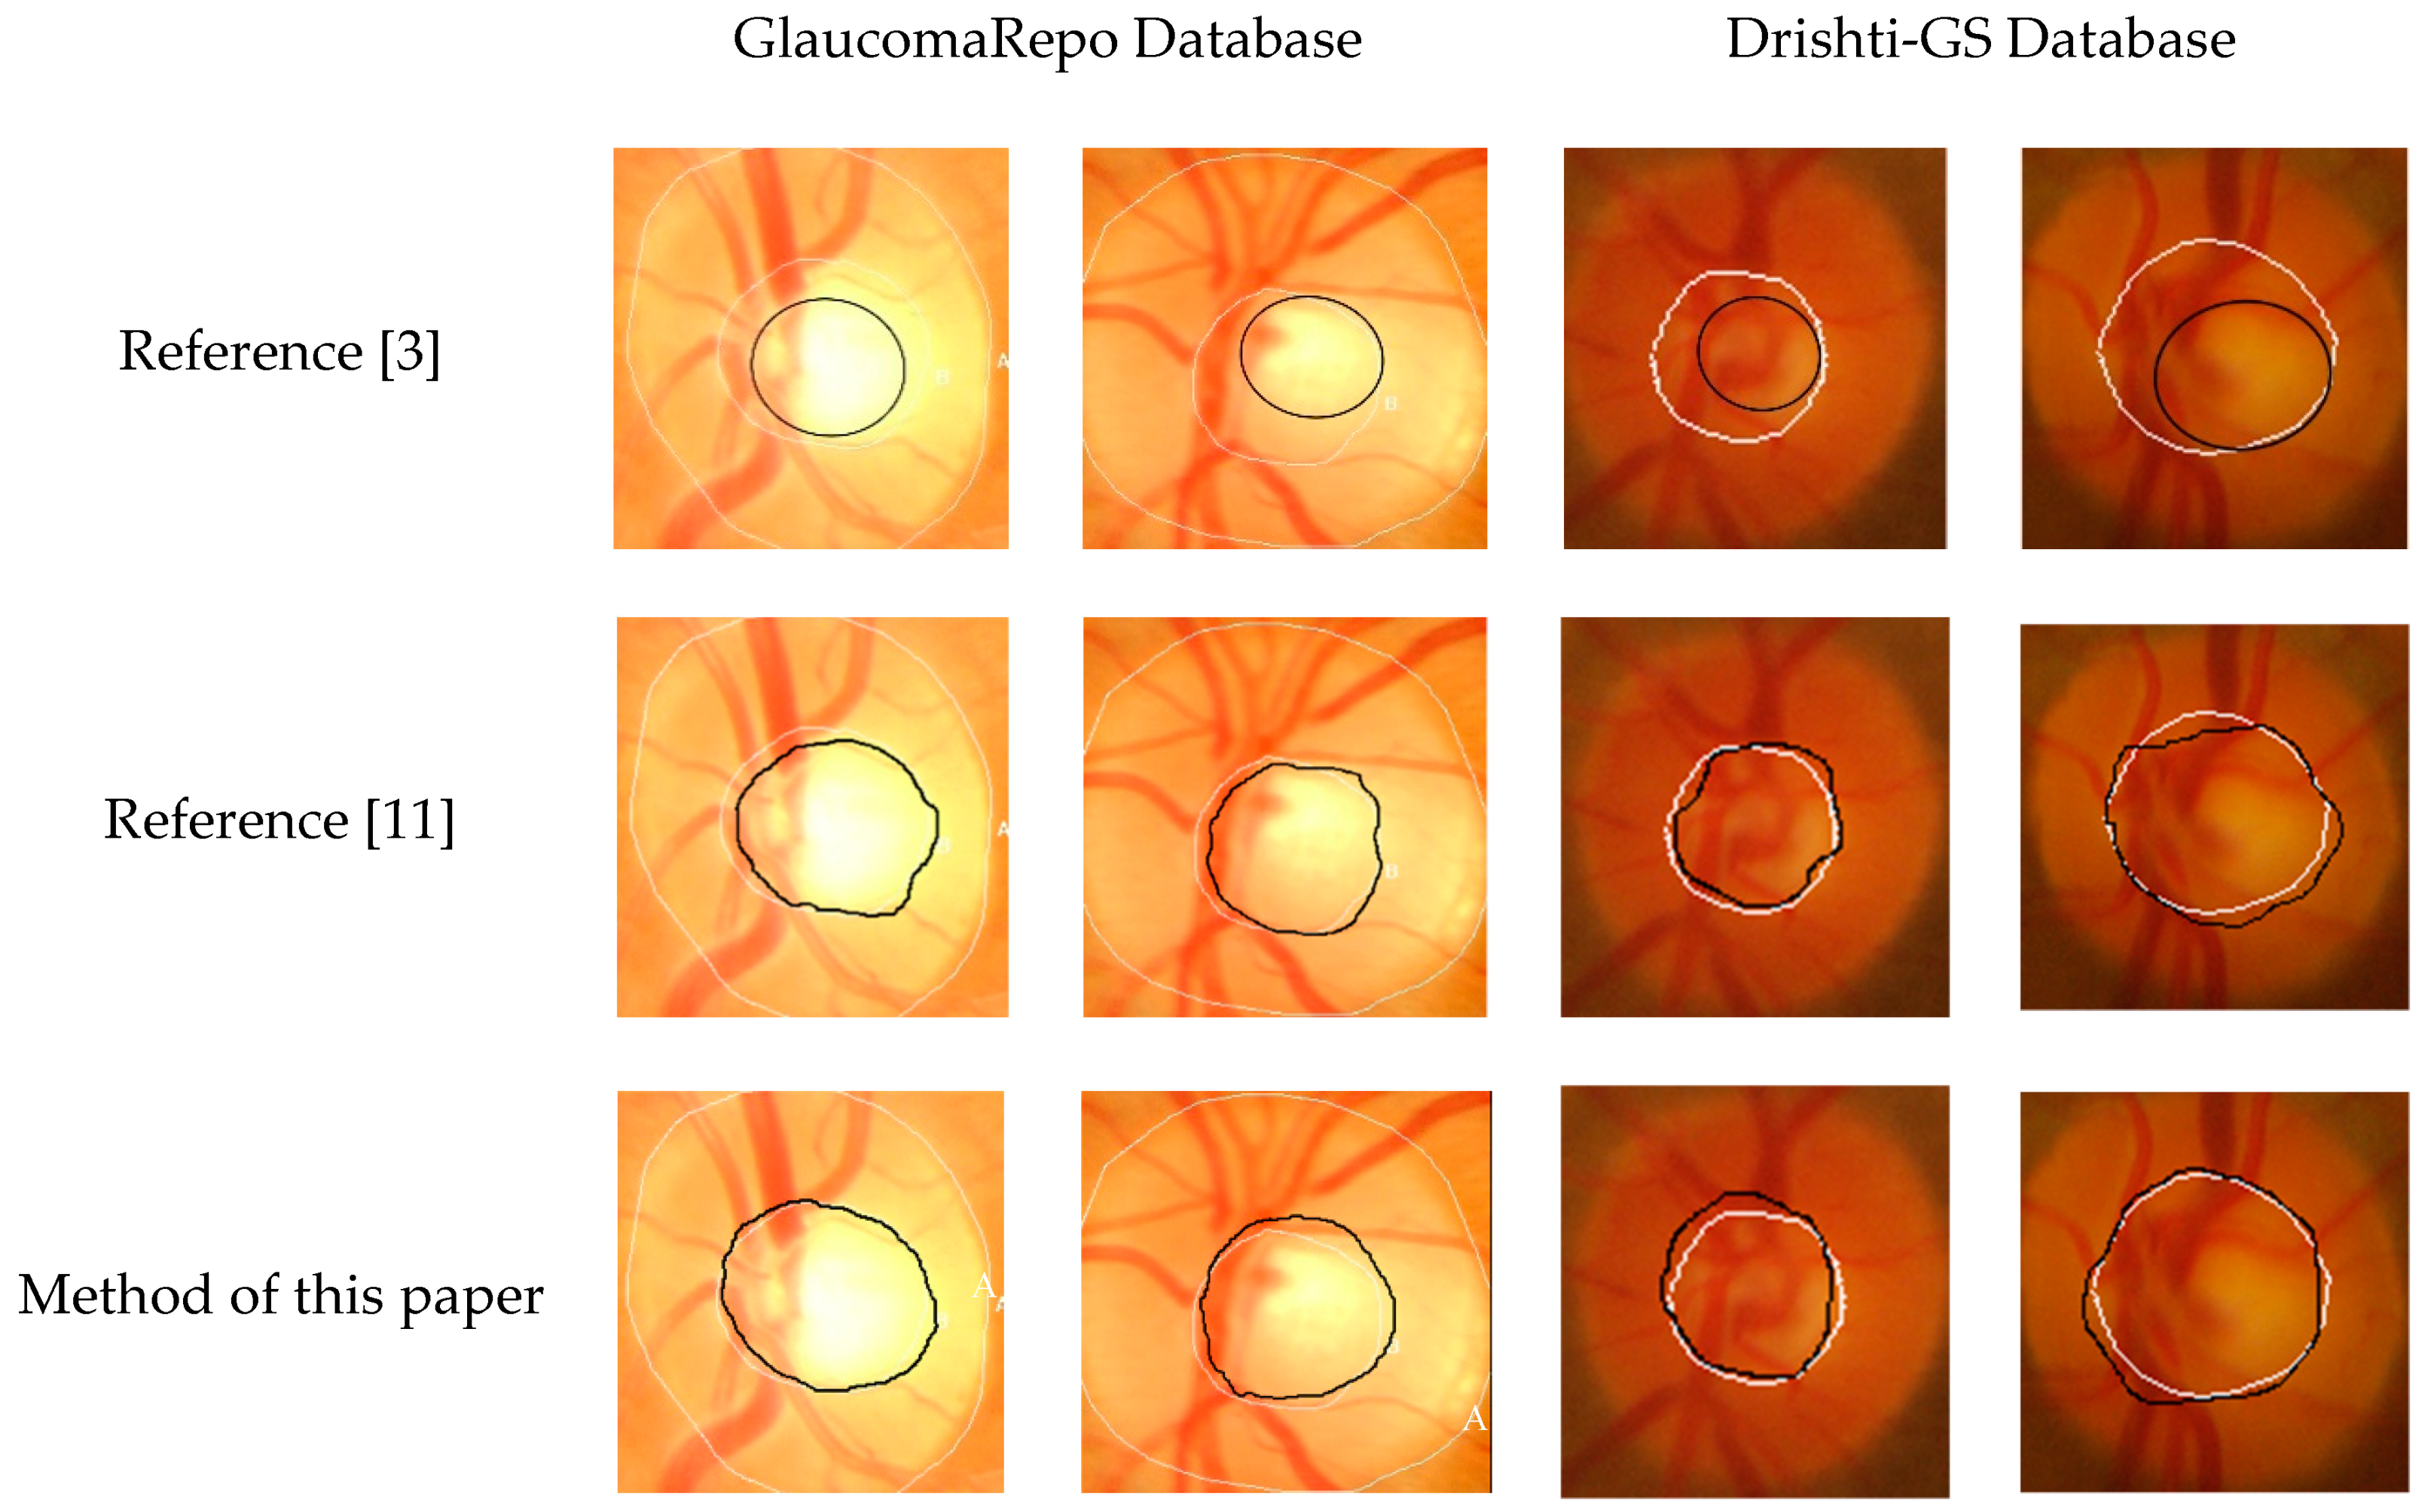
To verify the effectiveness and robustness of the proposed method, the Seg-ResNet network-based optic cup segmentation method was compared to other reference methods. The segmentation effect is shown in
Figure 11.
Reference [
3] is a method of segmentation based on traditional image processing technology. According to the brightness information of the optic cup, the Chan and VeseCV model was used to segment the optic cup. The model used global information in the image to iteratively evolve the initial contour to the edge of the optic cup and then perform ellipse fitting.
Figure 11 shows that the method had a large gap with expert labeling. This is because the feature design of this method only considered brightness information of the optic cup, ignoring the characteristics of the blood vessel passing through the edge of the optic cup, and the overall segmentation result was small. This method was based on the Digital Retinal Image for Vessel ExtractionDRIVE data set [
15] designed by the optic cup segmentation algorithm. After experimental comparison, the segmentation results were poor for the GlaucomaRepo database and the Drishti-GS database and the robustness was not high. Reference [
11] used the U-Net network to obtain the final segmentation result of the optic cup vis feature extraction and an upsampling operation, which was consistent with an expertly labeled optic cup, but the network did not consider the relationship between feature channels and ignored the underlying network. Pixel position information extracted by the feature extraction step was susceptible to image noise and the segmentation effect was poor on the edge information of the optic cup. The Seg-ResNet network proposed in this paper combined high-level output with underlying network features; this not only retained the semantic information of the image, but also fully considered the positional relationship between the pixels. Compared with the reference [
11], the segmentation result edge of the network was also more precise. Based on the comprehensive analysis, the method in this paper showed good segmentation performance on the GlaucomaRepo database and the Drishti-GS database. It had higher superiority, high precision, good robustness, and smoother edges of the optic cup.
Table 5 and
Table 6 compare the two methods of the database with the evaluation criteria of the optic cup segmentation performance, as in [
3,
11].
4. Discussion
This work proposes a new deep learning network structure, Seg-ResNet, which uses the ResNet basic network as the main body, introduces channel weighting to automatically adjust the dependence of feature channels in learning mode, and re-calibrates feature channel weights. The weighted low-level features are connected with the high-level features to improve network performance and improve segmentation accuracy. Compared with the ordinary ResNet, the channel weighting re-adjusts the overall channel features, enhances the useful features, and ensures the underlying network structure has a greater receptive field. The combination of the low-level and high-level features not only uses semantic features of high-level extraction, but also pixel-based spatial position information extracted by the lower layer to further highlight the features. The Seg-ResNet, proposed in this paper, combines the advantages of a wider receptive field, but also considers the degree of dependence of the feature dimension model feature channel, enhancing the generalization of the network, and the segmentation result is more precise, allowing the edge of the optic cup to be more accurately fitted to the point of curvature of the blood vessel. This method is superior to other methods, achieving accurate segmentation of the optic cup and algorithmic robustness.
Author Contributions
Z.X. and X.Z. wrote the paper; J.W., F.Z., L.G. and Y.L. gave guidance in experiments and data analysis.
Funding
This work was supported by Tianjin Science and Technology Major Projects and Engineering under grant No. 17ZXHLSY00040, No. 17ZXSCSY00060 and No. 17ZXSCSY00090, and the Program for Innovative Research Team in University of Tianjin (No. TD13-5034).
Conflicts of Interest
The authors declare no conflict of interest.
References
- Li, F.; Xie, L. Chinese Ophthalmology; People’s Medical Publishing House: Beijing, China, 2014. [Google Scholar]
- Dutta, M.K.; Mourya, A.K.; Singh, A.; Parthasarathi, M.; Burget, R.; Riha, K. Glaucoma Detection by Segmenting the Super Pixels from Fundus Colour Retinal Images. In Proceedings of the 2014 International Conference on Medical Imaging, M-Health and Emerging Communication Systems, Greater Noida, India, 7–8 November 2014; pp. 86–90. [Google Scholar]
- Zhao, Q. Research on the Recognition Algorithm of Cup in Color Fundus Image; Beijing University of Technology: Beijing, China, 2014. [Google Scholar]
- Mittapalli, P.S.; Kande, G.B. Segmentation of Optic Disk and Optic Cup from Digital Fundus Images for the Assessment of Glaucoma. Biomed. Signal Process. Control 2016, 24, 34–46. [Google Scholar] [CrossRef]
- Cheng, J.; Liu, J.; Xu, Y.; Yin, F.S.; Wong, D.W.K.; Tan, N.M.; Tao, D.C.; Cheng, C.-Y.; Aung, T.; Wong, T.Y. Superpixel Classification Based Optic Disc and Optic Cup Segmentation for Glaucoma Screening. IEEE Trans. Med. Imaging 2013, 32, 1019–1032. [Google Scholar] [CrossRef] [PubMed]
- Alghmdi, H.; Tang, H.L.; Hansen, M.; O’Shea, A.; Al Turk, L.; Peto, T. Measurement of Optical Cup-to-Disc Ratio in Fundus Images for Glaucoma Screening. In Proceedings of the 2015 IEEE International Workshop on Computational Intelligence for Multimedia Understanding, Prague, Czech Republic, 29–30 October 2015; pp. 1–5. [Google Scholar]
- Wong, D.W.K.; Liu, J.; Tan, N.M.; O’Shea, A.; Al Turk, L.; Peto, T. Automatic Detection of the Optic Cup using Vessel Kinking in Digital Retinal Fundus Images. In Proceedings of the 2012 9th IEEE International Symposium on Biomedical Imaging, Barcelona, Spain, 2–5 May 2012; pp. 1647–1650. [Google Scholar]
- Fondon, I.; Valverde, J.F.; Sarmiento, A.; Abbas, Q.; Jiménez, S.; Alemany, P. Automatic Optic Cup Segmentation Algorithm for Retinal Fundus Images Based on Random Forest Classifier. In Proceedings of the IEEE International Conference on Computer as a Tool, Salamanca, Spain, 8–11 September 2015; pp. 1–6. [Google Scholar]
- Zillya, J.; Buhmannb, J.M.; Mahapatra, D. Glaucoma Detection using Entropy Sampling and Ensemble Learning for Automatic Optic Cup and Disc Segmentation. Comput. Med. Imaging Graph. 2017, 55, 28–41. [Google Scholar] [CrossRef] [PubMed]
- Bander, B.A.; Williams, B.M.; Nuaimy, W.A.; Al-Taee, M.; Pratt, H.; Zheng, Y. Dense Fully Convolutional Segmentation of the Optic Disc and Cup in Colour Fundus for Glaucoma Diagnosis. Symmetry 2018, 10, 87. [Google Scholar] [CrossRef]
- Sevastopolsky, A. Optic Disc and Cup Segmentation Methods for Glaucoma Detection with Modification of U-Net Convolutional Neural Network. Pattern Recognit. Image Anal. 2017, 27, 618–624. [Google Scholar] [CrossRef]
- Sevastopolsky, A.; Drapak, S.; Kiselev, K.; Snyder, B.M.; Keenan, J.D.; Georgievskaya, A. Stack-U-Net: Refinement Network for Image Segmentation on the Example of Optic Disc and Cup. Pattern Recognit. Image Anal. 2018, 7, 1–9. [Google Scholar]
- Fu, H.; Cheng, J.; Xu, Y.; Wong, D.W.K.; Liu, J.; Cao, X. Joint Optic Disc and Cup Segmentation Based on Multi-label Deep Network and Polar Transformation. IEEE Trans. Med. Imaging 2018, 37, 1597–1605. [Google Scholar] [CrossRef] [PubMed]
- Sivaswamy, J.; Krishnadas, S.R.; Joshi, G.D.; Jain, M.; Tabish, A.U.S. Drishti-GS: Retinal Image Dataset for Optic Nerve Head (ONH) Segmentation. In Proceedings of the 2014 IEEE International Symposium on Biomedical Imaging, Beijing, China, 29 April–2 May 2014; pp. 1–7. [Google Scholar]
- Staal, J.; Abramoff, M.D.; Niemeijer, M.; Viergever, M.A.; Ginneken, V.B. Ridge-based Vessel Segmentation in Color Images of the Retina. IEEE Trans. Med. Imaging 2004, 23, 501–509. [Google Scholar] [CrossRef] [PubMed]
Figure 1.
Segmentation-ResNet Seg-ResNet network structure.
Figure 1.
Segmentation-ResNet Seg-ResNet network structure.
Figure 2.
Optimized residual structure diagram.
Figure 2.
Optimized residual structure diagram.
Figure 3.
Schematic diagram of the squeeze-and-excitation (SE) module.
Figure 3.
Schematic diagram of the squeeze-and-excitation (SE) module.
Figure 4.
High-level features and underlying features.
Figure 4.
High-level features and underlying features.
Figure 5.
Network loss value.
Figure 5.
Network loss value.
Figure 6.
GlaucomaRepo database optic cup segmentation results. A white line represents when the optic cup is labeled by an expert and a black line represents when the optic cup is labeled by our segmentation technique.
Figure 6.
GlaucomaRepo database optic cup segmentation results. A white line represents when the optic cup is labeled by an expert and a black line represents when the optic cup is labeled by our segmentation technique.
Figure 7.
Drishti-GS database optic cup segmentation results. A white line represents the expertly labeled optic cup and a black line represents the segmentation results.
Figure 7.
Drishti-GS database optic cup segmentation results. A white line represents the expertly labeled optic cup and a black line represents the segmentation results.
Figure 8.
Comparison of Seg-ResNet and ResNet, ResNet + SE, and ResNet + feature fusion network segmentation methods.
Figure 8.
Comparison of Seg-ResNet and ResNet, ResNet + SE, and ResNet + feature fusion network segmentation methods.
Figure 9.
GlaucomaRepo database segmentation results comparison using the Seg-ResNet-based method and the FCM clustering optic cup segmentation method.
Figure 9.
GlaucomaRepo database segmentation results comparison using the Seg-ResNet-based method and the FCM clustering optic cup segmentation method.
Figure 10.
Comparison of segmentation results of Drishti-GS database based on the Seg-ResNet method and the FCM clustering optic cup segmentation method.
Figure 10.
Comparison of segmentation results of Drishti-GS database based on the Seg-ResNet method and the FCM clustering optic cup segmentation method.
Figure 11.
Comparison of the method in this paper with other reference segmentation methods.
Figure 11.
Comparison of the method in this paper with other reference segmentation methods.
Table 1.
Comparison of evaluation indexes of different network optic cup segmentation results in the GlaucomaRepo database.
Table 1.
Comparison of evaluation indexes of different network optic cup segmentation results in the GlaucomaRepo database.
| Method | Accuracy (%) | Sensitivity (%) | Specificity (%) |
|---|
| ResNet | 65.07 | 68.26 | 75.01 |
| ResNet + SE | 91.32 | 83.04 | 95.34 |
| ResNet + feature fusion | 87.37 | 85.46 | 96.65 |
| Method of this paper | 96.04 | 87.95 | 97.80 |
Table 2.
Comparison of evaluation indexes of different network optic cup segmentation results in the Drishti-GS database.
Table 2.
Comparison of evaluation indexes of different network optic cup segmentation results in the Drishti-GS database.
| Method | Accuracy (%) | Sensitivity (%) | Specificity (%) |
|---|
| ResNet | 72.23 | 81.64 | 75.52 |
| ResNet + SE | 92.26 | 85.45 | 94.53 |
| ResNet + feature fusion | 85.35 | 83.79 | 95.54 |
| Method of this paper | 97.12 | 85.98 | 97.58 |
Table 3.
Comparison of evaluation methods for different methods of optic cup segmentation in the GlaucomaRepo database.
Table 3.
Comparison of evaluation methods for different methods of optic cup segmentation in the GlaucomaRepo database.
| Method | Accuracy (%) | Sensitivity (%) | Specificity (%) |
|---|
| FCM clustering method | 93.15 | 85.28 | 96.01 |
| Seg-ResNet method | 96.04 | 87.95 | 97.80 |
Table 4.
Comparison of evaluation methods for different methods of optic cup segmentation using the Drishti-GS database.
Table 4.
Comparison of evaluation methods for different methods of optic cup segmentation using the Drishti-GS database.
| Method | Accuracy (%) | Sensitivity (%) | Specificity (%) |
|---|
| FCM clustering method | 67.13 | 80.68 | 91.53 |
| Seg-ResNet method | 97.12 | 85.98 | 97.58 |
Table 5.
Comparison of evaluation indexes of different optic cups results using the GlaucomaRepo database.
Table 5.
Comparison of evaluation indexes of different optic cups results using the GlaucomaRepo database.
| Method | Accuracy (%) | Sensitivity (%) | Specificity (%) |
|---|
| Reference [3] | 68.15 | 64.36 | 98.01 |
| Reference [11] | 95.04 | 89.84 | 96.25 |
| Method of this paper | 96.04 | 87.95 | 97.80 |
Table 6.
Comparison of evaluation indexes of different optic cups results using the Drishti-GS database.
Table 6.
Comparison of evaluation indexes of different optic cups results using the Drishti-GS database.
| Method | Accuracy (%) | Sensitivity (%) | Specificity (%) |
|---|
| Reference [3] | 67.13 | 80.68 | 91.53 |
| Reference [11] | 93.53 | 86.23 | 95.84 |
| Method of This Paper | 97.12 | 85.98 | 97.58 |
© 2019 by the authors. Licensee MDPI, Basel, Switzerland. This article is an open access article distributed under the terms and conditions of the Creative Commons Attribution (CC BY) license (http://creativecommons.org/licenses/by/4.0/).


