Applying Event-Related Potentials to Measure Perceptual Experience toward the Navigation Interface of a Mobile Game for Improving the Design

Abstract
:1. Introduction
2. Methods
2.1. Construction of the Perceptual Experience Scale
2.1.1. Stimuli
2.1.2. Indexes of Perceptual Experience
2.1.3. Questionnaire Design
2.2. ERP Experiment
2.2.1. Stimuli and Apparatus
2.2.2. Subjects
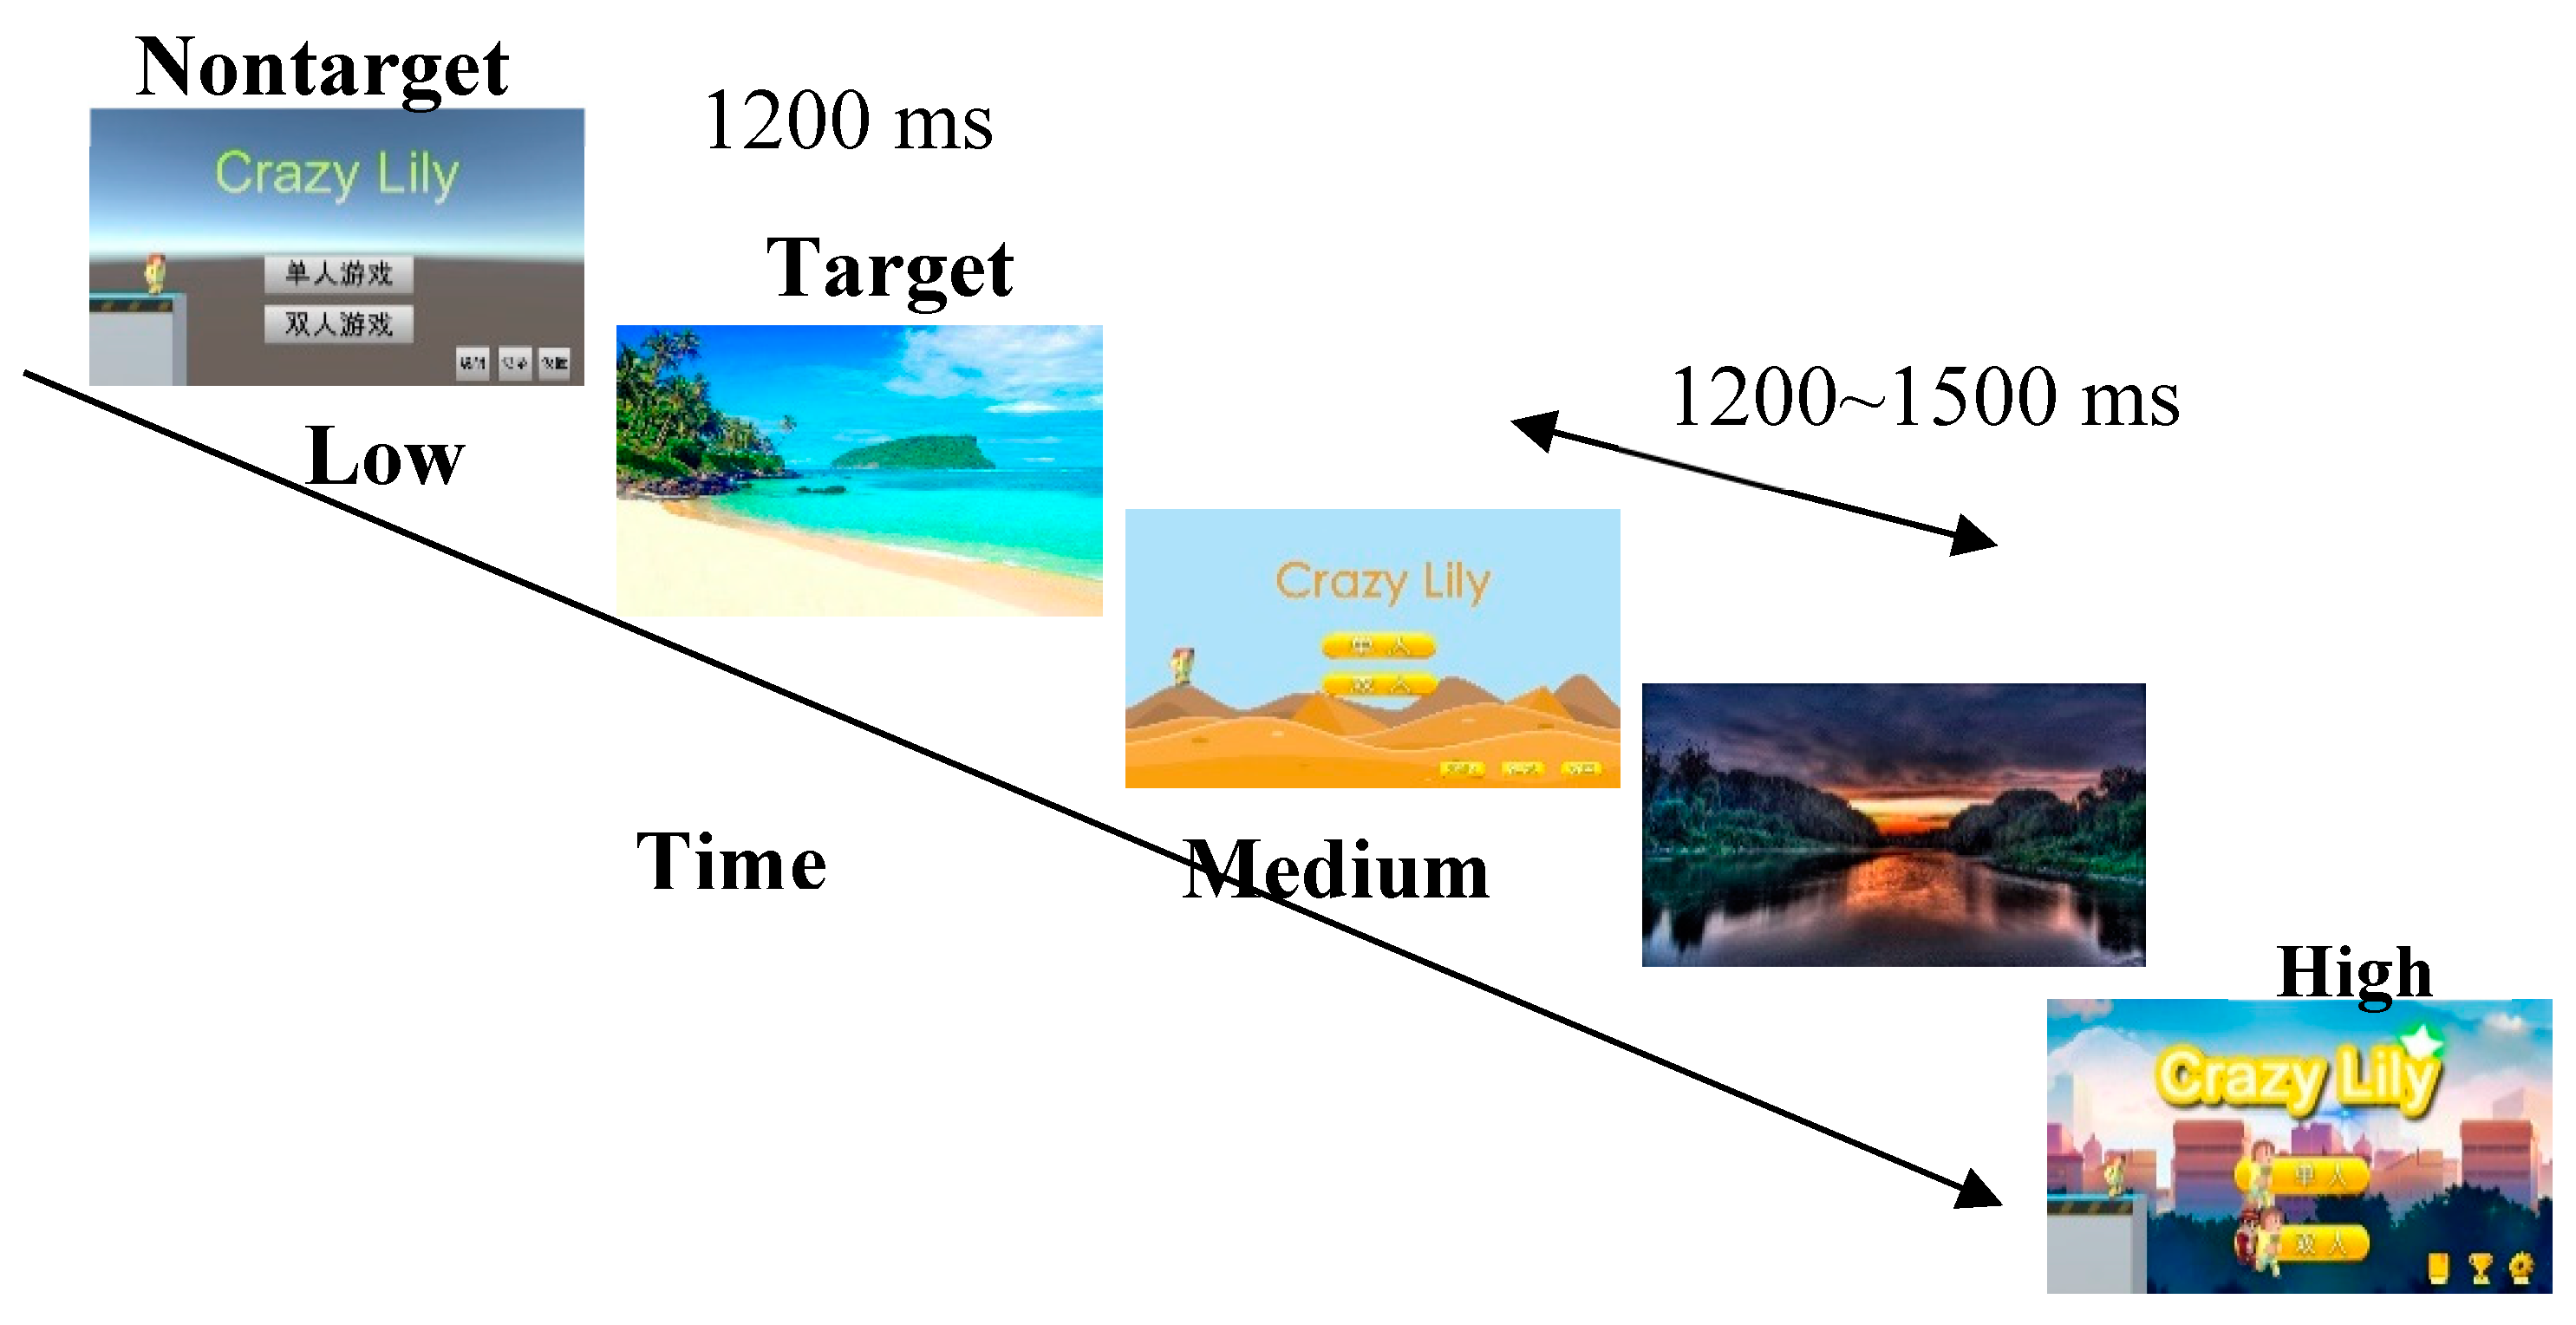
2.2.3. Procedure
2.2.4. Electrophysiological Recording and Analyses
2.3. Data Processing and EEG Component Selection
2.3.1. Data Processing
2.3.2. EEG Component Selection
3. Results
3.1. Results of the Subjective Evaluation
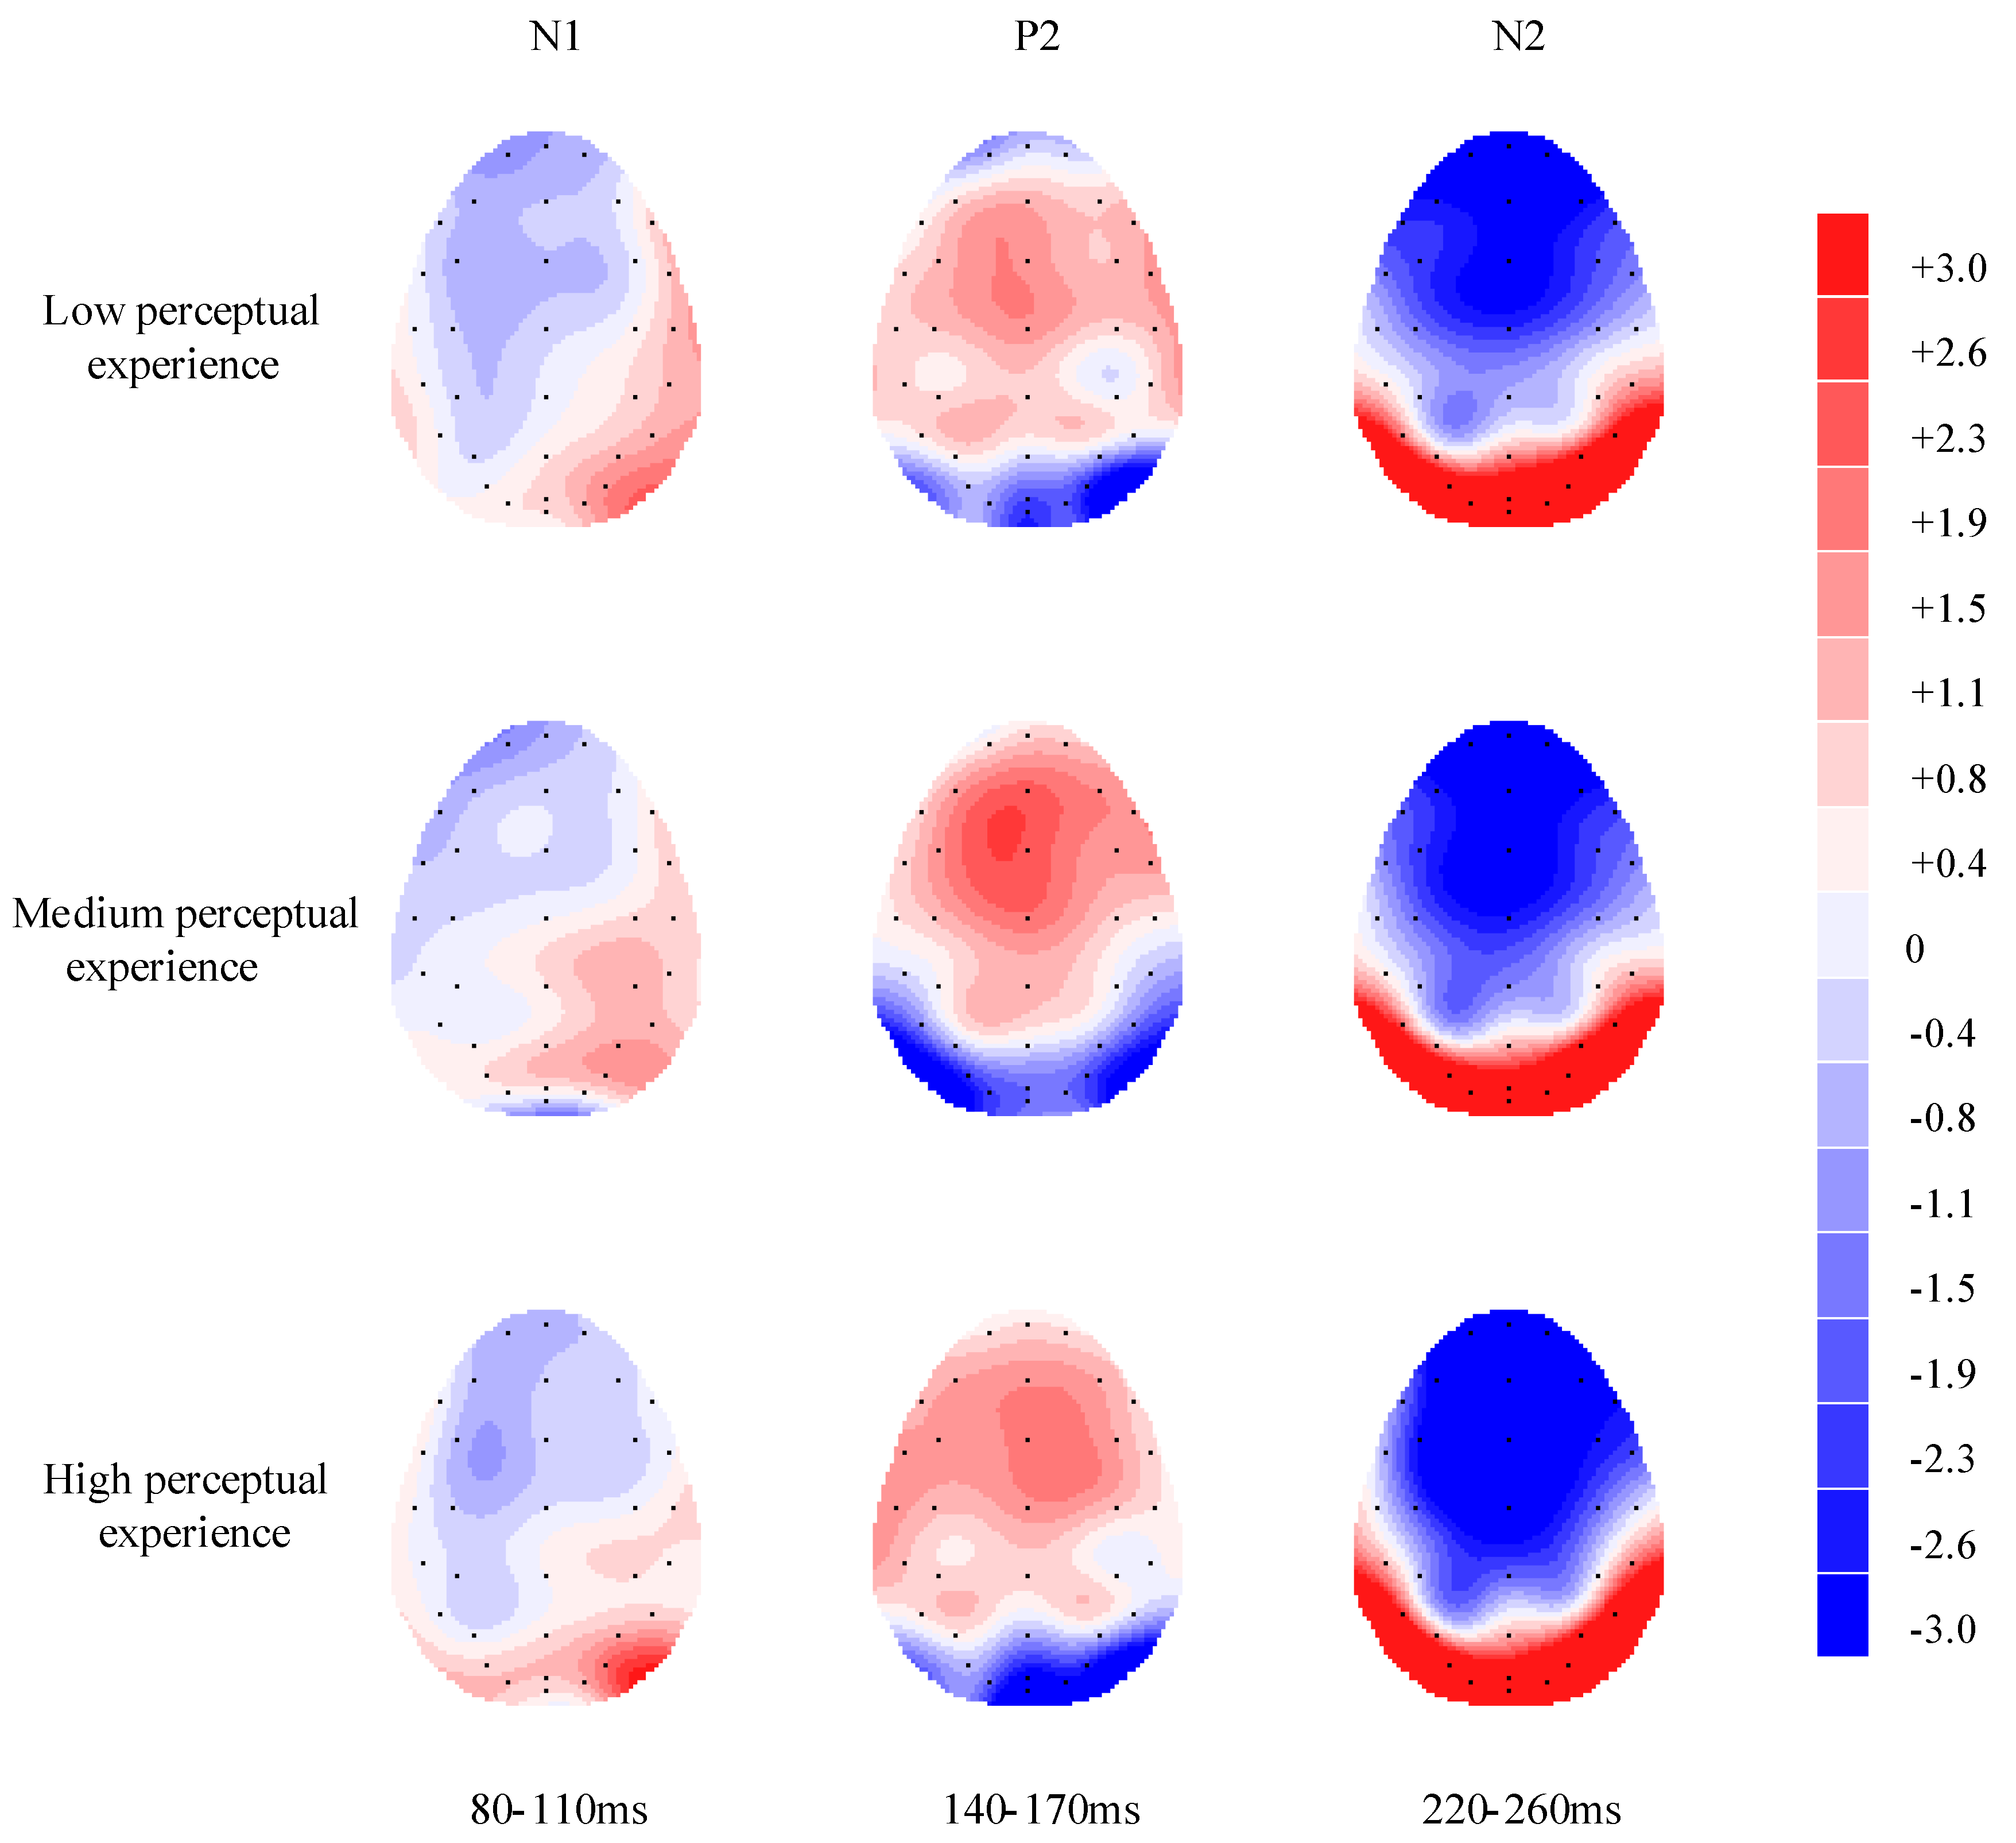
3.2. ERP Results
4. Discussion
5. Conclusions
Author Contributions
Funding
Conflicts of Interest
References
- Su, Y.S.; Chiang, W.L.; Lee, C.T.J.; Chang, H.C. The effect of flow experience on player loyalty in mobile game application. Comput. Hum. Behav. 2016, 63, 240–248. [Google Scholar] [CrossRef]
- Merikivi, J.; Tuunainen, V.; Nguyen, D. What makes continued mobile gaming enjoyable? Comput. Hum. Behav. 2017, 68, 411–421. [Google Scholar] [CrossRef]
- Yoon, H.; Park, S.H.; Lee, K.T.; Park, J.; Dey, A.; Kim, S. A case study on iteratively assessing and enhancing wearable user interface prototypes. Symmetry 2017, 9, 114. [Google Scholar] [CrossRef]
- Nagai, Y.; Georgiev, G.V. The role of impressions on users’ tactile interaction with product materials: An analysis of associative concept networks. Mater. Des. 2011, 32, 291–302. [Google Scholar] [CrossRef]
- Clement, J.; Kristensen, T.; Grønhaug, K. Understanding consumers’ in-store visual perception: The influence of package design features on visual attention. J. Retail. Consum. Serv. 2013, 20, 234–239. [Google Scholar] [CrossRef]
- Ho, C.H.; Lu, Y.N. Can pupil size be measured to assess design products. Int. J. Ind. Ergon. 2014, 44, 436–441. [Google Scholar] [CrossRef]
- Borsci, S.; Kuljis, J.; Barnett, J.; Pecchia, L. Beyond the User Preferences: Aligning the Prototype Design to the Users’ Expectations. Hum. Factors Ergon. Manuf. 2014, 26, 16–39. [Google Scholar] [CrossRef]
- Beatty, S.E.; Ferrell, M.E. Impulse buying: Modeling its precursors. J. Retail. 1998, 74, 169–191. [Google Scholar] [CrossRef]
- Jennett, C.; Cox, A.L.; Cairns, P.; Dhoparee, S.; Epps, A.; Tijs, T.; Walton, A. Measuring and defining the experience of immersion in games. Int. J. Hum. Comput. Stud. 2008, 66, 641–661. [Google Scholar] [CrossRef]
- Guo, F.; Cao, Y.; Ding, Y.; Liu, W.; Zhang, X. A multimodal measurement method of users’ emotional experiences shopping online. Hum. Factors Ergon. Manuf. Serv. Ind. 2015, 25, 585–598. [Google Scholar] [CrossRef]
- Hazlett, R.L. Measuring emotional valence during interactive experiences: Boys at video game play. In Proceedings of the SIGCHI Conference on Human Factors in Computing Systems, Montréal, QC, Canada, 22–27 April 2006; pp. 1023–1026. [Google Scholar]
- Chen, F.; Zhou, J.; Wang, Y.; Yu, K.; Arshad, S.Z.; Khawaji, A.; Conway, D. Robust Multimodal Cognitive Load Measurement; Springer International Publishing: Cham, Switzerland, 2016. [Google Scholar]
- Sim, H.; Lee, W.H.; Kim, J.Y. A Study on Emotion Classification utilizing Bio-Signal (PPG, GSR, RESP). Art Cult. Game Gr. Broadcasting Dig. Contents 2015, 87, 73–77. [Google Scholar]
- Isbister, K.; Schaffer, N. Game Usability: Advice from the Experts for Advancing the Player Experience; CRC Press: Boca Raton, FL, USA, 2008. [Google Scholar]
- Ding, Y.; Guo, F.; Zhang, X.; Qu, Q.; Liu, W. Using event related potentials to identify a user’s behavioural intention aroused by product form design. Appl. Ergon. 2016, 55, 117–123. [Google Scholar] [CrossRef]
- Ocklenburg, S.; Peterburs, J.; Mertzen, J.; Schmitz, J.; Güntürkün, O.; Grimshaw, G. Effects of emotional valence on hemispheric asymmetries in response inhibition. Symmetry 2017, 9, 145. [Google Scholar] [CrossRef]
- Cona, G.; Kliegel, M.; Bisiacchi, P. Differential effects of emotional cues on components of prospective memory: An ERP study. Front. Hum. Neurosci. 2015, 9, 1–15. [Google Scholar] [CrossRef]
- Ding, Y.; Guo, F.; Hu, M.; Cao, Y. Using event related potentials to investigate visual aesthetic perception of product appearance. Hum. Factors Ergon. Manuf. Serv. Ind. 2017, 27, 223–232. [Google Scholar] [CrossRef]
- Luck, S.J.; Woodman, G.F.; Vogel, E.K. Event-related potential studies of attention. Trends Cogn. Sci. 2000, 4, 432–440. [Google Scholar] [CrossRef]
- Cudo, A.; Francuz, P.; Augustynowicz, P.; Stróżak, P. The effects of arousal and approach motivated positive affect on cognitive control. An ERP study. Front. Hum. Neurosci. 2018, 12, 320. [Google Scholar] [CrossRef]
- Recio, G.; Conrad, M.; Hansen, L.B.; Jacobs, A.M. On pleasure and thrill: The interplay between arousal and valence during visual word recognition. Brain Lang. 2014, 134, 34–43. [Google Scholar] [CrossRef] [PubMed]
- Skadberg, Y.X.; Kimmel, J.R. Visitors’ flow experience while browsing a Web site: Its measurement, contributing factors and consequences. Comp. Hum. Behav. 2004, 20, 403–422. [Google Scholar] [CrossRef]
- Creusen, M.E.; Schoormans, J.P. The different roles of product appearance in consumer choice. J. Prod. Innov. Manag. 2005, 22, 63–81. [Google Scholar] [CrossRef]
- Aggarwal, A.; Niezen, G.; Thimbleby, H. User experience evaluation through the brain’s electrical activity. In Proceedings of the 8th Nordic Conference on Human-Computer Interaction: Fun, Fast, Foundational, Helsinki, Finland, 26–30 October 2014. [Google Scholar]
- Bos, D.P.O.; Duvinage, M.; Oktay, O.; Saa, J.D.; Guruler, H.; Istanbullu, A.; Van Vliet, M.; Van De Laar, B.; Poel, M.; Roijendijk, L.; et al. Looking around with your brain in a virtual world. In Proceedings of the 2011 IEEE Symposium on Computational Intelligence, Cognitive Algorithms, Mind, and Brain (CCMB), Paris, France, 11–15 April 2011. [Google Scholar]
- Little, L.M.; Kluemper, D.; Nelson, D.L.; Gooty, J. Development and validation of the interpersonal emotion management scale. J. Occ. Organ. Psychol. 2012, 85, 407–420. [Google Scholar] [CrossRef]
- Nacke, L.; Lindley, C.A. Flow and immersion in first-person shooters: Measuring the player’s gameplay experience. In Proceedings of the 2008 Conference on Future Play: Research, Play, Share, Toronto, ON, Canada, 3–5 November 2008; pp. 81–88. [Google Scholar]
- Phan, M.H.; Keebler, J.R.; Chaparro, B.S. The development and validation of the game user experience satisfaction scale (GUESS). Hum. Factors 2016, 58, 1217–1247. [Google Scholar] [CrossRef]
- Rizzi, A.; Fogli, D.; Barricelli, B.R. A new approach to perceptual assessment of human-computer interfaces. Multimed. Tools Appl. 2017, 76, 7381–7399. [Google Scholar] [CrossRef]
- Field, A. Discovering Statistics Using SPSS, 3rd ed.; Sage: London, UK, 2009. [Google Scholar]
- Luck, S.J. An Introduction to the Event-Related Potential Technique, 2nd ed.; The MIT Press: Cambridge, MA, USA, 2014. [Google Scholar]
- Keil, A.; Müller, M.M.; Gruber, T.; Wienbruch, C.; Stolarova, M.; Elbert, T. Effects of emotional arousal in the cerebral hemispheres: A study of oscillatory brain activity and event-related potentials. Clin. Neurophysiol. 2001, 112, 2057–2068. [Google Scholar] [CrossRef]
- Wijers, A.A.; Okita, T.; Mulder, G.; Mulder, L.J.M.; Lorist, M.M.; Poiesz, R.; Scheffers, M.K. Visual search and spatial attention: ERP in focussed and divided attention conditions. Biol. Psychol. 1987, 25, 33–60. [Google Scholar] [CrossRef]
- Hoversten, L.J.; Brothers, T.; Swaab, T.Y.; Traxler, M.J. Early processing of orthographic language membership information in bilingual visual word recognition: Evidence from ERP. Neuropsychologia 2017, 103, 183–190. [Google Scholar] [CrossRef]
- Luck, S.J.; Hillyard, S.A. Electrophysiological correlates of feature analysis during visual search. Psychophysiology 1994, 31, 291–308. [Google Scholar] [CrossRef]
- Carretié, L.; Hinojosa, J.A.; Martín-Loeches, M.; Mercado, F.; Tapia, M. Automatic attention to emotional stimuli: Neural correlates. Hum. Brain Mapp. 2004, 22, 290–299. [Google Scholar]
- Folstein, J.R.; Van Petten, C. Influence of cognitive control and mismatch on the N2 component of the ERP: A review. Psychophysiology 2008, 45, 152–170. [Google Scholar] [CrossRef]
- Flynn, M.; Liasis, A.; Gardner, M.; Towell, T. Visual mismatch negativity to masked stimuli presented at very brief presentation rates. Exp. Brain Res. 2017, 235, 555–563. [Google Scholar] [CrossRef]
- Basiul, I.A.; Aia, K. Dependence N200 and P300 ERP in P300-based brain-computer interface on the variations of voluntary attention. Zhurnal Vyssheĩ Nervnoĩ Deiatelnosti Imeni I P Pavlova 2014, 64, 159–165. [Google Scholar] [PubMed]
- De Tommaso, M.; Pecoraro, C.; Sardaro, M.; Serpino, C.; Lancioni, G.; Livrea, P. Influence of aesthetic perception on visual event-related potentials. Consciousness Cogn. 2008, 17, 933–945. [Google Scholar] [CrossRef] [PubMed]
- Lindgaard, G.; Fernandes, G.; Dudek, C.; Brown, J. Attention web designers: You have 50 milliseconds to make a good first impression. Behav. Inf. Technol. 2006, 25, 115–126. [Google Scholar] [CrossRef]
- Bandura, A. Social cognitive theory: An agentic perspective. Asian J. Soc. Psychol. 1999, 2, 21–41. [Google Scholar] [CrossRef]


| Demographic information: |
| gender; ( ) age; ( ) education background; ( ) years of playing mobile games; ( ) hours of playing mobile games per week; ( ) |
| Emotional perception (completely disagree: 1 completely agree: 7) |
| EP-1: This navigation interface makes me feel amazed. EP-2: This navigation interface makes me feel pleasure. EP-3: This navigation interface makes me feel content. EP-4: I am hopeful for the operation of this navigation interface. |
| Usability (completely disagree: 1 completely agree: 7) |
| U-1: This navigation interface has a clear layout. U-2: This navigation interface looks easy to operate. U-3: This navigation interface looks friendly. |
| Gameplay (completely disagree: 1 completely agree: 7) |
| G-1: The design elements of this navigation interface is delicate. G-2: This navigation interface has an integrated appearance. G-3: The layout of this navigation interface is innovative. G-4: This navigation interface is colorful. |
| Attractiveness (completely disagree: 1 completely agree: 7) |
| A-1: Some parts of this navigation interface are novel in design. A-2: This navigation interface gives me a deep impressive. A-3: This navigation interface can attract my attention. A-4: This navigation interface can stimulate my interest in the operation. |
| The tendency for a further experience this mobile game |
| (completely disagree: 1 completely agree: 7) T-1: I intend to experience this mobile game further. |
| Stimuli | Emotional Perception | Gameplay | Usability | Attractiveness | The Tendency for Further Experience | Perceptual Experience |
|---|---|---|---|---|---|---|
| Crazylily1.0 | 8.40 | 5.75 | 8.35 | 8.50 | 2.25 | 33.25 |
| Crazylily3.0 | 14.85 | 12.65 | 15.65 | 16.20 | 4.05 | 63.40 |
| Crazylily6.0 | 23.70 | 16.75 | 23.55 | 23.40 | 5.70 | 93.10 |
| ERP | Location | Low Perceptual Experience | Medium Perceptual Experience | High Perceptual Experience | |||
|---|---|---|---|---|---|---|---|
| Mean | SD | Mean | SD | Mean | SD | ||
| N1 | FP | −2.262 | 3.098 | −1.424 | 2.394 | −1.370 | 2.601 |
| F | −1.695 | 2.054 | −0.941 | 2.039 | −1.191 | 2.455 | |
| FC | −1.586 | 1.932 | −0.756 | 2.114 | −1.126 | 2.311 | |
| C | −1.152 | 1.758 | −0.396 | 2.080 | −0.793 | 2.051 | |
| P2 | FP | −1.241 | 4.985 | 0.559 | 4.824 | 0.379 | 4.450 |
| F | 0.101 | 3.435 | 1.527 | 3.587 | 1.114 | 3.286 | |
| FC | 0.370 | 3.195 | 1.551 | 3.427 | 1.198 | 3.105 | |
| C | 0.232 | 2.914 | 1.031 | 3.226 | 0.899 | 2.983 | |
| N2 | FP | −6.400 | 4.826 | −6.433 | 5.154 | −7.963 | 4.290 |
| F | −5.254 | 3.410 | −5.273 | 3.249 | −7.144 | 3.512 | |
| FC | −4.687 | 3.051 | −4.778 | 2.816 | −6.719 | 3.299 | |
| C | −3.942 | 2.689 | −4.076 | 2.437 | −5.854 | 2.958 | |
| ERP | Location | Lower-Medium | Lower-Higher | Medium-Higher | |||
|---|---|---|---|---|---|---|---|
| t | p | t | p | t | p | ||
| N1 | FP | −1.895 | 0.073 | −1.551 | 0.137 | -0.133 | 0.895 |
| F | −2.217 | 0.039 | −0.997 | 0.331 | 0.603 | 0.554 | |
| FC | −2.279 | 0.034 | −0.989 | 0.335 | 0.947 | 0.335 | |
| C | −2.000 | 0.060 | −0.857 | 0.402 | 1.109 | 0.281 | |
| P2 | FP | −3.573 | 0.002 | −3.218 | 0.005 | 0.319 | 0.753 |
| F | −3.533 | 0.002 | −2.417 | 0.026 | 0.872 | 0.394 | |
| FC | −2.977 | 0.008 | −1.859 | 0.079 | 0.794 | 0.437 | |
| C | −2.078 | 0.052 | −1.440 | 0.166 | 0.309 | 0.760 | |
| N2 | FP | 0.070 | 0.945 | 3.175 | 0.005 | 2.737 | 0.013 |
| F | 0.055 | 0.957 | 5.155 | 0.000 | 4.227 | 0.000 | |
| FC | 0.259 | 0.799 | 5.724 | 0.000 | 4.332 | 0.000 | |
| C | 0.391 | 0.700 | 5.596 | 0.000 | 4.131 | 0.001 | |
© 2019 by the authors. Licensee MDPI, Basel, Switzerland. This article is an open access article distributed under the terms and conditions of the Creative Commons Attribution (CC BY) license (http://creativecommons.org/licenses/by/4.0/).
Share and Cite
Guo, F.; Jiang, J.-Y.; Tian, X.-H.; Chen, J.-H. Applying Event-Related Potentials to Measure Perceptual Experience toward the Navigation Interface of a Mobile Game for Improving the Design. Symmetry 2019, 11, 710. https://doi.org/10.3390/sym11050710
Guo F, Jiang J-Y, Tian X-H, Chen J-H. Applying Event-Related Potentials to Measure Perceptual Experience toward the Navigation Interface of a Mobile Game for Improving the Design. Symmetry. 2019; 11(5):710. https://doi.org/10.3390/sym11050710
Chicago/Turabian StyleGuo, Fu, Jun-Yi Jiang, Xiao-Hui Tian, and Jia-Hao Chen. 2019. "Applying Event-Related Potentials to Measure Perceptual Experience toward the Navigation Interface of a Mobile Game for Improving the Design" Symmetry 11, no. 5: 710. https://doi.org/10.3390/sym11050710