1. Introduction
Economic growth increases the road traffic and the associated problems are bound to intensify as a result. In the case of villages located on primary routes (further called regional roads) this growth of traffic is more conspicuous, as compared to small or bigger towns, due to accumulation of problems on a relatively short stretch of the road. A shortage of road by-passes in Poland results in the road routes cutting through the centres of settlements, this affecting the quality of life of the local community.
The main factor which, in most cases, has a direct bearing on both the number of road incidents and their severity is the speed of vehicular traffic. Hence, one of the key issues is ensuring safety on the pedestrian crossings in villages. To this end, various traffic calming treatments are installed, positioned both in the entry zones and in the village centre areas. The latter include pedestrian refuges whose primary function is to protect vulnerable road users (VRU). According to the guidelines of [
1] the pedestrian refuges should be provided where it is desired to obtain reduction of the 85th percentile speed
v85 to below 50 km/h.
Incorporation of pedestrian refuges in the design of roads is a most important issue from the traffic safety improvement viewpoint. According to the most recent studies [
2] over 30% of accidents involving pedestrians occur on the pedestrian crossings and excessive speed is identified as their cause. The probability of fatality increases with the impact speed, i.e., the speed at which the vehicle hits the pedestrian. Based on the review of the most recent research publications it has been concluded that the pedestrian crossing type has a bearing on the speeds at which it is passed by vehicles, as demonstrated by the speed survey data. The distance from which the driver spots the pedestrian is also most relevant to the theoretical impact speed [
3]. Visibility studies confirmed that pedestrian refuges, due to their central location, make the drivers focus their vision on this obstacle, i.e., on the central area of the road. Looking from a distance, the driver can sooner identify the pedestrian crossing and spot a pedestrian about to cross the street. Facing the island ahead, the drivers become more focussed and alert and this increases the distance from which they can spot a pedestrian and reduces the risk of accidents. Moreover, pedestrian refuges create a perceived reduction of the carriageway width, increasing the amount of speed reduction, as compared to conventional pedestrian crossings [
4]. Therefore, pedestrian refuges are ranked as one of the best measures to improve traffic safety on pedestrian crossings.
According to the U.S. traffic survey data published in [
1], for the road under analysis speed reduction in the range of 13–23% can be expected on the road under analysis after it has been provided with pedestrian refuges. The purpose of this research was to verify if the actual speed reductions achieved in Poland correspond to the U.S. survey results published in [
1]. To this end, a number of free-flow and stable-flow speed surveys were carried out in a few villages located on regional roads with pedestrian refuges positioned in the entry zones and in the village centre areas. The upgrading project was carried out in the period 2012–2016 and to date, only isolated road incidents occurred from completion of the works. Only in one village a few incidents were noted in that period, yet none of them involved pedestrians. As such, the scope of this research has been limited to the vehicular speed issue. By selecting recently upgraded stretches of regional roads the authors excluded the effect of deteriorated pavements, lack of footways and other factors that could influence the speeds of travel. This paper presents the results of analyses performed on the survey data.
2. Review of Engineering Requirements Given in Various Design Manuals
The basic engineering requirements to be applied for pedestrian refuges located in Poland are given in [
1,
5]. The key points concern maintaining the width of the travel lane alongside the pedestrian refuge, as given in the Design Guidelines [
6] depending on the level of service of the road and use of symmetric 1:5 to 1:10 tapered hatched markings as the approach end treatments. However, the guidelines [
7] are not specific if the lines of P-7b pavement marking should be extended up to the island nose or to the meeting point with the P10 or P11 line marking, (for the meaning and pictures of signs referred to by their acronyms see the table in the
Appendix A). However, they give a recommendation the travel lane width should be measured between the centres of the marking lines or between the line centre and face of the curb. Furthermore, guidelines [
5] recommend using different taper geometries depending on the pedestrian island position (in the entry zone, central area or in the vicinity of public buildings respectively), with more aggressive design for the village central areas and less aggressive for the entry zones.
The Swedish guidelines [
8] in turn do not give detailed geometric parameters for pedestrian refuges. They, however, recommend two different treatments to accompany the pedestrian refuges in lightly trafficked (yet including heavy goods vehicles) and heavily trafficked roads respectively. These are: raising of pavement—to facilitate crossing the road by pedestrians in the first case and installation of post-and-chain barriers as a measure to prevent illegal crossing in the latter case.
In the U.S. guidelines [
9] the recommendations concern primarily the island width, which should be in the range of 1.2 to 1.8 m and the lengths of P-21 and P-7b line markings, which should be 30.48 m (100 ft) in built-up areas and 60.96 m (200 ft) in rural areas. Symmetricity of both the island and the hatched markings is required therein. Moreover, P-4 solid line pavement marking is recommended to be placed before the hatched marking over the same length as the taper length. Raised pedestrian crossings are recommended for less busy roads and refuges flush with the road surface are recommended in the case of narrower islands. In guidelines [
9] much emphasis is put on installation of raised kerbing and conspicuous markers which is primarily associated with the motorist’s perception of closer and more distant parts of the route and outlines of the nearby houses. Visual perception of the road signs and pavement markings by the motorist is covered, for example, in [
10]. The issues pertaining to perception of 2D and 3D symmetric images and the effect of this perception on taking decisions by the motorist are covered in [
11,
12].
Also, the German guidelines [
13] pay special attention to the motorist’s perception, with the focus put on the visibility of pedestrians to motorists approaching the pedestrian refuge and the need of artificial lighting installed at a height of 3.5–4.5 m to improve visibility when required. The island widths given in the German guidelines [
13] are much greater than the values of the U.S. guidelines [
9]. A minimum width of 2.0 m is recommended, increased to 2.5–3.0 m if the crossing is intended to be used by cyclists and wheelchair users. The width of travel lanes recommended in [
13] to ensure smooth traffic flow is 3.25–3.75 m, depending on the traffic composition. With a greater percentage of heavy vehicles, the lanes should be 3.5 m or 3.75 m wide. With the heavy vehicles, percentage of 1–3% the travel lanes can be 3.25 m wide. In places where an increased number of over-dimensional vehicles involved in seasonal agricultural activities is expected, the geometry of islands should be adjusted accordingly by providing 1.0 m wide overrun strips at the outer carriageway edge, made of irregular cobblestones or fieldstone/flagstone pavers.
In guidelines [
13] a lot of attention is paid to the location of pedestrian crossings on the central islands of various shapes installed as traffic calming measures in the entry zones of settlements. In order to warn the motorists of the change of carriageway geometry and enhance understanding the route and layout of the carriageway, the German guidelines recommend highlighting the chicanes by planting of trees or placing street furniture items. The issue of motorist’s perception and comprehension of road signs is extensively covered in literature [
10,
11,
12].
According to the design guidelines of [
10], for safety reasons, the central islands used as the village entry treatment should not be combined with pedestrian crossings. This said, local conditions may sometimes require combining these two elements at the village gateway. In these cases, the crossing should be placed on the so-called safe side, i.e., where the drivers are expected to have reduced their speed, and enhanced by trees or street furniture elements.
3. Parameters of the Test Sections
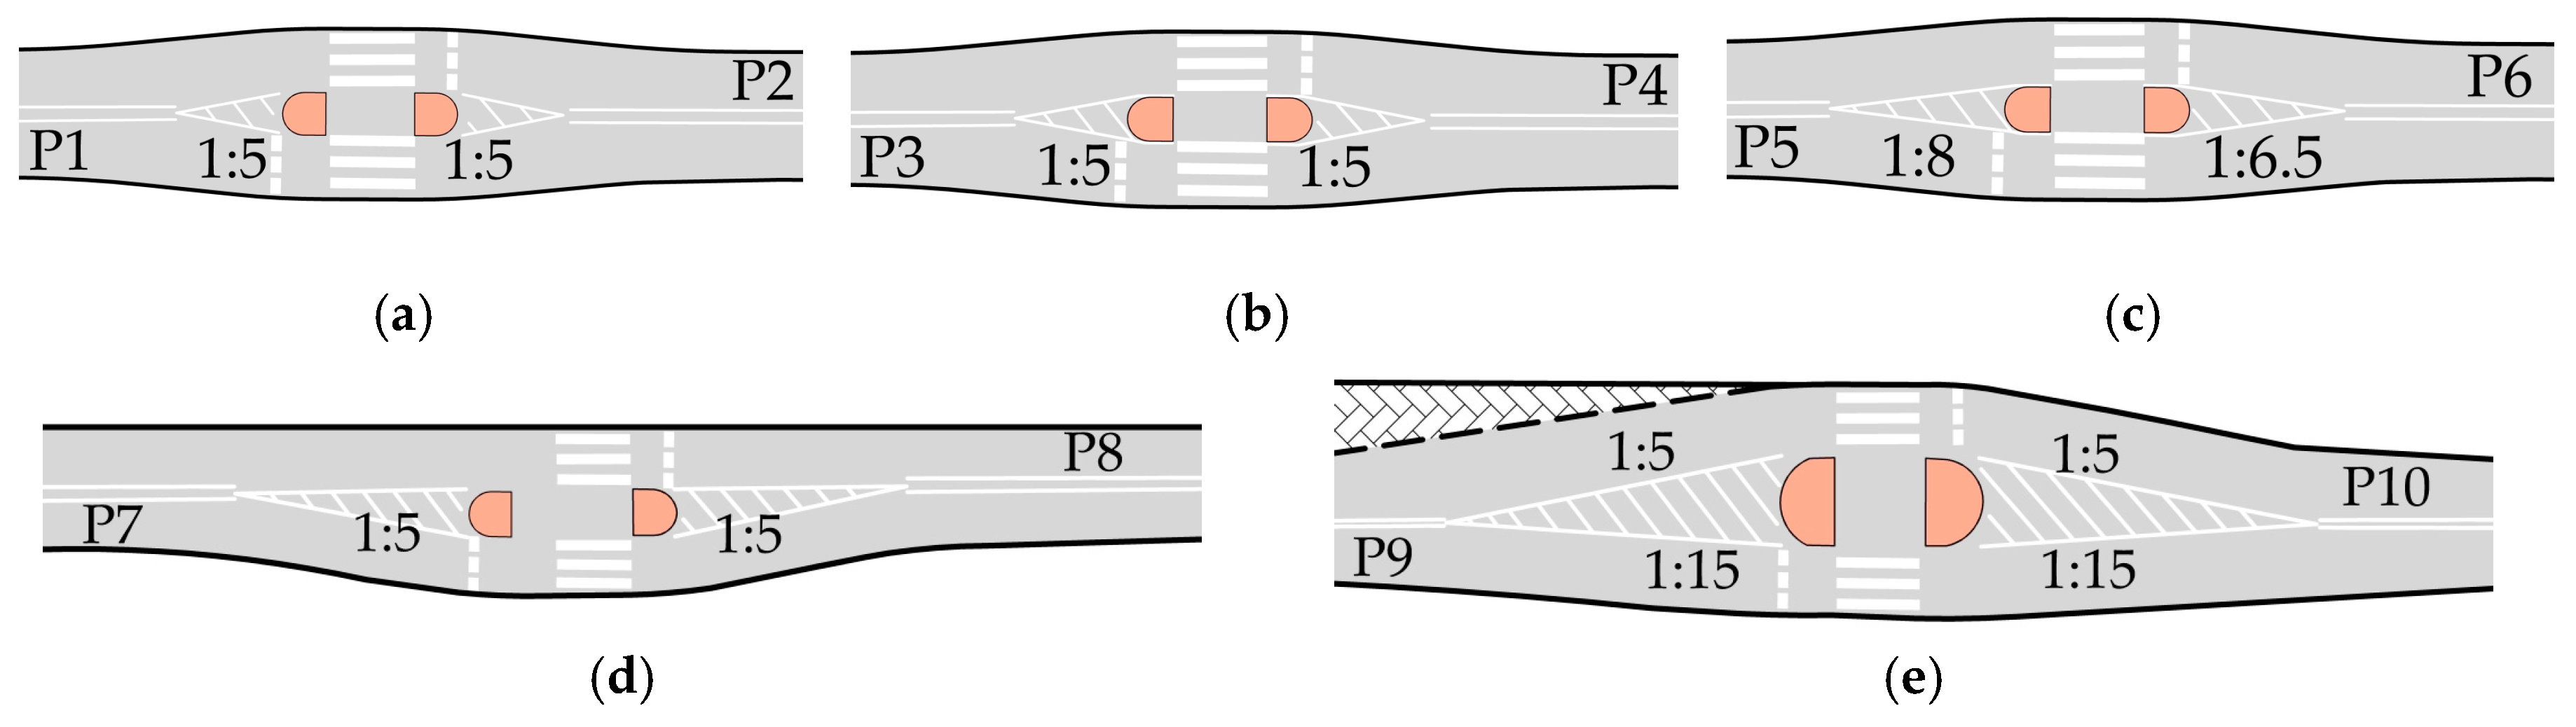
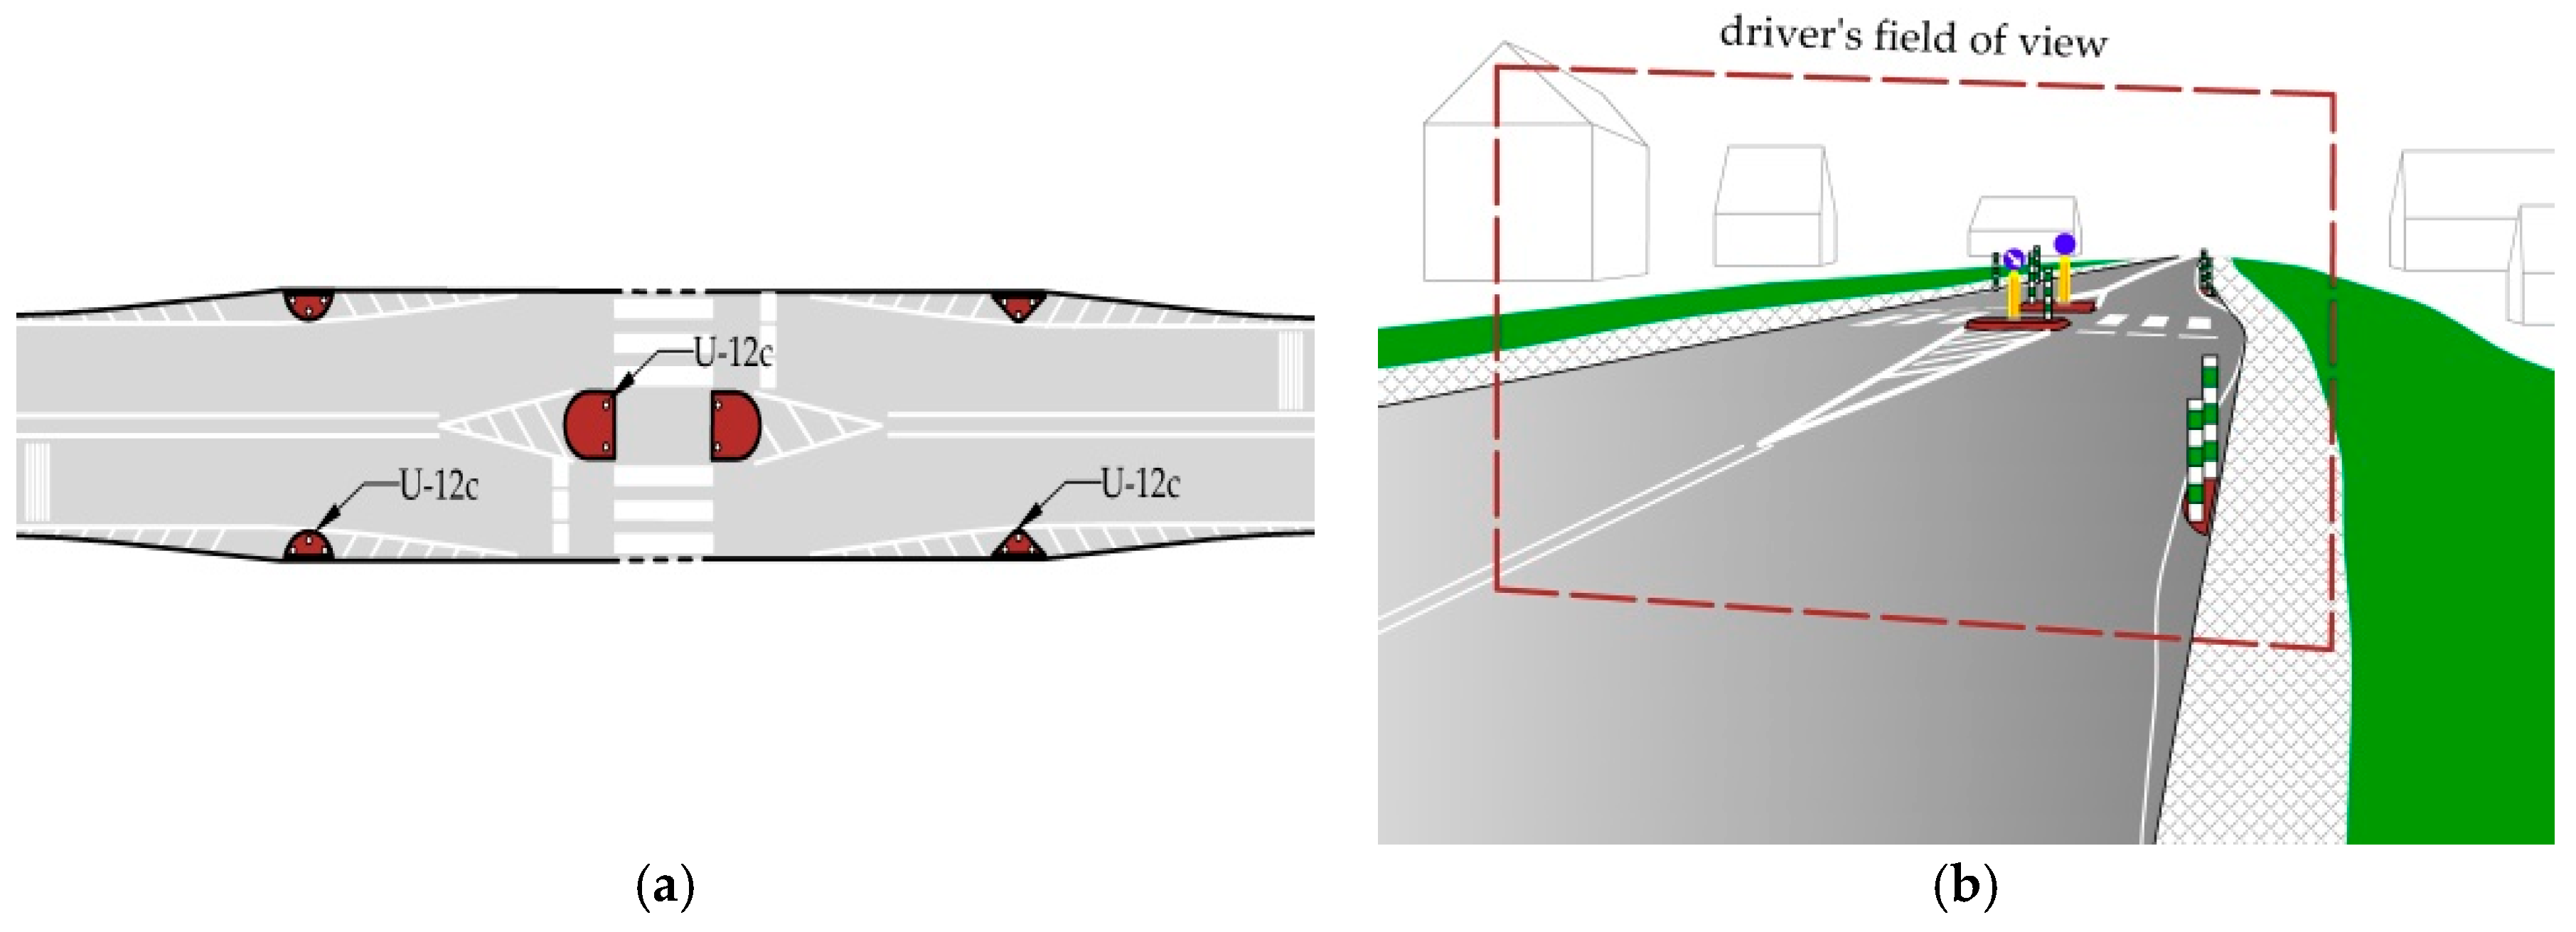
For testing the effect of pedestrian refuges on vehicular speed in their vicinity a few villages were chosen where different refuge islands had been installed: conventional, symmetric about the carriageway centreline and deflecting the path of travel by 1 m on each side (
Figure 1a–c), one non-conventional 2.5 m wide pedestrian refuge island on one side of the centreline (
Figure 1d) and one asymmetric pedestrian refuge incorporating a 4 m wide island imposing asymmetric lateral shifts by 1 m and 3 m respectively (
Figure 1e). One case under analysis was a 2 m wide pedestrian refuge located in the entry zone in place of centre island (
Figure 1a).
Most of the analysed 2 m wide pedestrian refuges were accompanied with a 1:5 tapered marking except for one case with the 1:6.5 rate at village centre side and 1:8 rate at the entry zone side (
Figure 1c). In another case, a 4 m wide asymmetric pedestrian refuge had 1:15 tapered marking at the side imposing lateral shift by 1 m (
Figure 1e). In addition to asymmetric positioning another unusual feature of this pedestrian refuge was an open bus bay positioned tangentially to the travel lane after the island which the drivers took benefit of by accelerating right after passing the pedestrian crossing rather than slowing down below to the upstream speed.
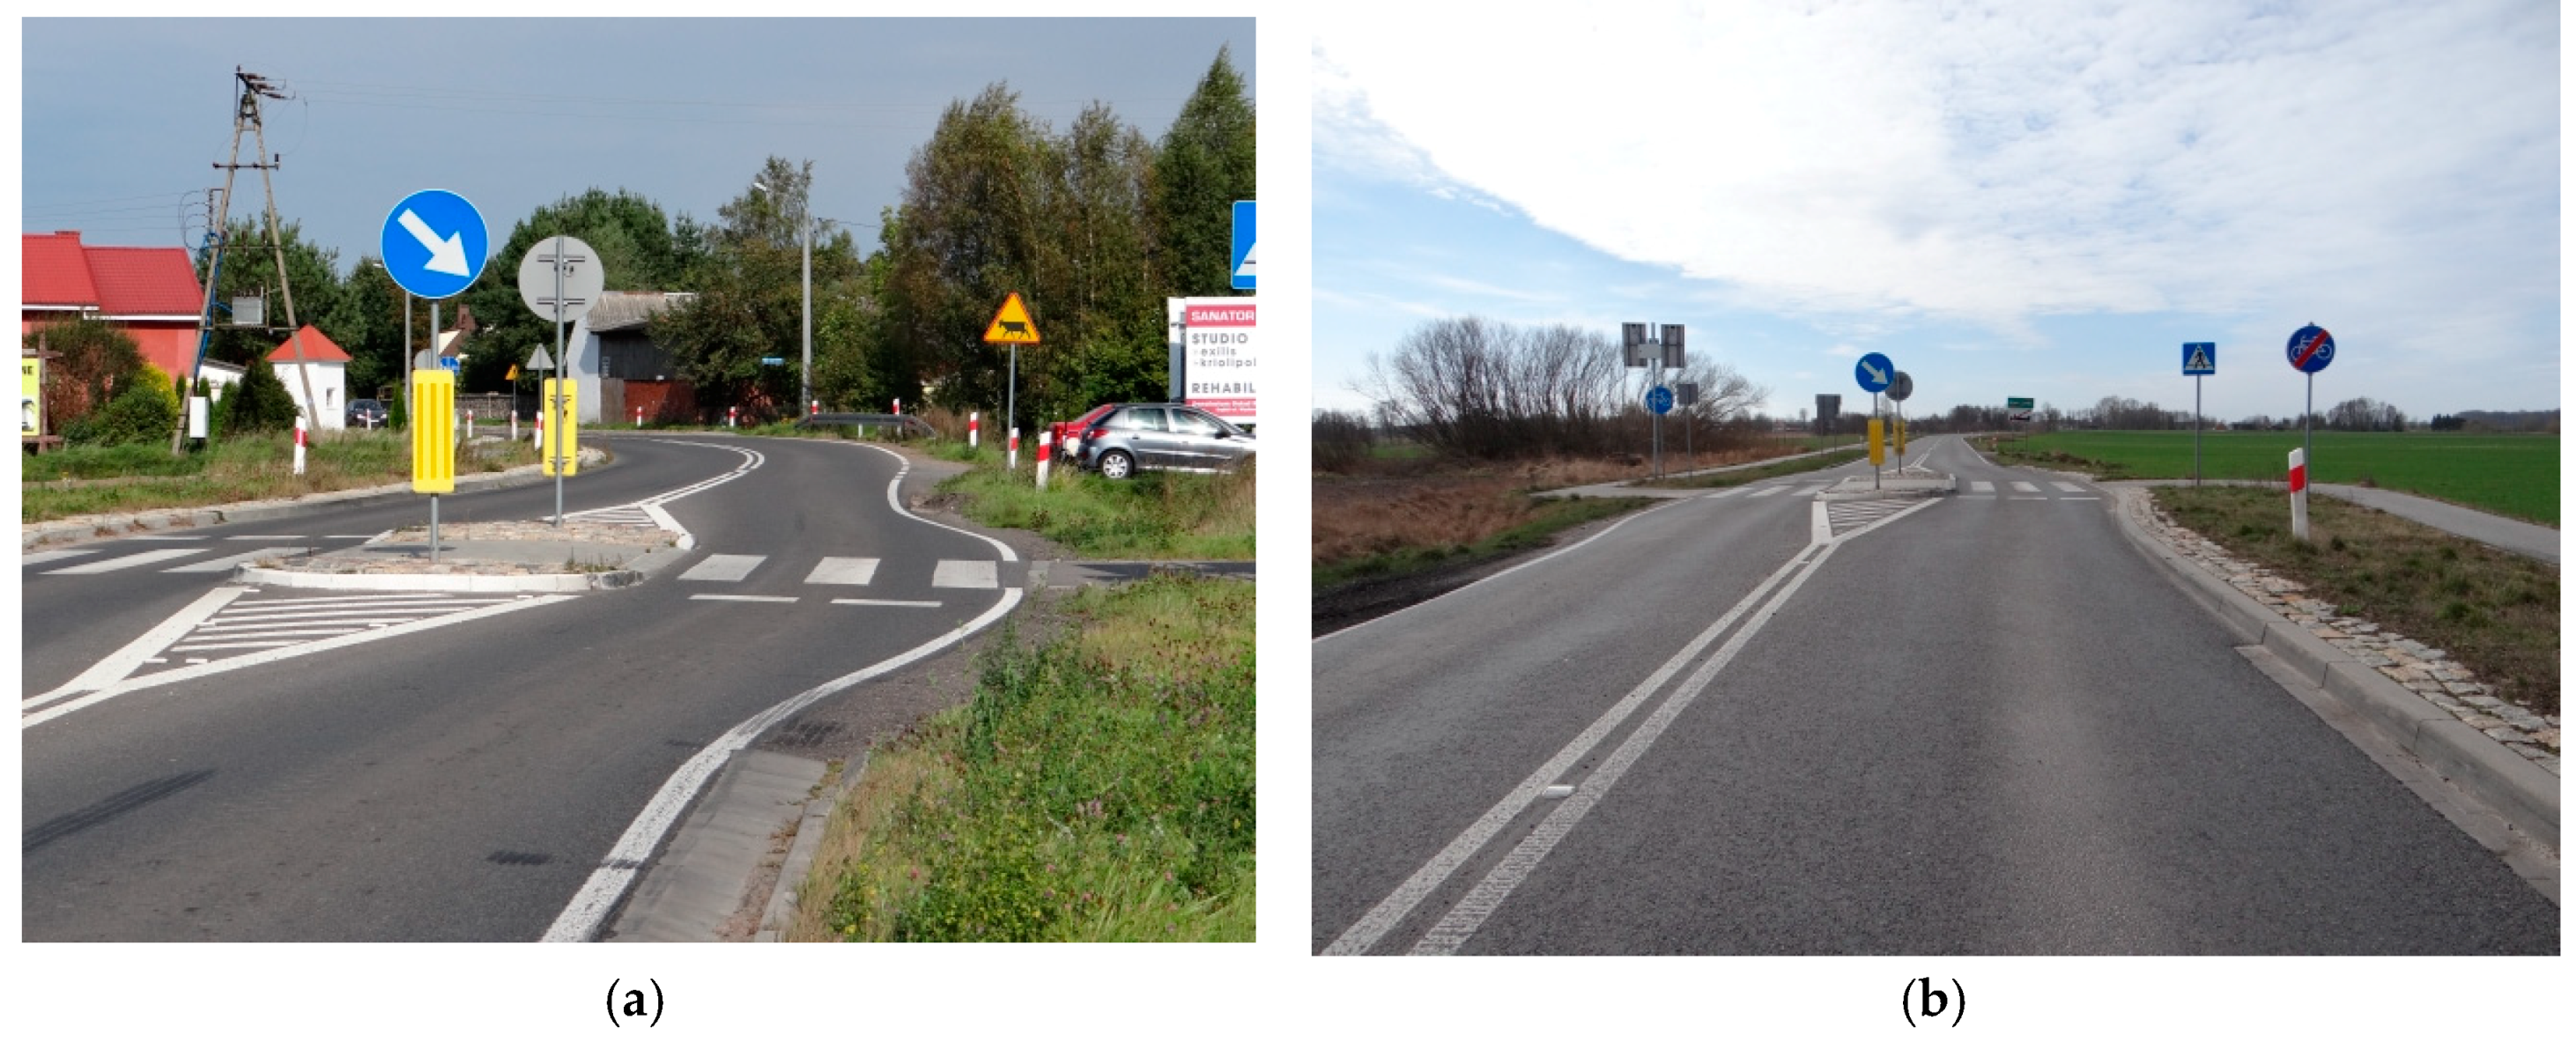
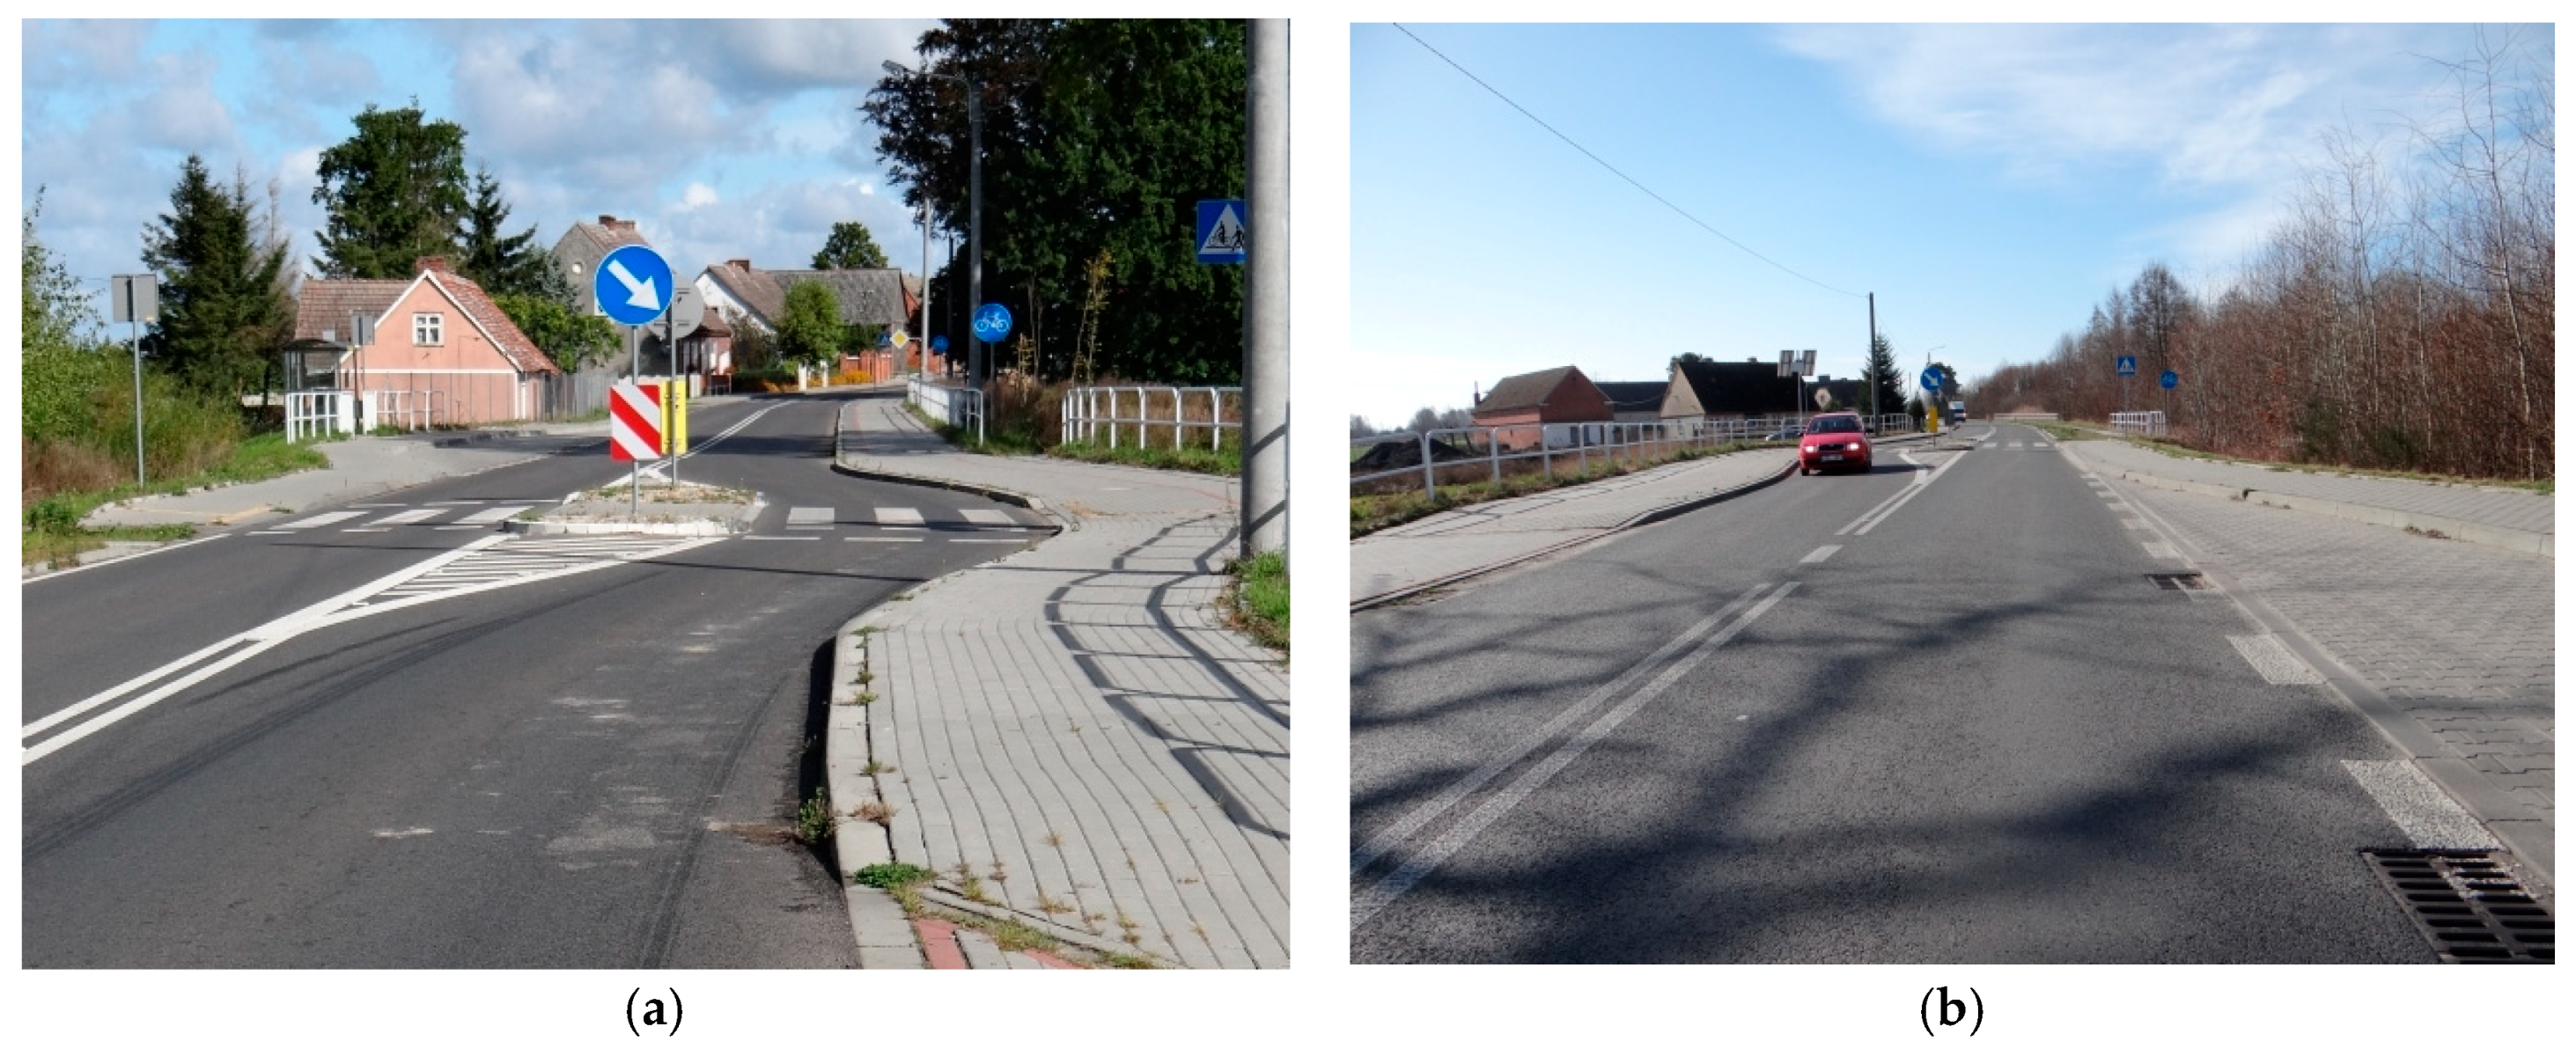
All of the above-mentioned pedestrian refuges were located in a built-up area marked with D-42 entry signs. The B-33 speed limit sign was not placed in the immediate vicinity of the pedestrian refuge in any of the analysed cases. The daytime speed limit in residential areas in Poland is 50 km/h. The pedestrian refuges chosen for the research feature various geometric parameters, different visibility of the road ahead and traffic control schemes. One of them has a conventional shape, includes a 2 m wide island and approach end treatment with P-21 1:5 tapered markings (
Figure 2).
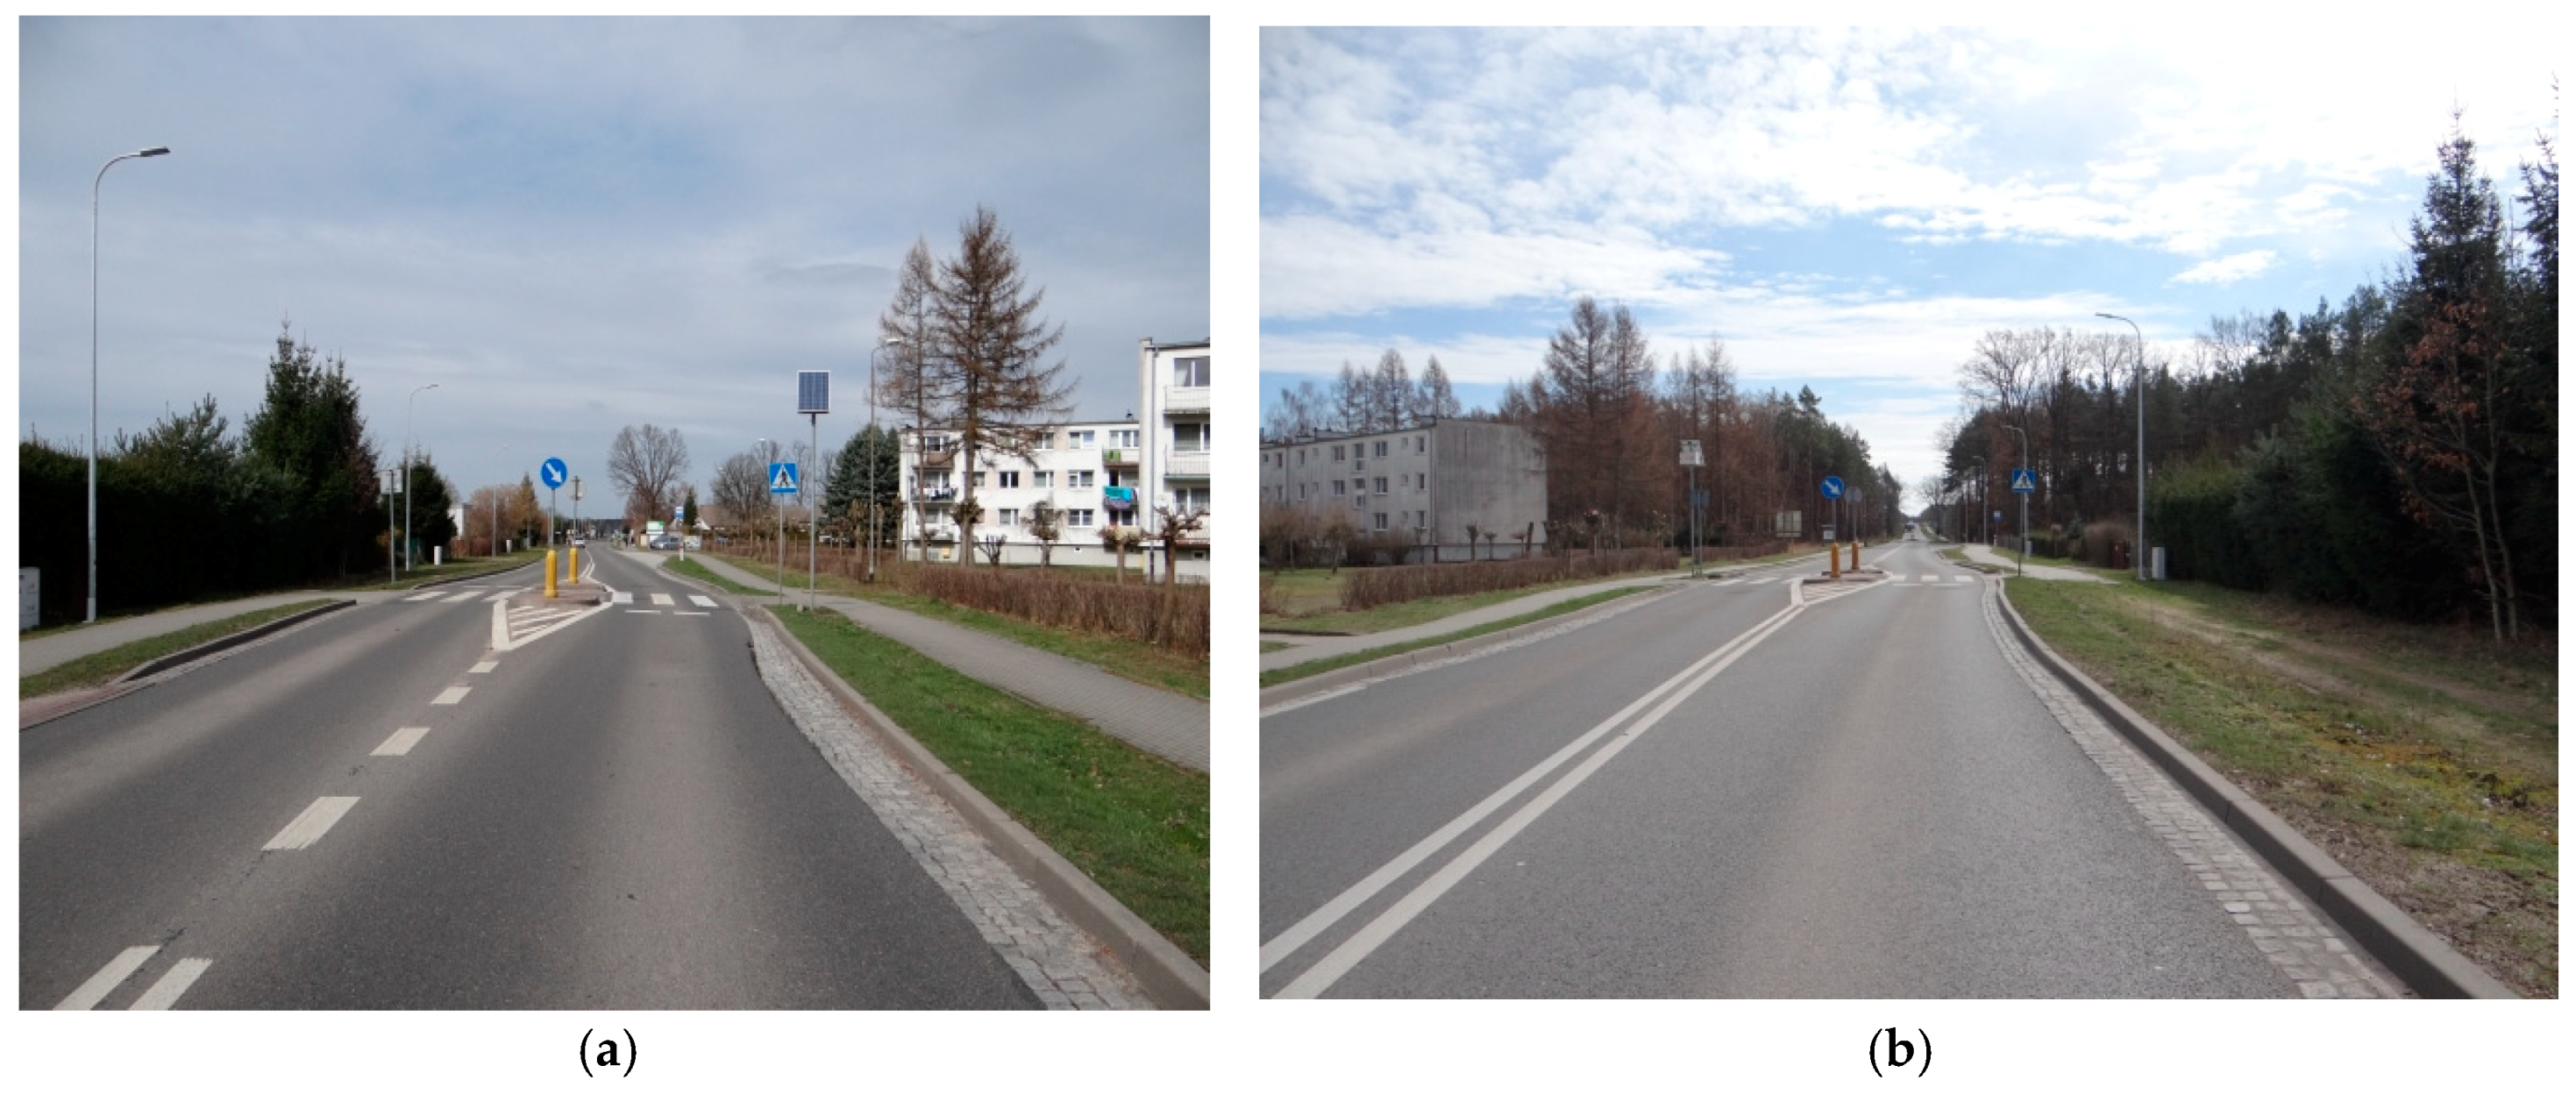
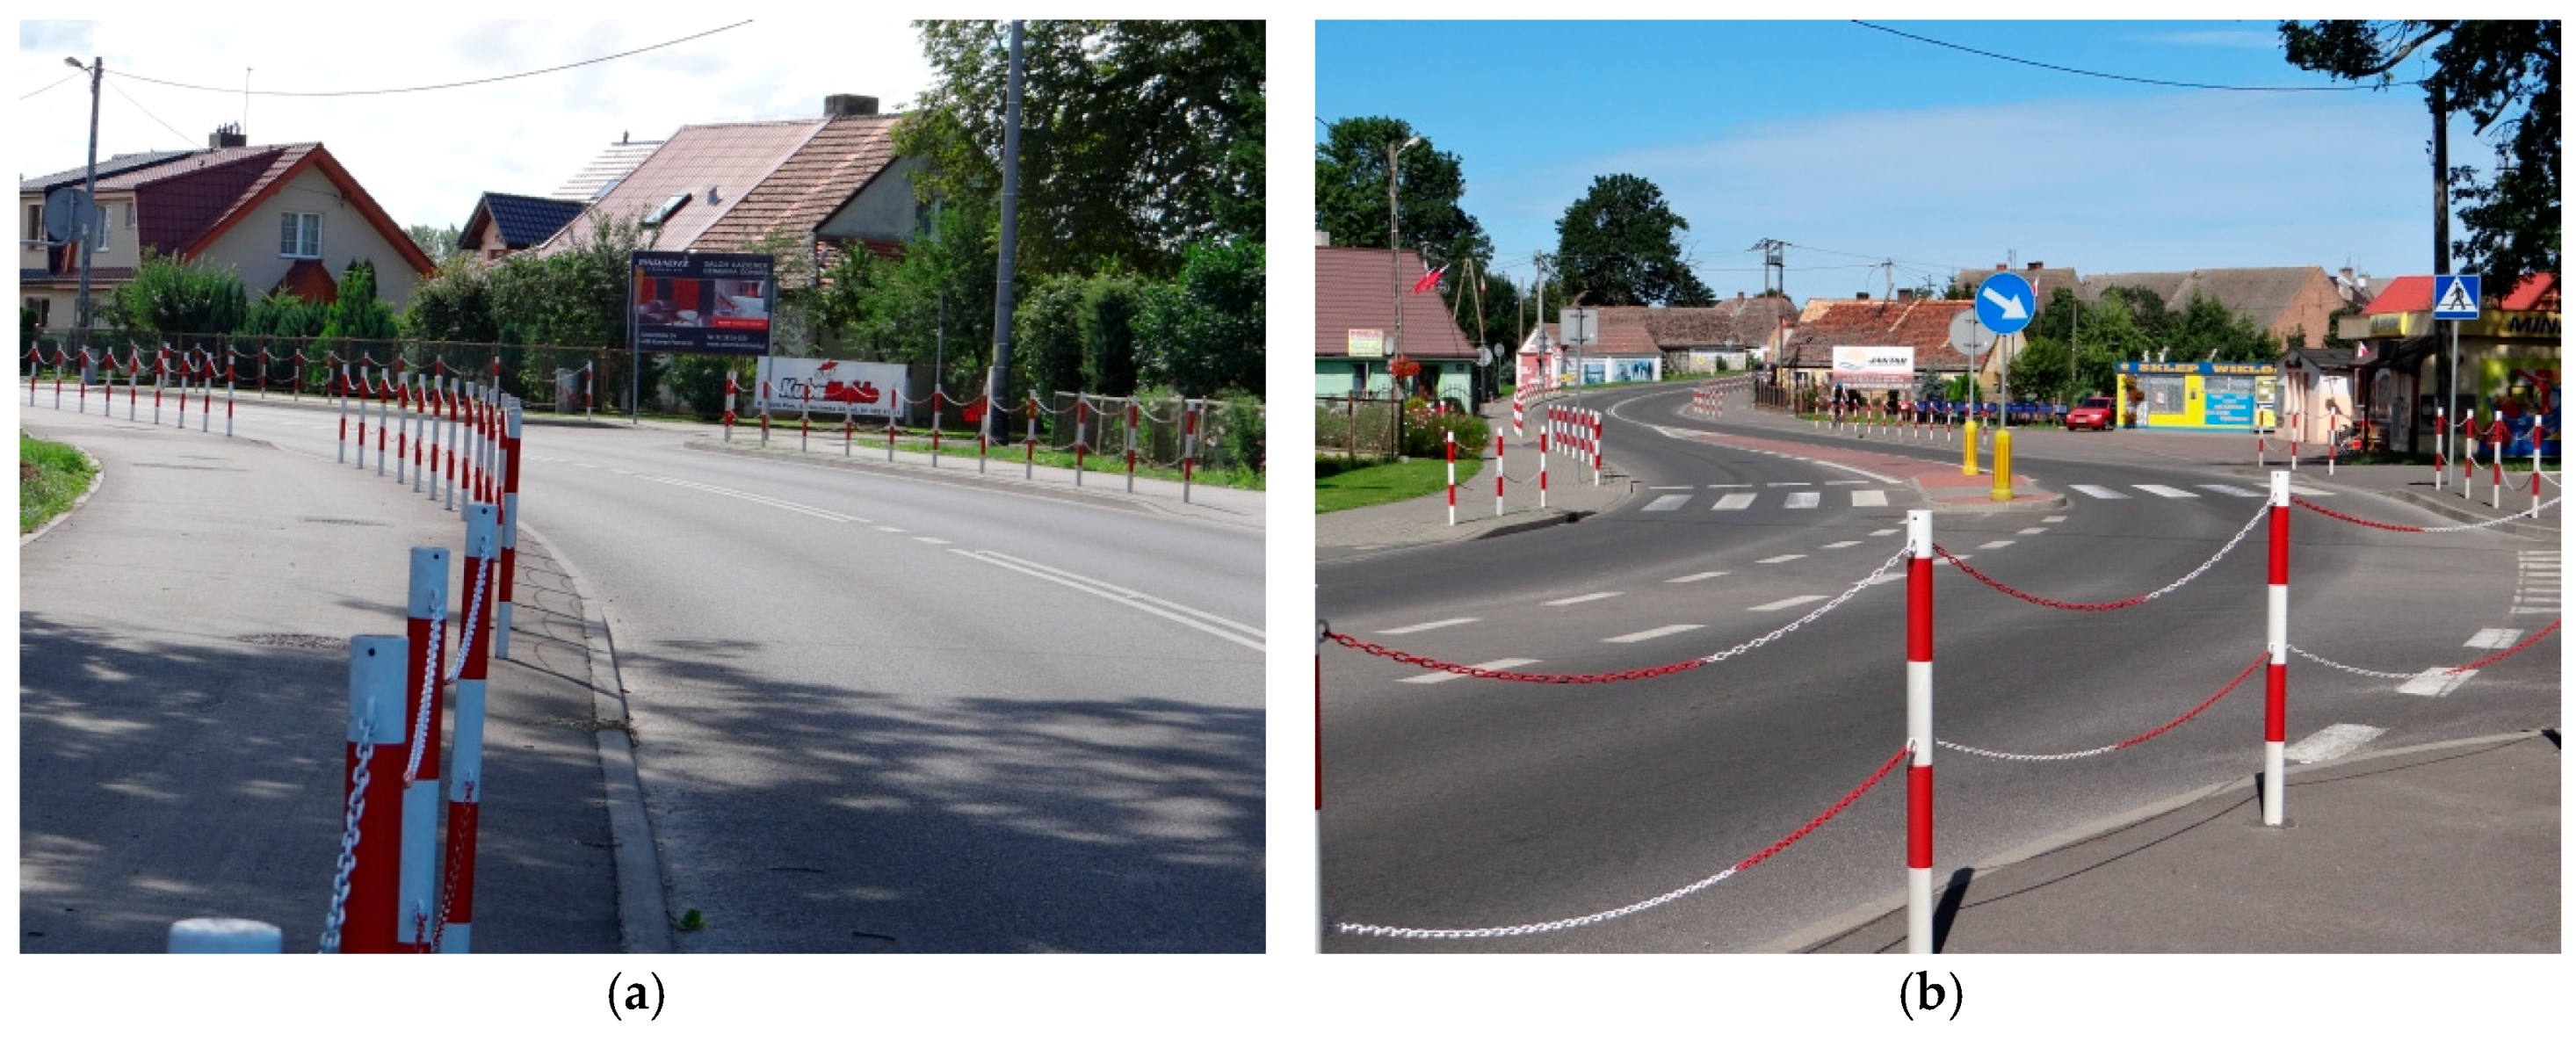
Two other pedestrian refuges under analysis were located on the stretches surrounded by residential buildings in close proximity (
Figure 3) or without any buildings in the surrounding environment (
Figure 4). With most of analysed central refuges situated in the settlement areas (
Figure 1,
Figure 2,
Figure 3,
Figure 4,
Figure 5,
Figure 6,
Figure 7,
Figure 8,
Figure 9 and
Figure 10), in two cases they were located in the entry zones, preceded by gateway islands (
Figure 3b and
Figure 4a). These pedestrian refuges were located quite close to the gateway islands, namely ca. 170 m away. In one case, a very good view was ensured in both directions of travel (
Figure 3). The pedestrian refuge included a 2 m wide island and 1:5 tapered markings. In the other case, the gateway island positioned on the approach lane was followed by a horizontal curve (
Figure 4b) completely obscuring view on the course of the departure section. The pedestrian refuge presented in
Figure 4 has a 2 m wide island and hatched markings with different taper rates of 1:8 on the entry side (
Figure 4a) and 1:6.5 on the departure side (
Figure 4b), viewing in the direction of the village centre, to accommodate the nearby collector road junction.
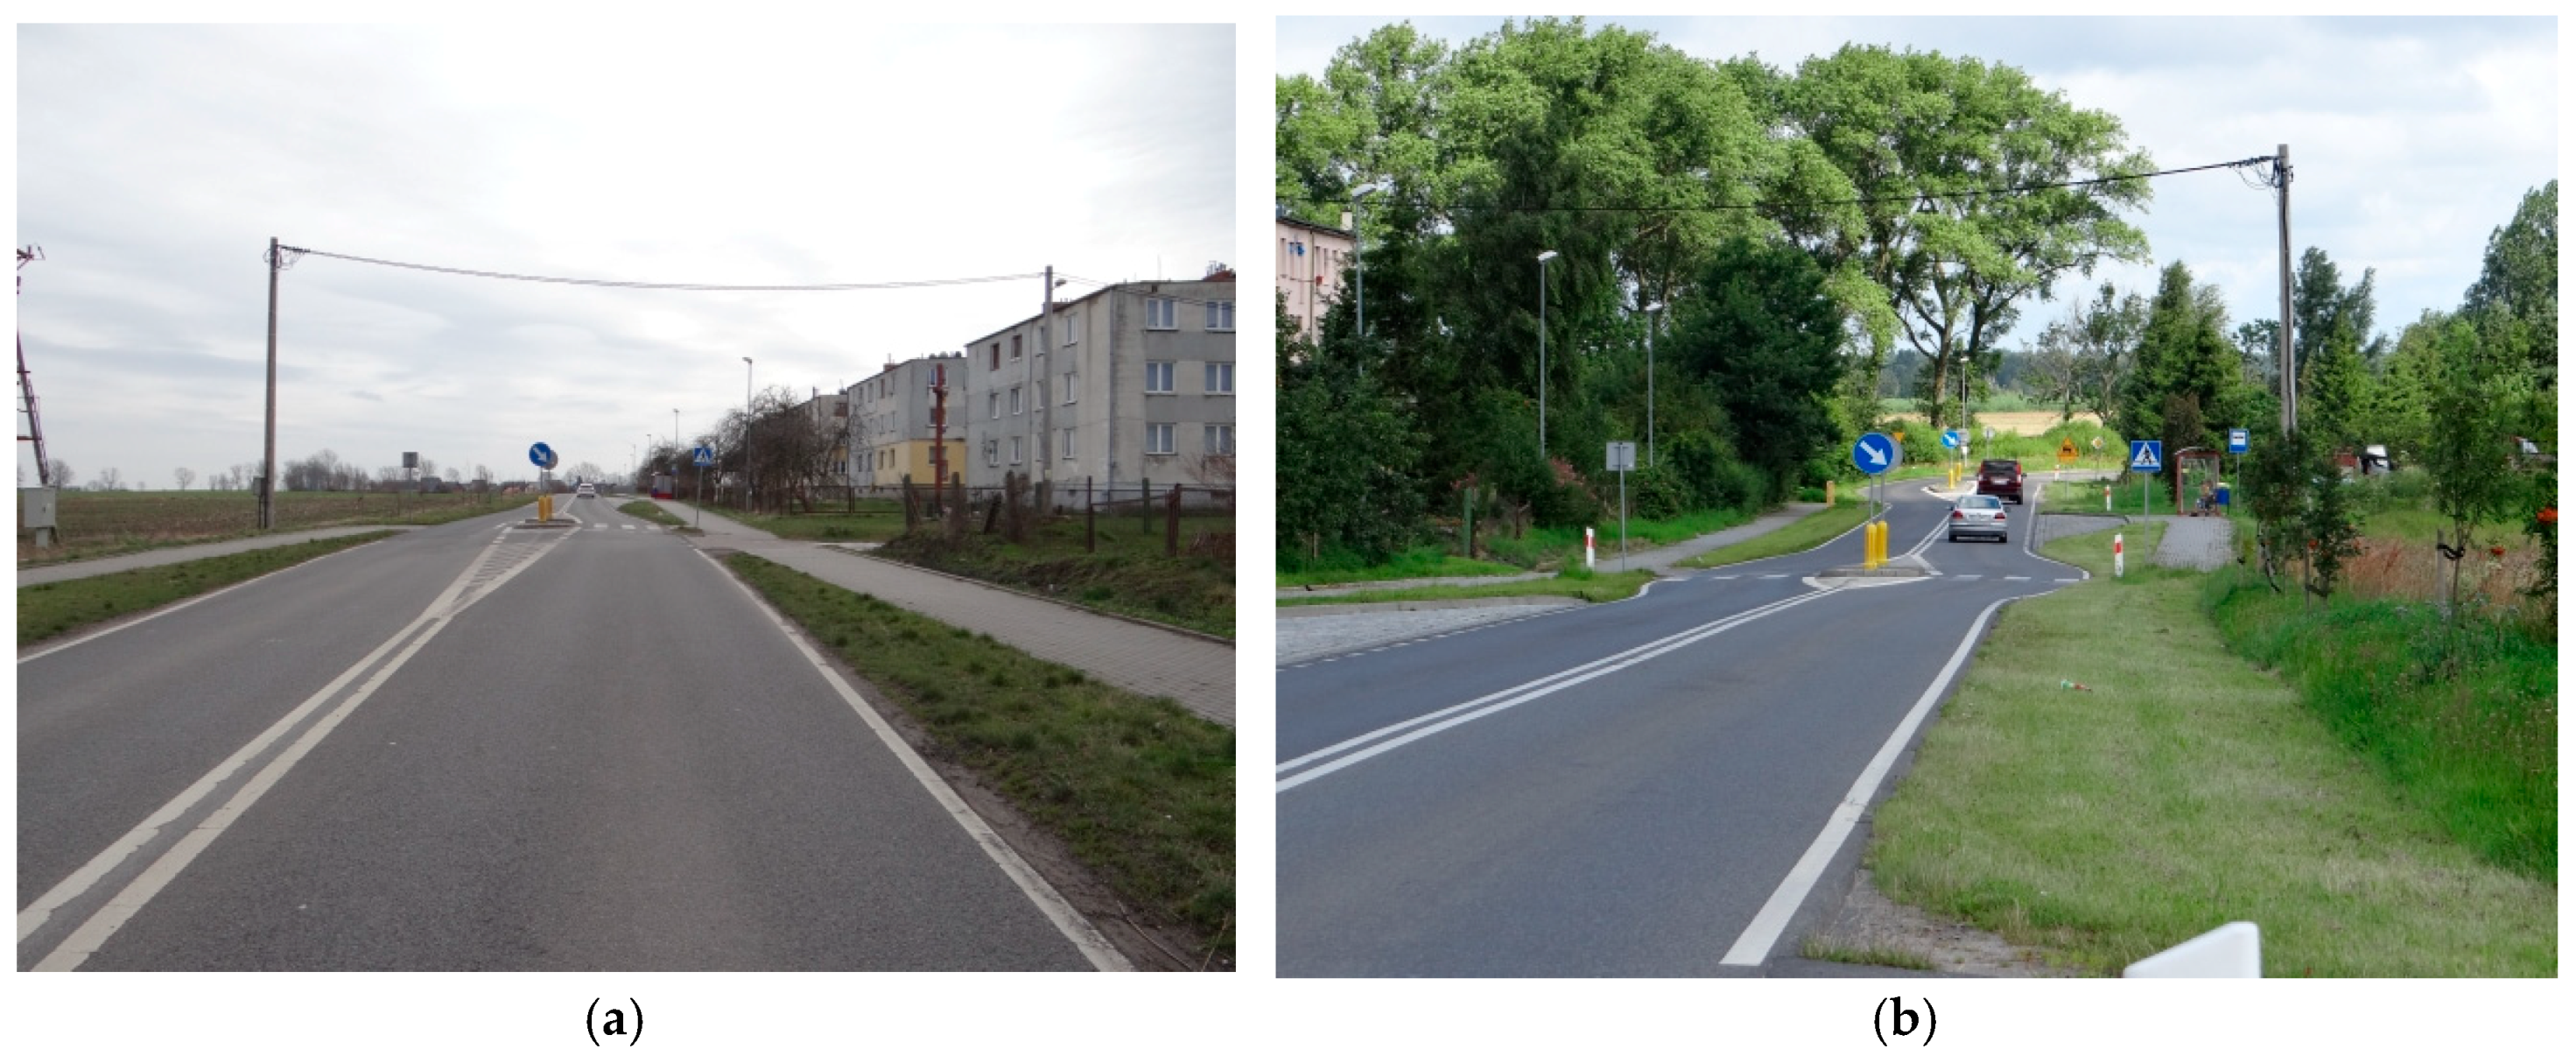
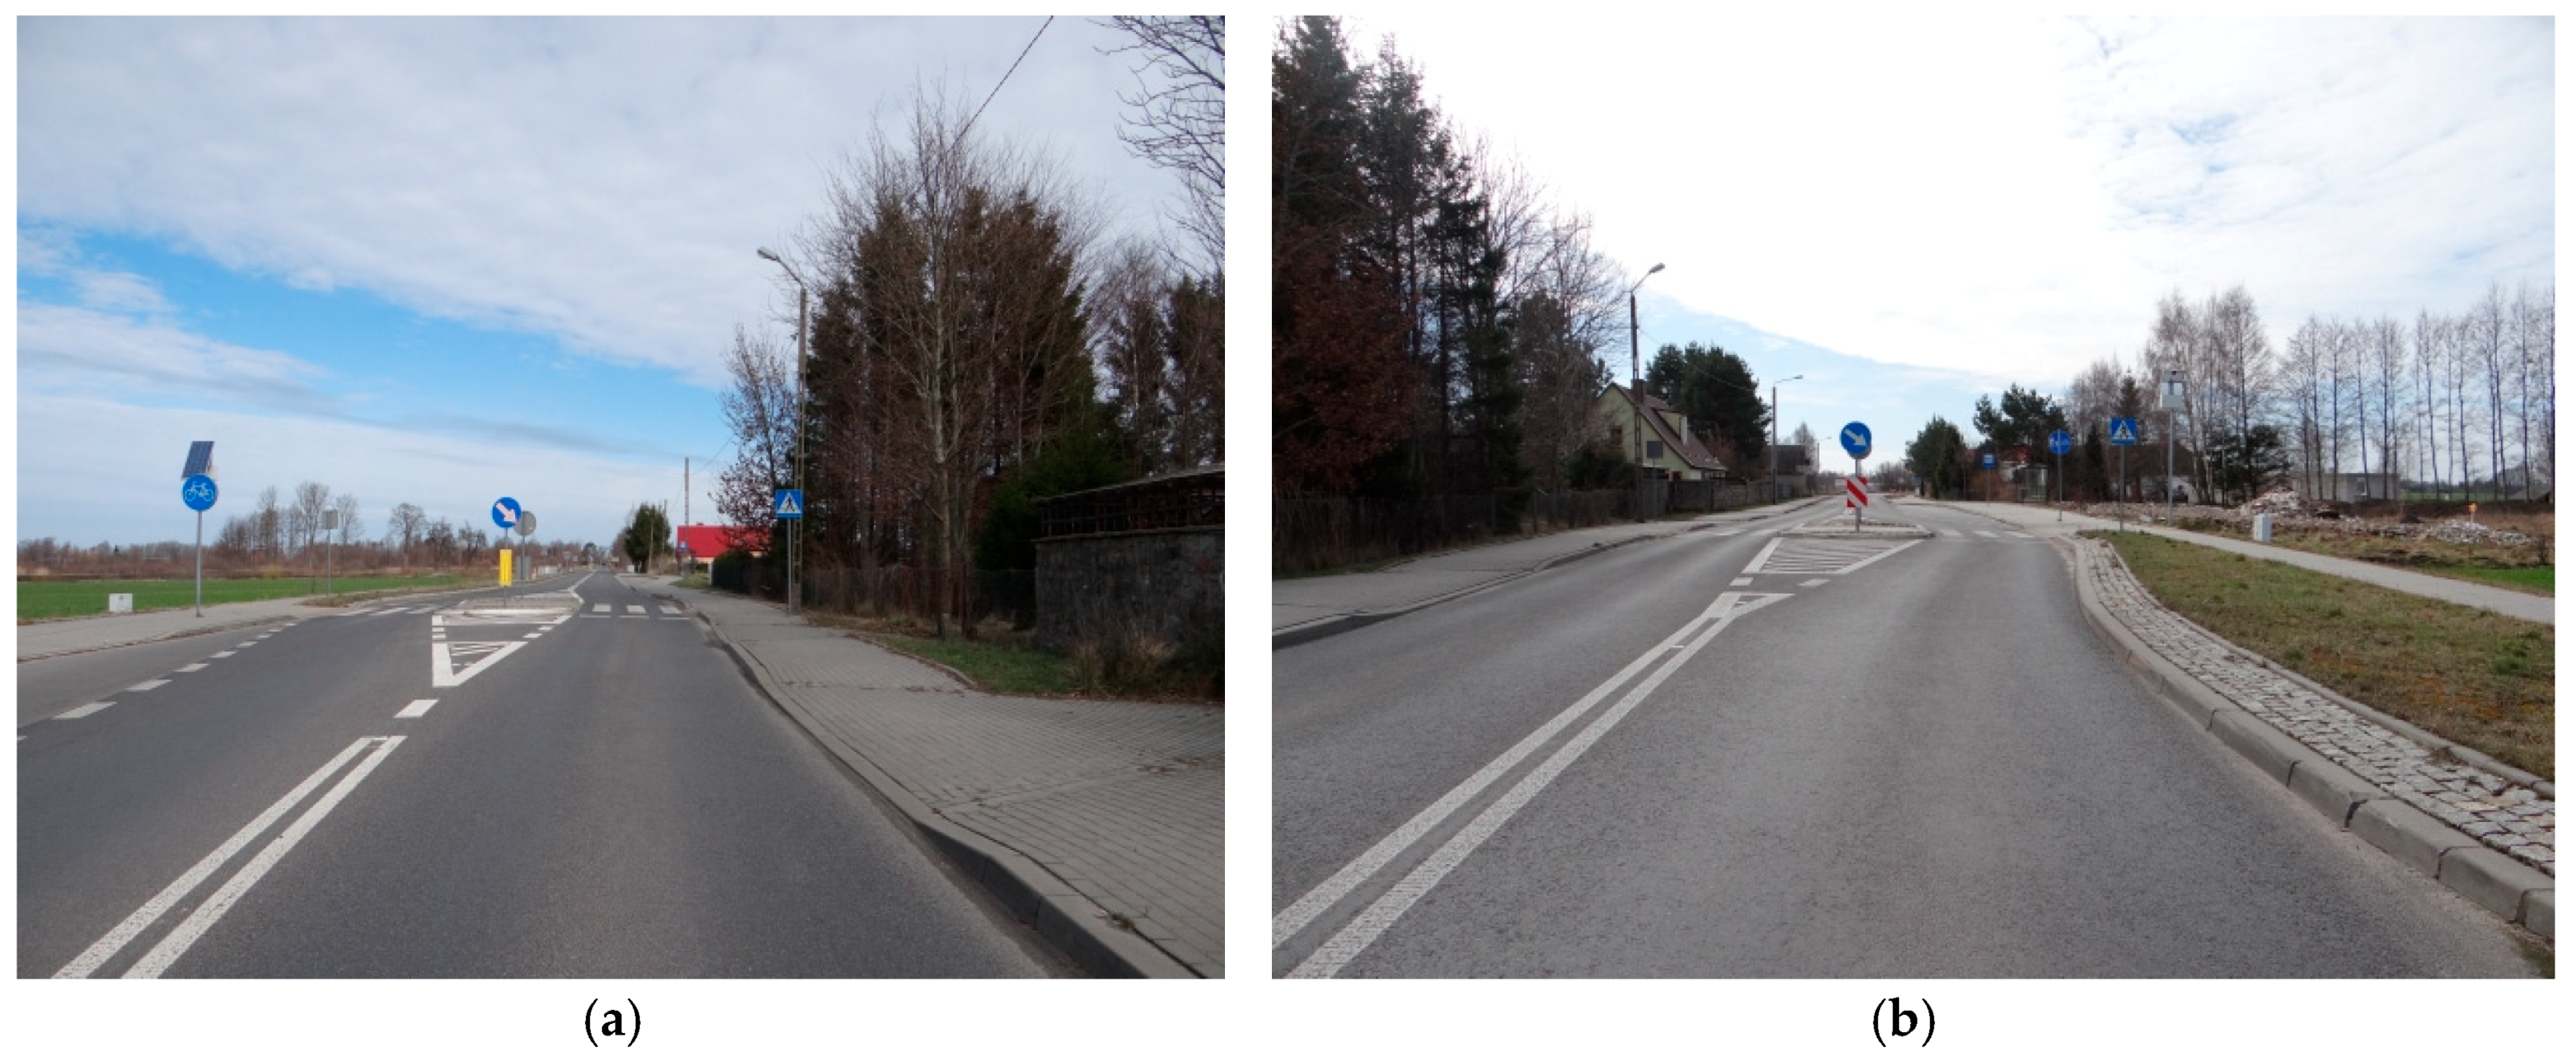
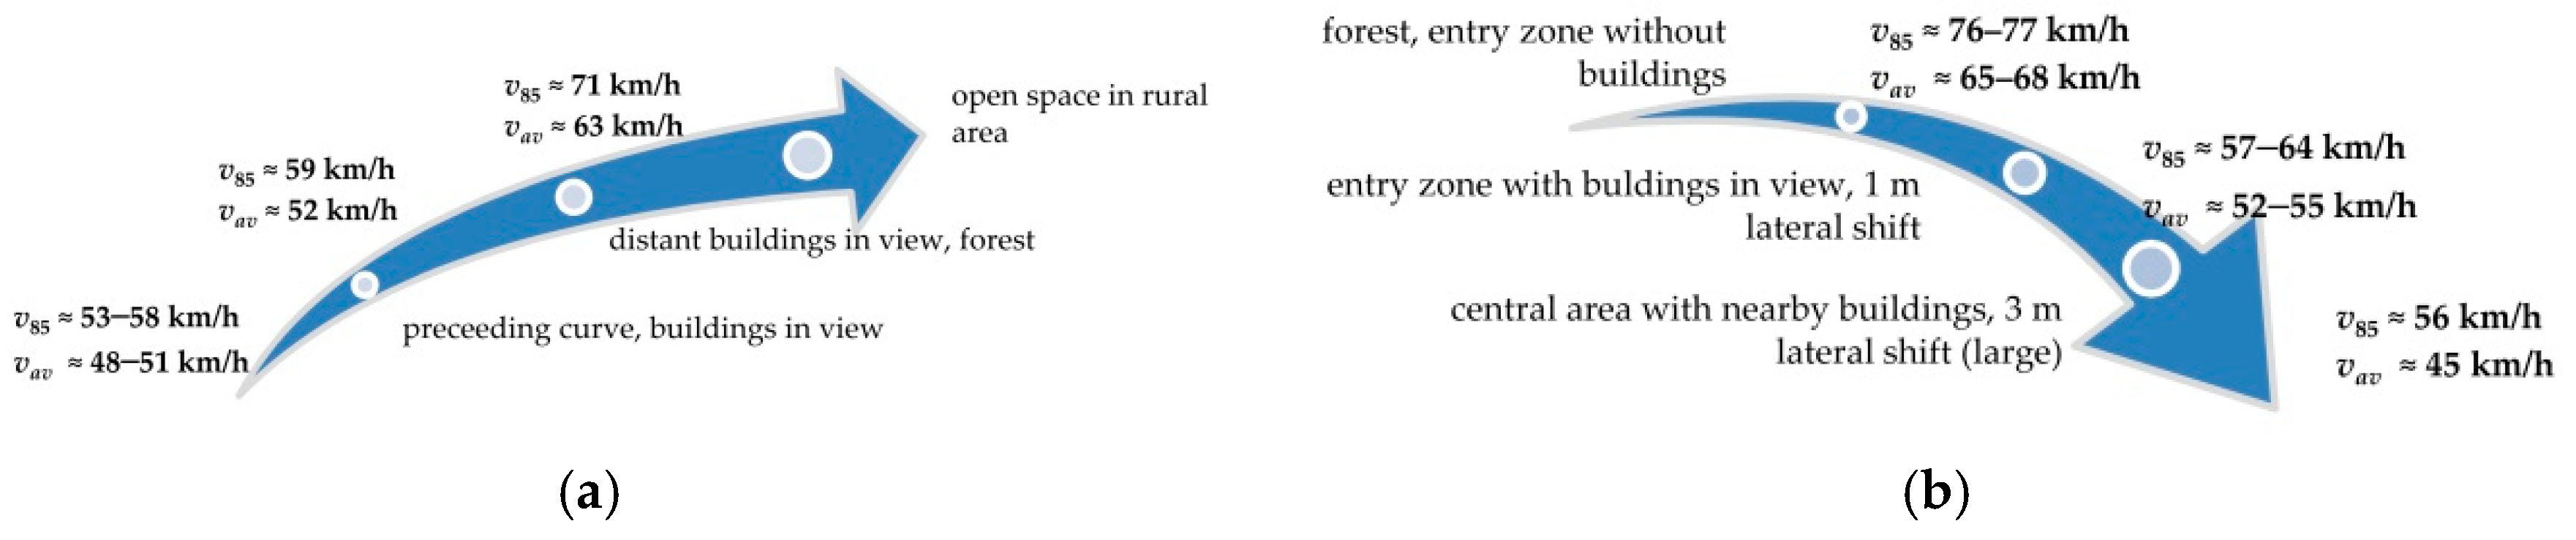
One of the analysed refuges was located on one side of the centreline and included a 2.5 m wide island (
Figure 5). It was situated between the end of the entry zone and the beginning of the village centre area with nearby buildings spaced 80 m away from the roadway edge. Hatched, 1:5 tapered markings were applied. The buildings were preceded by a bridge lined with a high curb and parapets being visible side obstacles. The bridge was followed by a curve to the right, that reduced the view of the further course of the road (
Figure 5a). Viewing in the departure direction, the bridge approach lane was close to the buildings in the village centre area and after the pedestrian refuge the road was surrounded by a forest without any buildings (
Figure 5b).
The last case was an unusual, asymmetric pedestrian refuge situated in the village centre area between two bus bays (
Figure 6). It included a 4 m wide asymmetric island. In the direction towards the bus bay the travel path is deflected by 1 m and there is a 1:15 tapered marking (
Figure 6a). With the nearby positioned open bus bay, the island was designed to impose a 3 m lateral shift and a 1:5 tapered marking was used (
Figure 6b). This arrangement resulted in a very sharp lateral deflection of traffic on the approach to the pedestrian refuge and a very convenient departure alignment with possible entering the open bus bay. Very good vision on the road ahead was ensured in both directions of travel.
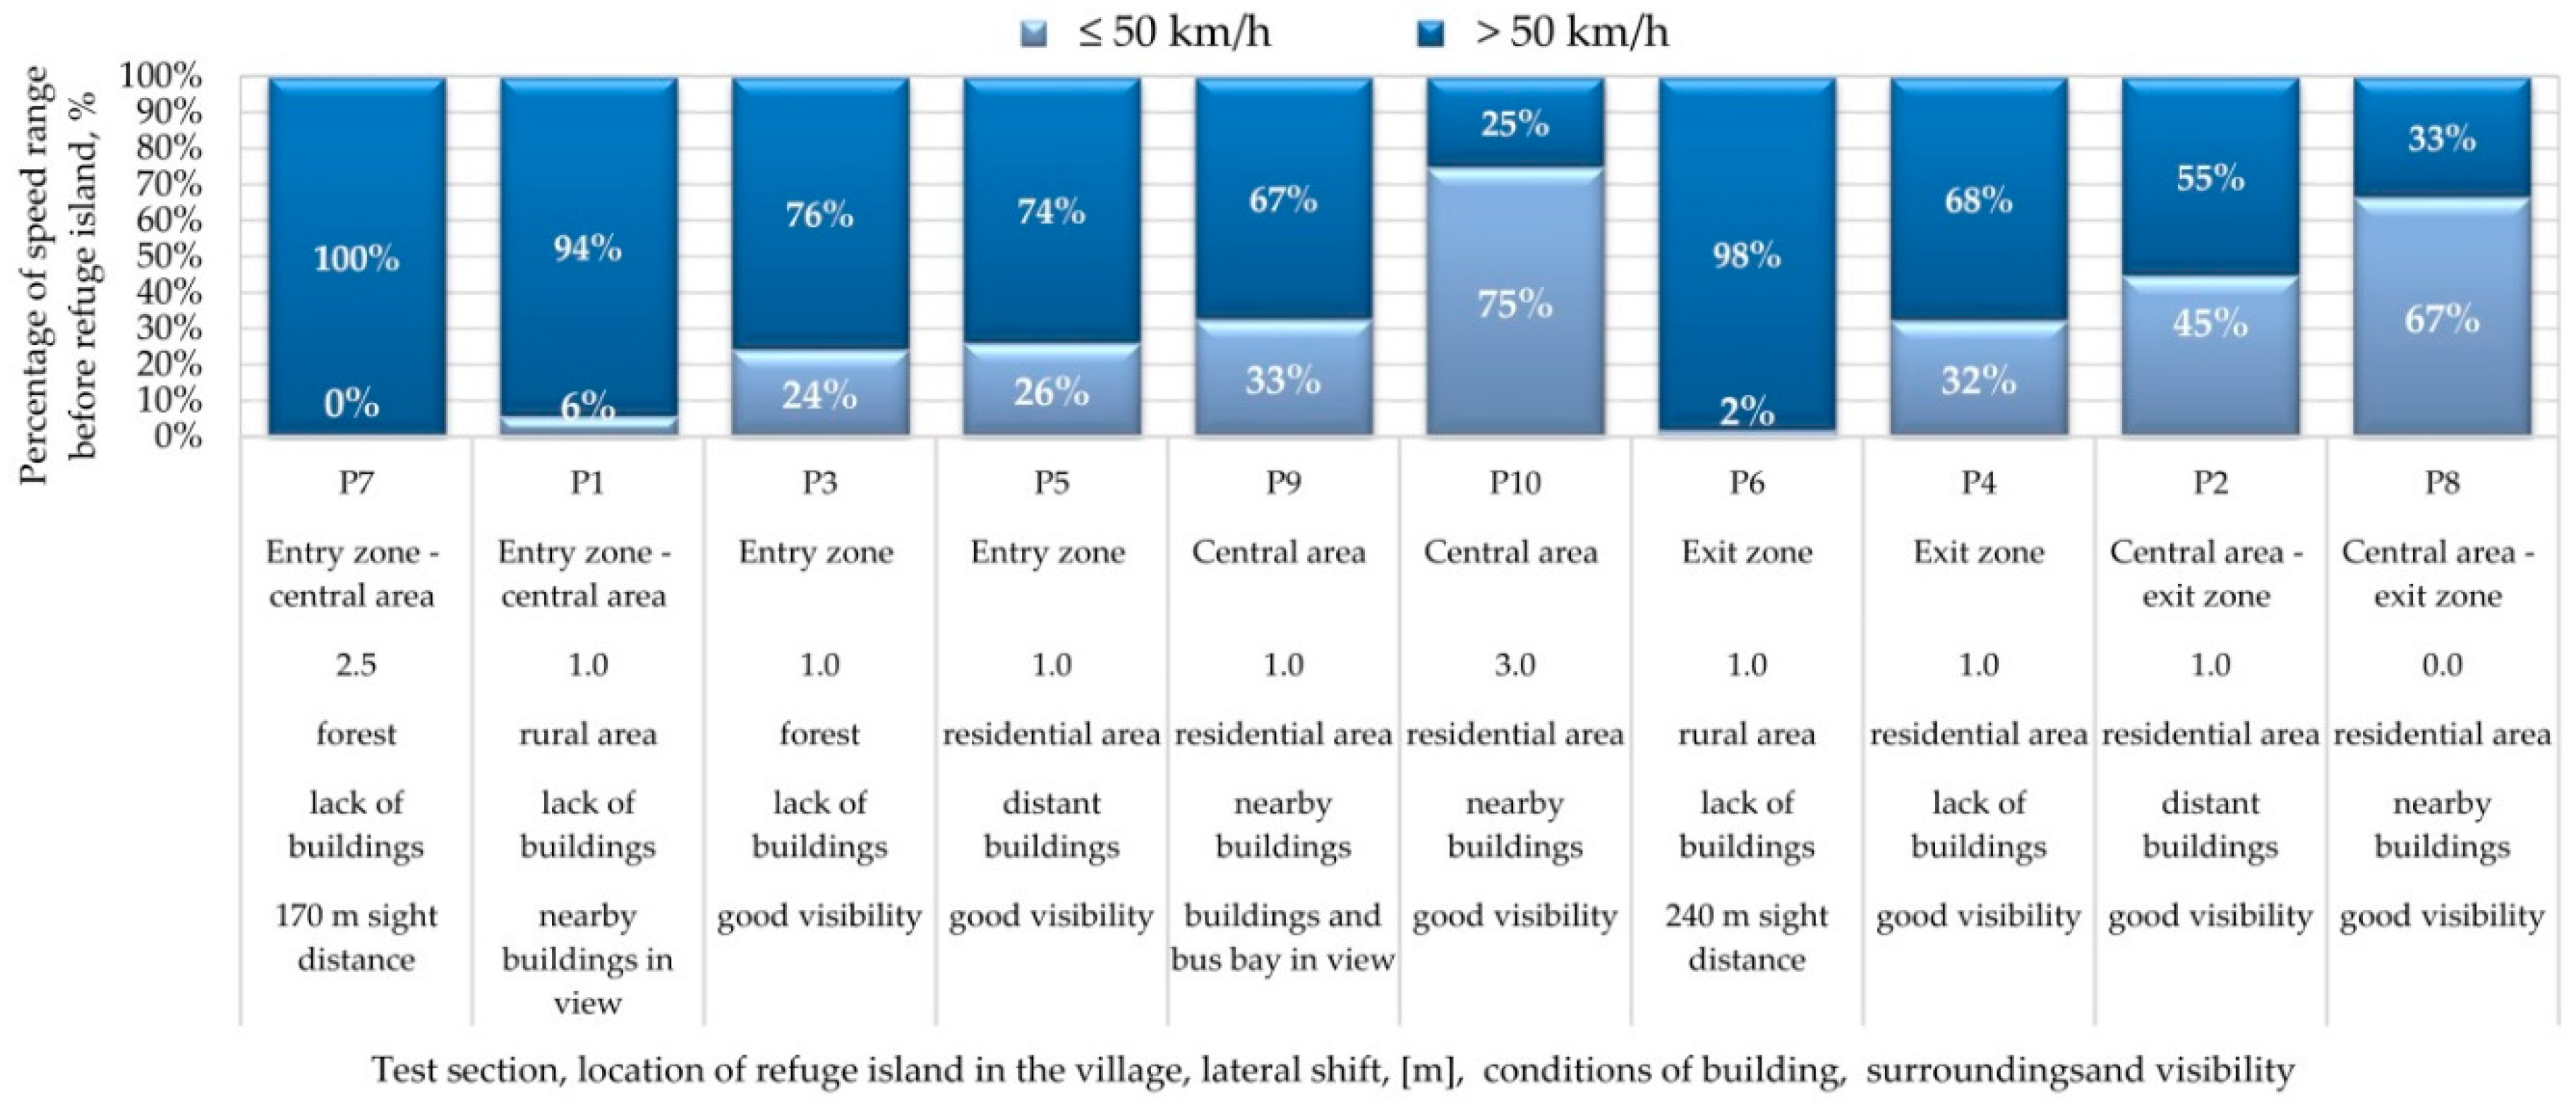
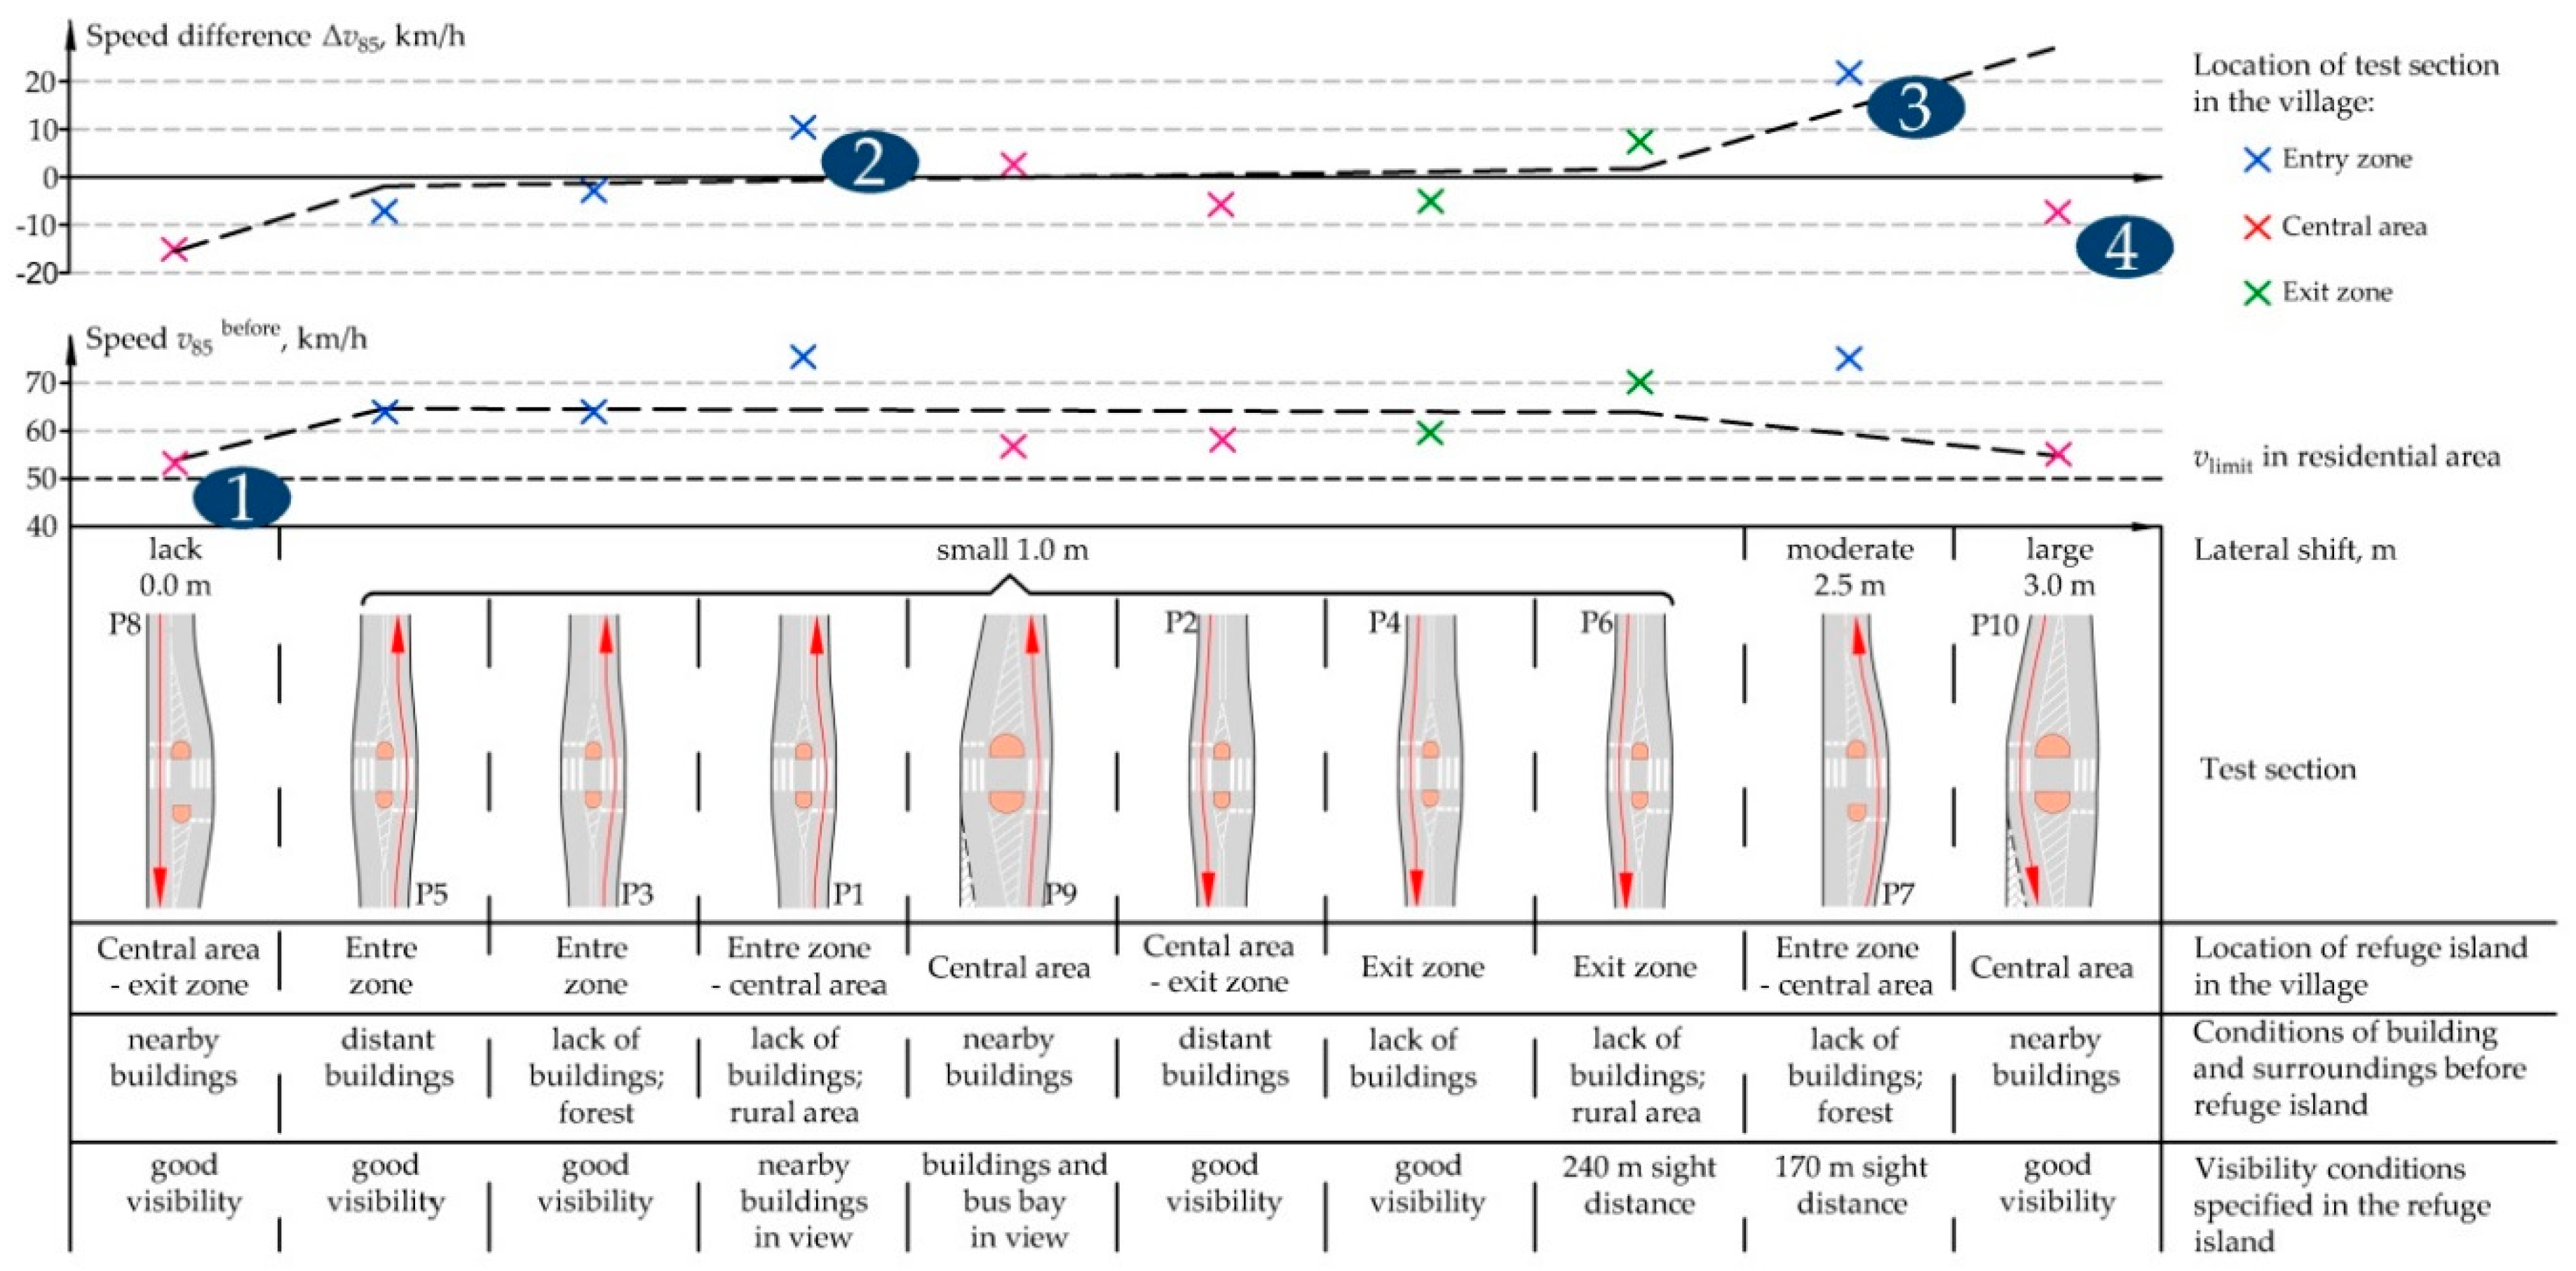
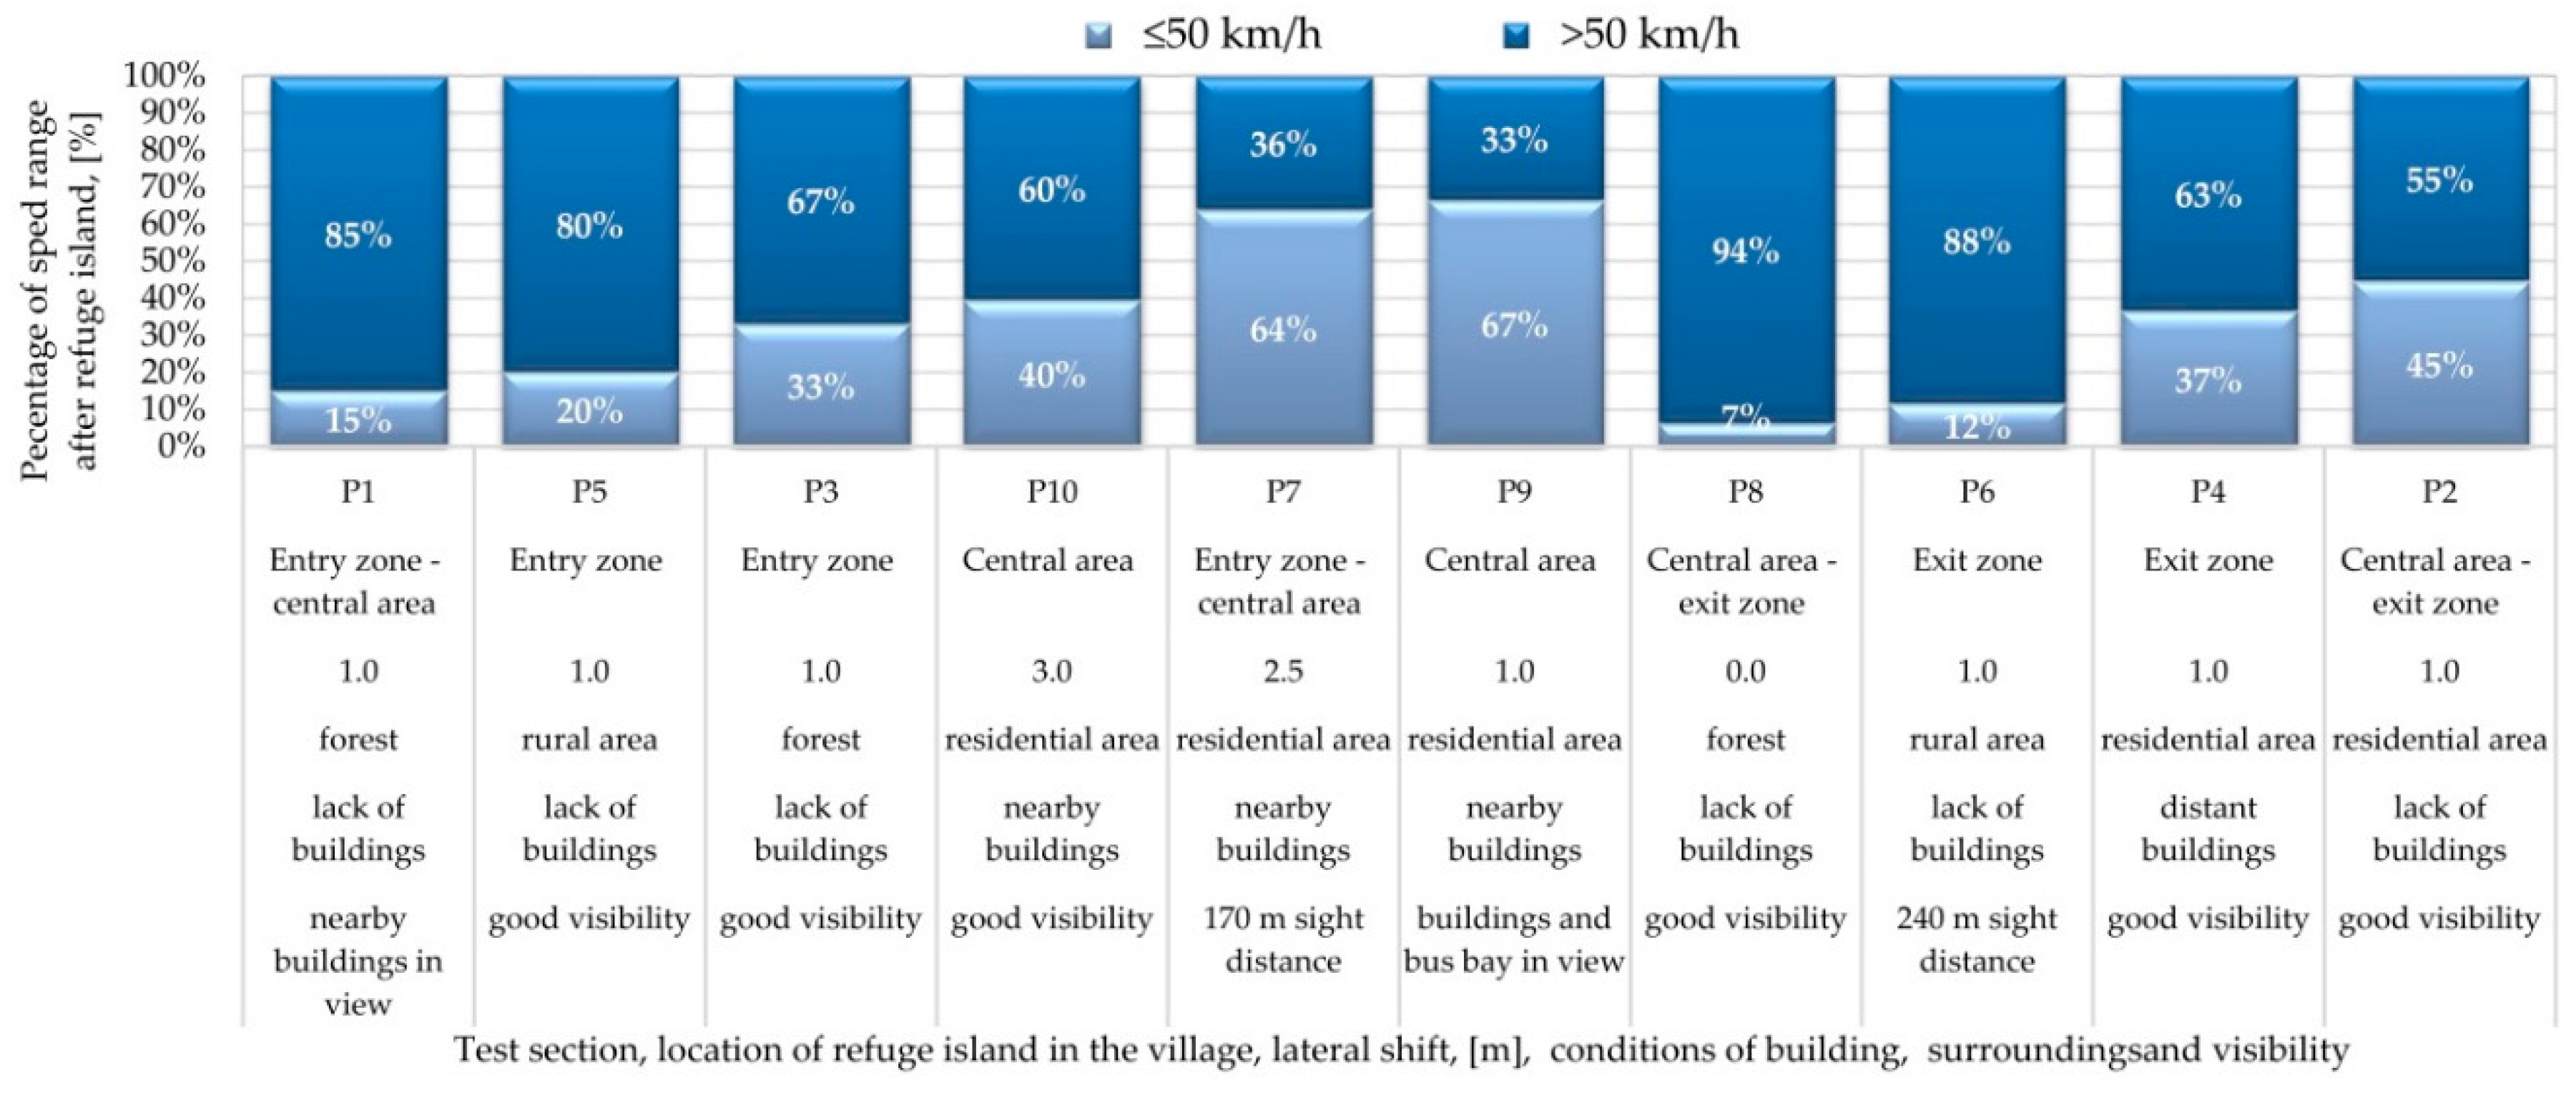
Table 1 compiles the surrounding environment and land characteristics and visibility conditions on the test sections before the pedestrian refuges and after the pedestrian refuges under analysis.
Wherever “before” appears in this article it designates a location (or locations) upstream of the island viewing in the direction of traffic.
Wherever “after” appears in this article it designates a location (or locations) downstream of the island viewing in the direction of traffic
4. Study Method
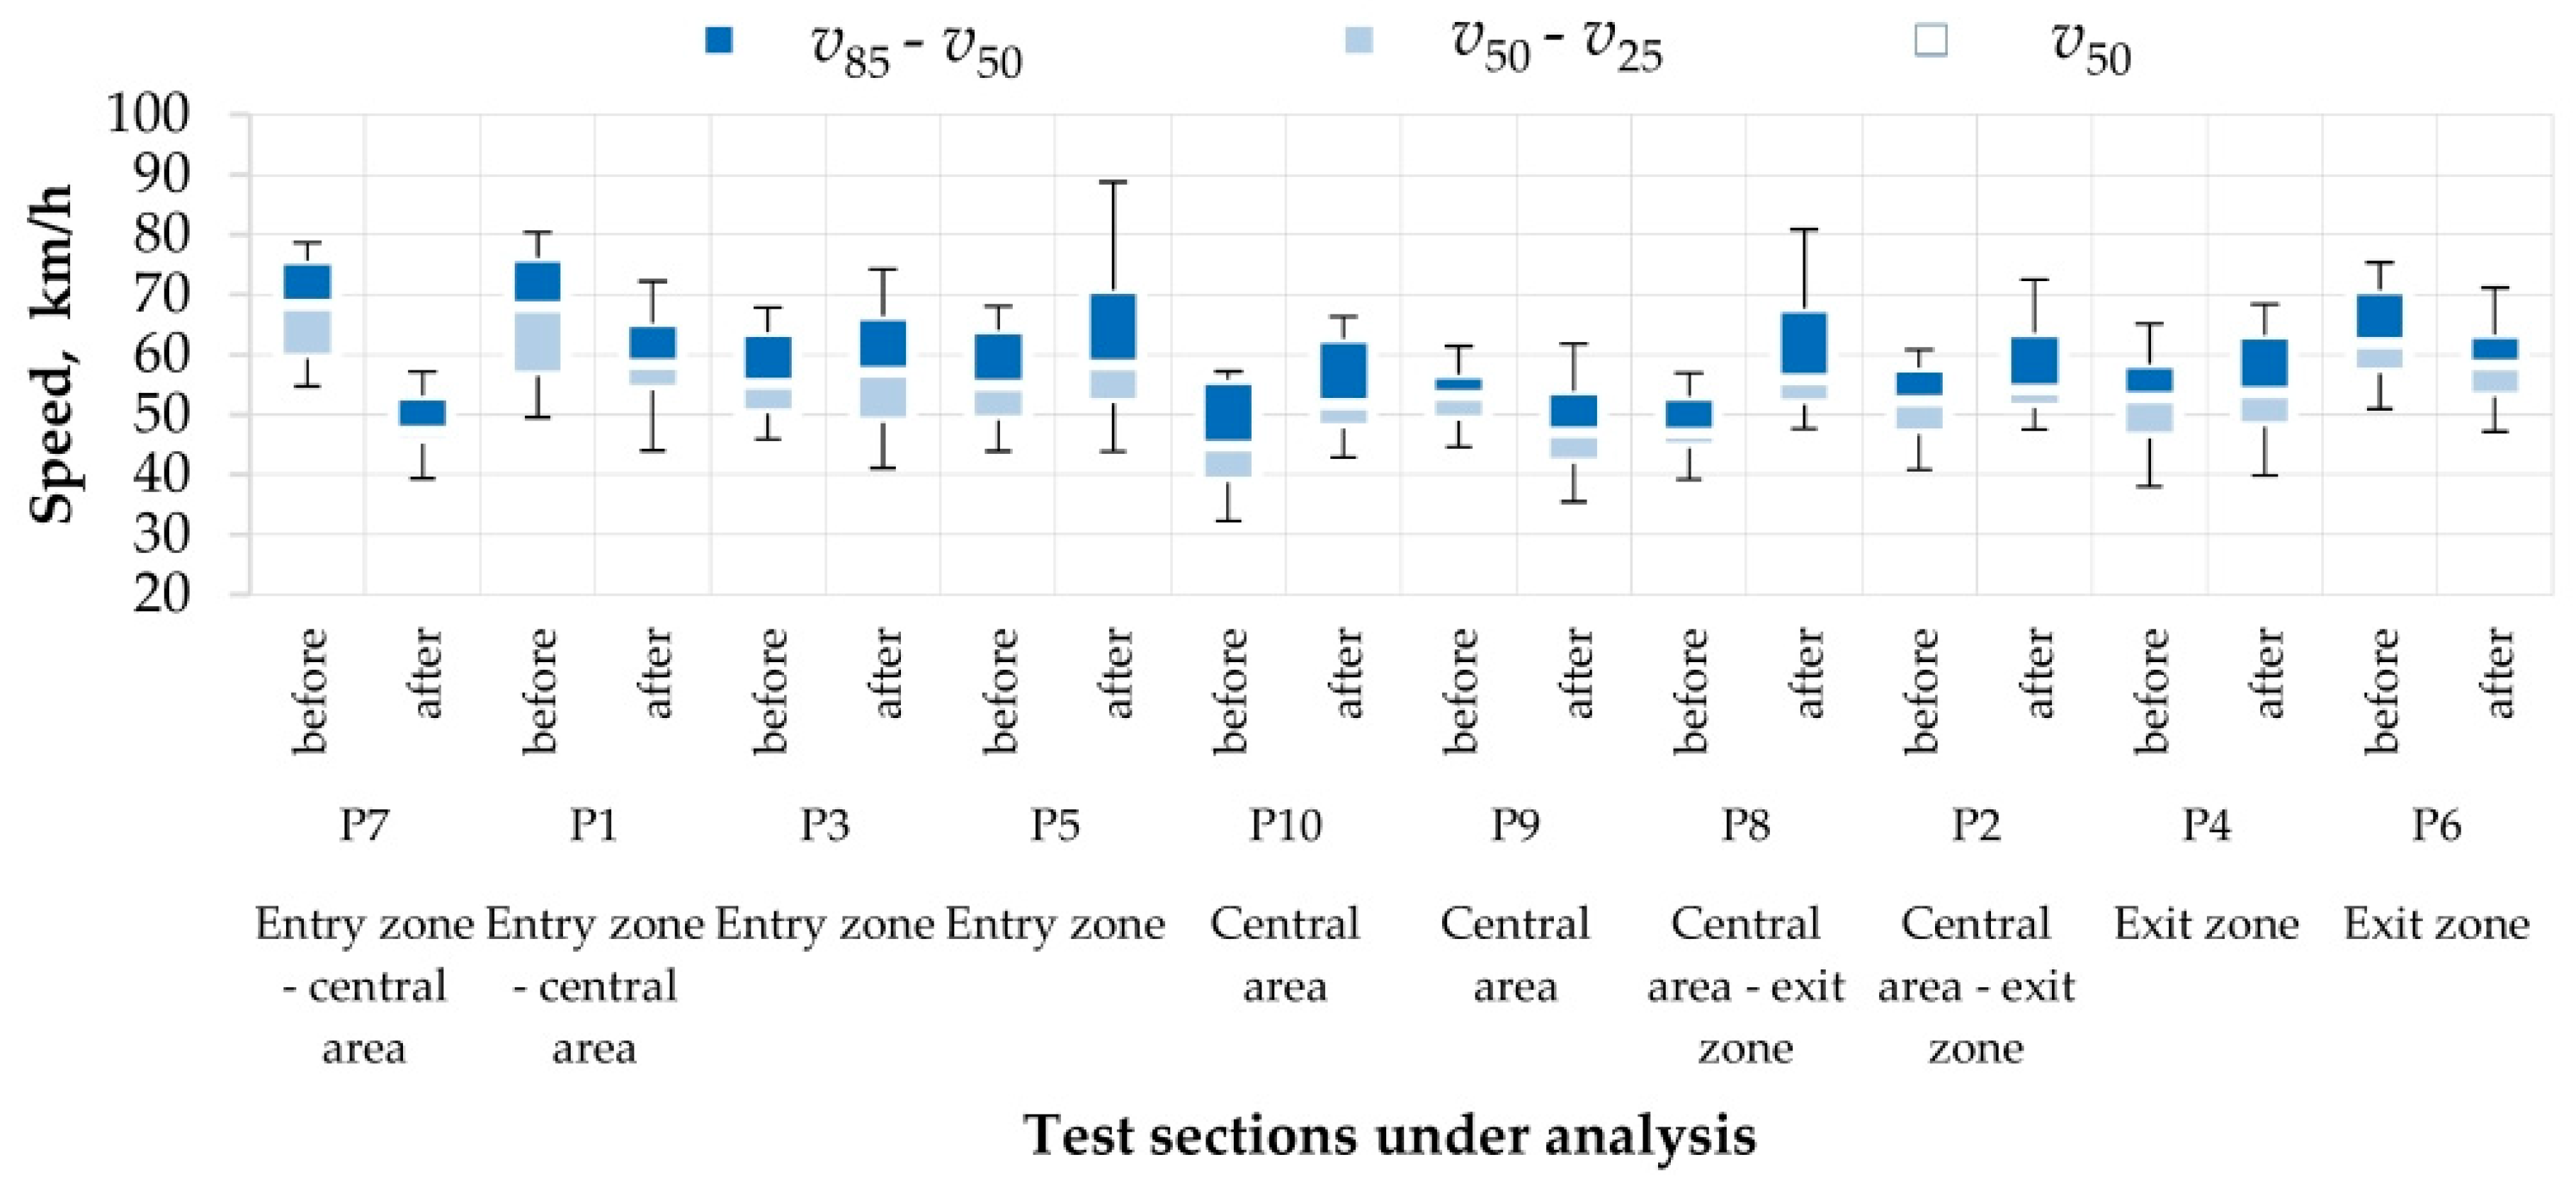
For all the test sections the speed readings were taken between 10:00–15:00 hrs. during weekday, including ca. 70 veh. in free-flow and up to 100 veh. in stable-flow (more congested) conditions. The equipment used both before and after the pedestrian refuges were synchronised SR4 traffic detection devices equipped with automatic speed data logging function (SR4—brand name of the devices used in the survey - Speed Displays Traffic Detection). Additionally, hourly traffic volumes were measured in each case, including determination of the percentages of heavy goods vehicles. The speed data were grouped by direction to calculate the 85th percentile speed
v85, average free-flow speed
vav and stable-flow speed
vavpp and also the before/after speed difference Δ
v and, finally, the speed variation ratio
up = ∆
vbefore–after/
vbefore in %. The calculation results are presented in
Table 2.
The measurement data were subjected to statistical inference. After conventional parametric tests, normality of distribution of the respective data sets was assessed with Kolmogorov-Smirnov test and the ranges of results were confirmed with homogeneity tests to remove outliers. The Kolmogorov-Smirnov (K-S) test,
χ2 independence test and,
χ2 median test were carried out for the whole data set comprising the upstream and downstream speeds to check if they belong to one or two different populations. The results of the statistical tests performed on the upstream and downstream speeds are presented in
Table 3.
The values in boldface in
Table 3 are the non-positive results of statistical tests, which do not support rejection of null hypothesis
H0 that the tested features i.e., upstream and downstream speeds belong to the same population.
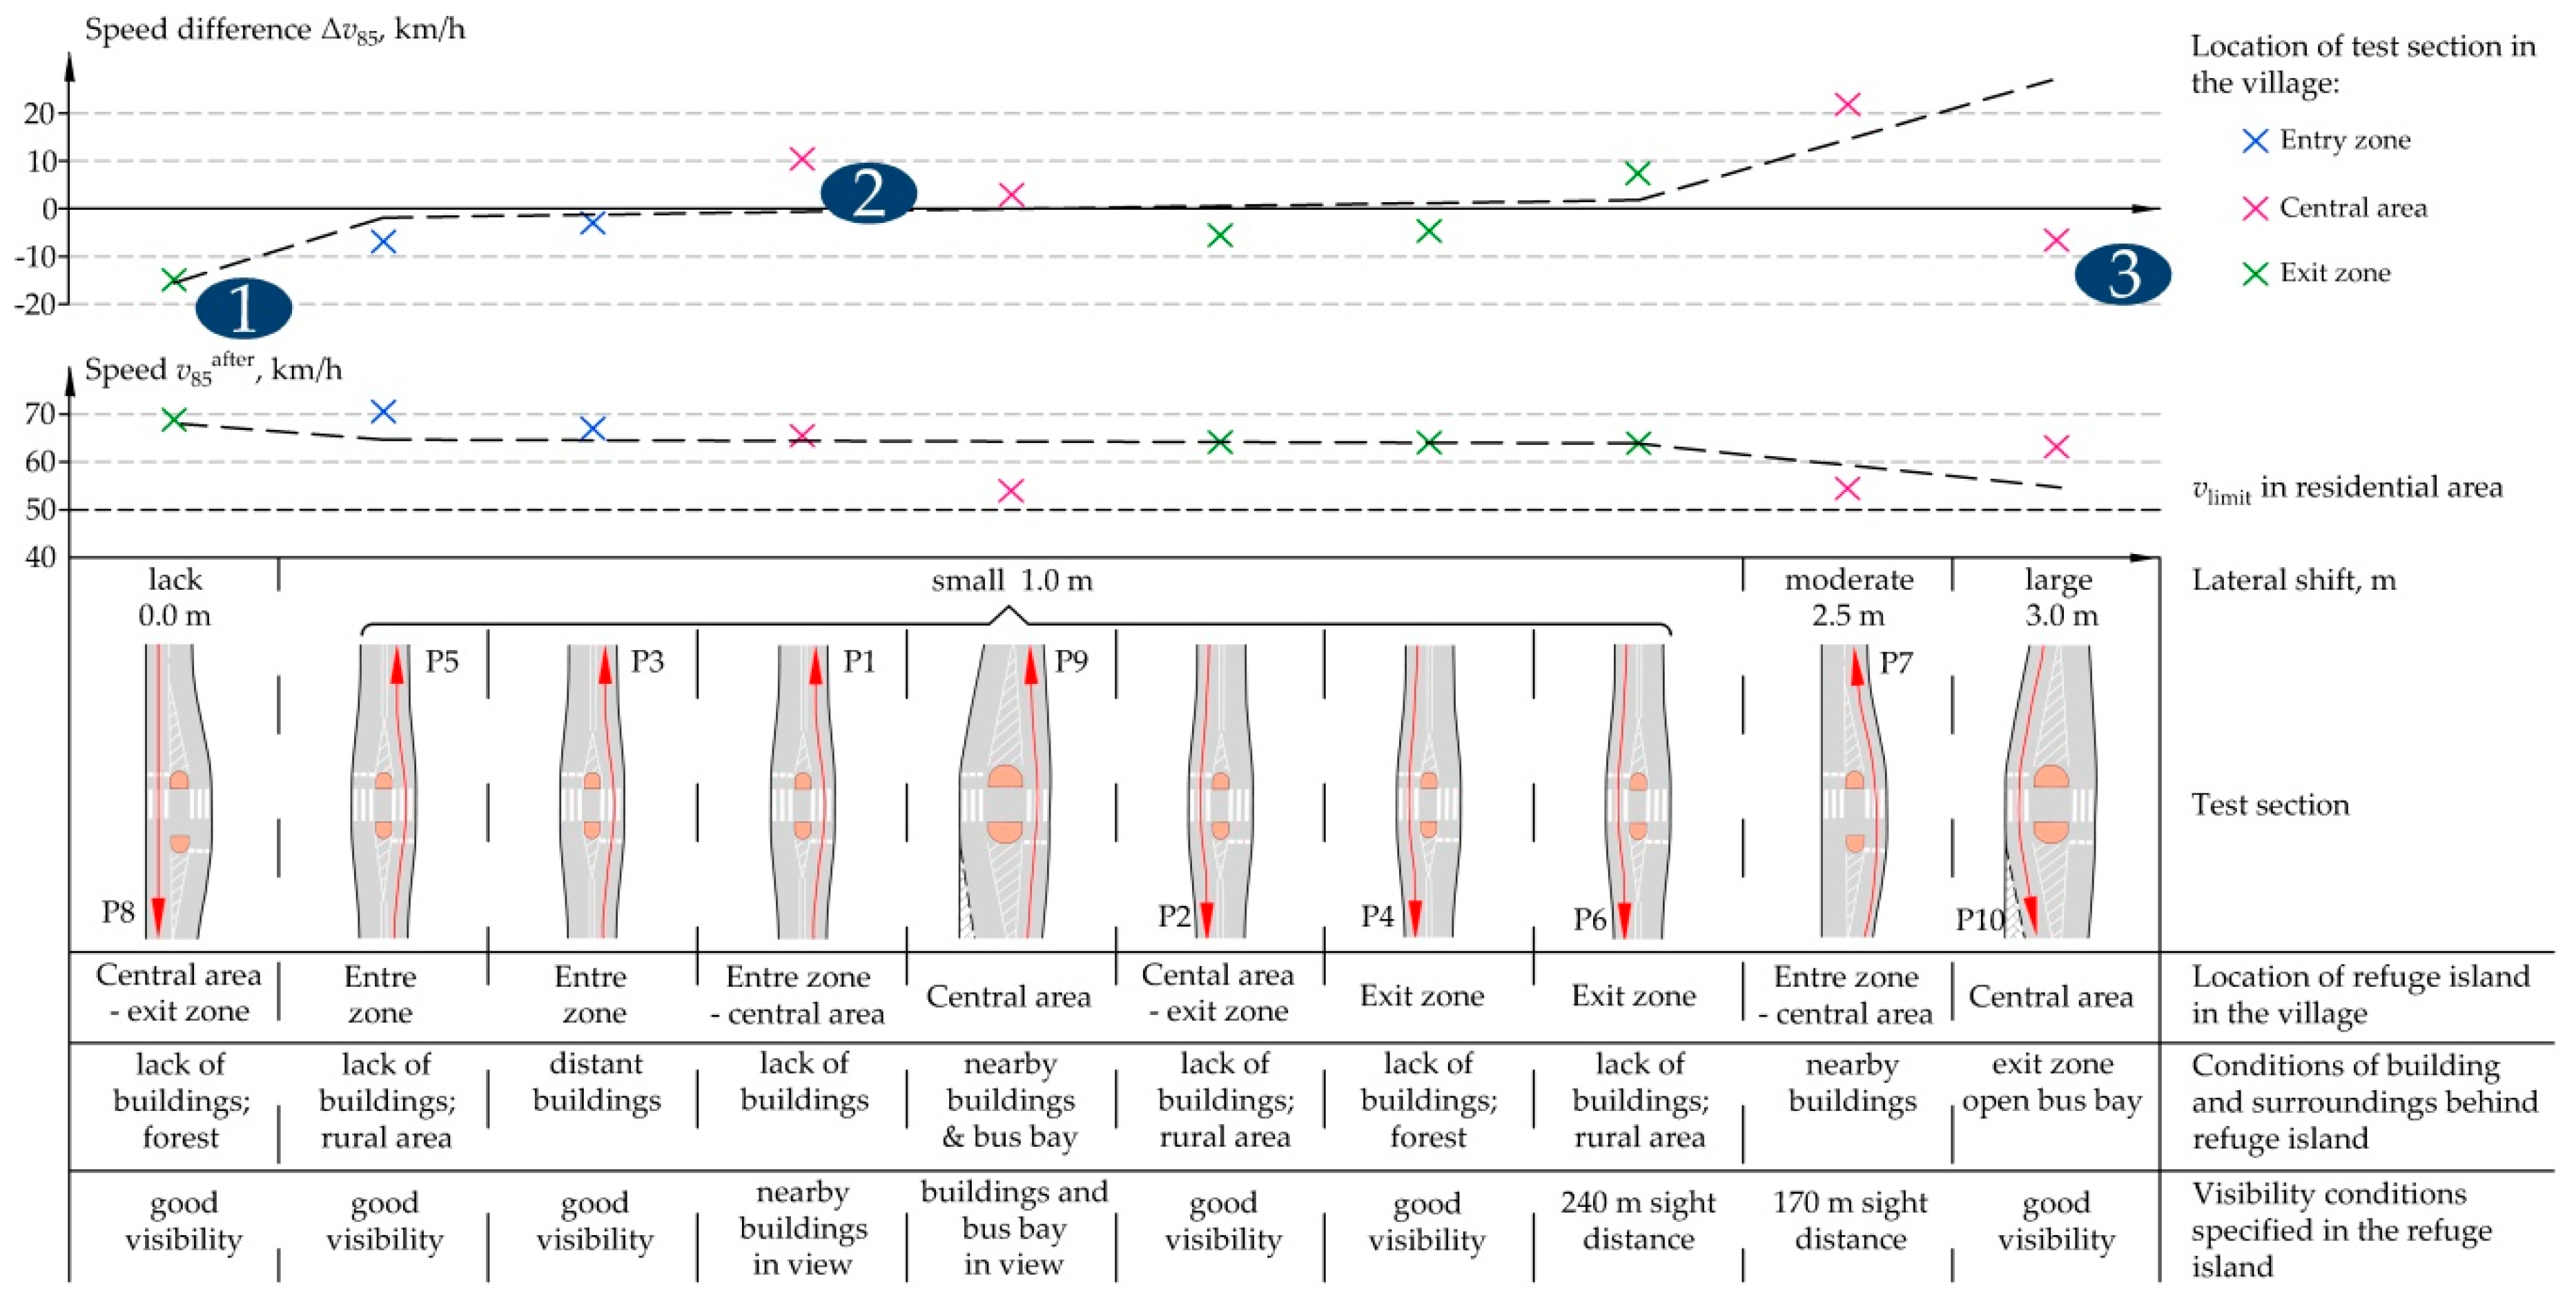
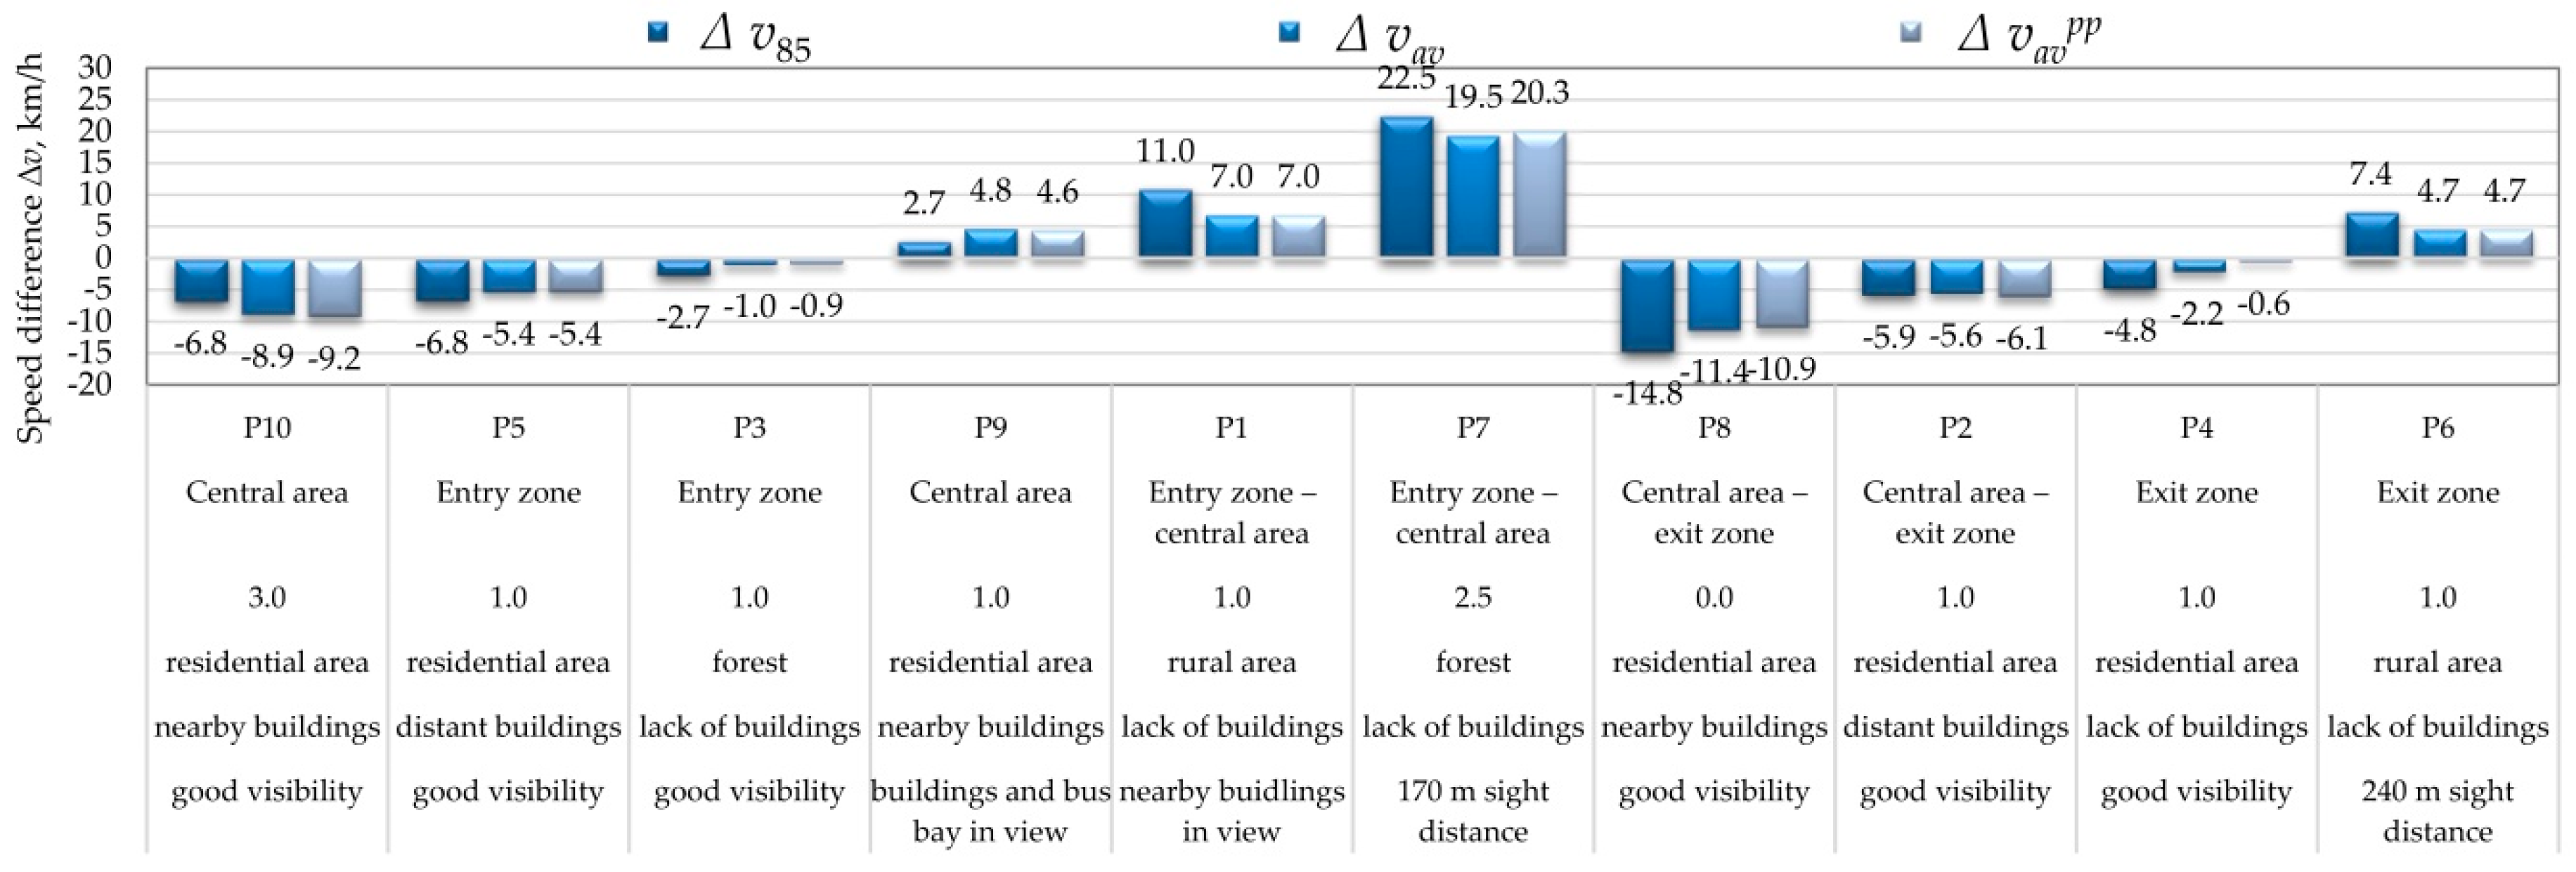
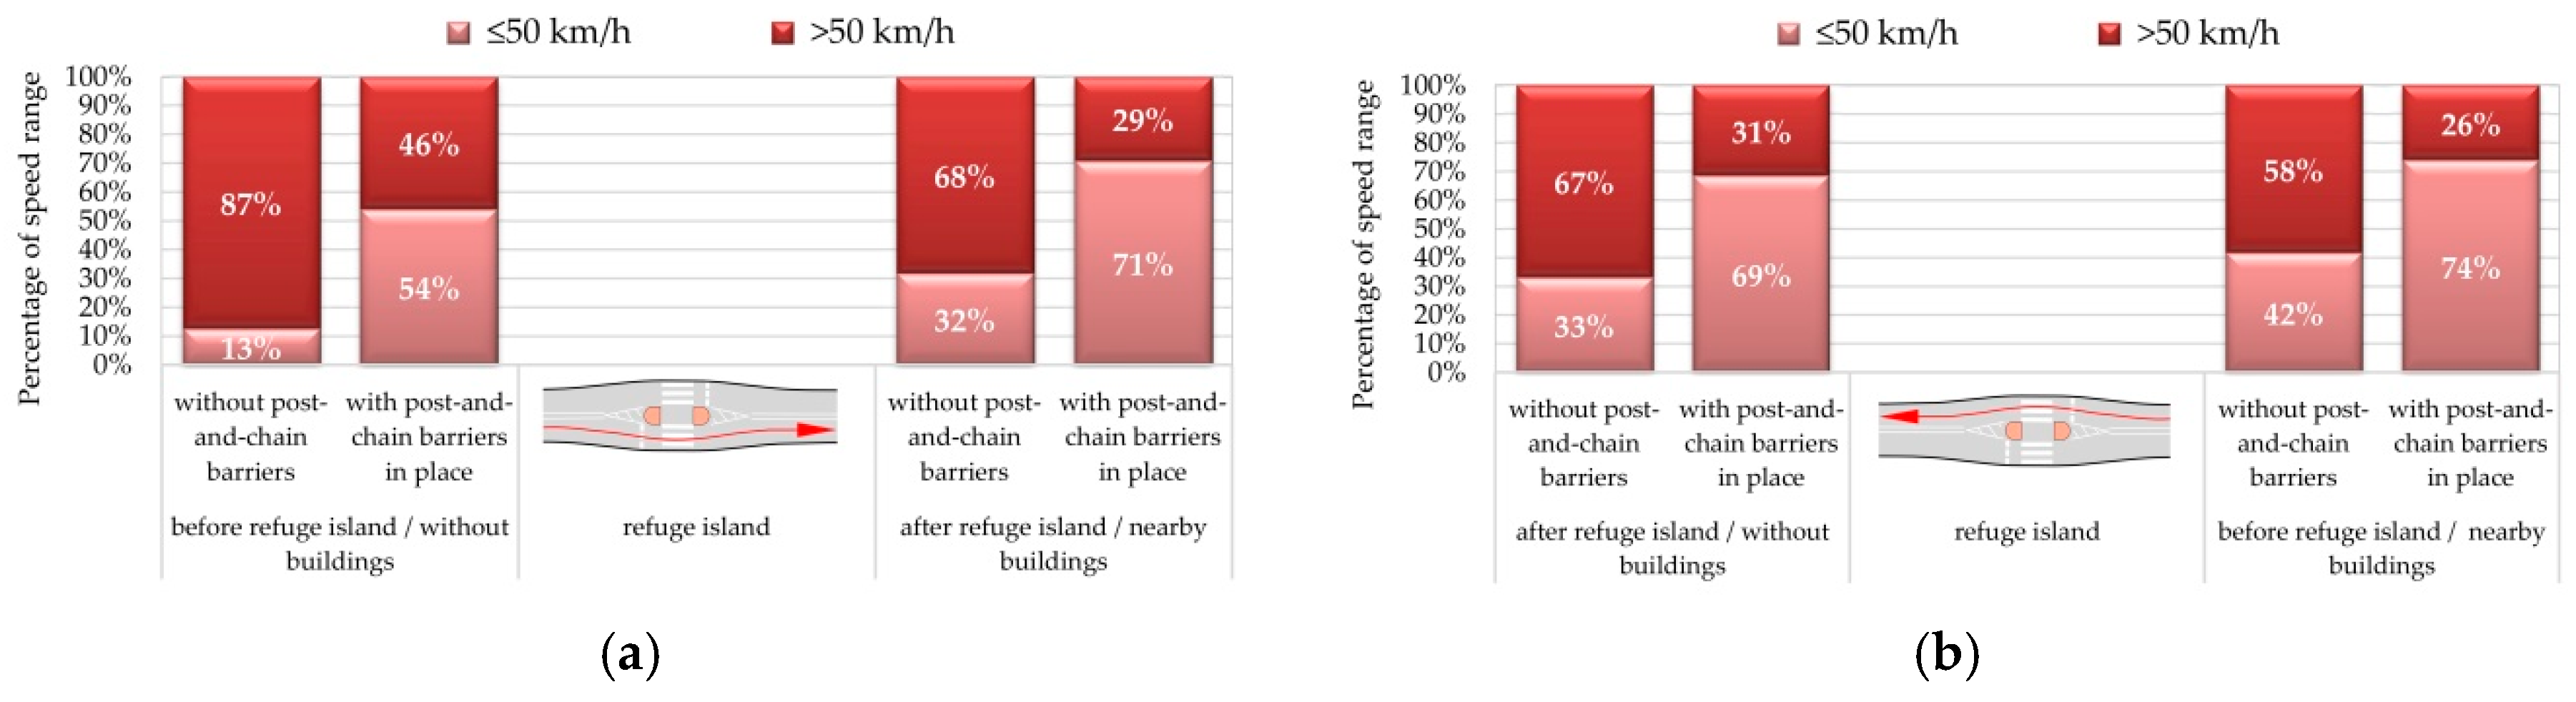
According to the results of statistical tests compiled in
Table 3, in some cases we deal with different populations. In the case of the effect of pedestrian refuges on the upstream and downstream speeds the results of statistical tests for free-flow and stable-flow traffic conditions were not always the same. Also, for the same type of traffic, the results of the respective statistical tests were heterogeneous. Such test results can be attributed to various factors influencing the motorists’ behaviour in free-flow and stable-flow traffic. In order to enhance perceptions of the results, in
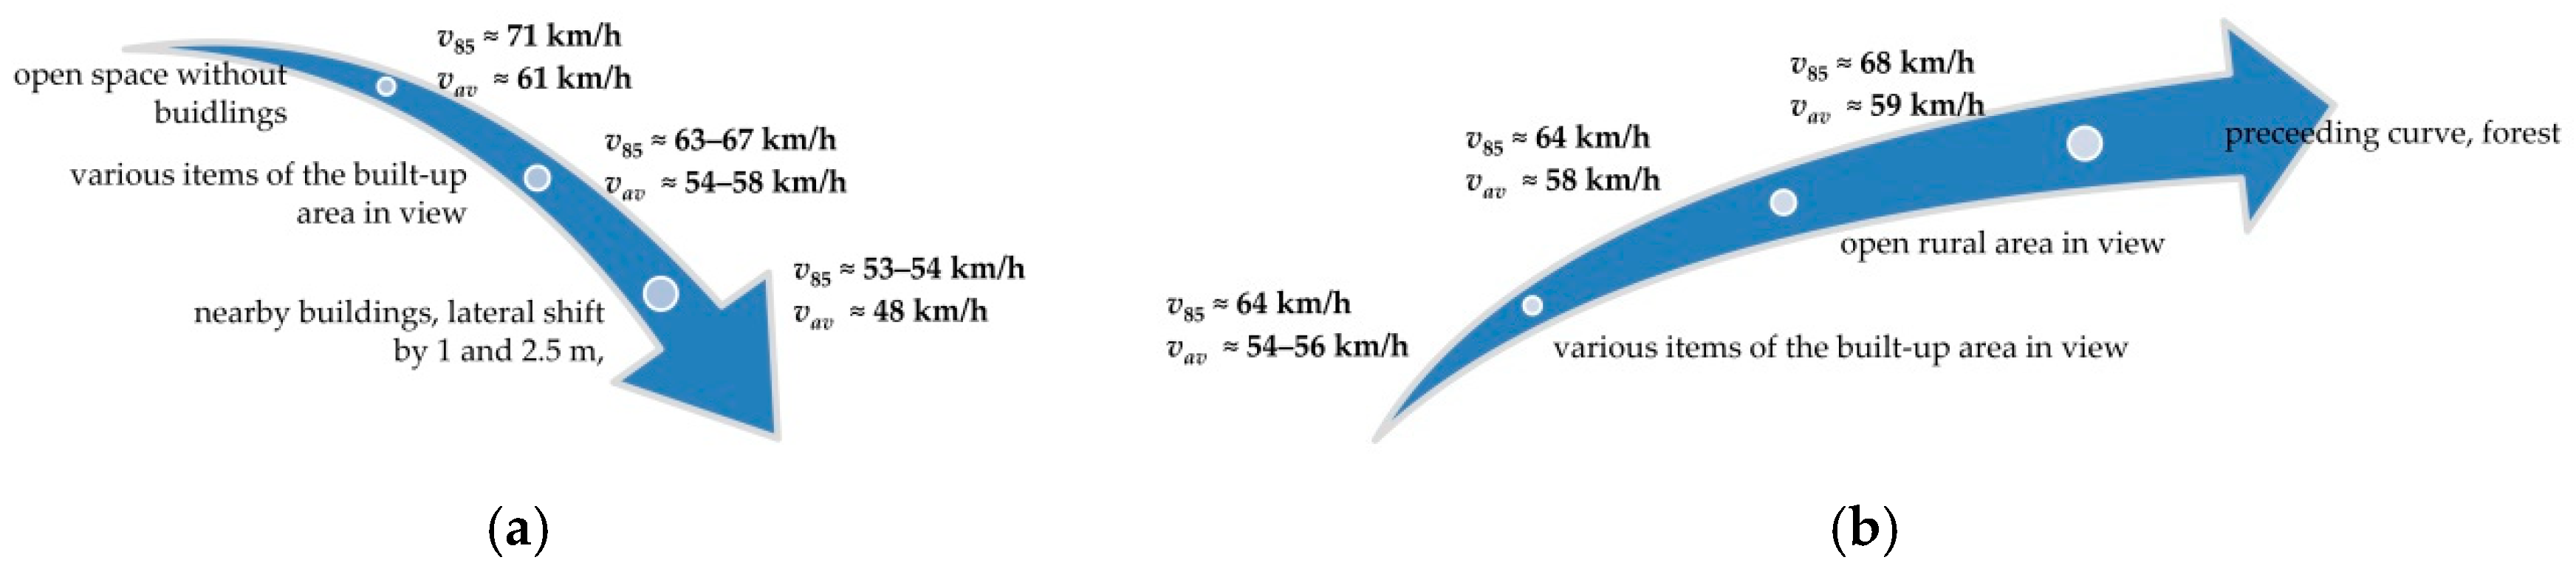
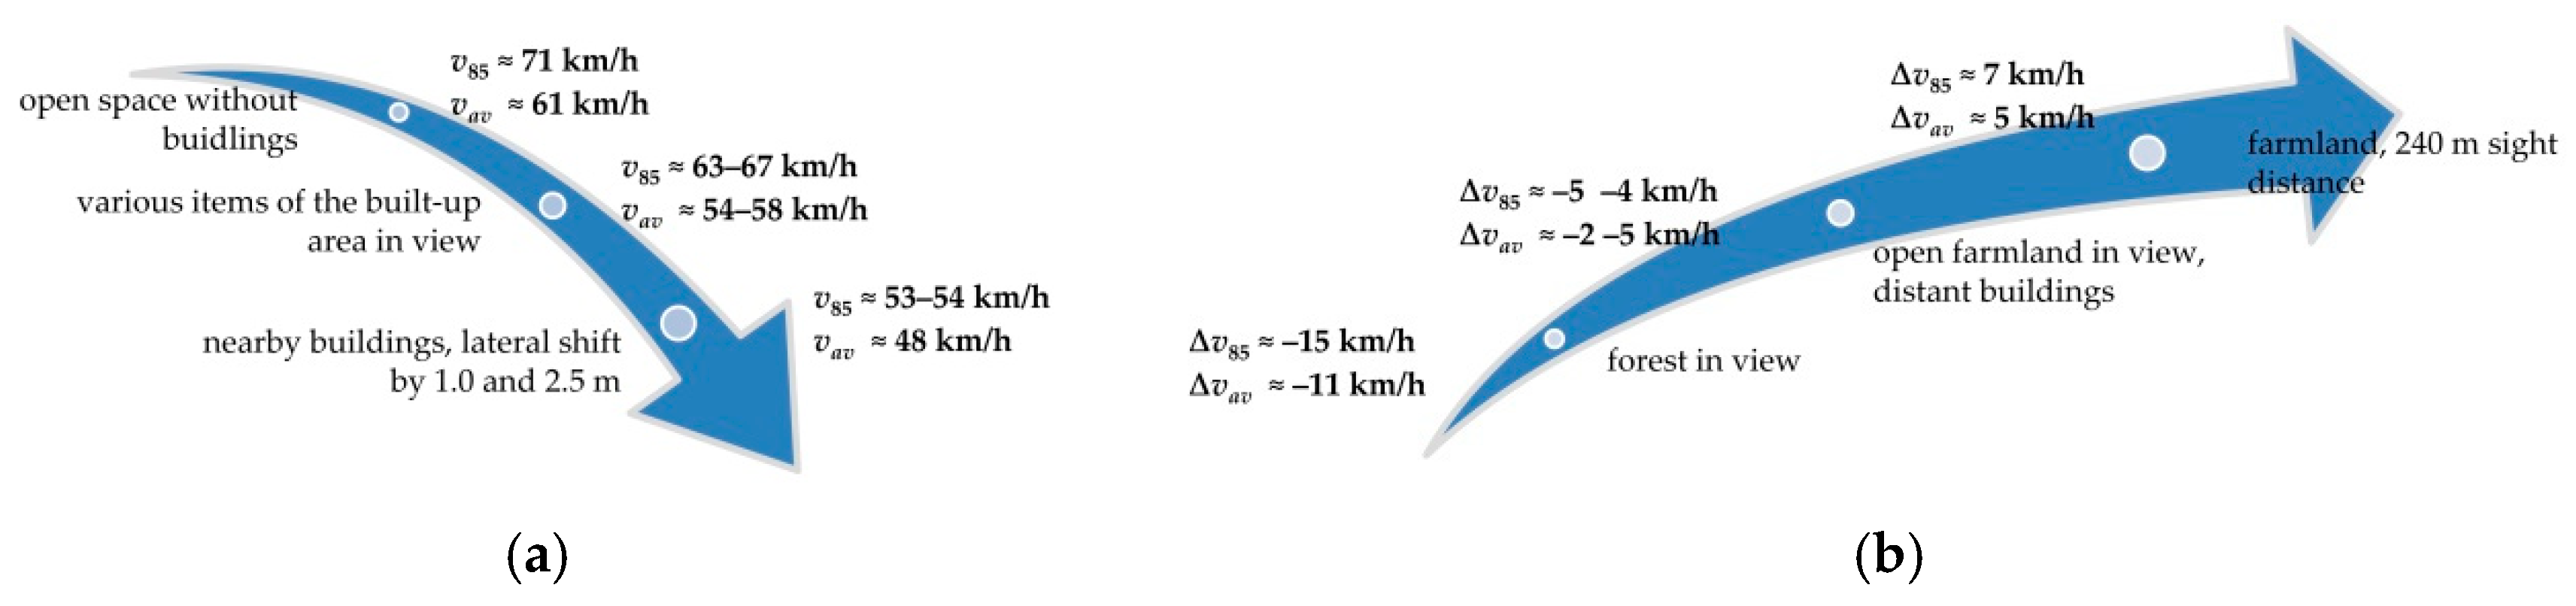
Figure 7 they are presented in relation to different speed percentiles and distribution bars in the order of sitting along the road stretch in the village. The analysis of the data presented in
Table 3 and in
Figure 7 showed that there are a number of factors, in addition to the geometric parameters of the pedestrian refuge, that can have a bearing on the vehicle speeds, including positioning along the road stretch, type of the surrounding environment, distance to the nearest buildings and view of the road ahead. Therefore, a number of different factors will be taken into account in the analysis of the traffic-calming effect of pedestrian refuges using the methodology presented in
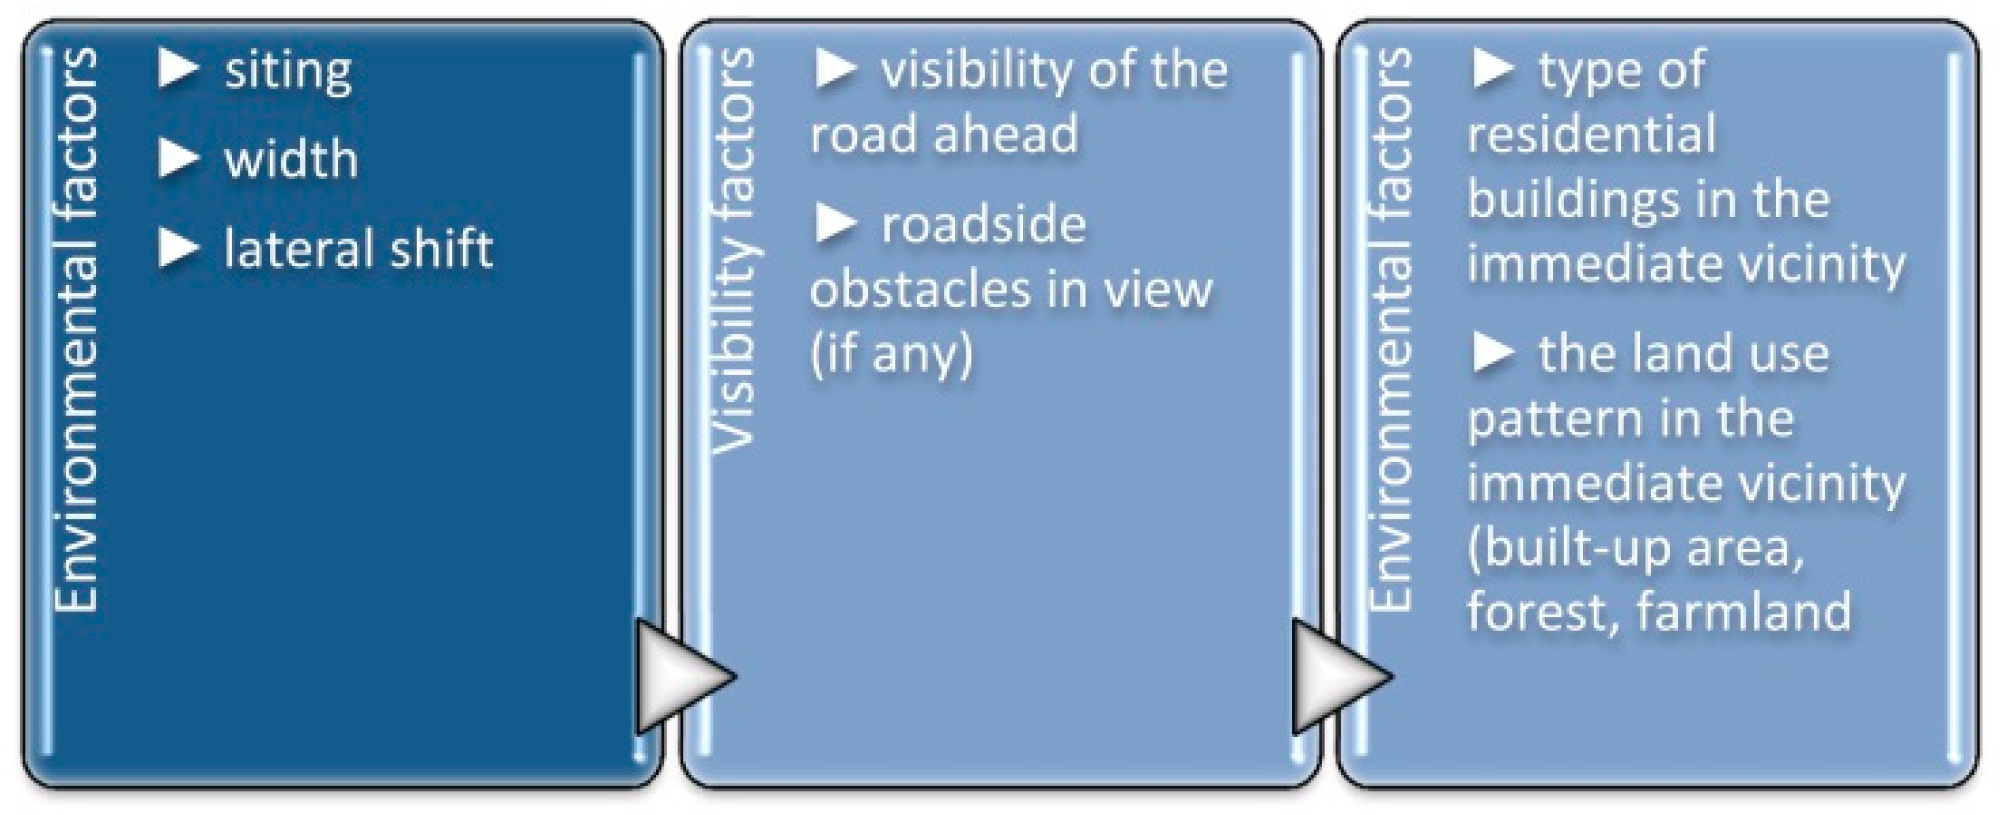
Figure 8 to determine the probable main determinants of the calculated speeds and their reduction.
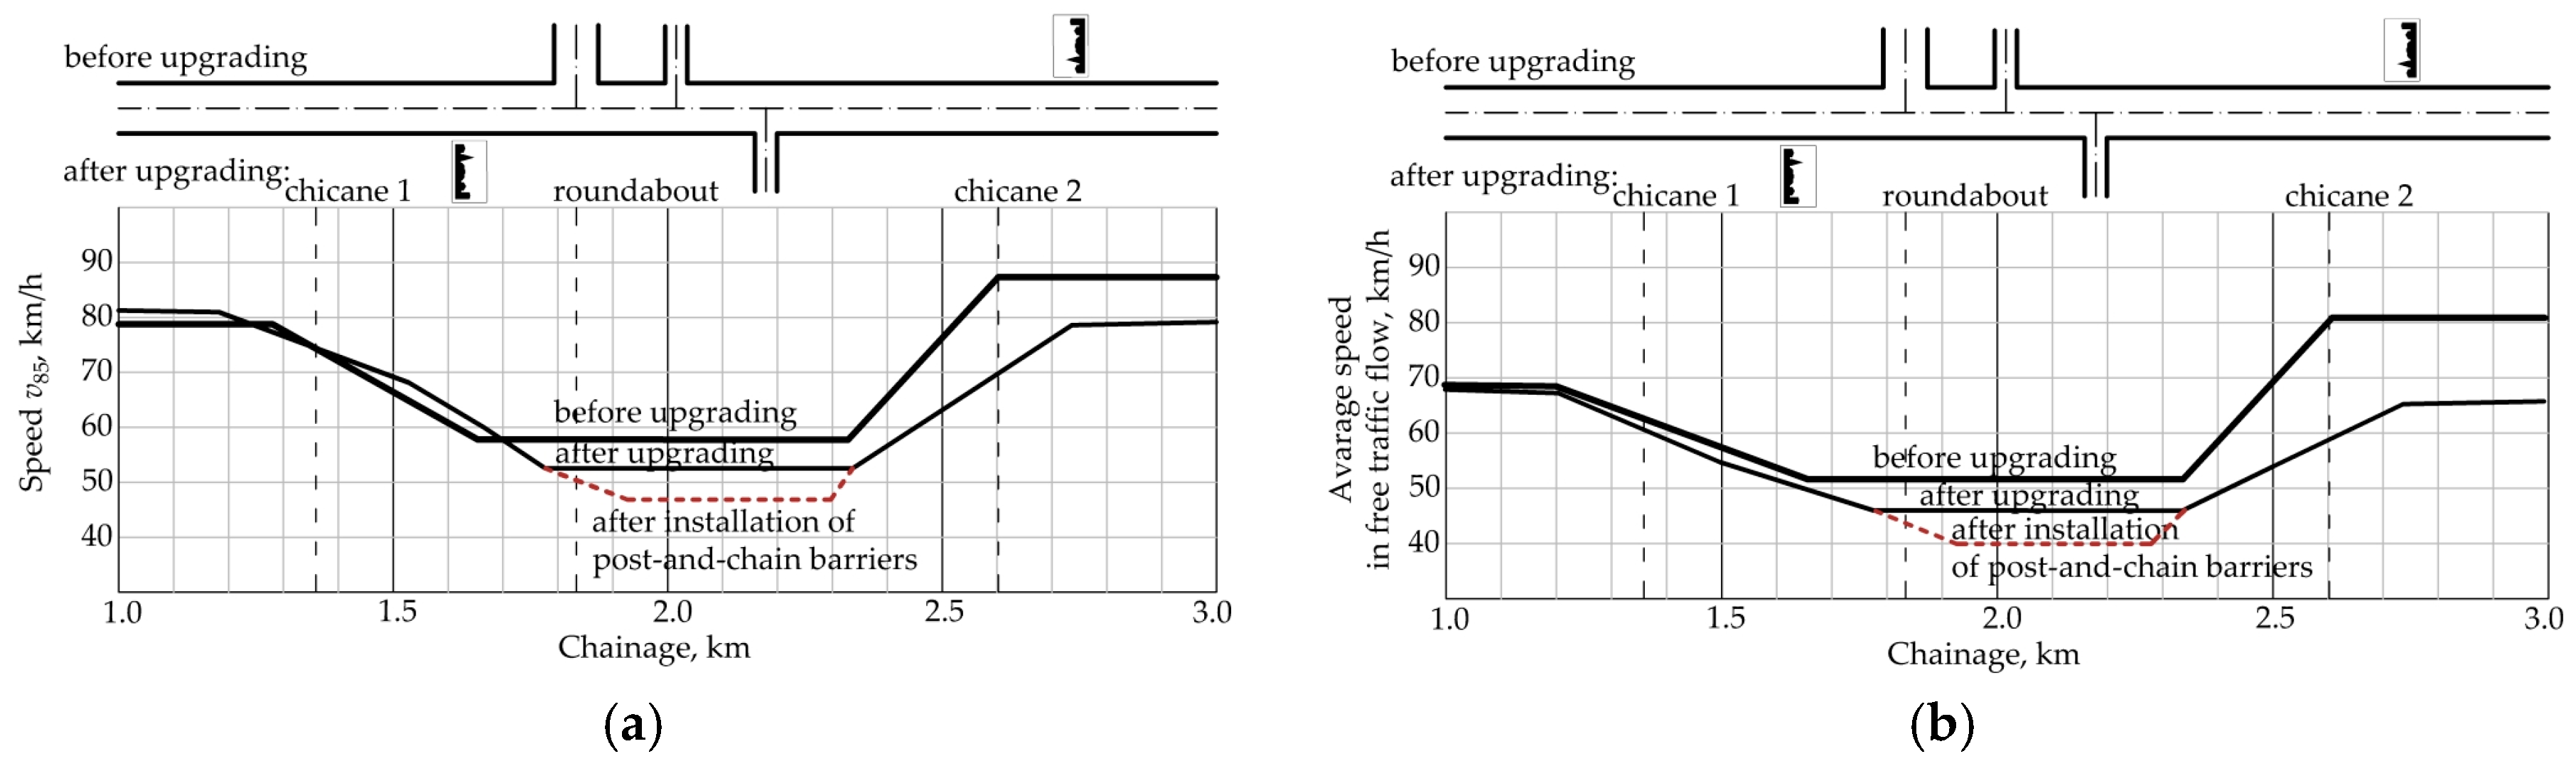
7. Discussion and Proposed Engineering Measures
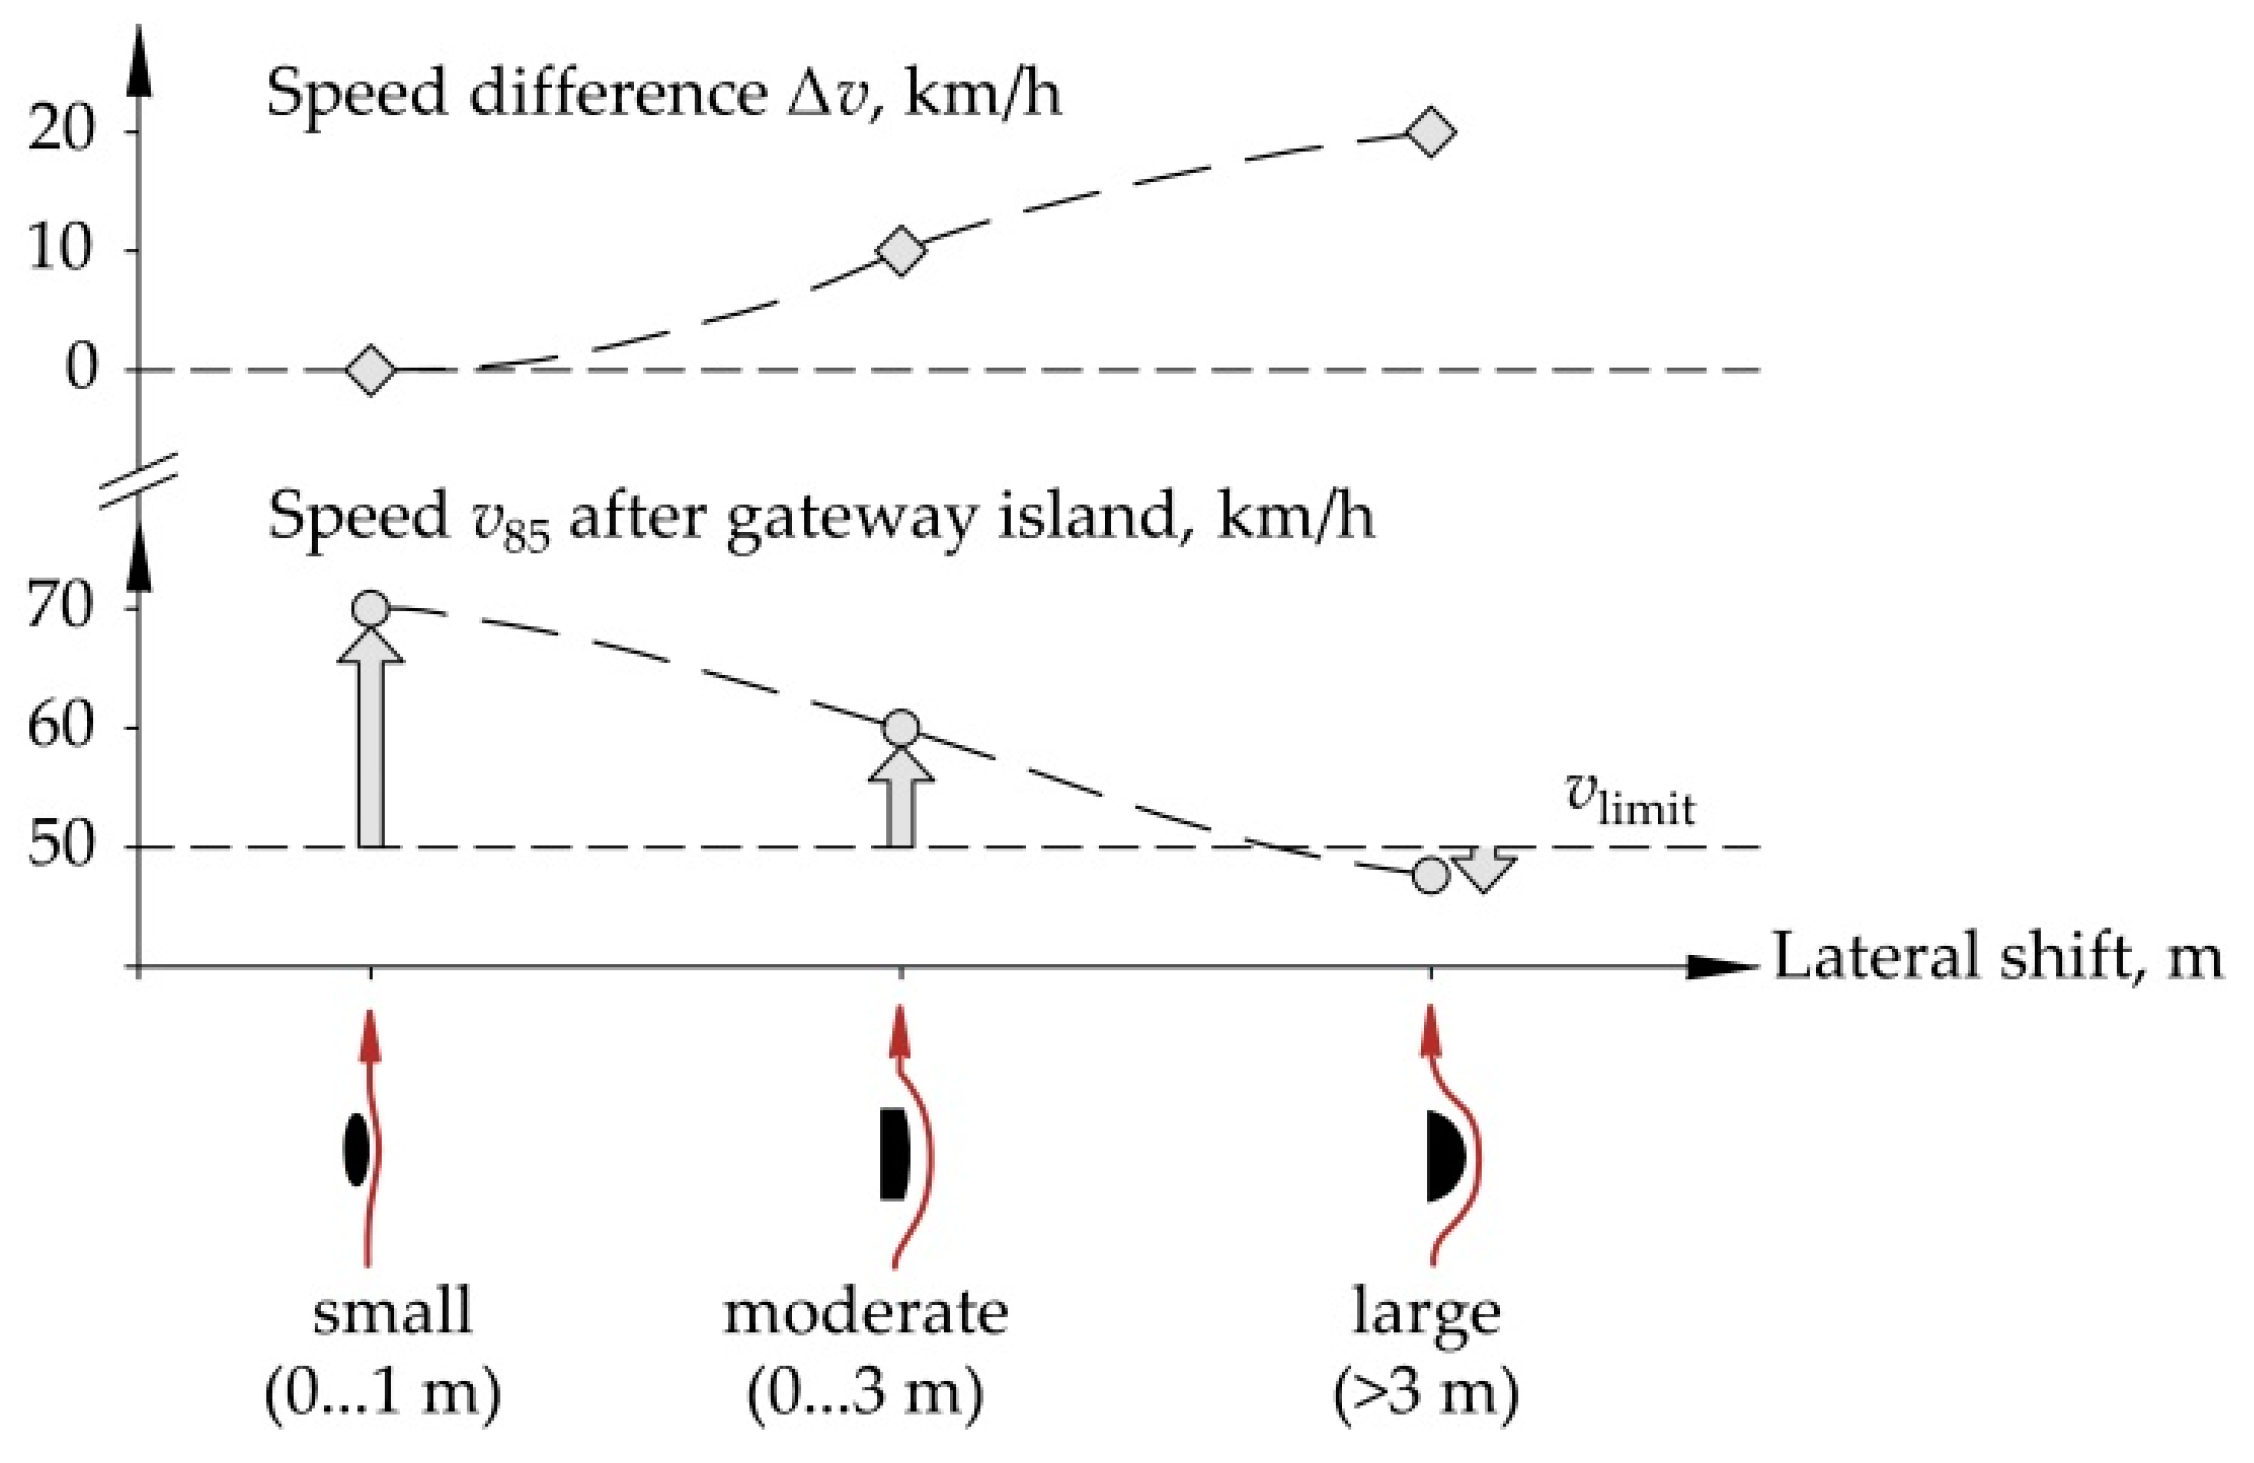
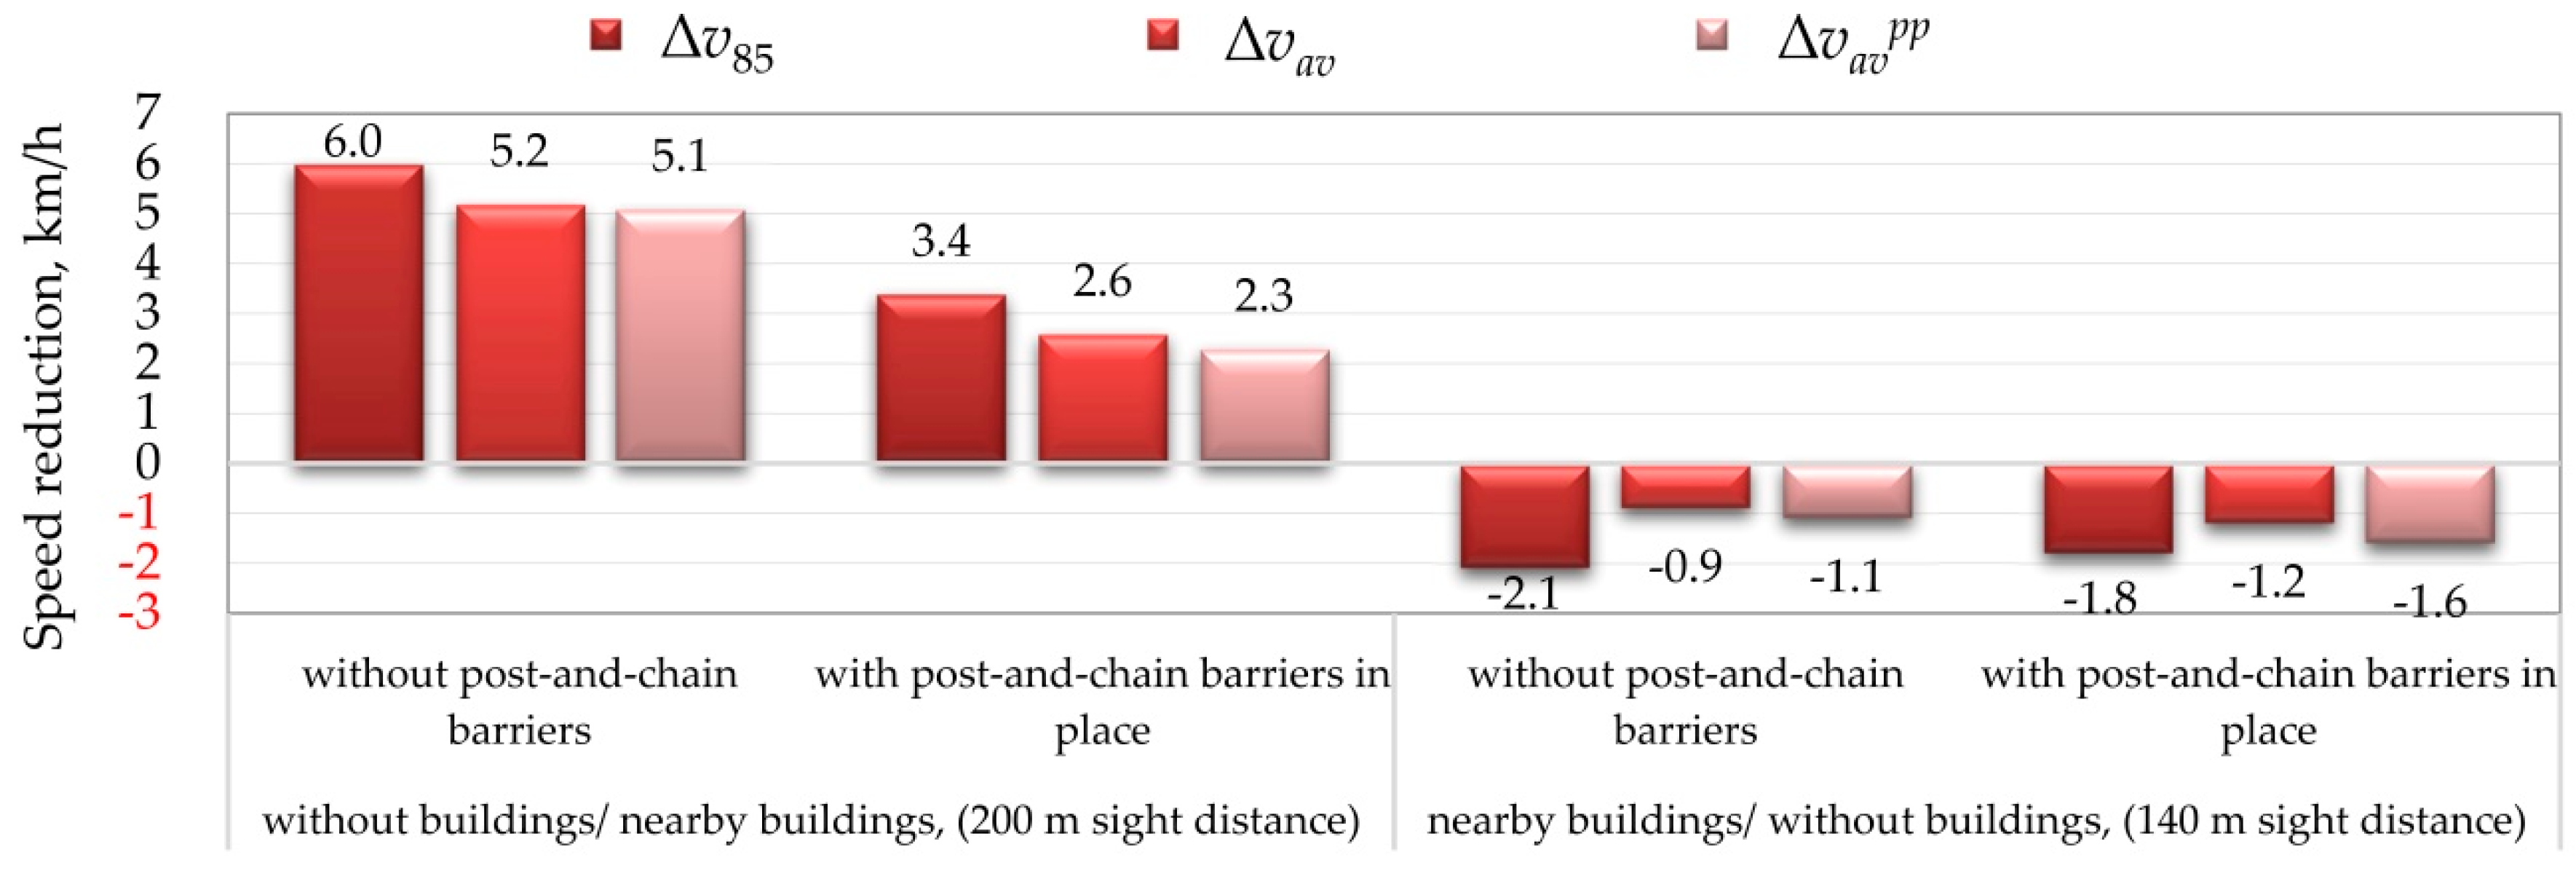
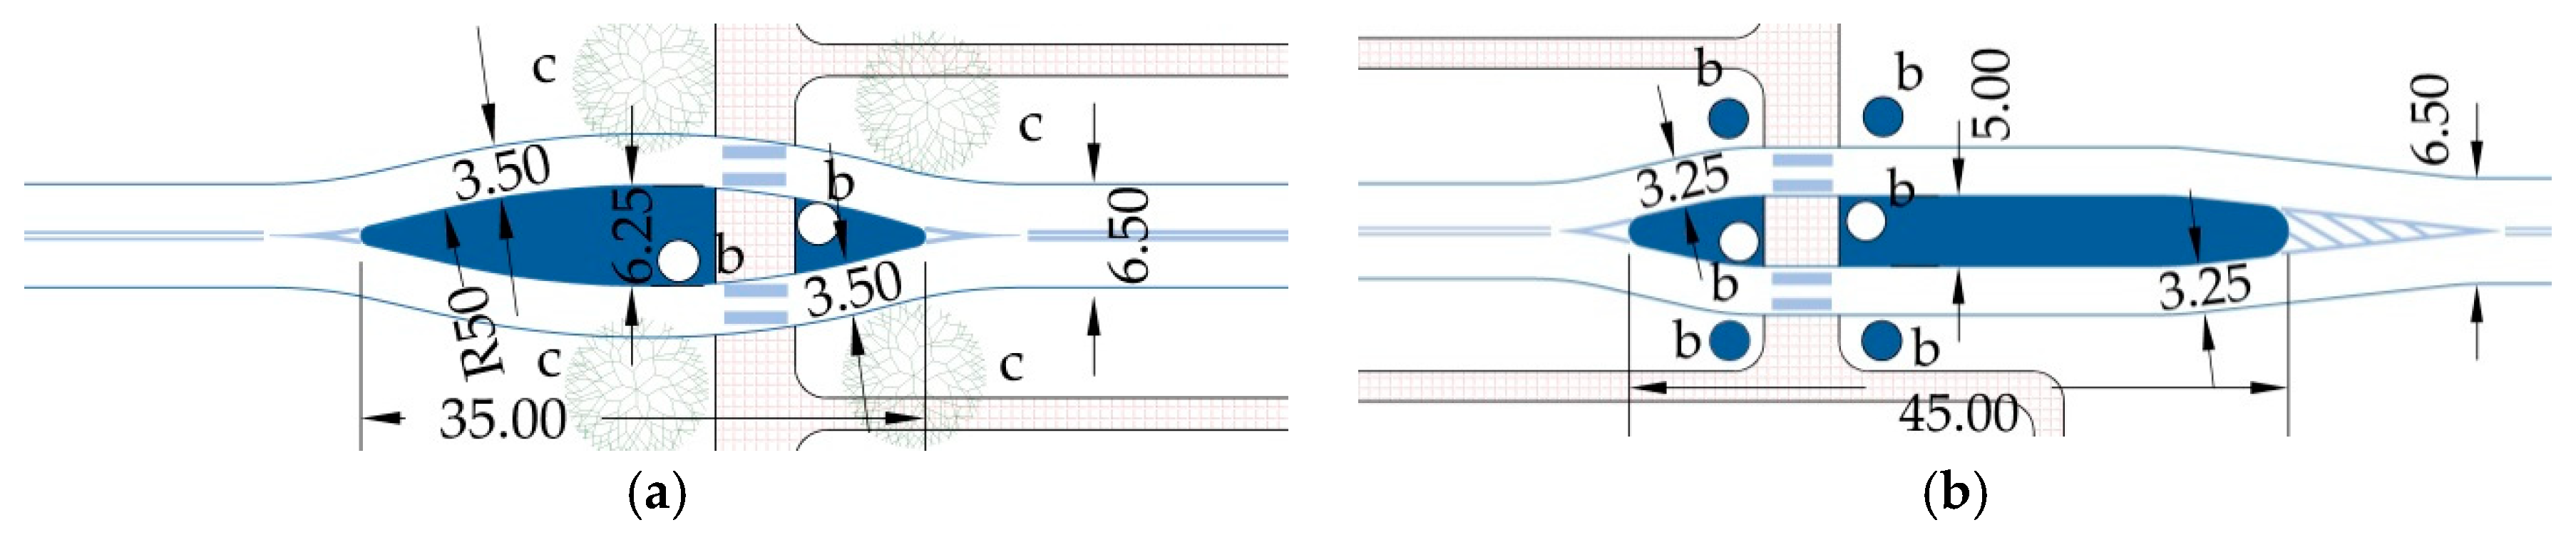
The above results confirm possible speed-reducing effect of pedestrian refuges, although there are a number of relevant factors to be considered before deciding about the refuge layout (symmetric or asymmetric) and width, namely: siting of the pedestrian refuge in the village area, nature of the surrounding environment in the planned location, sight distance, room for widening the carriageway, any bus bays in the vicinity. The obtained speed differences show that the lateral shift is not the sole factor determining the level of speed reduction.
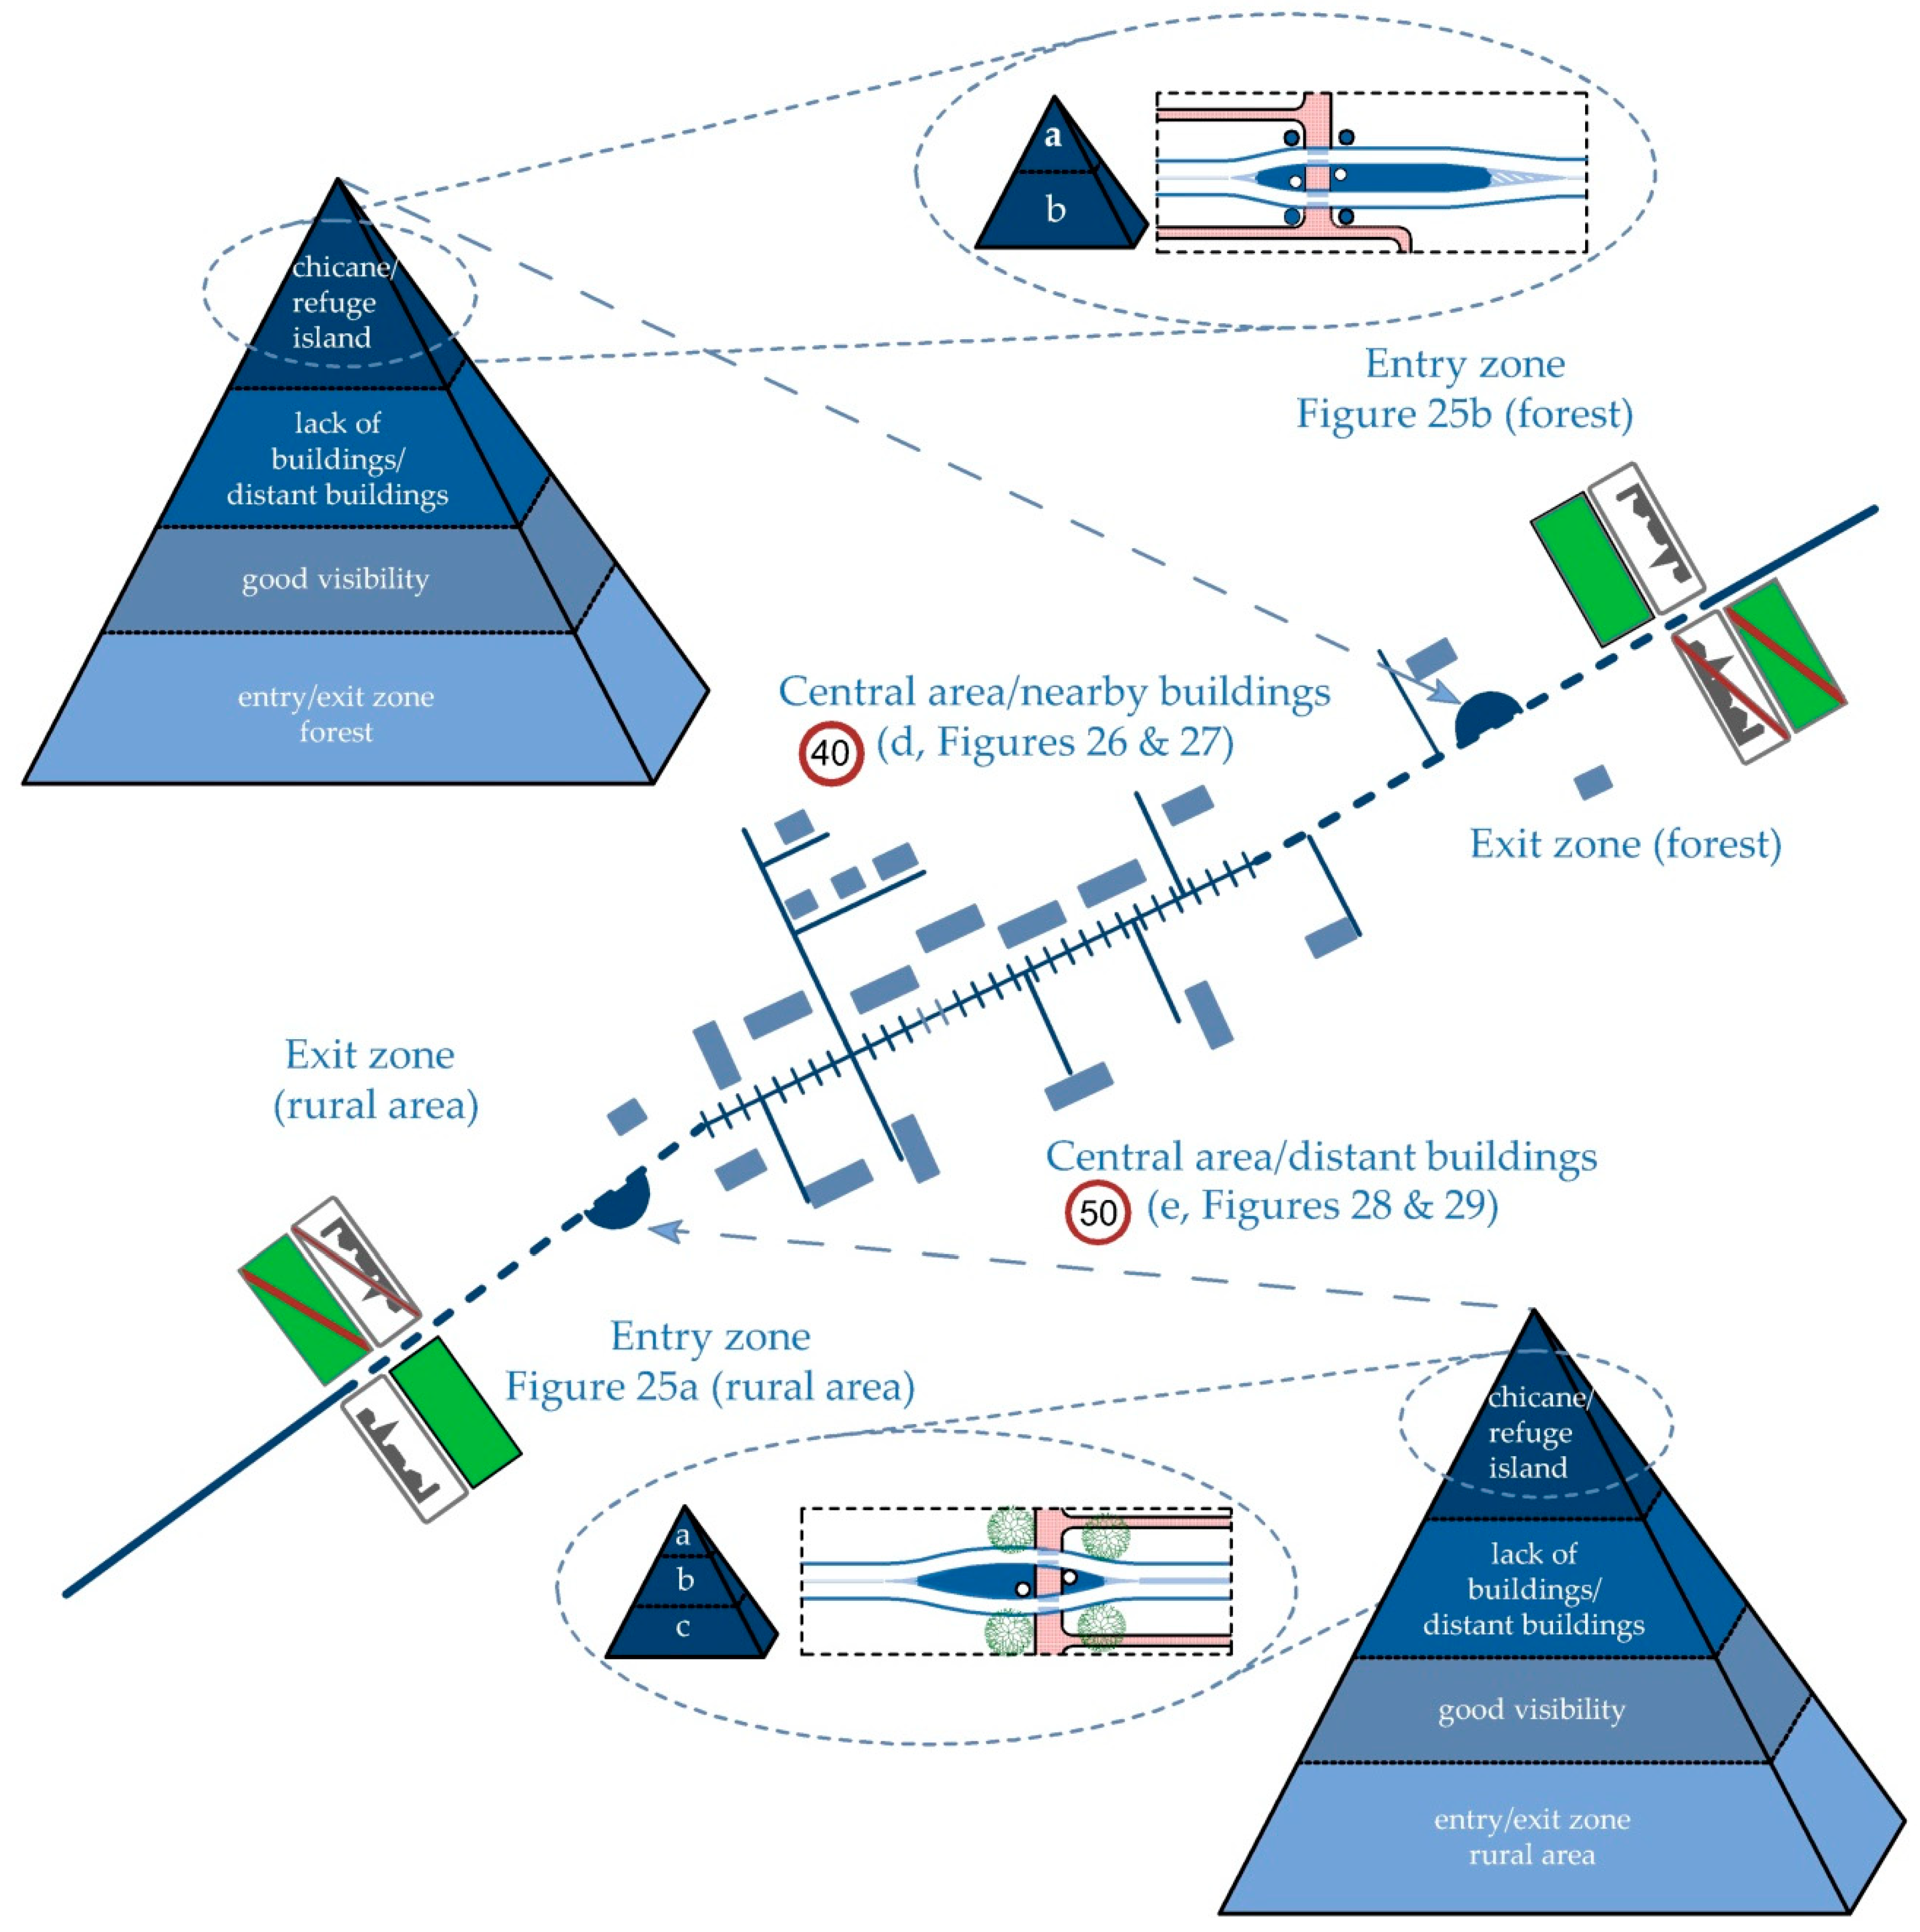
The flow chart for selecting the type and width of the pedestrian refuges on regional roads in villages, based on chosen factors, is presented in
Figure 24. The authors recommend, following the German guidelines [
13], to consider in the entry zones the environmental factors and use symmetrical central islands combined with pedestrian crossings. In open rural areas, ca. 35 long by 6.25 m wide, symmetric lens-shaped central islands should be used, imposing a large lateral shift in the travelway alignment, passed on a curve with 50 m radius, with min. 3.5 travel lane width, enhanced with barrier bollards and single tree plantings at the pedestrian crossing location (
Figure 25a). In forest areas cigar-shaped central islands are recommended, ca. 45 long by 5 m wide, passed on min. 3.5 m wide travel lanes, enhanced with barrier bollards only (
Figure 25b). Additional plantings are not required where the surrounding environment is occupied by a forest. According to the Swedish [
8] and German [
13] guidelines and taking into account the drivers’ perception studies reported in [
10,
11,
12] the authors indicate a need of interactive road signs to be placed in the entry zones to warn the drivers of the central island and pedestrian crossing located ahead of them (activated by motion sensors).
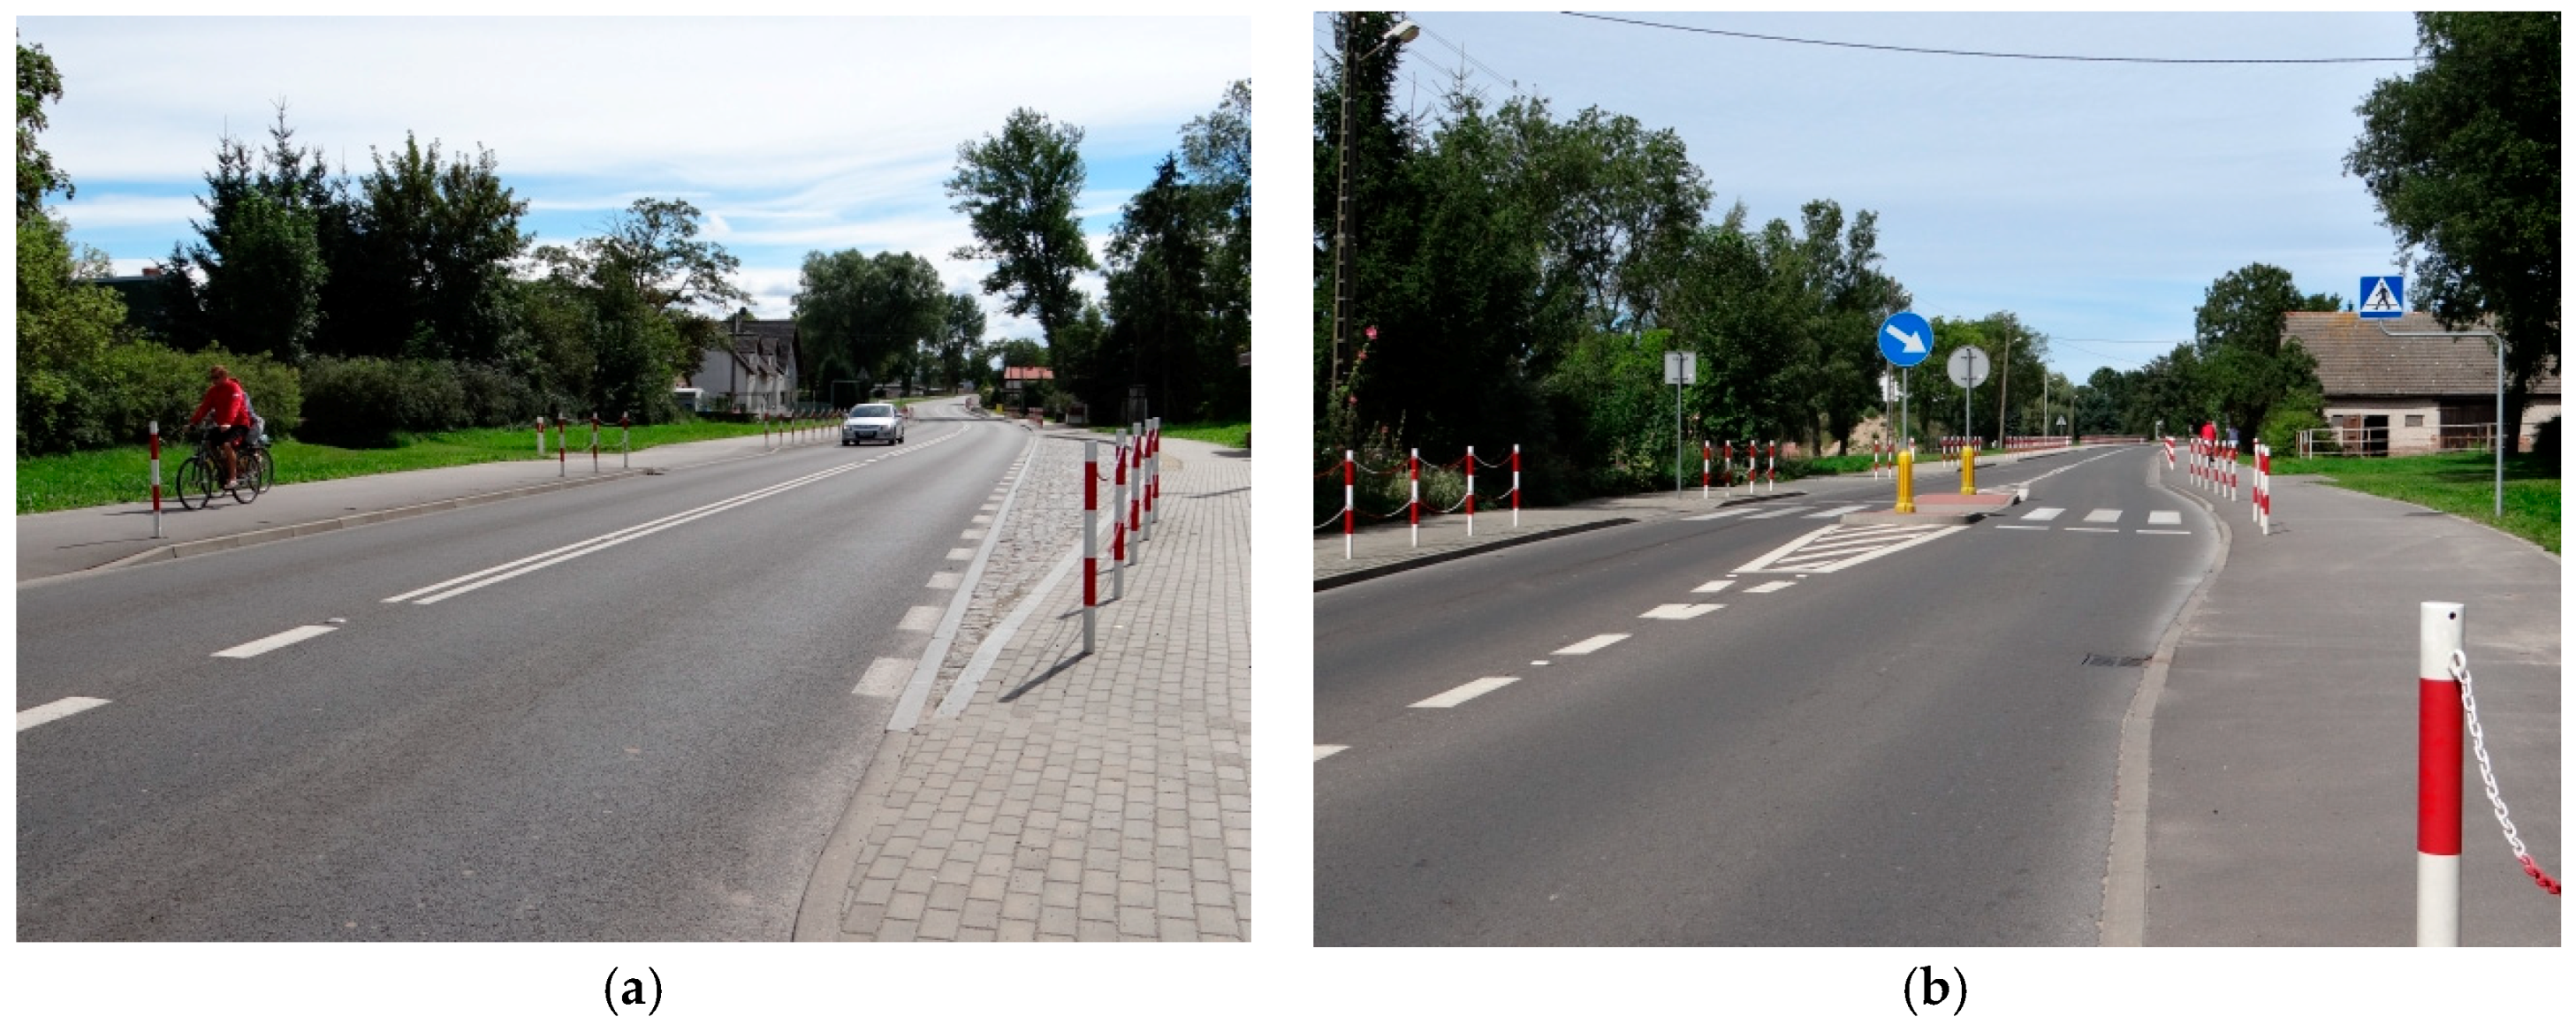
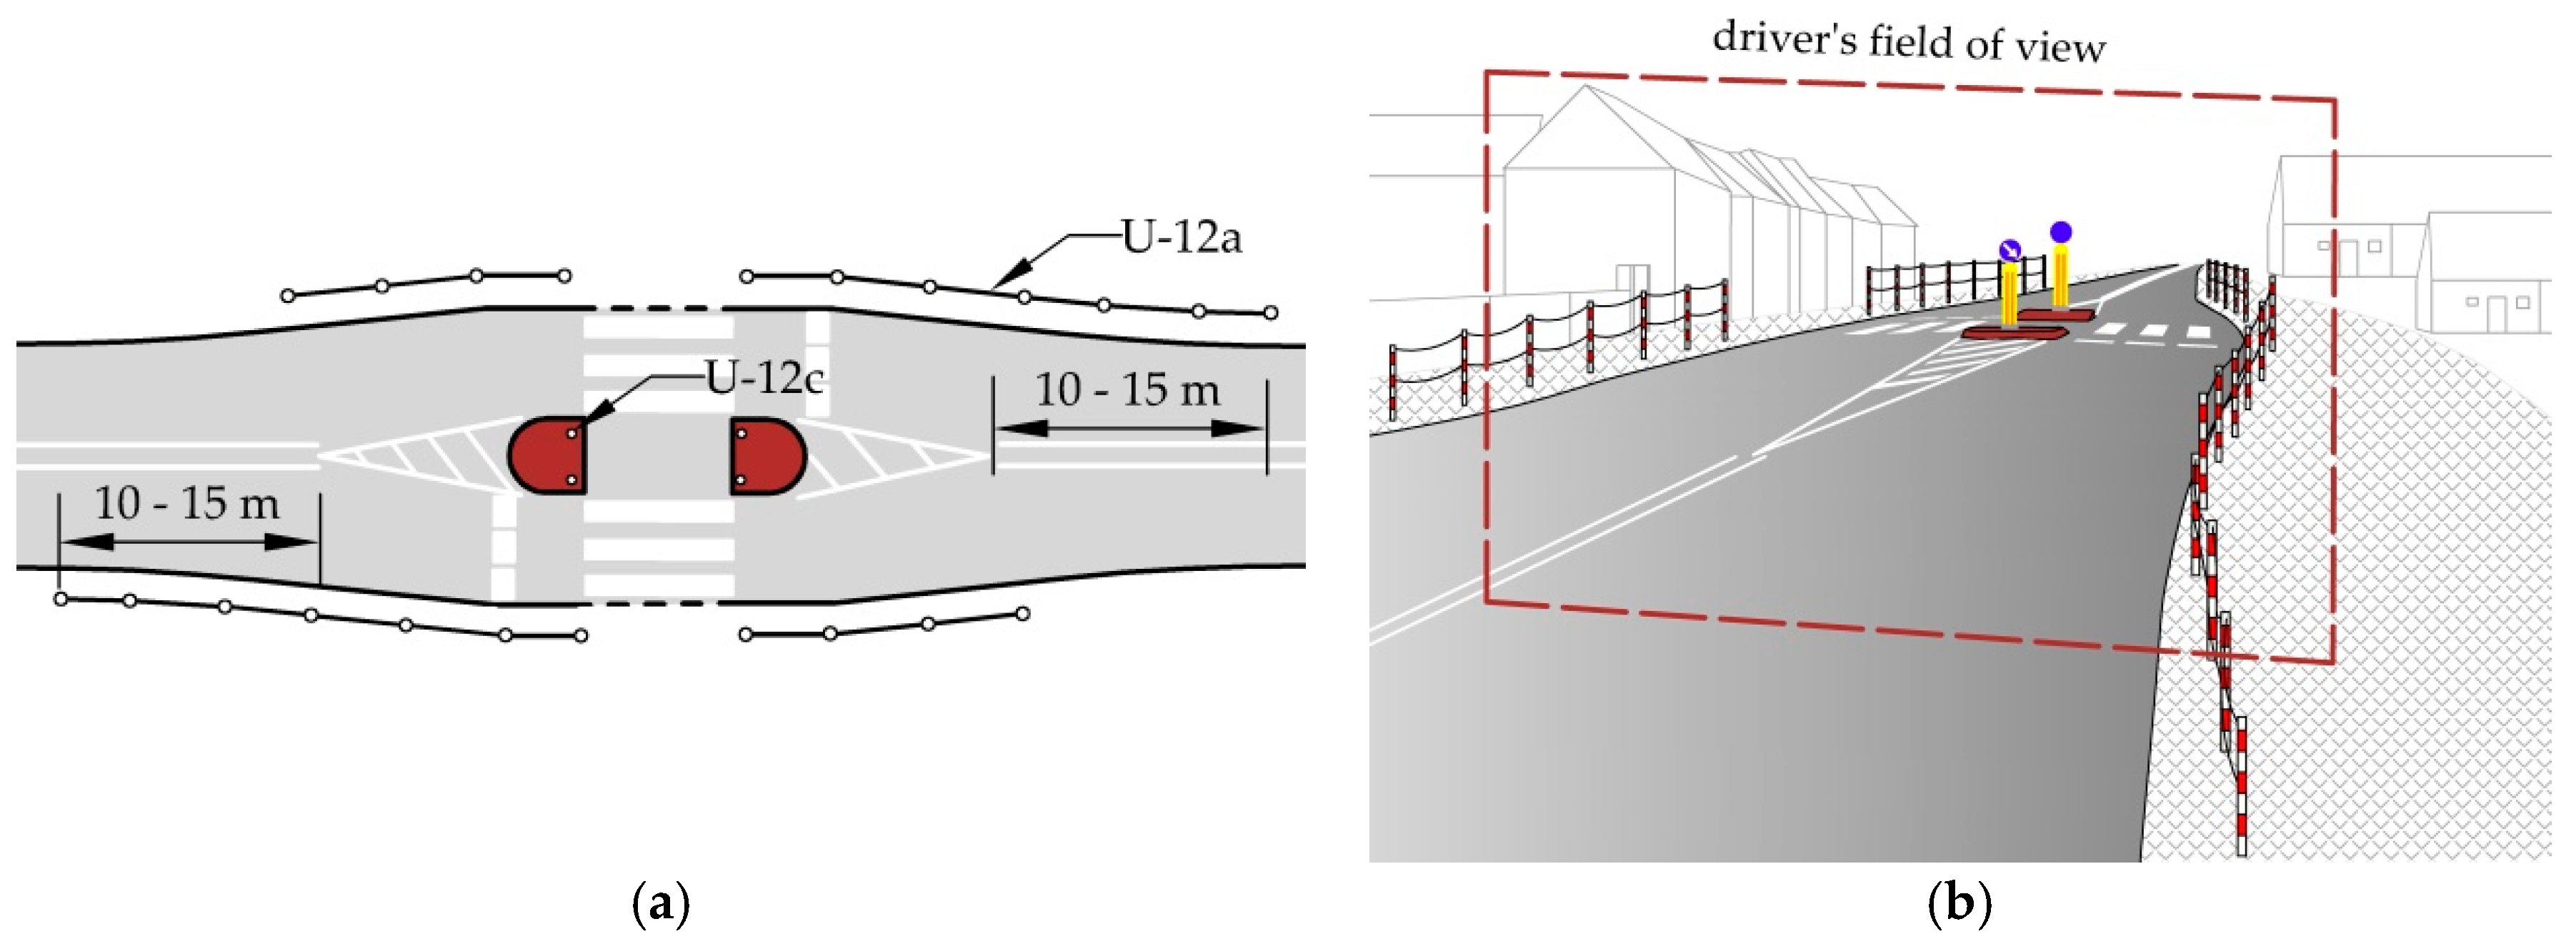
Based on the results of this research, the authors recommend symmetric pedestrian refuge islands, 2 m or 2.5 m wide, the latter to accommodate bicycles, if required, as an appropriate design for the village centre areas. In order to highlight the pedestrian refuge location and influence the driver’s perception, it should be accompanied with post-and-chain barriers [
5,
7] or barrier bollards of various colours and sizes, the latter being a popular measure used in the West European countries. Examples of designs used in Poland are presented in
Figure 18 and
Figure 23.
Figure 26, in turn, shows the proposed design including post-and-chain barriers. According to [
5] the post-and-chain barriers should extend ca. 10–15 m upstream of the pedestrian refuge, measuring from the end of the hatched marking and at least to the end of the hatched marking at the other end.
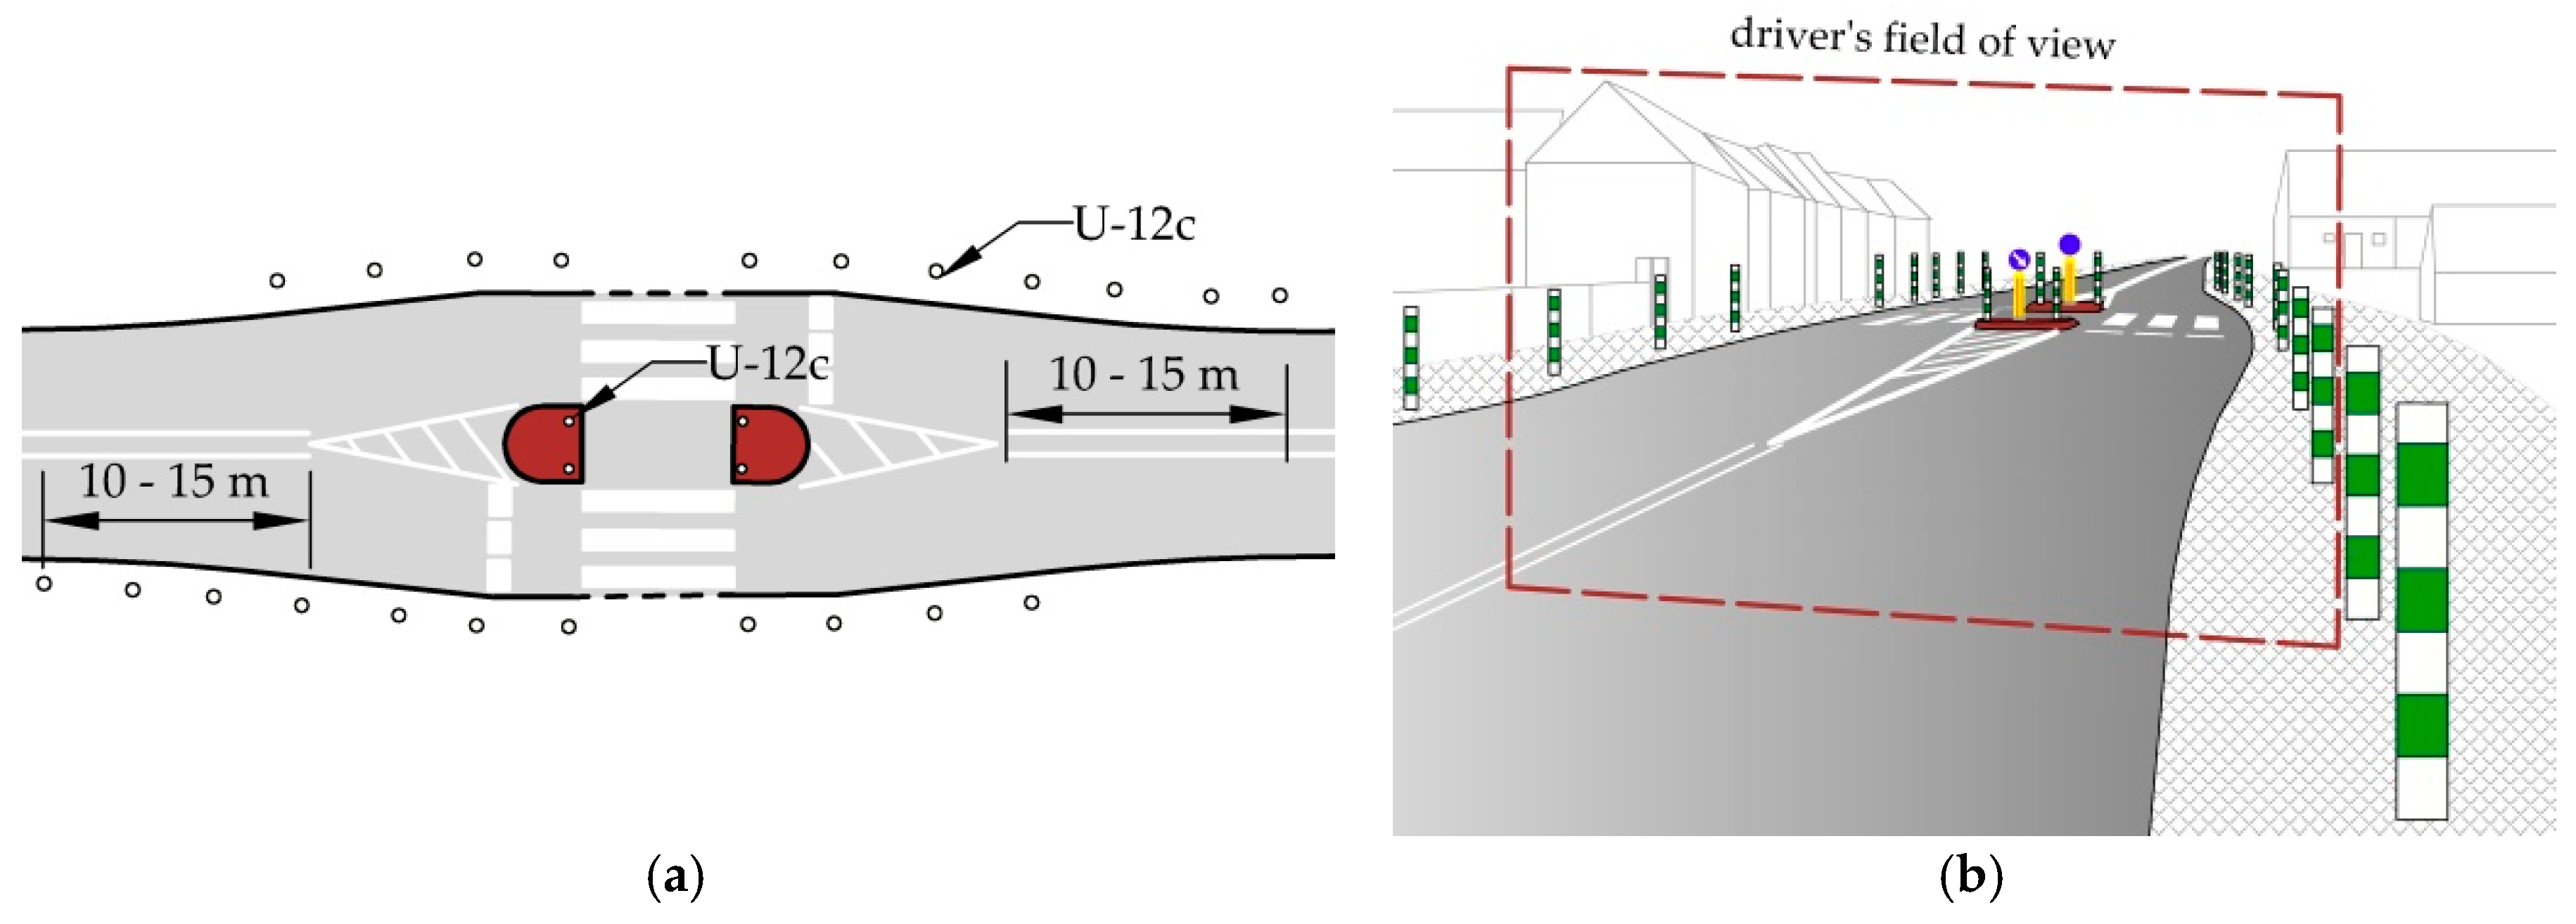
Figure 26 and
Figure 27 present recommendations for village centre area with residential buildings in close proximity, where the pedestrian refuges are enhanced by post-and-chain barriers or barrier bollards to achieve yet smaller speeds and improve the safety of pedestrians right on the crossing.
Based on the results of this research, the authors recommend symmetric pedestrian refuge islands, 2 m or 2.5 m wide, the latter to accommodate bicycles, if required, as an appropriate design for the village centre areas. In order to highlight the pedestrian refuge location and influence the driver’s perception, it should be accompanied with post-and-chain barriers [
5,
7] or barrier bollards of various colours and sizes, the latter being a popular measure used in the West European countries. Examples of designs used in Poland are presented in
Figure 18 and
Figure 23.
Figure 26, in turn, shows the proposed design including post-and-chain barriers. According to [
5] the post-and-chain barriers should extend ca. 10-15 m upstream of the pedestrian refuge, measuring from the end of the hatched marking and at least to the end of the hatched marking at the other end.
The travel lane width should be appropriate to the level of service of the road in question. Over the pedestrian crossing length, the travel lane design should not depart from the design on the straight section, the width to comply with the guidelines of [
5,
6]. According to the recommendations of [
5] the width of the travel lane right before and after the pedestrian refuge should be in compliance with the adopted vehicle turning path templates. The angles of hatched marking border lines should follow the recommendations of [
6] and the widths of lanes alongside the tapers should provide enough room for the vehicles to pass.
As mentioned earlier, in the West European countries’ barrier bollards are used increasingly often at the pedestrian refuges and at the accompanying kerb buildouts. Barrier bollards can be installed both before and after the pedestrian refuge, as shown in
Figure 27. They can be installed quicker and at a lower cost than the post-and-chain barriers. Another advantage of barrier bollards is that, in accordance with the guidelines of [
7] they can have a decorative form, matching the surroundings and can be finished in colour chosen by the landscape architect. In the West European countries, barrier bollards are fitted with fluorescent strips or LED lighting at the top. The purpose of these treatments is to enhance perception of bollards in limited lighting conditions, during rainfall, at dusk or during the night.
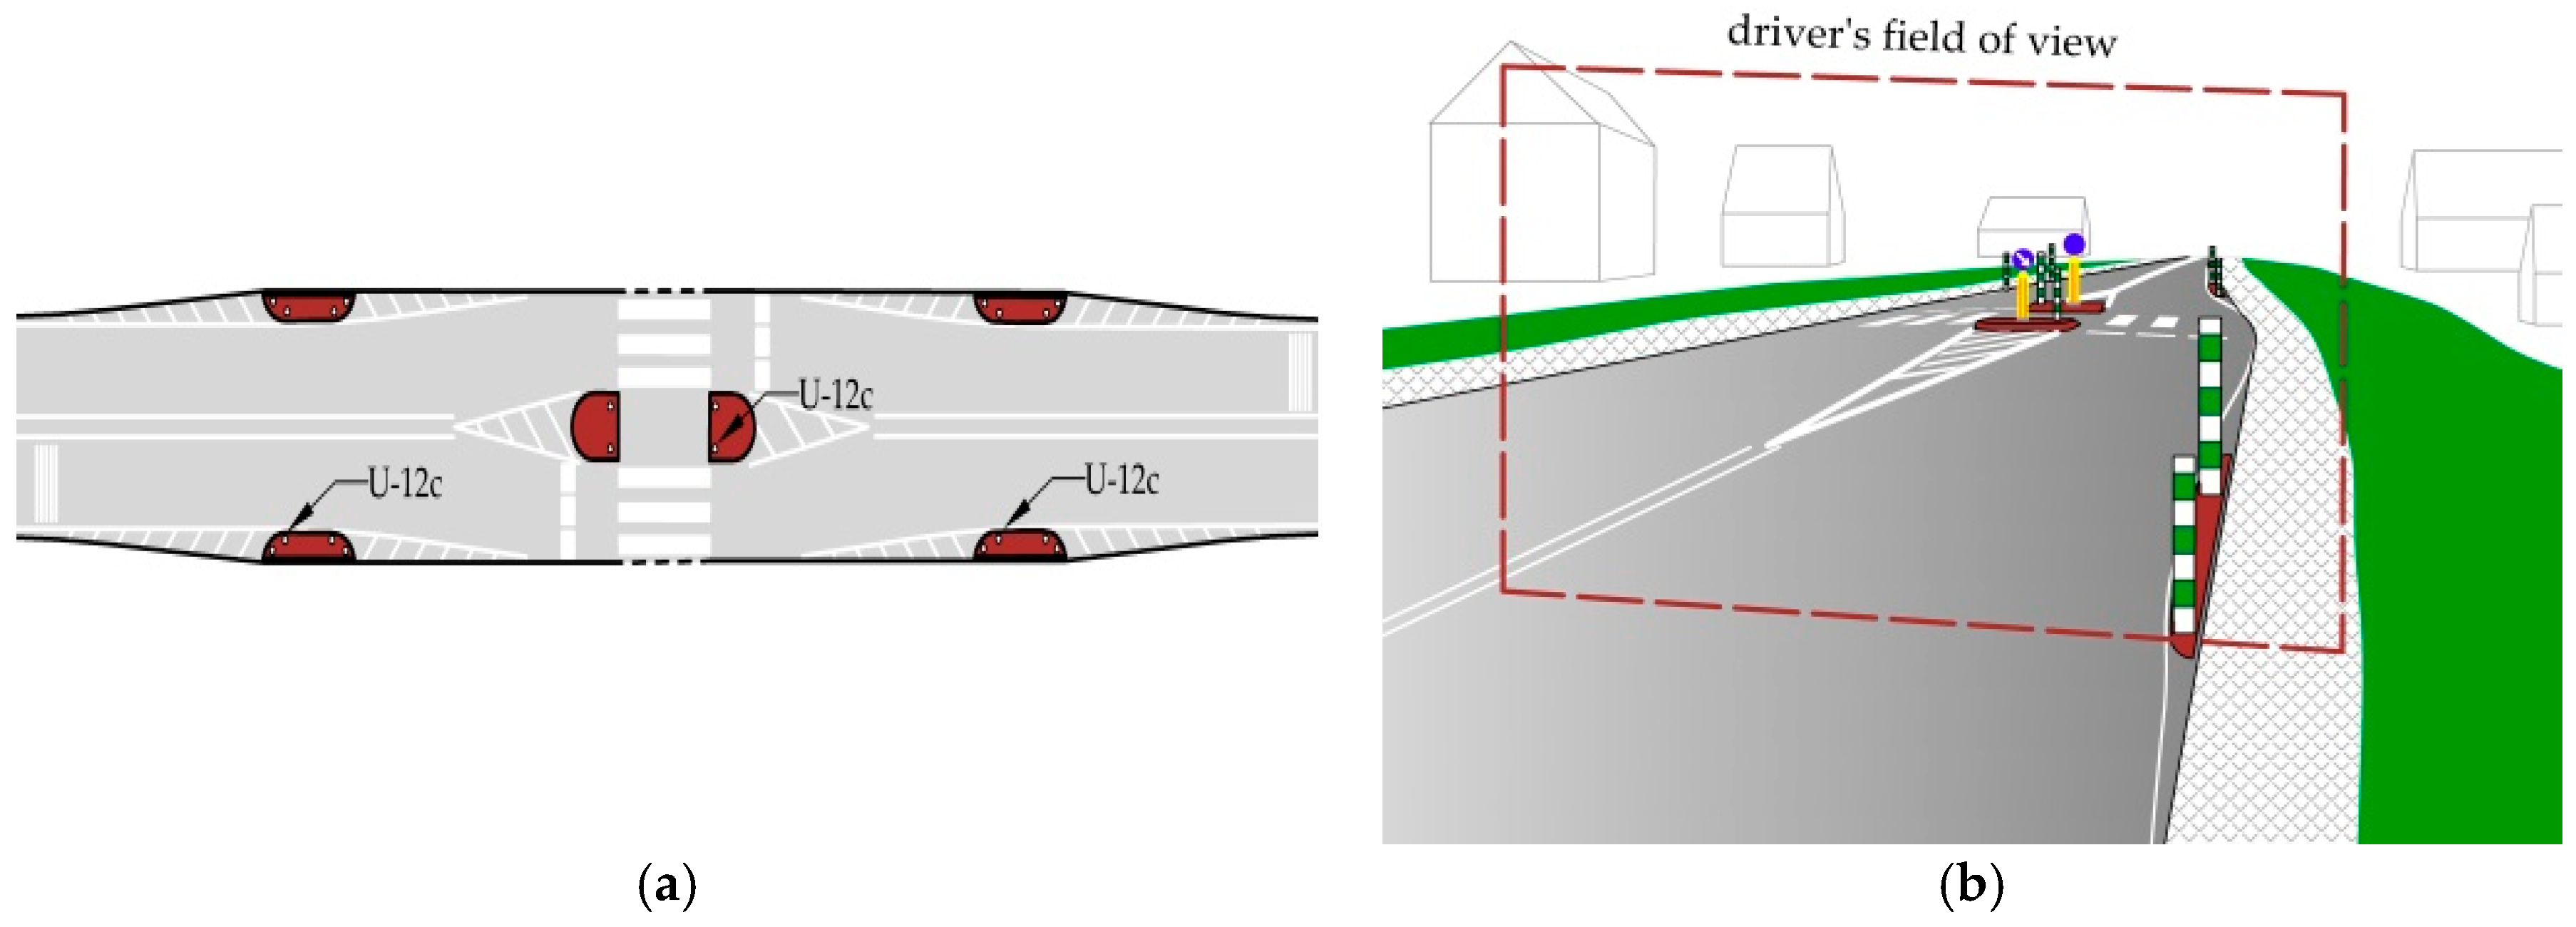
A review of the designs used in West European countries, recommended in the design manuals [
16,
17] showed that kerb buildouts (bulb-outs) placed symmetrically on either side of the road or pinchpoints are often provided at the pedestrian refuges or gateway islands, as shown in
Figure 28 and
Figure 29.
The side islands can incorporate, as in the West European countries, greenery and four barrier bollards in corners. However, the most important design feature is raised kerbing around the island, provided in order to enhance lateral shift of vehicles and in this way contribute to reducing the speeds to the desired level. Moreover, the side islands should include U-6b object marker signs and signs communicating the horizontal deflection.
The U.S. [
16] and U.K. [
17] guidelines recommend also using of pinchpoints which are smaller kind of side islands (
Figure 29). Due to a smaller size, these islands require a shorter section of widened carriageway and, for this reason, are an option of choice for village centre areas. In this case, they should also be provided with raised kerbing around the perimeter. In the West European countries, planters are placed on them to fit the village centre streetscape. Usually they are enhanced by three barrier bollards placed at the island corners. Although in most cases the islands are triangular in shape, semi-circular islands can also be found. In any case, the islands must incorporate U-6b object markers and bollards. Sometimes, depending on the traffic control scheme, C-10 keep left signs are placed atop the U-6b object markers.
8. Conclusions
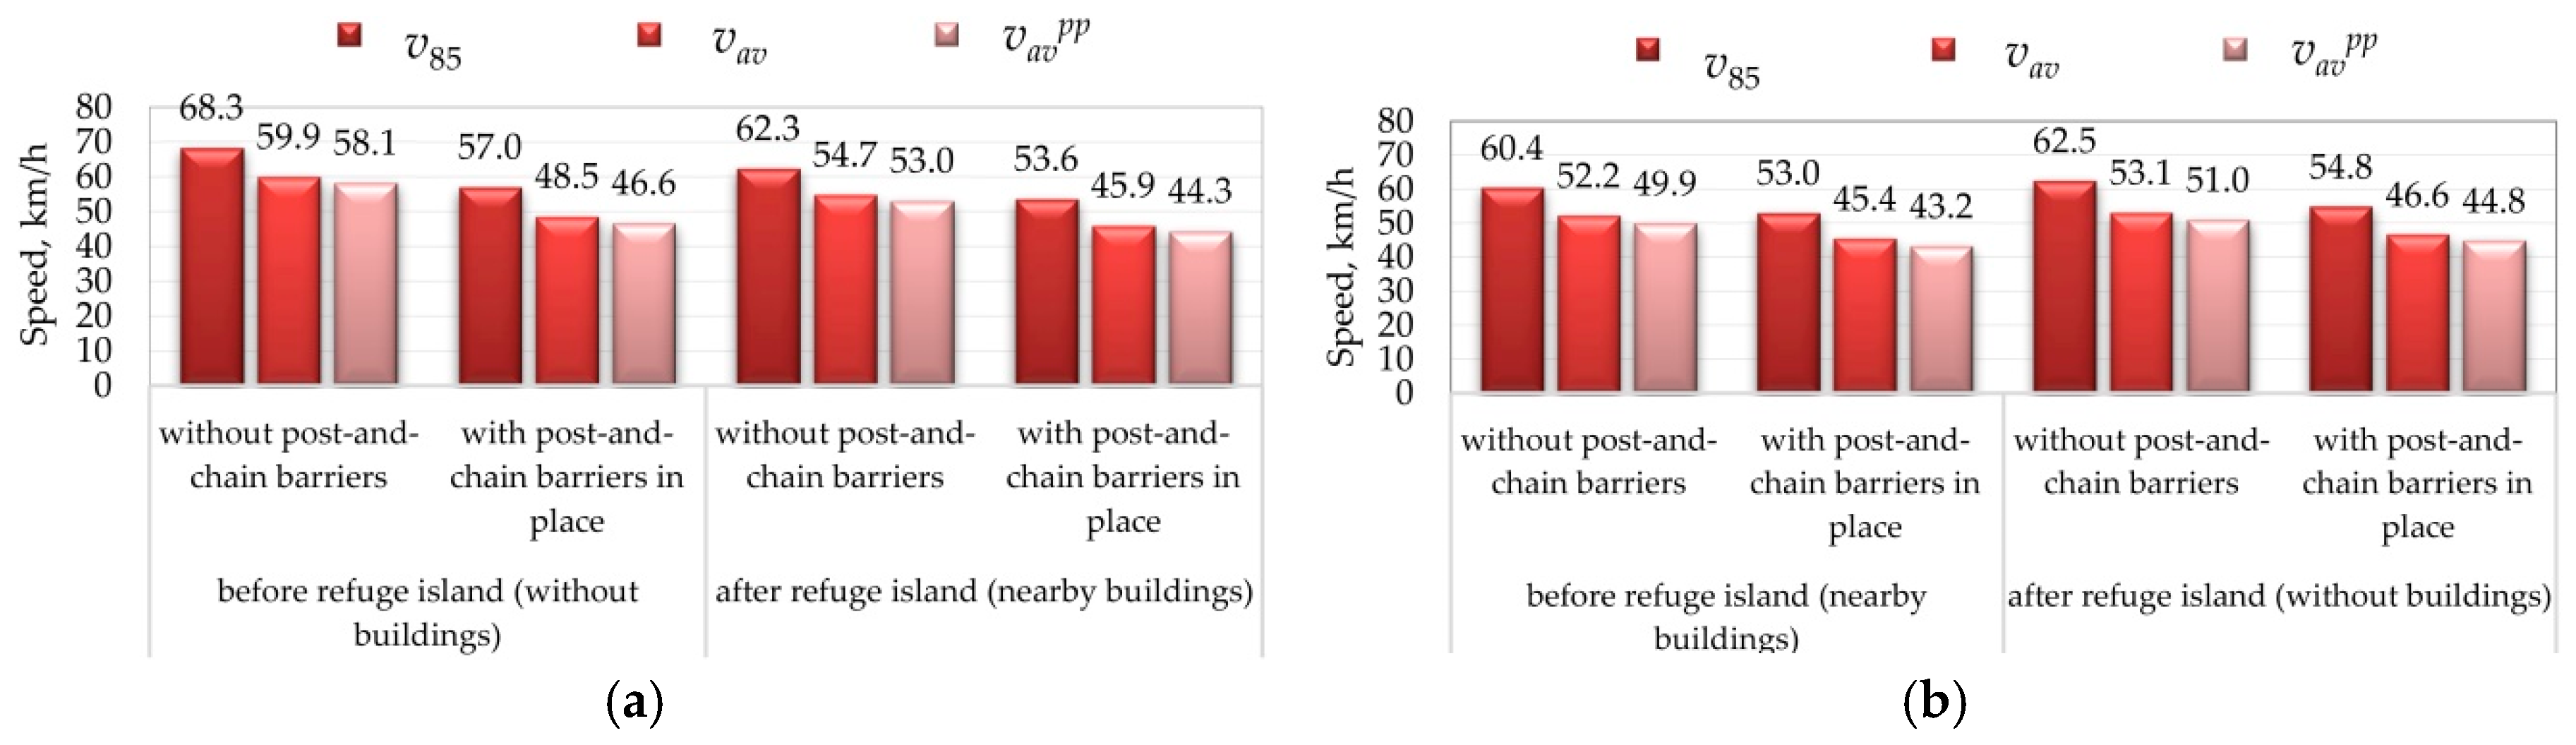
The results of this research allow us to conclude that pedestrian refuges imposing symmetric lateral shift by 1 m which are not accompanied by street furniture items have no significant bearing on speed reduction in their vicinity, and this irrespective of their sitting along the stretch of road in the village and geometry of associated pavement markings. Conversely, asymmetric lateral shift in the travelway alignment generated by the refuge island located on one side of the road centreline induces a considerable speed reduction, yet only when the driver sees residential buildings in close proximity of the road.
If a pedestrian refuge located in the village centre area with residential buildings in close proximity of the road is expected to bring down the v85 speed to 40 km/h, it must be symmetrical, induce 1 m lateral shift and be enhanced by post-and-chain barriers or barrier bollards. When the desired maximum speed in the village area is 50 km/h and the nearest residential buildings are situated away from the road, the islands should be symmetrical, induce 1m lateral shift and be accompanied by bulb-outs or pinchpoints.
In the village entry zones in open rural areas with scattered residential buildings situated away from the road, pedestrian refuges should be combined with lens-shaped symmetric gateway islands, 6.25 m wide at the widest point. They should be enhanced by planting trees and placing crash-resistant bollards along the footway to influence the drivers’ perception and make them alert for pedestrians. On sections surrounded by a forest, cigar-shaped symmetric central islands should be used to save trees by reducing the land take in comparison to lens-shaped islands. These islands must be at least 5 m wide in any case. On sections surround by a forest the pedestrian crossings should be enhanced with barrier bollards. In both cases interactive road signs should be used, coupled with motion sensors, to enhance perception of pedestrians in adverse weather.


