Article

A Method to Determine Core Design Problems and a Corresponding Solution Strategy

1
School of Manufacturing Science & Engineering, Sichuan University, Chengdu 610065, China
2
Unclear Power Institute of China, Chengdu 610065, China
*
Author to whom correspondence should be addressed.
Symmetry 2019, 11(4), 576; https://doi.org/10.3390/sym11040576
Submission received: 6 March 2019 / Revised: 8 April 2019 / Accepted: 16 April 2019 / Published: 19 April 2019
(This article belongs to the Special Issue Symmetry in Mechanical Engineering)

Abstract

:
The lack of information on the correlation between root causes and corresponding control criteria in the importance calculation of root causes of design problems results in less accurate determinations of core problems. Based on the interaction between customer needs, bad product parameters, and root causes, a hierarchical representation model of the design problem is established in this paper. A network layer of bad parameters, including various types of correlations, and a control layer, including technical feasibility and cost, are constructed. Then, a method based on the network analytic hierarchy process is proposed to rank the importance of root causes of the design problem and determine the core problems. Finally, a product design process based on the core problem solving is established to assist designers with improving design quality and efficiency. The design for the coolant flow distribution device in the lower chamber of a third-generation pressurized water reactor is employed as an example to demonstrate the effectiveness of the proposed method.

1. Introduction

In the manufacturing industry, most research and development of products is based on previous products. This kind of design can be regarded as incremental innovation [1,2,3]. The purpose of incremental product innovation design is to improve product performance without changing the working principle of the product. In other words, incremental innovation is aimed at solving various problems that hinder designers from realizing the desired functions, through which the performance of a previous product system will be further improved [4,5].
The key to incremental innovation is to analyze and determine the core problems in the previous product system, and to develop suitable strategies to generate better design solutions. At present, many researchers have integrated innovative methods with complementary advantages to assist designers with improving design quality and efficiency [6,7]. The theory of inventive problem solving (TRIZ) was adopted by Li et al. [8] to define conflicts in the product system and solve these conflicts with effective tools (i.e., a contradiction matrix). The environmentally conscious quality function deployment (ECQFD) approach was proposed by Vinodh et al. [9] to analyze and identify the problem. In this approach, customer needs are converted into corresponding technical feature conflicts, then the conflicts are solved with TRIZ. A process combining the TRIZ method with the design for manufacture and assembly (DFMA) method was proposed by Lucchetta et al. [10] to solve various problems occurring in the simplification process of a product system. Caligiana integrated the QFD and TRIZ methods to define and overcome some core problems that can affect the development of a product [11]. The morphological matrix (MM) method was adopted by Liu et al. [12] to identify various conflicts in the deformation process of product system components, and to solve those conflicts with the TRIZ method. An integrated process was proposed by Li et al. [13] to solve key problems with a process trimming-based TRIZ, and it also helped to identify and inventively solve key problems. The axiomatic design (AD) was adopted by Ko et al. [14] to analyze the problems existing in the product system and solve them with the TRIZ method. The theory of constraints (TOC) method was developed to analyze the root causes of various problems in a product system through current reality trees (CRTs), to identify the conflicts with a conflict resolution diagram (CRD), and to solve these conflicts with the TRIZ method [15,16,17,18,19]. Although these methods provide effective strategies for analyzing various problems and solving conflicts that exist in a product system, there still seems to be some difficulty in identifying the core problems.
The problems that occur in incremental innovation are often not independent. A solution to one problem may affect the solution to others [20]. Hence, it is necessary to determine the solving order of the root causes of problems. The fault tree analysis (FTA) method was adopted by Wei et al. [21] to qualitatively and quantitatively evaluate the importance of root causes. Then, the core problems are identified in the order of importance. A method based on the FTA method was proposed by Shu et al. to calculate the importance of root causes of failure events in a product system [22,23,24]. Garcia et al. [25] adopted the failure modes and effects analysis (FMEA) method to analyze potential failure problems in a product system and assign weights to them. A method combining FTA and FMEA was proposed by Azadeh et al. to qualitatively and quantitatively calculate the importance of root causes of the fault [26,27,28]. The fishbone diagram (FD) method was employed by Yazdani et al. [29] to analyze the root causes of the problem and was combined with the analytic hierarchy process (AHP) method to determine the importance of root causes. Although these methods are applied to calculate the importance of root causes, they are based on the premise that root causes are independent of each other. Such an assumption will lead to analysis results deviating from the actual situation. At the same time, there is a lack of corresponding control criteria in analysis process to constrain and evaluate the ranking of the importance of root causes. The above methods will result in less rational and accurate importance order and determination of core problems.
In order to solve the above problems, a hierarchical representation model of the design problem is established in this paper including customer needs, bad parameters, and root causes based on their interaction. The correlations in the bad parameters layer and the control criteria for the ranking of the importance of root causes are taken into consideration. Therefore, a method based on the network analytic hierarchy process is proposed to rank the importance of root causes and determine the core problems. Furthermore, a product design process based on solving the core problem is established to assist designers to improve design quality and efficiency.

2. Establishment and Transformation of Hierarchical Representation Model of Design Problem

The product design process of incremental innovation is a process of converting from problem analysis to concept generation. Before problem analysis, customer needs should be characterized and transformed into technical problems of the product system. Then problem analysis tools are used to analyze the root causes of those problems. Finally, the conflicts of root causes are solved by employing problem solving tools.
Customer needs can be divided into technical targets and economic targets. Technical targets include safety and reliability, functionality, and environmental protection. Economic targets include costs of purchase and use [30,31]. As initial customer needs are vague and involve perceptual understanding of target products, they are characterized by low professionalism and strong subjectivity [32]. Hence, in this paper, customer needs are classified into technical and economic targets to obtain corresponding new product performance targets. These new targets are compared with previous ones, and the performance targets that show poor consistency between the new and previous ones are regarded as the product’s bad parameters.
Generally, a product’s bad parameters are not independent of each other. A solution to a certain root cause of a bad parameter may lead to the reconstruction of other root causes. Therefore, there is not only an inclusion relationship between the elements in the bad parameters layer and the elements in the root causes layer, but also correlations between bad parameters and root causes.
According to the relationship among customer needs, bad parameters, and root causes, a hierarchical representation model of the design problem is established, as shown in Figure 1. In this model, the customer needs are classified and turned into bad parameters. Then the root causes of the bad parameters are analyzed. Finally, the importance of root causes is analyzed based on the correlation of the bad parameters layer to determine the core problems.
The hierarchical representation model of the design problem that includes customer needs, bad parameters, root causes, and core problems is illuminated as follows:
Customer needs (Cn) layer: An acquisition method is used to obtain various types of customer needs. Then a set of customer needs will be obtained by standardizing and filtering them.
C n = { C n 1 , C n 2 , C n 3 , , C n n }        
Bad parameters (Bp) layer: In this layer, the corresponding new product performance targets are identified and compared with previous ones, then a set of the product’s bad parameters is determined.
B p = { B p 1 , B p 2 , B p 3 , , B p n }    
Root causes (Rc) layer: This layer is a set of root causes affecting bad parameters. It includes indirect and direct causes leading to the bad parameters.
R c = { ( R c 1 1 , R c 2 1 , , R c k 1 ) , , ( R c 1 j , , R c l j ) , , ( R c 1 n , R c m n ) } ,
where R c i j is the ith root cause of the jth bad parameter.
Then, the relationship between the root causes layer and the bad parameters layer can be expressed as
R c = { R c 1 1 R c k 1 } B p 1   R c 1 j R c l j } B p j   R c 1 n R c m n } B p n } = B p .
Core problems (Cp): The core problems in the root causes are the main cause of bad parameters, and their solution may affect the solution to other root causes.
C p j ( R c 1 j , R c 2 j , , R c l j ) ,
where C p j is the core problem that causes the jth bad parameter.

3. Method to Determine Core Problems Based on Analytic Network Process

In order to assist designers with obtaining the importance order of core problems from a large number of problems that affect the product system performance, a determination method of core problems based on ANP is proposed in this paper.

3.1. Construction of Network Layer and Control Layer for Design Problem

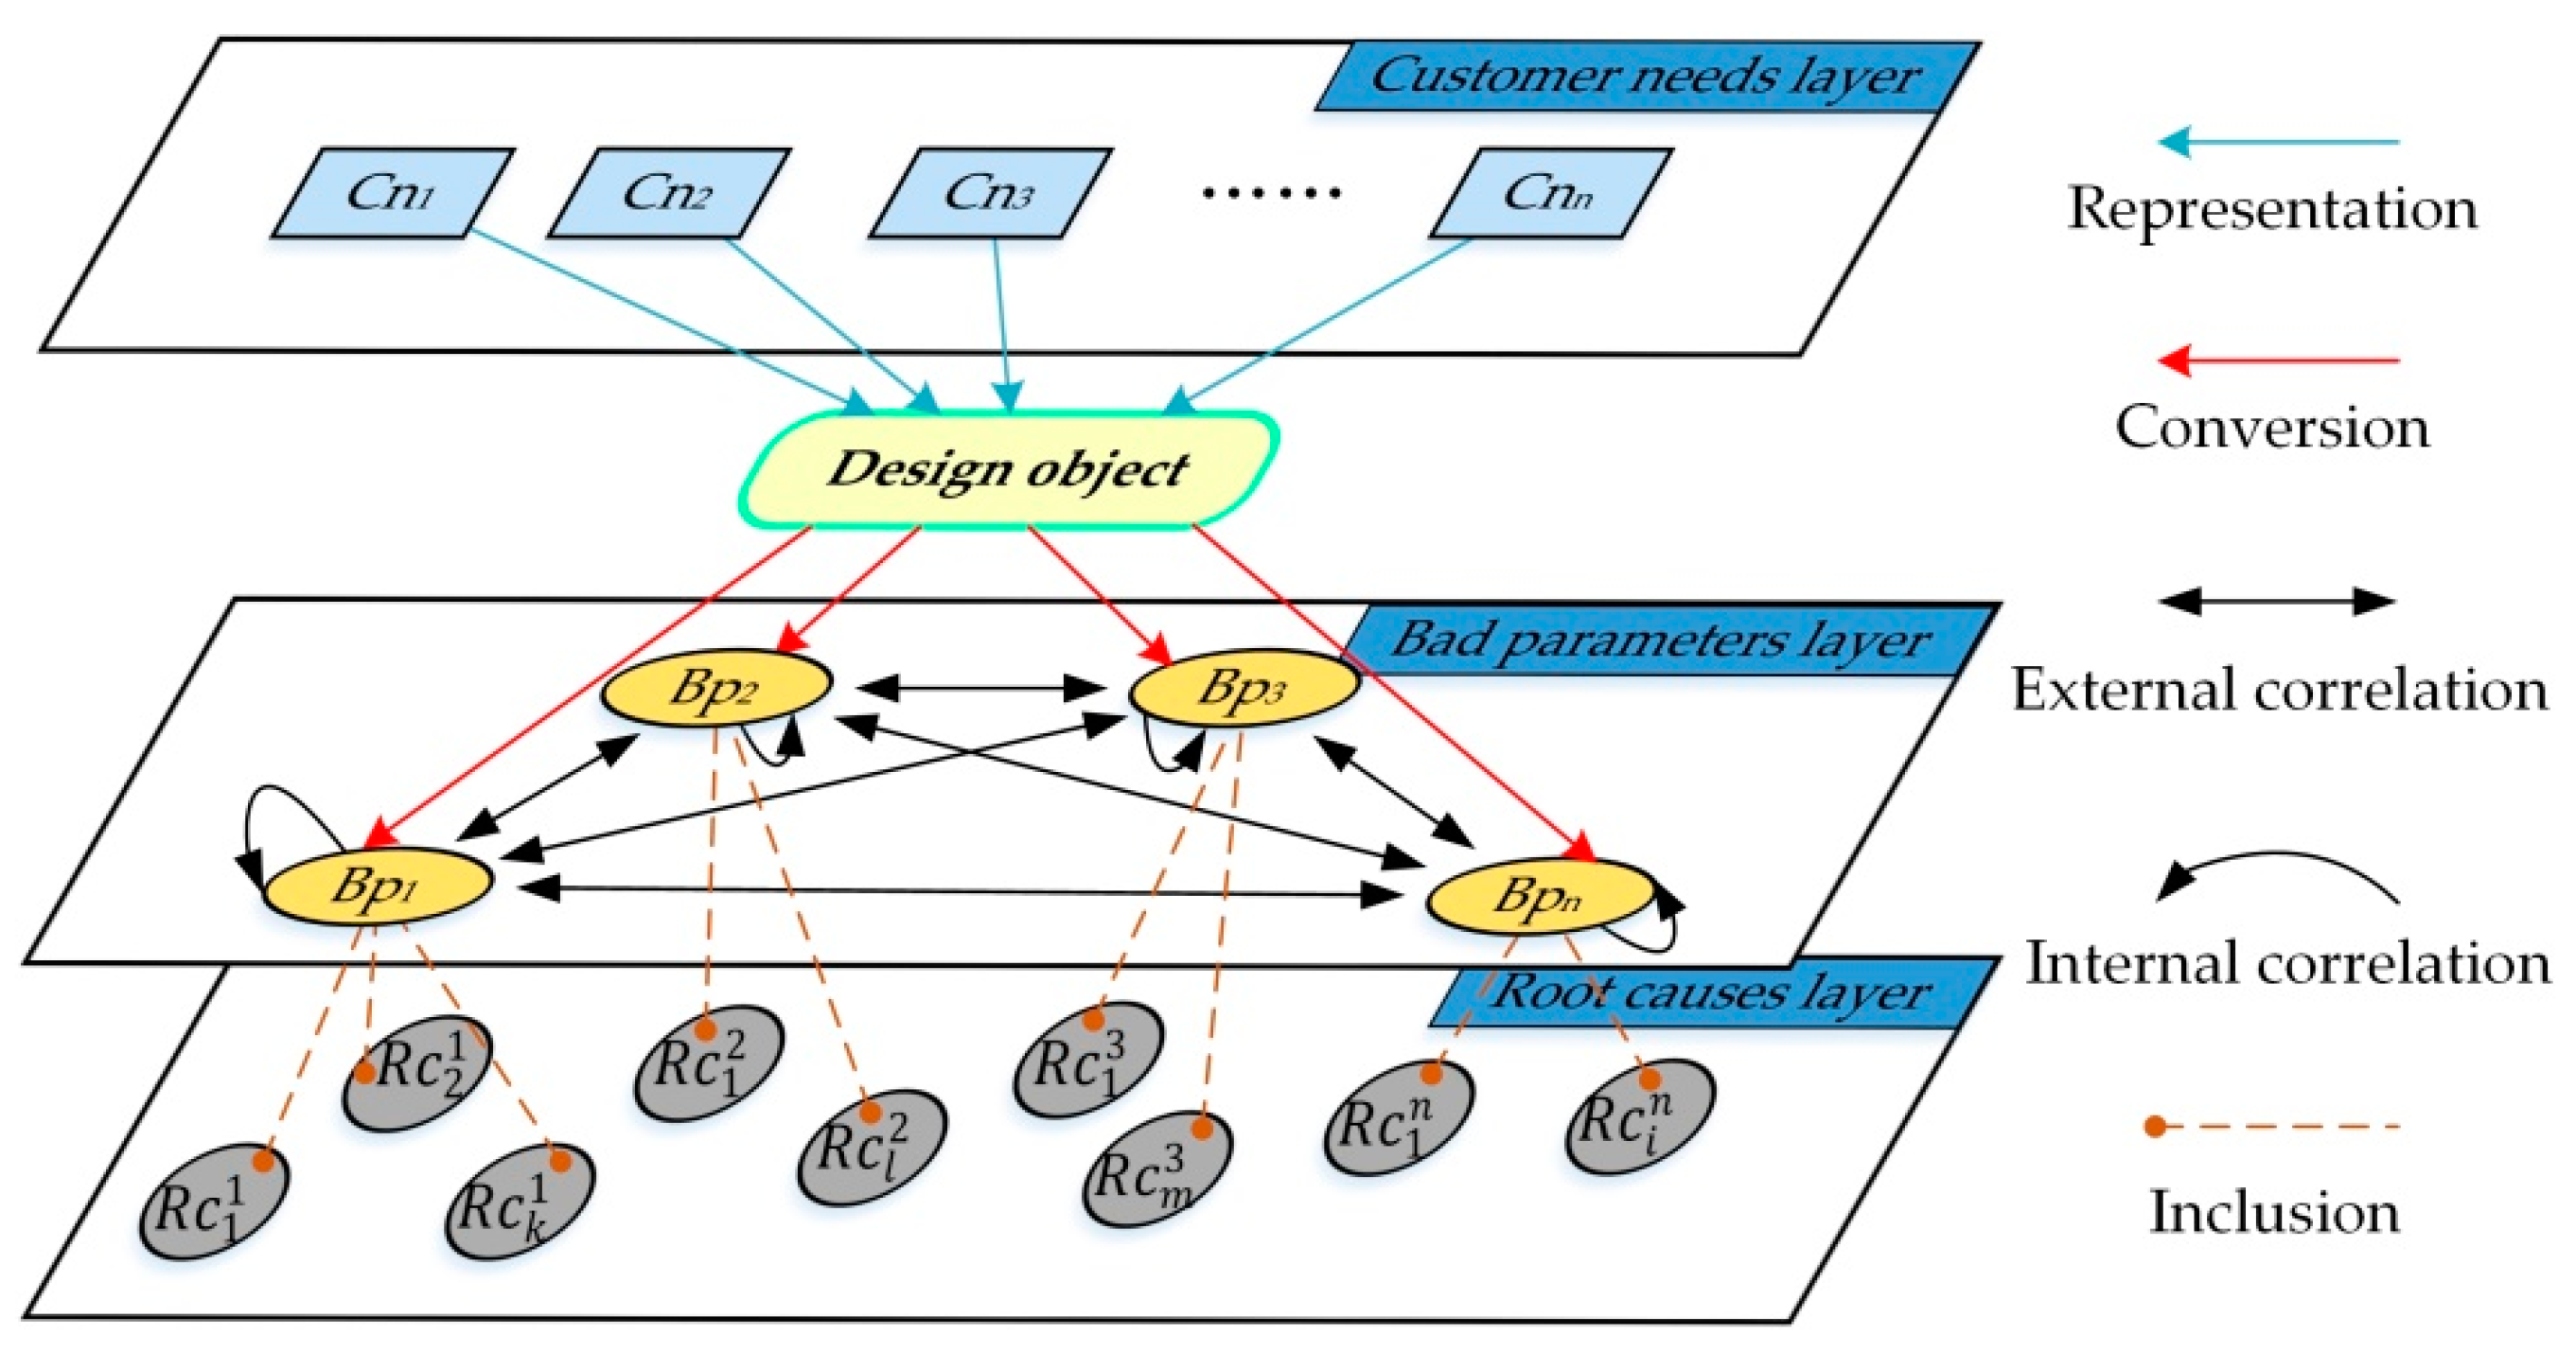
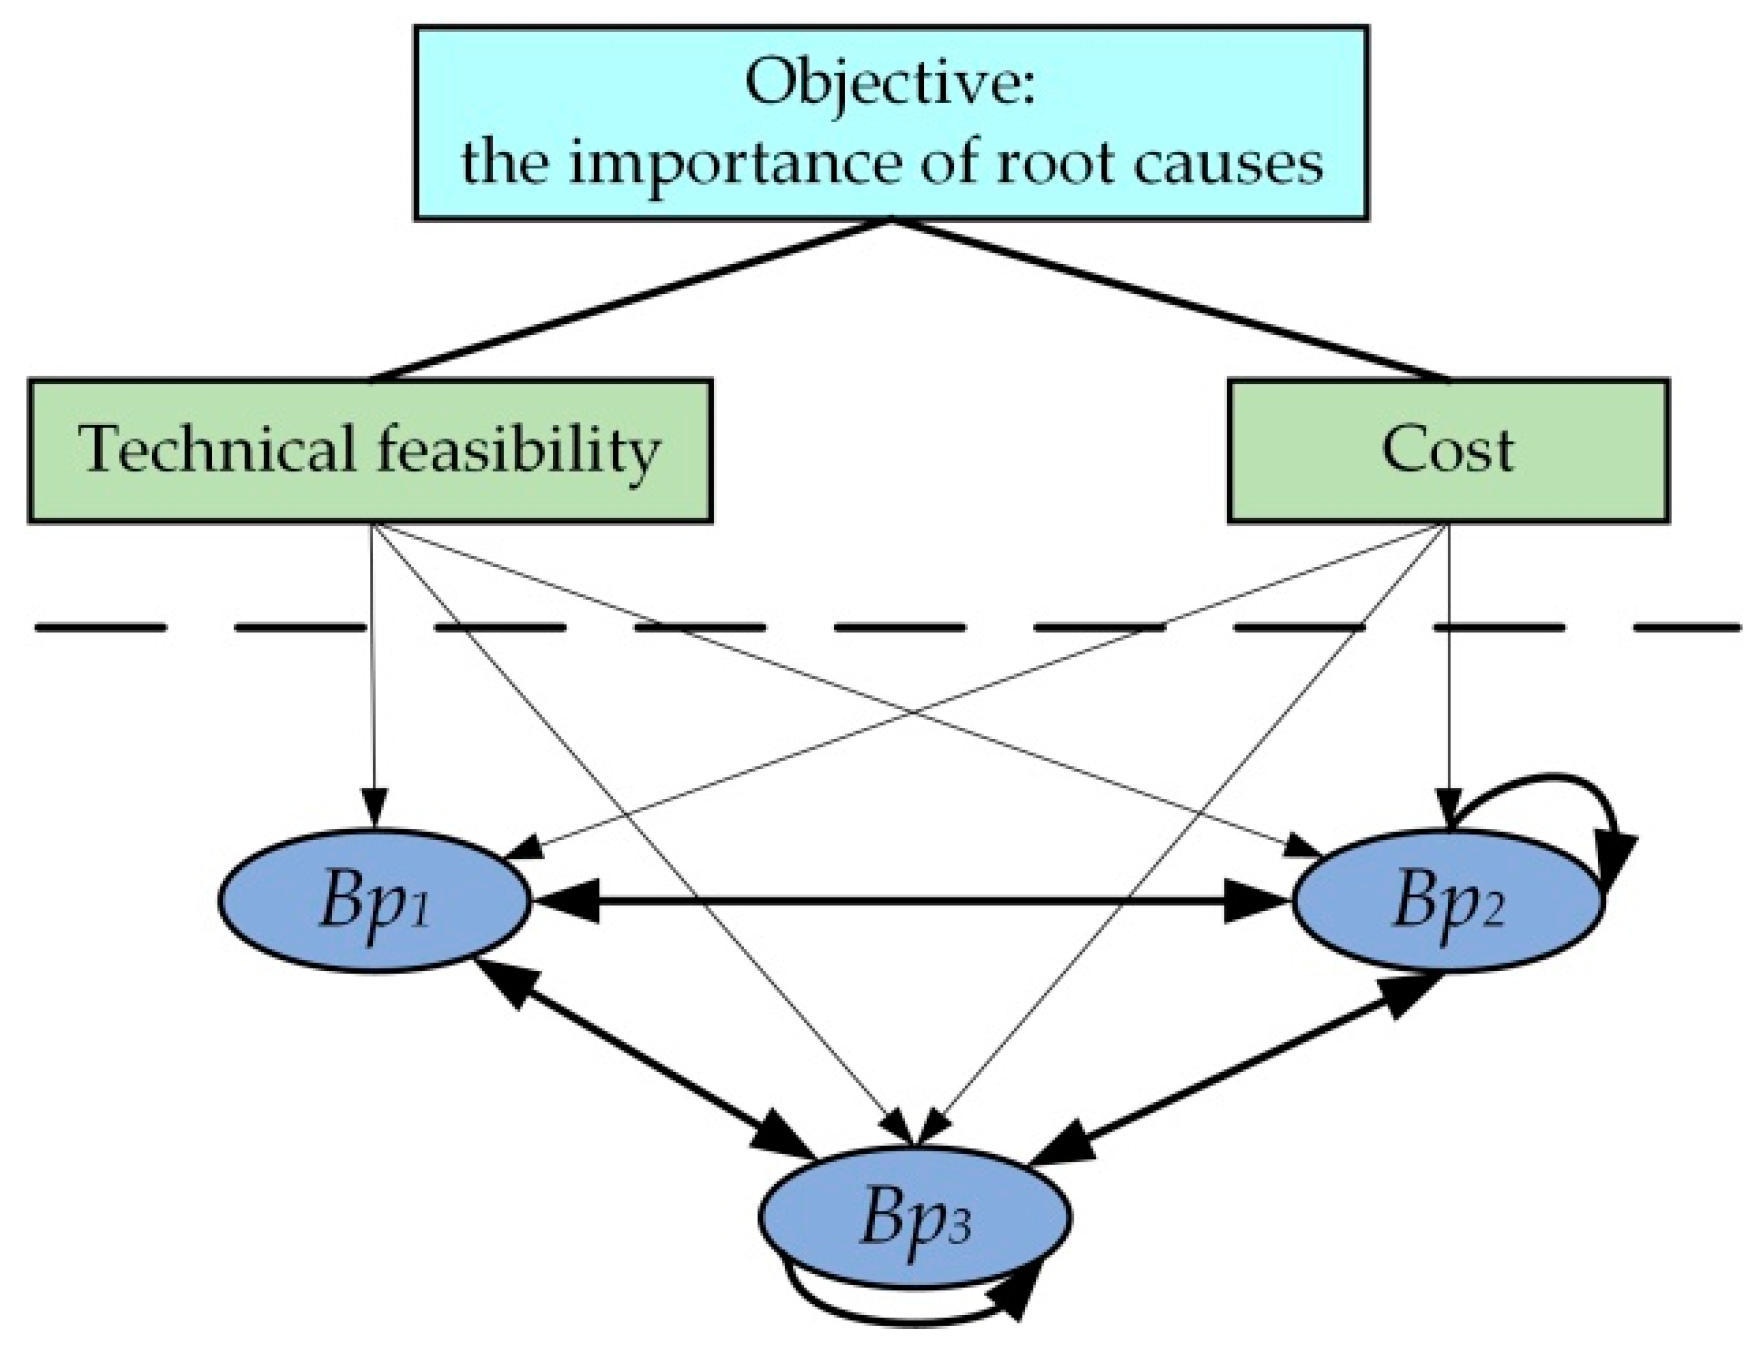
In the hierarchical representation model of the design problem, there is not only an inclusion relationship between the elements in the bad parameters layer and the elements in the root causes layer, but also correlations between bad parameters and root causes. These correlations are characterized by vertical clustering and horizontal correlation. In this paper, a network structure of cluster elements [
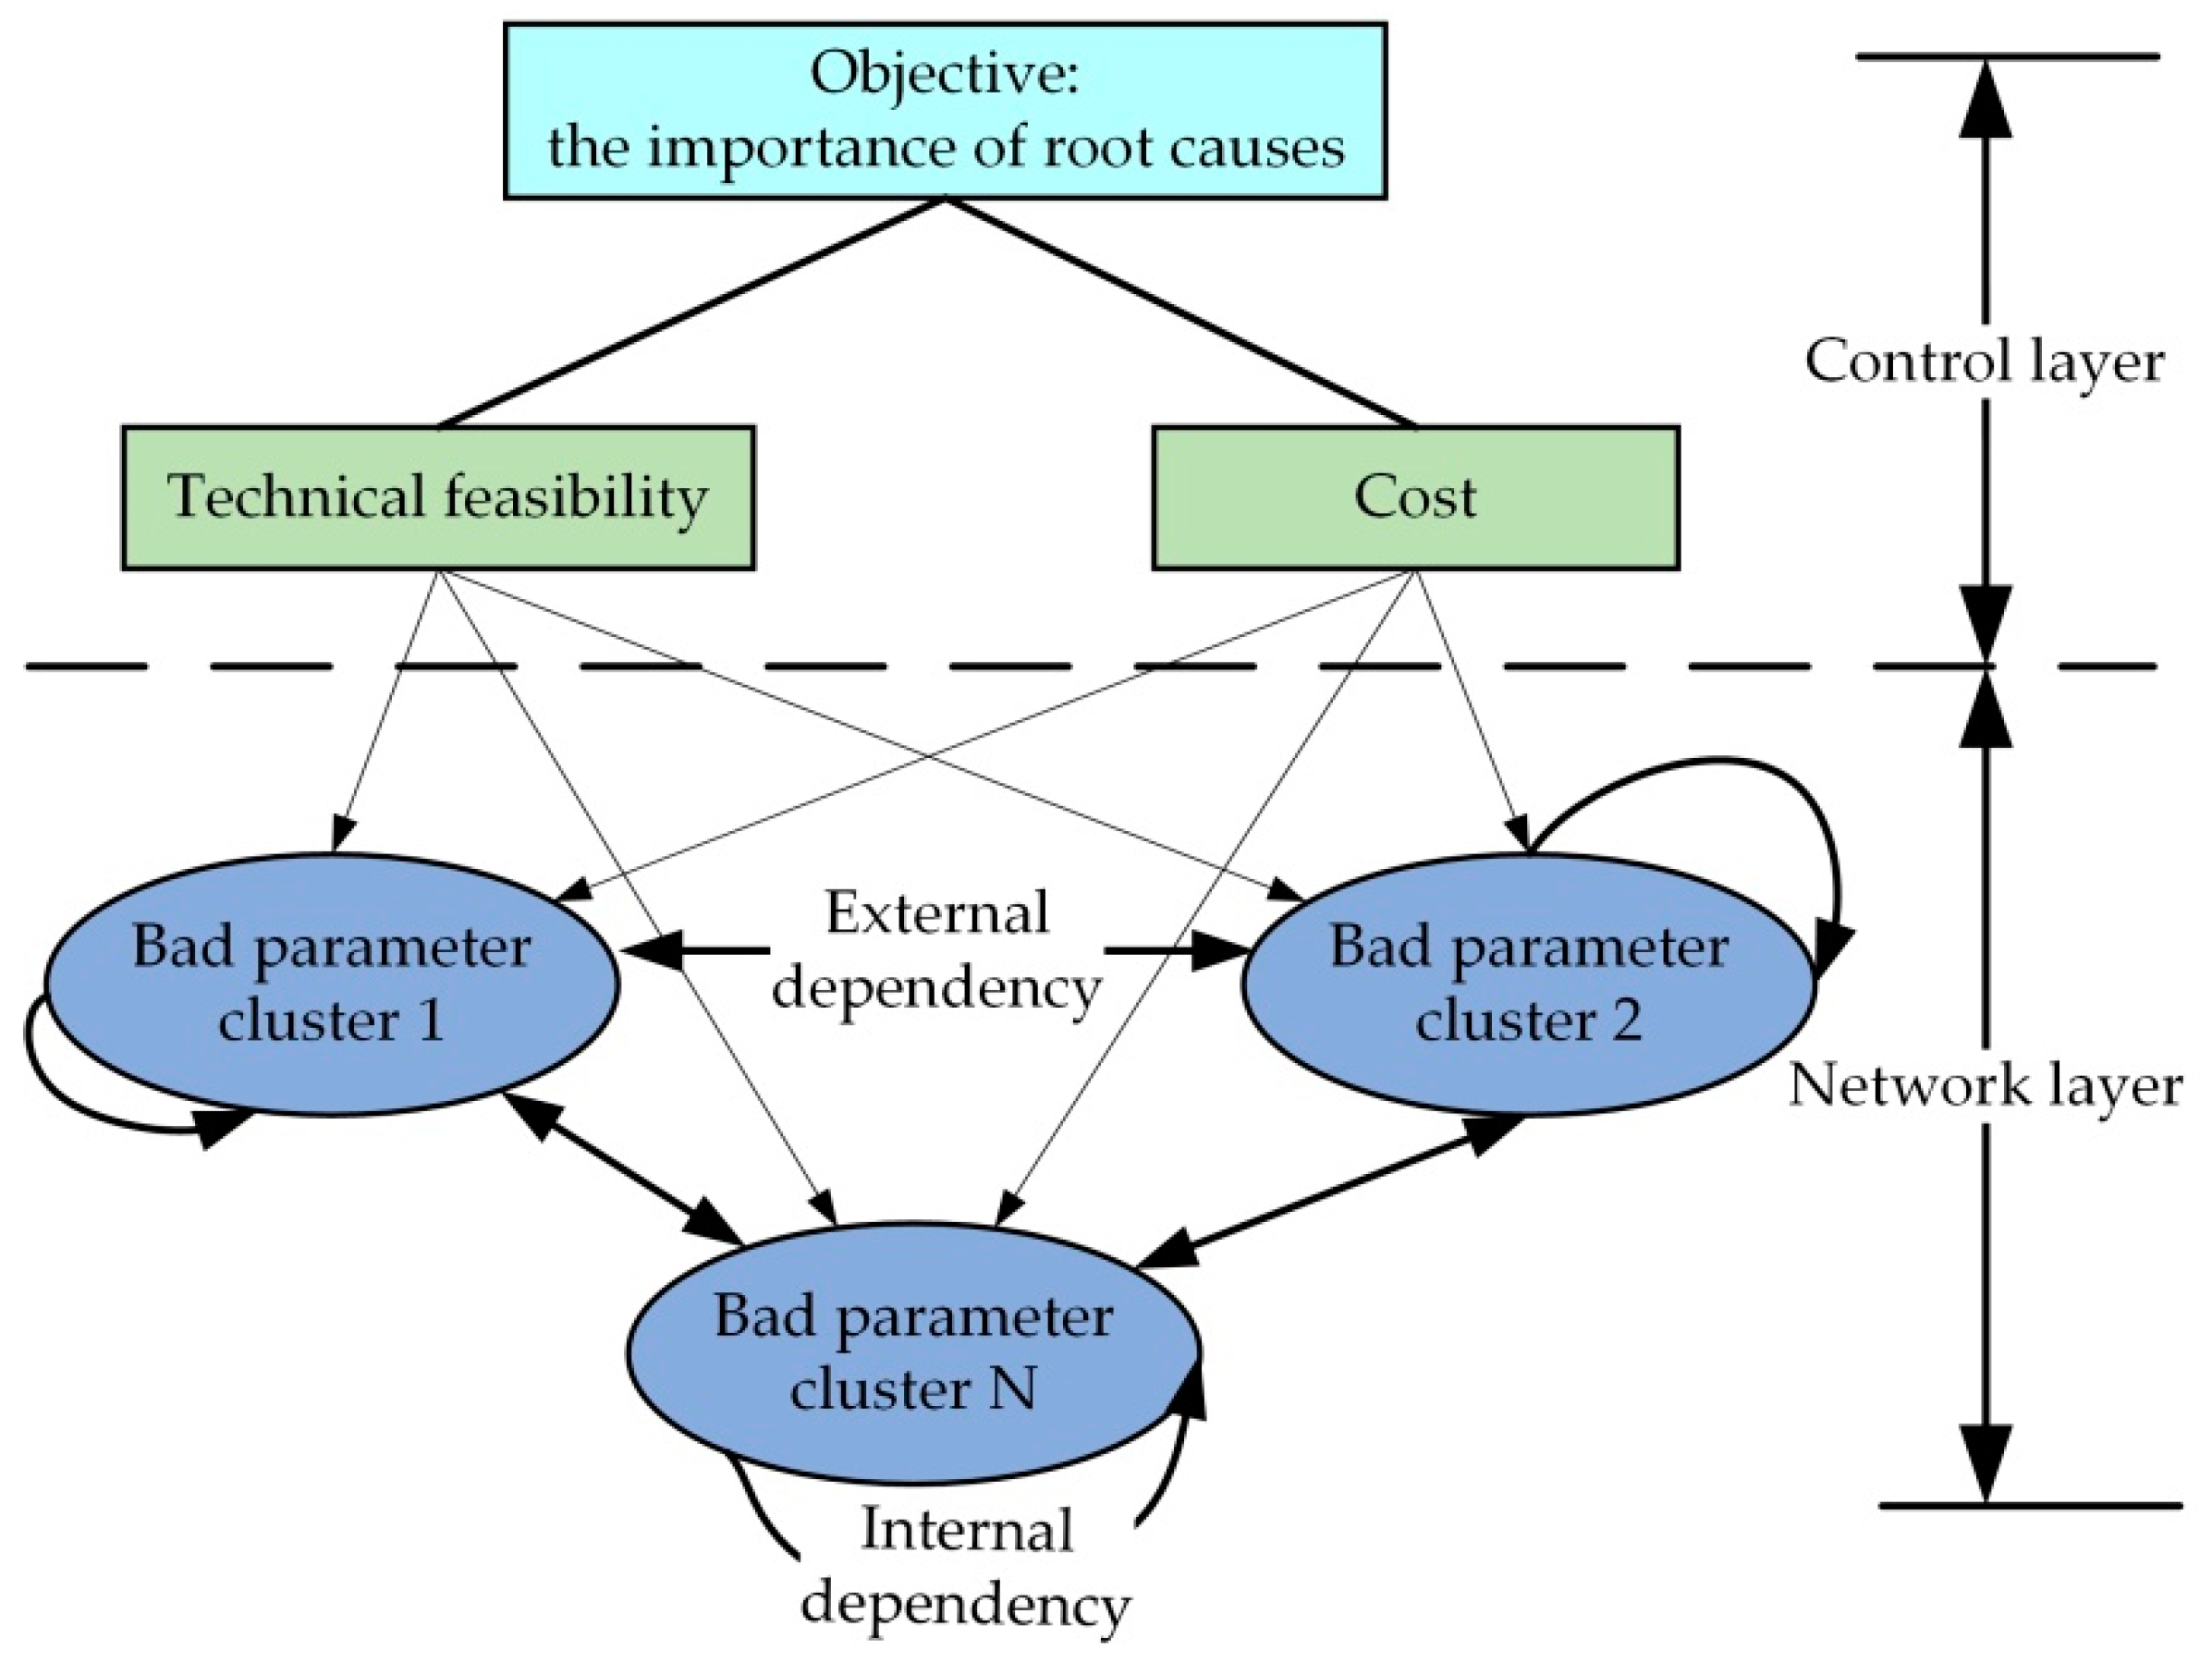
33] is adopted to construct the network layer of bad parameters. In order to analyze the correlations among the clusters of different design problems and obtain the core problems that affect the bad parameters, a control layer, including technical feasibility and cost, is constructed to constrain and evaluate the prospect of solving different design problems.
Analytic network process (ANP) is a multicriteria theoretical measuring method. It obtains the relative priority of an indicator by comparing the relative influence of two elements on a third element under a certain potential criterion [33]. On the one hand, ANP method can be used to consider the correlation of same-level elements with their network structure. On the other hand, it also can be used to constrain and evaluate the ranking of the importance by adopting the control criteria [34,35]. According to the characteristics of ANP method and considering network layer and control layer, the ANP method is adopted in this paper to determine the importance order of root causes.
In this paper, every bad parameter ( B p i ) in the bad parameters layer is called a cluster, and the root cause ( R c j i ) is regarded as an element in the bad parameter cluster ( B p i ). If an element in a cluster affects or is affected by at least one element in another cluster, it is called an externally dependent correlation between two clusters. If an element in a cluster affects or is affected by at least one element in the same cluster, it is called an internally dependent correlation. On this basis, a product hierarchy model is built, as shown in Figure 2.

3.2. Calculation of Importance of Root Causes and Determination of Core Problems

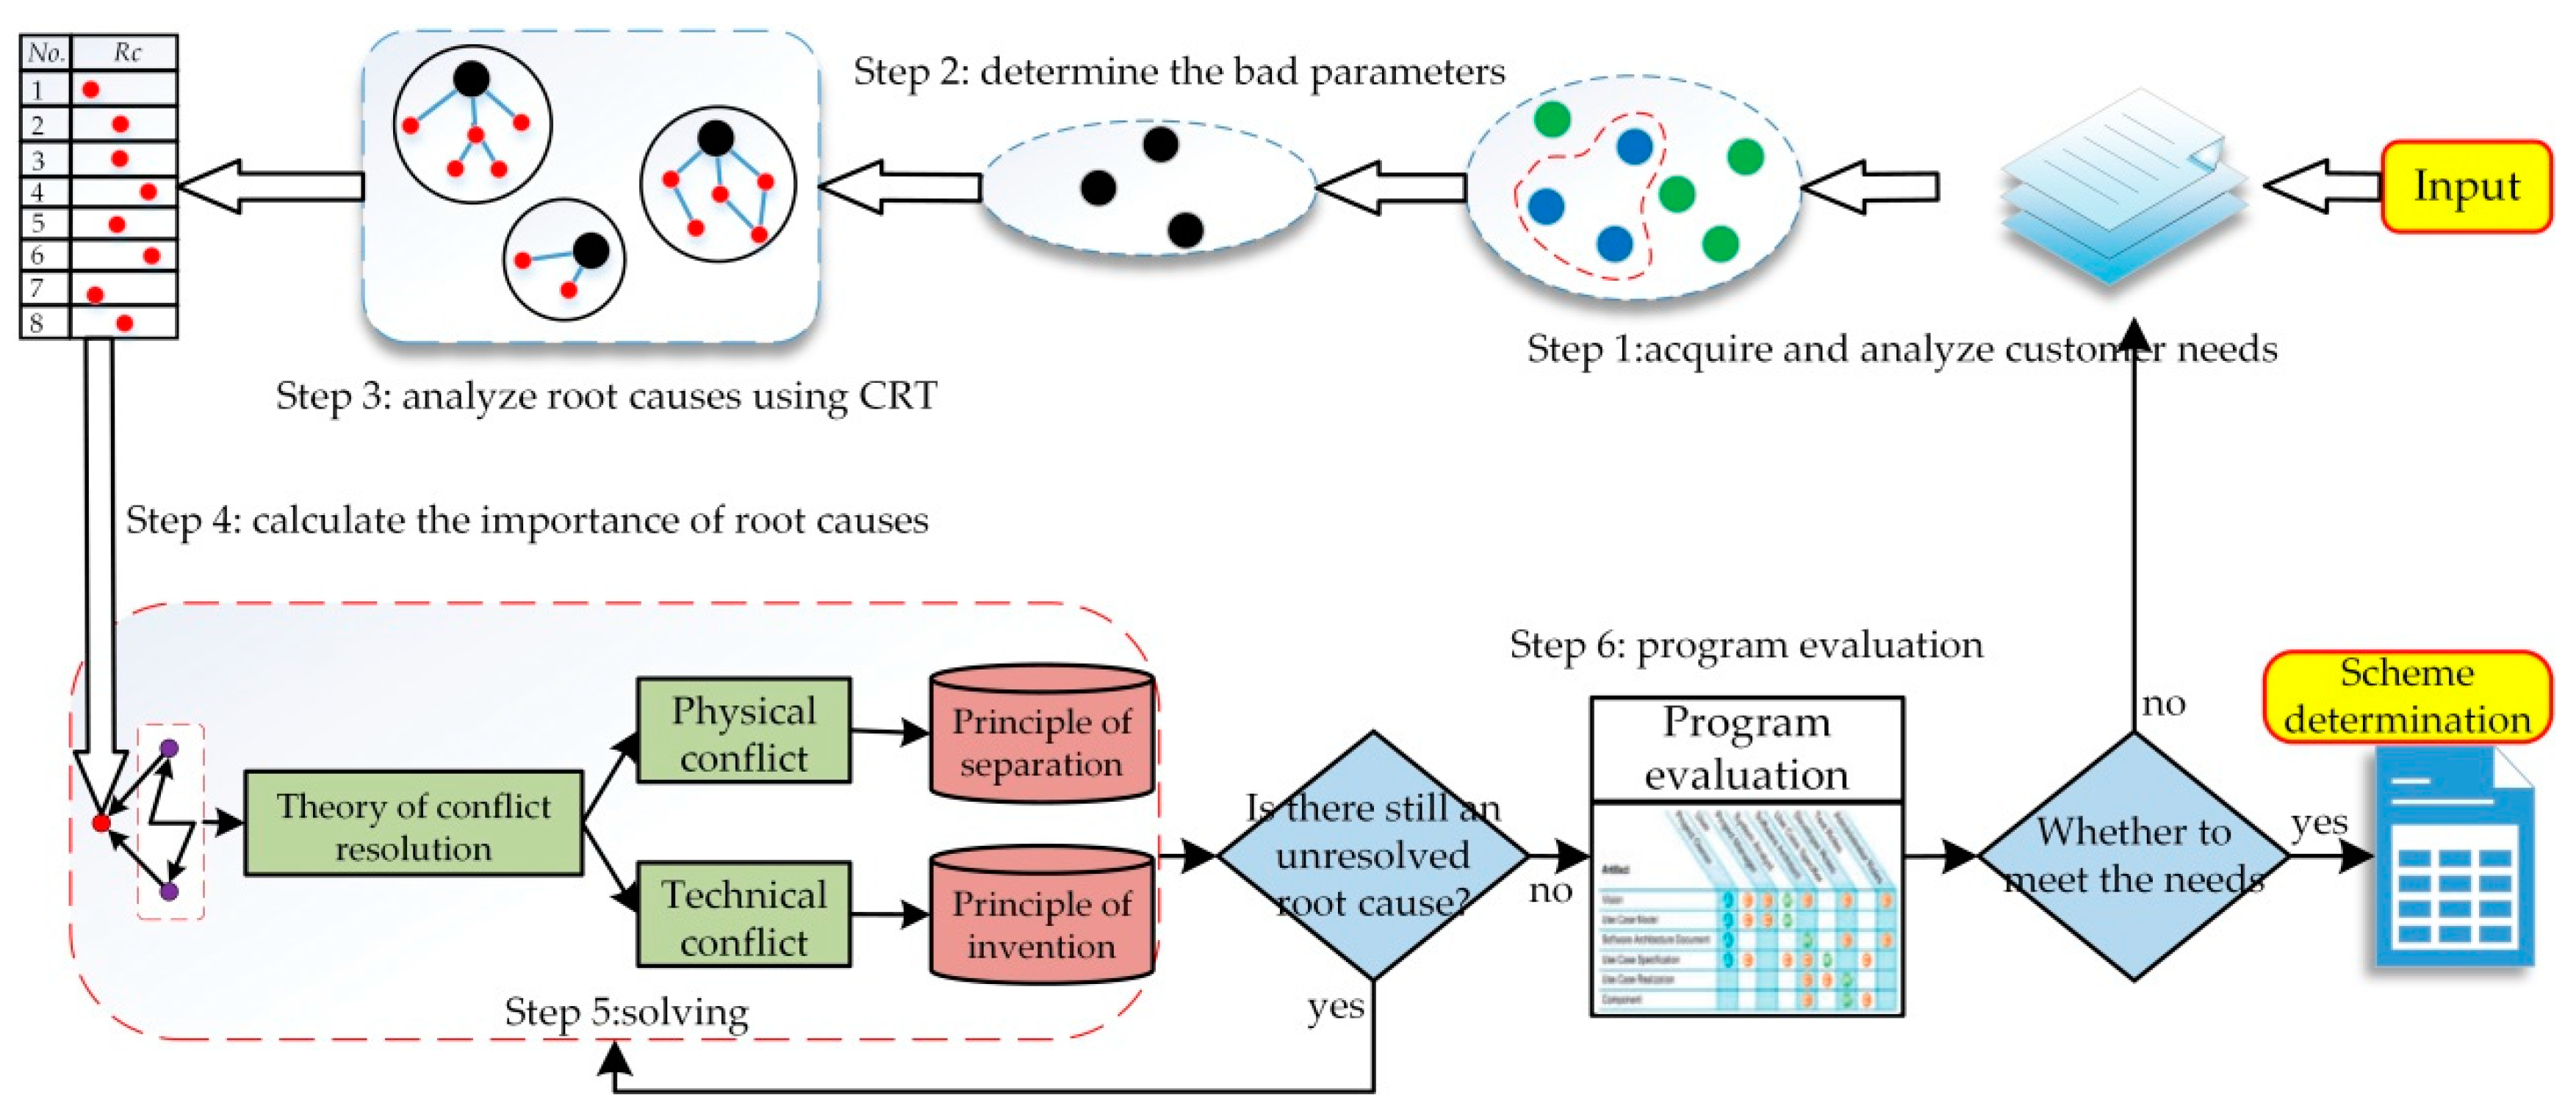
The steps to calculate the importance of root causes and determine the core problems with ANP method are as follows:
Step 1: Construct the judgment matrix ( A m i j ) and calculate the weight vector ( w m ( i j ) ). If an element ( i j ) in a cluster (i) has an external dependency on an element in another cluster (m), or has an internal dependency on an element inside its cluster, this element ( i j ) is taken as a subcriterion. The influence degree of the elements in another cluster (m) to this element ( i j ) is compared in pairs. In this way, the judgment matrix ( A m i j ) is constructed to calculate the corresponding weight vector ( w m i j ). When comparing elements in pairs, an industry expert must determine which element has the greater influence on the third party element ( i j ) and by how much. The comparison value E of the two elements is assigned on a scale of 0–9, and the ratio scale as shown in Table 1. The constructed judgment matrix ( A m i j ) is a positive reciprocal matrix. Taking the above demonstration as an example, the judgment matrix ( A m i j ) and weight vector ( w m ( i j ) = [ w m 1 ( i j ) , w m 2 ( i j ) , , w m n ( i j ) ] T ) are obtained by pairwise comparison, as shown in Table 2.
Step 2: Construct supermatrix ( W p ). The obtained weight vector ( w m i j ) in Step 1 is sequentially written into every column of the matrix in Equation (6). In this way, the submatrix ( W i m ) of the supermatrix is constructed. As shown in Equation (7), all clusters are arranged in numerical order. Then the elements in every cluster are placed vertically and horizontally on the left and top of the supermatrix, respectively. Finally, the submatrix ( W i m ) calculated by Equation (6) is filled into the corresponding position of the supermatrix ( W p ). ( W p ) is constructed with p as a control criterion.
W i m = [ w m 1 ( i 1 ) w m 1 ( i 2 ) w m 1 ( i j ) w m 2 ( i 1 ) w m 2 ( i 2 ) w m 2 ( i j ) w m n ( i 1 ) w m n ( i 2 ) w m n ( i j ) ]
W p = B p 1 B p 2     B p N R c 1 1 R c n 1 1 R c 1 2 R c n 2 2     R c 1 N R c n N N B p 1 R c 1 1 R c n 1 1 B p 2 R c 1 2 R c n 2 2 B p N R c 1 N R c n N N [         W 11 W 12 W 1 N                   W 21 W 22 W 2 N                     W N 1 W N 2 W N N         ]
Step 3: Construct a weighted supermatrix and limit weighted supermatrix. A certain cluster is taken as a subcriterion; the relative importance of the two clusters connected with it is compared to obtain the judgment matrix and weight vector. For example, with cluster ( B p 1 ) as a subcriterion, the judgment matrix is obtained by comparing the connected clusters in pairs, as shown in Table 3.
The obtained weight vectors are sequentially written into the respective columns of the matrix in Equation (8) to obtain the weighted matrix A :
A = [ a 11 a 21 a N 1 a 12 a 22 a N 2 a 1 N a 2 N a N N ] .
Every element ( W ¯ i m ) of the weighted supermatrix ( W ¯ p ) is equal to the corresponding weight ( a i m ) in the weighted matrix A multiplied by the submatrix ( W i m ) in the supermatrix, as shown in Equation (9). Thus, the weighted supermatrix ( W ¯ p ) is obtained:
W ¯ i m = a i m × W i m
W ¯ p = [ a 11 W 11 a 21 W 21 a N 1 W N 1 a 12 W 12 a 22 W 22 a N 2 W N 2 a 1 N W 1 N a 2 N W 2 N a N N W N N ] .
In order to make the weighted supermatrix ( W ¯ p ) accurate, it is necessary to perform a stability treatment on ( W ¯ p ) by calculating its nth power, and letting n tend to infinity. As shown in Equation (11), the limit weighted supermatrix ( W ) is obtained when the value of the columns of the weighted supermatrix ( W ¯ p ) does not change. The value of each row of the limit weighted supermatrix ( W ) is the importance ( w p ) of the corresponding element:
W = lim n W ¯ p n .
Step 4: Calculate the importance of root causes. Technical feasibility ( C T ) and cost ( C C ) are taken as control criteria. So importance ( w T ) and ( w C ) are obtained by calculating the corresponding limit weighted supermatrix according to Steps 1–4. In order to improve the product system performance, two control criteria, technical feasibility ( C T ) and cost ( C C ), are weighted to obtain the corresponding weights ( w C T ) and ( w C C ). These weights of the control criteria are weighted for importance ( w T ) and ( w C ), respectively, as shown in Equation (12), so as to obtain the importance ( W ) of root causes:
W = w C T × w T + w C C × w C .
Step 5: Determine the solving order of root causes and core problems based on the importance. (1) The solution of root causes is carried out in the importance order ( W ). In other words, the higher the importance, the higher the priority of the root causes processing. (2) According to the importance order ( W ), the first root cause ( R c i j ) is determined as the core problem ( C p j ) of the bad parameter ( B p j ).
Based on above contents, the quality and effectiveness of design can be effectively guaranteed. On the one hand, product design activities based on the importance order of core problems will improve the direction of the product system and determine the quality of the design. On the other hand, the solution to the core problem that ranks ahead will be beneficial to solve the non-core problems. This will improve the efficiency of the whole design process.

4. Product Design Process Based on Solving the Core Problem

In order to assist designers to determine design core problems and to provide the right design direction for designers to improve design quality and efficiency, this paper establishes a product design process based on solving the core problem, as shown in Figure 3. The specific steps are as follows:
Step 1: Acquire customer needs, then analyze and standardize them. The sorted customer needs are classified by performance under technical and economic targets to obtain corresponding new product performance targets.
Step 2: Compare new product performance targets with previous ones. Performance targets with poor consistency between the new and previous ones are regarded as the product’s bad parameters.
Step 3: Employ current reality trees (CRTs) to analyze and determine the root causes of the bad parameters.
Step 4: Use the ANP method to calculate the importance of the root causes and determine the core problems.
Step 5: Identify conflicts of the core problems and employ the TRIZ method to solve the core problems. In addition, design for root cause with lower importance should be based on the design solution for root cause with higher importance.
Step 6: Evaluate the solution to get the best conceptual design scheme.

5. Case Studies

The coolant flow distribution device in the lower chamber is applied in the third-generation pressurized water reactor, and its main functions include: (1) to mix the coolant in the lower chamber and suppress the generated vortex; and (2) to evenly distribute the coolant from the lower chamber into the core to ensure complete cooling of the core fuel assembly [36]. In addition, the coolant flow distribution device also plays an auxiliary support role in the core, so it has a certain buffering effect on the falling of the core. The following is an incremental design for the coolant flow distribution device. It uses the method proposed in this paper to determine the core design problems and offer solving strategies.

5.1. Importance Analysis of Root Causes of the Coolant Flow Distribution Device

According to the investigation of reactor customers, customer needs for the current coolant flow distribution device [37] include good flow distribution effect ( C n 1 ), good vortex suppression effect ( C n 2 ), simple structure ( C n 3 ), prevention for core falling ( C n 4 ), sufficient strength ( C n 5 ), and small vibration ( C n 6 ). Customer needs are classified by performance under technical and economic targets to achieve corresponding new performance targets of the coolant flow distribution device.
By comparing new performance targets with previous ones, the bad parameters of the coolant flow distribution device are determined as follows: the uniformity for flow distribution is poor ( B p 1 ), and there are complex structures ( B p 2 ), and lots of vortices ( B p 3 ).
According to the bad parameters of the coolant flow distribution device, current reality trees are established to determine the root causes, as shown in Figure 4. Figure 4a–c shows CRT diagrams of the bad parameters: the uniformity for flow distribution is poor ( B p 1 ), and there are complex structures ( B p 2 ) and lots of vortices ( B p 3 ).
According to the correlation between bad parameters and internal root causes, the hierarchical structure model of the coolant flow distribution device is set up as shown in Figure 5. The importance of root causes is calculated by using the ANP method.
The judgment matrix is constructed according to the influence relationship among root causes. Then the weight vector is calculated. For example, the technical feasibility ( C T ) and root cause ( R c 2 1 ) are taken as the control criterion and subcriterion, respectively. The judgment matrix ( A 3 1 2 ) and weight vector ( w 3 ( 1 2 ) ) are obtained by comparing the influence degree between the root causes { R c 1 3 , R c 2 3 , R c 3 3 , R c 4 3 } of the bad parameter ( B p 3 ) cluster, as shown in Table 4.
Similarly, the judgment matrices ( A m i j ) among root causes are constructed, and the weight vectors ( w m ( i j ) ) are achieved. The weight vectors are sequentially written into the subcolumn corresponding to the supermatrix ( W T ). Then the unweighted supermatrix of the coolant flow distribution device is obtained as shown in Table 5.
According to the mutual influence among the clusters, the relative importance of the two clusters connected with a certain cluster is compared under the subcriterion. Then the judgment matrix and weight vectors are obtained. The weight vectors are sequentially written into the columns of the matrix in Table 6, thereby the weighted matrix ( A ) of the clusters is obtained.
The corresponding weight ( a i m ) in the weighted matrix A is multiplied by the submatrix ( W i m ) in the supermatrix to obtain the weighted supermatrix ( W ¯ T ), as shown in Table 7.
The limit weighted supermatrix ( W ) with technical feasibility ( C T ) as the control criterion is obtained by calculating the limit ( W = lim n W ¯ T n ), as shown in Table 8.
When technical feasibility ( C T ) is taken as a control criterion, the importance of root causes can be seen (Table 7):
w T = [ 0.06797 ,   0.24441 ,   0.28464 ,   0.19897 ,   0.07708 ,   0.04730 ,   0.00536 ,   0.00646 ,   0.06781 ] T .
In the same way, the importance of root causes can be obtained when cost ( C C ) is taken as a control criterion:
w C = [ 0.07361 ,   0.22145 ,   0.21058 ,   0.11387 ,   0.06148 ,   0.12448 ,   0.08122 ,   0.00250 ,   0.11082 ] T .
The weights of control layer elements given by experience are w C T = 0.5 and w C C = 0.5 . According to Equation (12), the importance of every root cause can be obtained as follows:
W = [ 0.07079 ,   0.23293 ,   0.24761 ,   0.15642 ,   0.06828 ,   0.08589 ,   0.04329 ,   0.00448 ,   0.08931 ] T .
The order of importance of every root cause is R c 1 2 , R c 2 1 , R c 2 2 , R c 4 3 , R c 1 3 , R c 1 1 , R c 3 2 , R c 2 3 , R c 3 3 . Therefore, core problems C p 1 , C p 2 , C p 3 can be determined by the order, which is R c 2 1 , R c 1 2 , R c 4 3 .

5.2. Solving the Root Causes Sequentially Based on Importance

According to the CRD diagram of core problem C p 2 (a lot of detachable connectors) shown in Figure 6, a conflict between the number of fixed connectors and the number of components exists in the lower chamber. If the number of components is reduced, the number of fixed connectors will increase. The engineering parameters for improvement and deterioration can be defined by TRIZ as energy consumption of stationary objects and productivity, respectively. The vortex suppression plate is designed as a cylindrical shape according to the principle of versatility (No. 6), as shown in the flow distribution cylinder in Figure 7. The cylinder can not only suppress the vortex, but also distribute the flow and effectively support the upper flow equalizing plate. In this way, the number of detachable connectors is reduced. The cylinder has a supporting function. It indirectly reduces the number of supporting columns in the lower chamber and the amount of coolant blocked by the components at a certain extent. Therefore, the solution to root cause ( R c 1 2 ) also solves root cause ( R c 2 2 ) (a lot of supporting columns) and root cause ( R c 1 3 ) (components hinder coolant).
If the root cause ( R c 2 2 ) is solved first, the number of supporting columns will be reduced by the trimming method according to TRIZ. However, this solution cannot solve the core problem ( C p 2 ).
The CRD diagram of core problem C p 1 (the coolant flow in the middle of the lower chamber is greater than that in the periphery) is set up, as shown in Figure 8. It can be seen that the reduction in the dimension of the active plates requires the setting of special holes in the active plates in the lower chamber. The engineering parameters for improvement and deterioration can be defined by TRIZ as the loss of substance and the quantity of substance or things, respectively. The flow equalizing plate with a cap structure is designed based on the principle of pre-action (No. 10) and the characteristics of flow equalizing plate. It can distribute the intermediate coolant at a certain proportion to the surrounding areas in advance. The design solution of the core problem C p 2 is flow distribution cylinder. If the cap structure is set on the flow equalizing plate that is installed on the flow distribution cylinder, the cap structure will hinder the flow distribution function of the cylinder. According to above definition: design for root cause with lower importance should be based on the design solution for root cause with higher importance, and in order to eliminate the adverse effect on flow distribution function, the cap structure should be set at the bottom of the flow distribution cylinder, as shown in Figure 7. There is a certain inclination angle on the surface of the cap structure, and its holes are set perpendicular to the surface. When the intermediate fluid passes through the cap structure, the cap structure can distribute the intermediate coolant to the surroundings according to its surface and the holes.
If the solution order of the core problem C p 1 and C p 2 is exchanged, the flow equalizing plate with a cap structure is designed first, then the flow distribution cylinder is designed. According to above definition, the flow equalizing plate with a cap structure is installed on the cylinder. In this way, the coolant passes through the cylinder and then passes through the cap structure. However, the cylinder has already distributed the coolant. When the coolant passes through the flow equalizing plate, the cap structure will distribute the coolant again. It will cause a negative effect and is not good for the prediction of coolant movement.
The CRD diagram of core problem C p 3 (motion direction of coolant changes dramatically) is established, as shown in Figure 9. Whether the structure of the flow channel should be changed or not is a physical conflict in the lower chamber. The principle of spatial dimension change (No. 17) in spatial separation is selected to design a stepped flow channel inside the pressure vessel bottom head. In this way, the variation degree of flow direction of coolant is effectively reduced. The structures inside the pressure vessel bottom head is changed by the stepped flow channel. Thereby, it also solves the root cause ( R c 2 3 ) (curved channel structure of pressure vessel bottom head).
The CRD diagram of the root cause ( R c 1 1 ) (core support plate has no function of equalizing flow) is established as shown in Figure 10. A pair of physical conflicts can be seen over the unequal or equal dimension of the hole on the core support plate. In the light of the principle of local mass (No. 3) in spatial separation and the continuity equation of hydrodynamics, the cross section of every inlet hole of the core support plate enlarges gradually from the middle to the periphery, and every outlet hole has the same cross section, as shown in the inverted cone structure in Figure 7.
The root causes R c 3 2 (energy-absorbing device) and R c 3 2 (the pressure at the inlet is too high) are less important and not the core problems. Moreover, the energy-absorbing device is a measure for preventing the core from falling. The pressure at the inlet is an unchangeable parameter set by the nuclear reactor. Therefore, it is verified that the importance of root causes and core problems determined in this paper is in line with the actual design requirements.

5.3. Conceptual Design Scheme Generation

Through the optimization of the scheme, the conceptual design scheme of the coolant flow distribution device was finally obtained, as shown in Figure 7. The hole of the core support plate retains the previous upper straight hole, and the taper hole is set on its bottom. The taper gradually decreases from the middle to the periphery at a certain proportion, and the axial length ratio of the two types of holes and the taper ratio of the taper hole can be adjusted according to the actual requirements. There is not only the function of vortex suppression, but also the function of flow distribution on the flow distribution cylinder. It can effectively support the upper flow equalizing plate, and the bottom of the cylinder is also provided with a cap structure. The surface of the cap structure has a certain inclination angle and is also provided with holes perpendicular to the surface.

5.4. Simulation Analysis

Computational Fluid Dynamics (CFD) software has been widely used in engineering fields [38,39]. Therefore, in order to verify the effectiveness of conceptual design scheme, CFD software is used to analyze the coolant flow characteristics of design scheme. Firstly, a three-dimensional model of the design scheme was built by Solidworks (Dassault Systemes: Massachusetts, MA, USA); secondly, the fluid field was divided into meshes by Meshing (Ansys: Canonsburg, PA, USA); and finally, the flow field was calculated by Fluent (Ansys: Canonsburg, PA, USA) software. The boundary conditions were set as follows:
(1)
Turbulent model: K-epsilon (2 eqn)-standard
(2)
Fluid material: water (liquid)
(3)
Wall: no slip
(4)
Inlet (velocity inlet): velocity magnitude: 5.084 m/s;
turbulent intensity: 1.755%; hydraulic diameter: 1200 mm
(5)
Outlet (pressure outlet): gauge pressure: 0 pa
(6)
Convergence absolute criterion: 10 3
(7)
Number of meshes: 5.37 million
After calculation, the flow field of the design scheme of the lower chamber is obtained, as shown in Figure 11.

6. Conclusions

In this paper, according to the characteristics of incremental innovation problems, the design core problems and the corresponding solving strategy were obtained based on the hierarchical representation model of the design problem. The main work included the following:
(1) A hierarchical representation model of the design problem was established, including customer needs, bad parameters, and root causes. It is based on the interaction among them, and can help designers to determine design core problems.
(2) This paper took into account the network layer and control layer in the hierarchical representation model of the design problem. Then, a method based on the network analytic hierarchy process was proposed to rank the importance of the root causes of the design problem and determine the core problems.
(3) Based on the core problems and the importance of the root causes of the bad parameters in the product system, an incremental product design process adopting TOC and TRIZ tools is established.
(4) The effectiveness of the proposed method was verified by a specific application in the design for a coolant flow distribution device in the lower chamber of a third-generation pressurized water reactor.
In order to better apply the proposed method to practical design activities, several aspects still need to be addressed: (1) improving the reasoning mechanism of design knowledge in the process of solving design problems and establishing a corresponding design knowledge base; and (2) developing a corresponding computer-aided design system based on the determination of core problems.

Author Contributions

Resources, Y.L. (Yin Luo) and Y.L. (Yan Li); Writing—original draft, Y.X.; Writing—review and editing, W.Q.L. and S.L.

Funding

This work was supported by the National Natural Science Foundation of China (grant number 51435011), the Science and Technology Ministry Innovation Method Program, China (grant number 2017IM040100), and Sichuan university-Luzhou strategic cooperation project (2017CDLZ-G11).

Acknowledgments

The authors would like to thank the anonymous referees and academic editor for their very valuable comments.

Conflicts of Interest

The authors declare no conflict of interest.

References

  1. Mugge, R.; Dahl, D.W. Seeking the Ideal Level of Design Newness: Consumer Response to Radical and Incremental Product Design. J. Prod. Innovat. Mang. 2013, 30, 34–47. [Google Scholar] [CrossRef]
  2. Wood, K.L.; Jensen, D.; Bezdek, J. Reverse engineering and redesign: Courses to incrementally and systematically teach design. J. Eng. Educ. 2001, 90, 363–374. [Google Scholar] [CrossRef]
  3. Parsons, G. The Philosophy of Design, 1st ed.; Polity Press: Cambridge, UK, 2016. [Google Scholar]
  4. Li, Y.; Li, X.L.; Zhao, W. Research on product creative design with cognitive psychology. Comput. Integr. Manuf. Syst. 2005, 9, 1201–1207. [Google Scholar]
  5. Ko, Y.; Chen, M.; Yang, C. Modelling a contradiction-oriented design approach for innovative product design. Proc. Inst. Mech. Eng. B-J. Eng. 2014, 229, 199–211. [Google Scholar] [CrossRef]
  6. Li, W.; Li, Y.; Wang, J. The process model to aid innovation of products conceptual design. Expert Syst. Appl. 2010, 37, 3574–3587. [Google Scholar] [CrossRef]
  7. Cho, H.; Park, J. Cost-effective concept development using functional modeling guidelines. Robot Comput. Integr. Manuf. 2019, 55, 234–249. [Google Scholar] [CrossRef]
  8. Li, T. RETRACTED ARTICLE: Applying TRIZ and AHP to develop innovative design for automated assembly systems. Int. J. Adv. Manuf. Technol. 2010, 46, 1–4. [Google Scholar] [CrossRef]
  9. Vinodh, S.; Kamala, V.; Jayakrishna, K. Integration of ECQFD, TRIZ, and AHP for innovative and sustainable product development. Appl. Math. Model. 2014, 38, 2758–2770. [Google Scholar] [CrossRef]
  10. Lucchetta, G.; Bariani, P.F.; Knight, W.A. Integrated Design Analysis for Product Simplification. CIRP. Ann.-Manuf Technol. 2005, 54, 147–150. [Google Scholar] [CrossRef]
  11. Caligiana, G.; Liverani, A.; Francia, D. Integrating QFD and TRIZ for innovative design. J. Adv. Mech. Des. Sys. Manuf. 2017, 11, JAMDSM0015. [Google Scholar] [CrossRef]
  12. Liu, X.Z.; Qi, G.N.; Fu, J.Z. A design process model of integrated morphological matrix and conflict resolving principles. J. Zhejiang Univ.-SCI. 2012, 12, 2243–2251. [Google Scholar]
  13. Li, M.; Ming, X.; Zheng, M. An integrated TRIZ approach for technological process and product innovation. Proc. Inst. Mech. Eng. B-J. Eng. 2015, 231, 1062–1077. [Google Scholar] [CrossRef]
  14. Ko, Y. Modeling a hybrid-compact design matrix for new product innovation. Comput. Ind. Eng. 2017, 107, 345–359. [Google Scholar] [CrossRef]
  15. Stratton, R.; Mann, D. Systematic innovation and the underlying principles behind TRIZ and TOC. J. Mater. Process Technol. 2003, 139, 120–126. [Google Scholar] [CrossRef]
  16. Nahavandi, N.; Parsaei, Z.; Montazeri, M. Integrated framework for using TRIZ and TOC together: A case study. Int. J. Bus. Innov. Res. 2011, 5, 309–324. [Google Scholar] [CrossRef]
  17. Huang, W.; Hou, L.; Zhao, N. Product Innovation and Evaluation Based on TOC and TRIZ. Adv. Mater. Res. 2012, 421, 709–712. [Google Scholar] [CrossRef]
  18. Hua, Z.; Gu, L.; Wang, W. TOC & TRIZ based product design method and its application. Comput. Integr. Manuf. Syst. 2006, 817–822. [Google Scholar] [CrossRef]
  19. Huang, S.; Liu, X.; Ai, H. Research on application of process model for product concept creative design based on TRIZ and TOC. Int. J. Interact. Des. Manuf. 2017, 11, 957–966. [Google Scholar] [CrossRef]
  20. Zhang, J.; Liang, R.; Hao, B. The Problem Flow Network Building and Solving Process Model for Complex Product. Chin. J. Mech. Eng. 2018, 1–15. [Google Scholar] [CrossRef]
  21. Wei, Z.; Tan, R.; Ma, L. Research on complex problem analysis in TRIZ. In Proceedings of the IEEE 2008 International Conference on Management of Innovation and Technology, Bangkok, Thailand, 21–24 September 2008. [Google Scholar] [CrossRef]
  22. Shu, M.; Cheng, C.; Chang, J. Using intuitionistic fuzzy sets for fault-tree analysis on printed circuit board assembly. Microelectron. Reliab. 2006, 46, 2139–2148. [Google Scholar] [CrossRef]
  23. Hiraoka, Y.; Murakami, T.; Yamamoto, K. Method of Computer-Aided Fault Tree Analysis for High-Reliable and Safety Design. IEEE Trans. Reliab. 2016, 65, 687–703. [Google Scholar] [CrossRef]
  24. Morello, M.G.; Cavalca, K.L.; Silveira, Z.D.C. Development and reduction of a fault tree for gearboxes of heavy commercial vehicles based on identification of critical components. Qual. Reliab. Eng. Int. 2010, 24, 183–198. [Google Scholar] [CrossRef]
  25. Garcia, P.A.A.; Schirru, R.; Frutuoso, E.; Melo, P.F. A fuzzy data envelopment analysis approach for FMEA. Prog. Nucl. Energy 2005, 46, 359–373. [Google Scholar] [CrossRef]
  26. Azadeh, A.; Sheikhalishahi, M.; Aghsami, A. An integrated FTA-DFMEA approach for reliability analysis and product configuration considering warranty cost. Prod. Eng. Res. Devel. 2015, 9, 635–646. [Google Scholar] [CrossRef]
  27. Zhai, G.; Zhou, Y.; Ye, X. A method of multi-objective reliability tolerance design for electronic circuits. Chin. J. Aeronaut. 2013, 26, 161–170. [Google Scholar] [CrossRef]
  28. Mocko, G.M.; Paasch, R. Incorporating Uncertainty in Diagnostic Analysis of Mechanical Systems. In Proceedings of the ASME 2002 International Design Engineering Technical Conferences and Computers and Information in Engineering Conference, Montreal, QC, Canada, 29 September–2 October 2002. [Google Scholar] [CrossRef]
  29. Yazdani, A.; Tavakkoli-Moghaddam, R. Integration of the fish bone diagram, brainstorming, and AHP method for problem solving and decision making—A case study. Int. J. Adv. Manuf. Technol. 2012, 63, 651–657. [Google Scholar] [CrossRef]
  30. Zhang, X.; Auriol, G.; Eres, H. A prescriptive approach to qualify and quantify customer value for value-based requirements engineering. Int. J. Comput. Integr. Manuf. 2013, 26, 327–345. [Google Scholar] [CrossRef]
  31. Shimomura, Y.; Nemoto, Y.; Ishii, T. A method for identifying customer orientations and requirements for product–service systems design. Int. J. Prod. Res. 2017, 1–11. [Google Scholar] [CrossRef]
  32. Chen, Y.; Zhao, M.; Xie, Y. A new model of conceptual design based on Scientific Ontology and intentionality theory. Part II: The process model. Des. Stud. 2015, 38, 139–160. [Google Scholar] [CrossRef]
  33. Thomas, L.S.; Luis, G.V. Decision Making with the Analytic Network Process; Springer: Berlin, Germany, 2013. [Google Scholar]
  34. Huang, Y.; Bian, L. A Bayesian network and analytic hierarchy process based personalized recommendations for tourist attractions over the Internet. Expert Syst. Appl. 2009, 36, 933–943. [Google Scholar] [CrossRef]
  35. Yüksel, İ.; Dagˇdeviren, M. Using the analytic network process (ANP) in a SWOT analysis—A case study for a textile firm. Inform Sci. 2007, 177, 3364–3382. [Google Scholar] [CrossRef]
  36. Jeong, J.H.; Han, B. Coolant flow field in a real geometry of PWR downcomer and lower plenum. Ann. Nucl. Energy 2008, 35, 610–619. [Google Scholar] [CrossRef]
  37. Zhang, H.; Liu, H.; Fang, C. Optimization Design of Reactor Lower Plenum. Nucl. Power Eng. 2014, 59–63. [Google Scholar] [CrossRef]
  38. Yan, B.H.; Zhang, G.; Gu, H.Y. CFD analysis of the effect of rolling motion on the flow distribution at the core inlet. Ann. Nucl. Energy 2012, 41, 17–25. [Google Scholar] [CrossRef]
  39. Piancastelli, L.; Gatti, A.; Frizziero, L. CFD analysis of the Zimmerman’s V173 stol aircraft. Asian Res. Publ. Netw. (ARPN) J. Eng. Appl. Sci. 2015, 10, 8063–8070. [Google Scholar]
Figure 1. Hierarchical representation model of design problem.
Symmetry 11 00576 g001
Figure 2. Product hierarchy model.
Symmetry 11 00576 g002
Figure 3. Product design process based on solving the core problem.
Symmetry 11 00576 g003
Figure 4. CRT of bad parameters of the coolant flow distribution device.
Symmetry 11 00576 g004
Figure 5. Hierarchical structure model of coolant flow distribution device.
Symmetry 11 00576 g005
Figure 6. CRD diagram of core problem C p 2 .
Symmetry 11 00576 g006
Figure 7. Conceptual design scheme of coolant flow distribution device: (1) core support plate; (2) radial support key; (3) flow equalizing plate; (4) flow distribution cylinder; (5) supporting column; (6) energy-absorbing device; (7) pressure vessel bottom head; (I) inverted cone structure; (II) cap structure.
Symmetry 11 00576 g007
Figure 8. CRD diagram of core problem C p 1 .
Symmetry 11 00576 g008
Figure 9. CRD diagram of the core problem C p 3 .
Symmetry 11 00576 g009
Figure 10. CRD diagram of the root cause R c 1 1 .
Symmetry 11 00576 g010
Figure 11. Velocity vectors of cross section of lower chamber. The velocity of the coolant around the upper surface of the core support plate is slightly greater than that in the middle. Although the velocity is not exactly the same on the upper surface, the velocity of the coolant in the middle is basically the same. What is more, the change of velocity consistency from the middle to the periphery is very small. This proves the effectiveness of the flow distribution effect of the design scheme. The direction of coolant flow in the lower chamber is stable, the variation degree of the flow direction is slow, and there is only a few of vortices. Structurally, the structure of the lower chamber is simplified by reducing the number of supporting columns and detachable connectors. Therefore, the design scheme has the characteristics of good flow distribution effect, a few of vortices, and simple structures.
Symmetry 11 00576 g011
Table 1. The ratio scale [32].
Ratio ScaleMeaning (If: Element 1 Is A; Element 2 Is B; The Third Party Element Is C)
1A and B have the same effect on C
3The effect of A on C is slightly larger than the effect of B on C
5The effect of A on C is medially larger than the effect of B on C
7The effect of A on C is highly larger than the effect of B on C
9The effect of A on C is extremely larger than the effect of B on C
2,4,6,8Median value of the above adjacent scale
Reciprocal of the above scaleThe ratio of the effect of A on C to the effect of B on C is E A B C ;
The ratio of the effect of B on C to the effect of A on C is 1 / E A B C
Table 2. Judgment matrix ( A m i j ) of elements in cluster (m) based on element ( i j ).
i j m 1 m 2 m n Weight Vector w m ( i j )
m 1 e 11 e 12 e 1 n w m 1 ( i j )
m 2 e 21 e 22 e 2 n w m 2 ( i j )
m n e n 1 e n 2 e n n w m n ( i j )
Table 3. Judgment matrix between other clusters based on cluster ( B p 1 ).
B p 1 B p 1 B p 2 B p N Weight Vector
B p 1 e 11 e 12 e 1 n a 11
B p 2 e 21 e 22 e 2 n a 12
B p N e n 1 e n 2 e n n a 1 N
Table 4. Judgment matrix ( A 3 1 2 ) of elements in cluster ( B p 3 ) based on element ( 1 2 ).
1 2 . R c 1 3 R c 2 3 R c 3 3 R c 4 3 Weight Vector w 3 ( 1 2 )
R c 1 3 1631/20.33393
R c 2 3 1/611/21/60.06607
R c 3 3 1/3211/30.13214
R c 4 3 26310.46786
Table 5. Unweighted supermatrix ( W T ) of coolant flow distribution device.
C T R c 1 1 R c 2 1 R c 1 2 R c 2 2 R c 3 2 R c 1 3 R c 2 3 R c 3 3 R c 4 3
R c 1 1 0.250000.333330.166670.142860.125000.125000.500000.166670.14286
R c 2 1 0.750000.666670.833330.857140.875000.875000.500000.833330.85714
R c 1 2 1.000000.545450.594890.285710.632750.309151.000001.000000.28571
R c 2 2 0.000000.272730.276610.571430.192400.581260.000000.000000.57143
R c 3 2 0.000000.181820.128500.142860.174850.109590.000000.000000.14286
R c 1 3 0.000000.333930.333330.833330.333330.153850.125000.333330.54545
R c 2 3 0.000000.066070.000000.000000.000000.076920.250000.333330.18182
R c 3 3 0.000000.132140.000000.000000.000000.000000.000000.000000.00000
R c 4 3 1.000000.467860.666670.166670.666670.769230.625000.333330.27273
Table 6. Weighted matrix ( A ) of each cluster of coolant flow distribution device.
C T B p 1 B p 2 B p 3
B p 1 0.400000.264290.30915
B p 2 0.400000.645560.58126
B p 3 0.200000.090150.10959
Table 7. Weighted supermatrix ( W ¯ T ) of coolant flow distribution device.
C T R c 1 1 R c 1 1 R c 1 2 R c 2 2 R c 3 2 R c 1 3 R c 2 3 R c 3 3 R c 4 3
R c 1 1 0.100000.133330.044050.037760.033040.038640.154580.051530.04416
R c 2 1 0.300000.266670.220240.226530.231250.270510.154580.257630.26499
R c 1 2 0.400000.218180.384040.184450.408480.179700.581260.581260.16608
R c 2 2 0.000000.109090.178570.368890.124200.337870.000000.000000.33215
R c 3 2 0.000000.072730.082960.092220.112880.063700.000000.000000.08304
R c 1 3 0.000000.066790.030050.075130.030050.016860.013700.036530.05977
R c 2 3 0.000000.013210.000000.000000.000000.008430.027400.036530.01992
R c 3 3 0.000000.026430.000000.000000.000000.000000.000000.000000.00000
R c 4 3 0.200000.093570.060100.015030.060100.084300.068490.036530.02989
Table 8. Limit weighted supermatrix ( W ) of coolant flow distribution device.
C T R c 1 1 R c 2 1 R c 1 2 R c 2 2 R c 3 2 R c 1 3 R c 2 3 R c 3 3 R c 4 3
R c 1 1 0.067970.067970.067970.067970.067970.067970.067970.067970.06797
R c 2 1 0.244410.244410.244410.244410.244410.244410.244410.244410.24441
R c 1 2 0.284640.284640.284640.284640.284640.284640.284640.284640.28464
R c 2 2 0.198970.198970.198970.198970.198970.198970.198970.198970.19897
R c 3 2 0.077080.077080.077080.077080.077080.077080.077080.077080.07708
R c 1 3 0.047300.047300.047300.047300.047300.047300.047300.047300.04730
R c 2 3 0.005360.005360.005360.005360.005360.005360.005360.005360.00536
R c 3 3 0.006460.006460.006460.006460.006460.006460.006460.006460.00646
R c 4 3 0.067810.067810.067810.067810.067810.067810.067810.067810.06781

