Article

A New Methodology for Improving Service Quality Measurement: Delphi-FUCOM-SERVQUAL Model

1
Department of Mobile Machinery and Railway Transport, Faculty of Transport Engineering, Vilnius Gediminas Technical University, Plytinės g. 27, LT-10105 Vilnius, Lithuania
2
Faculty of Transport and Traffic Engineering, University of East Sarajevo, Vojvode Mišića 52, 74000 Doboj, Bosnia and Herzegovina
3
Faculty of Technical sciences, University of Novi Sad, Trg Dositeja Obradovića 6, 21000 Novi Sad, Serbia
*
Author to whom correspondence should be addressed.
Symmetry 2018, 10(12), 757; https://doi.org/10.3390/sym10120757
Submission received: 25 November 2018 / Revised: 10 December 2018 / Accepted: 12 December 2018 / Published: 16 December 2018

Abstract

:
The daily requirements and needs imposed on the executors of logistics services imply the need for a higher level of quality. In this, the proper execution of all sustainability processes and activities plays an important role. In this paper, a new methodology for improving the measurement of the quality of the service consisting of three phases has been developed. The first phase is the application of the Delphi method to determine the quality dimension ranking. After that, in the second phase, using the FUCOM (full consistency method), we determined the weight coefficients of the quality dimensions. The third phase represents determining the level of quality using the SERVQUAL (service quality) model, or the difference between the established gaps. The new methodology considers the assessment of the quality dimensions of a large number of participants (customers), on the one hand, and experts’ assessments on the other hand. The methodology was verified through the research carried out in an express post company. After processing and analyzing the collected data, the Cronbach alpha coefficient for each dimension of the SERVQUAL model for determining the reliability of the response was calculated. To determine the validity of the results and the developed methodology, an extensive statistical analysis (ANOVA, Duncan, Signum, and chi square tests) was carried out. The integration of certain methods and models into the new methodology has demonstrated greater objectivity and more precise results in determining the level of quality of sustainability processes and activities.

1. Introduction

According to Nowotarski [1], it can be said that quality is directly connected with meeting requirements, expectations, and needs of customers. By applying different tools and techniques, it is possible to manage a quality level in one way. Measuring the quality of all processes that make a coherent whole can greatly affect the full quality of service in all areas. Whether a service will be reused also depends on adequate quality, especially nowadays, when production processes are of approximate and high quality. In such conditions, proper and perfect execution of logistics services can have a crucial impact on its reuse. It is important to strive constantly for higher goals and their achievements. It requires also an adequate methodology that can help improve the quality measurement of logistics services.
The research domain is the logistics of express post, including all the activities and processes carried out within it, from the aspect of logistics service quality. The activities included into the domain of research are the activities of informing customers of express post services until the end that implies a logistics service provided. The survey was conducted on a sample of 70 respondents, permanent customers of services of the express post company, as well as customers who used services on a one-time basis. Introducing the types of express post services to customers leads to the creation of a certain degree of expectation, which may differ from the perception of the service provided. The subject of the research is to determine the quality of the logistics service of express post based on a new developed methodology. The motivation for execution of this research can be explained through two main reasons. The first reason represents a lack of universal methodology for service quality assessment that considers the nature of input parameters, needs, and requests of customers’ ability of companies and other uncertainties. The second reason is the possibility for improving the efficiency of a company that is the object of research by developing a new methodology, which can be useful for strategic management and planning. This paper has several goals. The first one relates to the development of a new methodology that treats input and output parameters with precision and provides results that are more objective. The first goal is achieved throughout three different phases, which, when integrated, create the developed model. The advantages of the Delphi method are used first, whereby a total of 70 customers provide weighted dimension values, based on which, a ranking is made. Thereafter, the FUCOM (full consistency method) for determining the weight dimension values is applied, allowing consistent evaluations by the experts involved in this process. The second goal is to enrich the methodology for improving service quality measurement by applying the new developed model. This provides an adequate methodology for future research in this area. In addition, the third goal of the paper is to determine the difference between expectations and perceptions of the formed dimensions of the modified SERVQUAL (service quality) model and the possibility of identifying and improving critical factors of the logistics service in an express post company, which is the object of research.
After introductory considerations where the significance of research and goals are presented, the paper is structured throughout six more sections. Section 2 provides a review of the application of the SERVQUAL model in various areas for measuring the quality of different processes. Section 3 presents the new developed methodology that implies the integration of three different methods to provide the most accurate outputs. There is a flow chart of the study with an explanation of all phases and steps. Section 4 is a case study where the input parameters are defined, quality measurements are presented, the initial dimension ranking is provided, and the weighted values of all five dimensions are calculated. Section 5 presents the results of the research using the developed methodology, while Section 5.3 provides a comprehensive statistical analysis that establishes the regularities and conditions of expectation and perception processes. Section 6 is a conclusion, with an emphasis on the scientific contribution of this research and guidelines for future research.

2. Literature Review

A model that is often used to measure the quality of service is the SERVQUAL model. Motivated by the need to measure the contribution of the SERVQUAL model, Wang et al. [2] conducted a study, which proved that the SERVQUAL model was one of the major research topics for academic researchers in the period from 1998 to 2013 and that the model contributed significantly to the research on service quality.

2.1. Quality Measurement in Logistics and Transport

According to Kersten and Koch [3], in the past decades, the scope of logistics services has broadened from the provision of isolated services, such as transport and warehousing, to the management and handling of the flow of goods for entire companies. In such conditions of the market, service quality has a large influence on company efficiency. One of the most applied models for service quality is the SERVQUAL model. This model was applied in the field of passenger traffic [4], where the stated hypotheses were disproven because of a negative gap, and the SERVQUAL model pointed to critical business functions and the possibility of their improvement. In [5], the SERVQUAL model was based on 10 logistics service attributes for estimating performances in the field of refrigerated transport. The proof of how much the SERVQUAL model is used in all areas was shown by Roslan et al. [6], where the model measured the quality of service of logistics centers in Iskandar, Malaysia. For the same purpose, in research [7], authors developed a new hybrid MCDM (multi-criteria decision-making) model, consisting of an analytic hierarchy process (AHP), decision-making trial, and evaluation laboratory (DEMATEL), and analytic network process (ANP) methods. A combined approach integrating gap analysis, quality function deployment (QFD), and AHP for improving logistics service quality was applied in [8]. In research [9], an extension of the three-column format SERVQUAL instrument was extended for evaluation of passenger rail service quality. Three new transport dimensions (comfort, connection, and convenience) were added to the original five SERVQUAL dimensions.
For the evaluation of service quality in logistics and other fields, the Kano model [10,11,12], QFD method [13,14], six sigma [15,16] etc. can be applied, or, for example, a new developed Agro-Logistic Analysis and Design Instrument (ALADIN) model, which involves logistics, sustainability, and food quality analysis [17].

2.2. Quality Measurement in Other Fields

In their paper, Cho et al. [18] explored ways to improve services in service centers of electronics companies. They introduced and modified the SERVQUAL model to understand customers’ demands for all service centers. According to Paryani et al. [19], the SERVQUAL model is also a very useful tool for identifying customers’ demands. The evidence of how much the SERVQUAL model is present in studies is also shown in [20], where the authors used the model to assess patients’ satisfaction by providing services at Sunyani Regional Hospital in Ghana; Behdioğlu et al. [21], who evaluated the quality of services at Yoncalı Physiotherapy and Rehabilitation Hospital in Kutahya, Turkey; Singh and Prasher [22], who measured the quality of services in hospitals from the Punjab state of India; as well as Khan et al. [23], who also measured the quality of services in hospitals. Using the SERVQUAL model, Chou et al. [24] have proved that the quality of service largely depends on the subjective assessment of service customers. To rank life insurance companies and assess the quality of services provided, Saeedpoor et al. [25] also used the SERVQUAL model. Additionally, the SERVQUAL model was used to measure the impact of technology on the quality of banking services and to measure the level of customer satisfaction [26]. Using the SERVQUAL model, Long [27] and Apornak [28] have shown that there is a significant link between technology used in providing services and the quality of services. The SERVQUAL model has also been used in a number of studies to rate the quality of banking services provided [29,30,31,32,33]. Wang et al. [34] also used five dimensions of the SERVQUAL model (tangibles, reliability, responsiveness, assurance, and empathy) to measure the service quality of an e-learning system. Moreover, those five dimensions were used by Yang and Zhu [35] to highlight the quality of community-based service provided by university-affiliated stadiums, as well as Luo et al. [36] while measuring satisfaction of outward-bound tourists.

2.3. Integrated MCDM-SERVQUAL Model for Quality Measurement

To measure the perception of service quality, Altuntas et al. [37] used the SERVQUAL model and two of the most known methods of MCDM method-based scales. By applying MCDM methods, it is possible to choose appropriate strategies, rationalize certain logistics and other processes, and make appropriate decisions that affect the operations of companies or their subsystems, as proved by the following research [38,39,40,41,42,43,44,45,46,47,48,49,50,51]. These methods can be easily integrated into other approaches, such as integration with SWOT (strengths, weaknesses, opportunities, and threats) analysis [42] or with the SERVQUAL model, as is the case in this paper. Rezaei et al. [52] integrated the SERVQUAL model with the best worst method, while Xuehua [53] applied a combined fuzzy AHP-SERVQUAL (analytic hierarchy process for service quality) model for evaluation of express service quality. The model was based on 14 indicators divided into five standard dimensions.

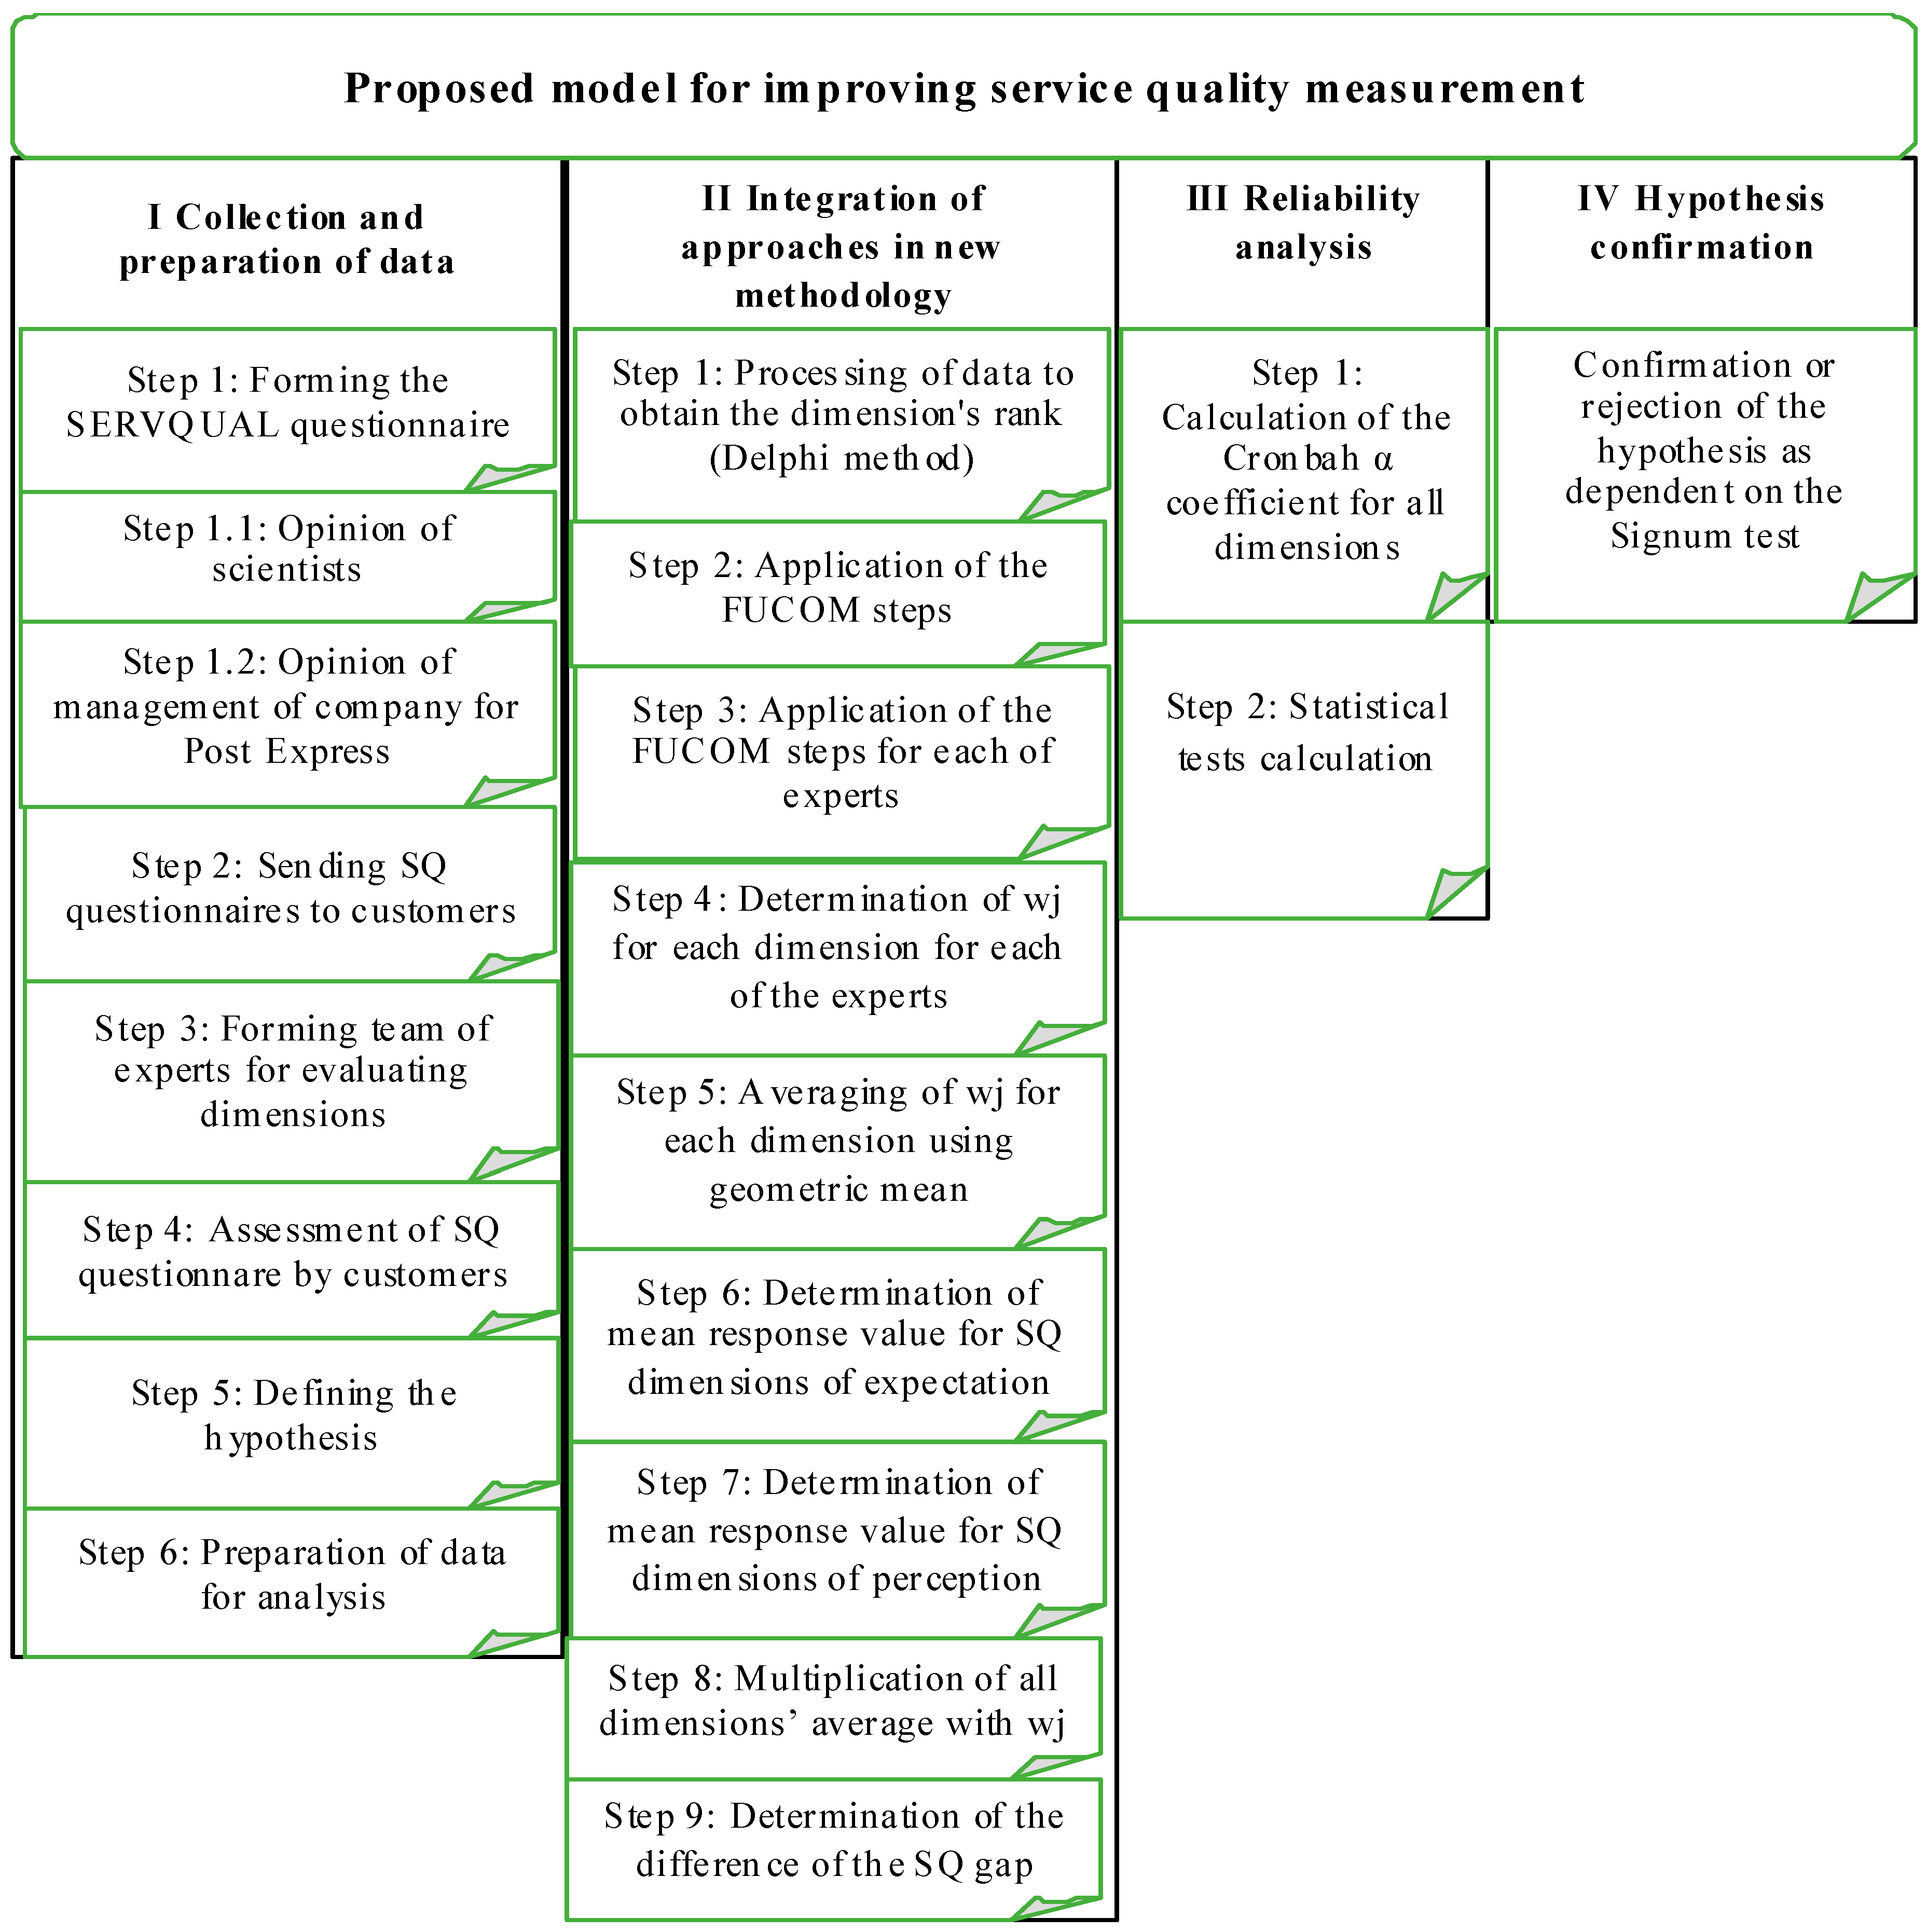
3. New Methodology: DELPHI-FUCOM-SERVQUAL Model

3.1. The Proposed Methodology

The developed methodology (Figure 1) for improving service quality measurement consists of four phases, with 18 steps in total. The first phase refers to the collection and preparation of data, which consists of six steps. First, it is necessary to form a SERVQUAL questionnaire on which the results of the research depend to a significant extent. It is necessary to consider the interdependence of certain elements of the questionnaire, which may influence the reliability of subsequent results. In this research, two important elements are taken into consideration when forming the questionnaire, the satisfaction of both the scientific and professional aspects.
Accordingly, scientists were consulted and the opinions of the management of the express post company were taken. A classic SQ (SERVQUAL) questionnaire consisting of 22 expectation questions and the same number of questions for perceptions was devised. The first contribution of this methodology is the modification of the SQ questionnaire for a specific case and the formation of a total of 25 elements for expectations and perceptions. It is recommended that this number is 20–30, depending on a specific situation. Subsequently, in the second step, the questionnaire was sent to customers to carry out their assessment in the fourth step, while the team of experts for evaluating the main dimensions of the SQ questionnaire was formed in the third step. Then, in the fifth step, hypotheses were defined, the number of which may vary depending on the area of application and a specific problem. It is possible to form hypotheses for each SQ dimension or for the overall SQ gap. In the last sixth step of the first phase, the data were processed and prepared for the next phase. The second phase implies the integration of different approaches into a new methodology consisting of nine steps. It is necessary to apply the Delphi method in the first step to allow customers to express their preferences regarding the main dimensions, i.e., their significance. After the results were obtained using the Delphi method, a ranking of all five dimensions was performed, so that a team of experts could determine their preferences. In the second step, the FUCOM for obtaining the weight values of SQ dimensions was applied. As it is group decision-making, all steps of this method should be implemented in the third step for each expert individually. In the fifth step, the averaging of the values obtained in the previous step to gain the final weight values of dimensions was performed. The sixth step determines the mean value of customers’ responses for all dimensions regarding expectations, while, in the seventh step, the same was performed for perceptions. In the eighth step, the mean values obtained in the previous two steps were multiplied by the weight values obtained by the FUCOM. In the final step of this phase, the difference between perceptions and expectations was determined by taking into consideration the previously obtained values. The third phase implies the determination of the model reliability, which is defined by two steps: The calculation of the Cronbach alpha coefficient for all SQ dimensions and the performance of statistical analysis. The choice of adequate statistical tests is conditioned by the allocations of customers’ responses, so it is impossible to define a universal one for application in this phase. Finally, the application of an adequate statistical test, and confirmation or rejection of previously set hypotheses was performed.
In this paper, a new Delphi-FUCOM-SERVQUAL methodology has been developed to improve the process of service quality measurement. The advantages of the new methodology developed are reflected in that it provides precise treatment of input and output parameters, obtaining results that are more objective. Firstly, the advantages of Delphi method were used, whereby a total of 70 customers provided weight values of dimensions and based on which their ranking was made. Thereafter, the FUCOM for determining the weight values of dimensions was applied, allowing consistent evaluations of the experts involved in this process to determine finally the difference between perceptions and expectations of the modified SERVQUAL model. Mentioned advantages make this method better than other similar approaches because of the way data is handled. The developed methodology can be applied without any restrictions in various research fields. In addition, it is possible to determine the quality and efficiency of the companies which are the objects of research based on the satisfaction of its customers, but it also enables further application and re-application of this methodology. This methodology can be very helpful for strategic management of the company to improve their efficiency. This methodology enusres more precise treatment of input parameters and achieves better results than traditional quality measurement methods.

3.2. Delphi Method

The Delphi method does the study of and gives projections of uncertain or possible future situations for which we are unable to perform objective statistical legalities, to form a model, or apply a formal method. These phenomena are very difficult to quantify because they are mainly qualitative in their nature, i.e., there are not enough statistical data regarding them that could be used as the basis for our studies. The Delphi method is one of the basic forecasting methods, the most famous and most widely used expert judgment method. Methods of experts’ assessments represent a significant improvement of the classical ways of obtaining the forecast by joint consultation of an expert group for a certain studied phenomenon. In other words, this is a methodologically organized use of experts’ knowledge to predict future states and phenomena. A typical group in one Delphi session ranges from a few to 30 experts. Each interviewed expert, a participant in the method, relies on knowledge, experience, and his/her own opinion. The goal of the Delphi method is to exploit the collective, group thinking of experts about a certain field. The goal is to reach a consensus on an event by group thinking. This is a method of indirect collective testing, but with a return link. It consists of eight steps:
Step 1: Selection of the prognostic task, defining basic questions and fields for it;
Step 2: Selection of experts;
Step 3: Preparation of questionnaires;
Step 4: Delivery of questionnaires to experts;
Step 5: Collecting responses and their evaluation;
Step 6: Analysis and interpretation of responses;
Step 7: Re-exams; and
Step 8: Interpretation of responses and setting up of the final forecast.

3.3. Full Consistency Method (FUCOM)

The FUCOM was developed by Pamučar, Stević, and Sremac, [54] for the determination of weights of criteria. It represents a new method that, according to the authors, represents a better method than AHP (analytical hierarchy process) and BWM (best worst method). For now, it has been applied in research by Nunić (2018). It consists of the three following steps.
Step 1. In the first step, the criteria from the predefined set of the evaluation criteria, C = { C 1 , C 2 , , C n } , are ranked. The ranking is performed according to the significance of the criteria, i.e., starting from the criterion that is expected to have the highest weight coefficient to the criterion of the least significance. Thus, the criteria ranked according to the expected values of the weight coefficients are obtained:
C j ( 1 ) > C j ( 2 ) > > C j ( k )
where k represents the rank of the observed criterion. If there is a judgment of the existence of two or more criteria with the same significance, the sign of equality is placed instead of “>” between these criteria in expression (1).
Step 2. In the second step, a comparison of the ranked criteria is carried out and the comparative priority ( φ k / ( k + 1 ) , k = 1 , 2 , , n , where k represents the rank of the criteria) of the evaluation criteria is determined. The comparative priority of the evaluation criteria ( φ k / ( k + 1 ) ) is an advantage of the criterion of C j ( k ) rank compared to the criterion of C j ( k + 1 ) rank. Thus, the vectors of the comparative priorities of the evaluation criteria are obtained, as in expression (2):
Φ = ( φ 1 / 2 , φ 2 / 3 , , φ k / ( k + 1 ) )
where φ k / ( k + 1 ) represents the significance (priority) of the criterion of C j ( k ) rank compared to the criterion of C j ( k ) rank.
Step 3. In the third step, the final values of the weight coefficients of the evaluation criteria ( w 1 , w 2 , , w n ) T are calculated. The final values of the weight coefficients should satisfy the two conditions:
(1)
That the ratio of the weight coefficients is equal to the comparative priority among the observed criteria ( φ k / ( k + 1 ) ) defined in Step 2, i.e., that the following condition is met:
w k w k + 1 = φ k / ( k + 1 )
(2)
In addition to condition (3), the final values of the weight coefficients should satisfy the condition of mathematical transitivity:
w k w k + 2 = φ k / ( k + 1 ) φ ( k + 1 ) / ( k + 2 )
Full consistency, i.e., minimum DFC (deviation from full consistency) ( χ ) is satisfied only if transitivity is fully respected. Based on the defined settings, the final model for determining the final values of the weight coefficients of the evaluation criteria can be defined:
min χ s . t . | w j ( k ) w j ( k + 1 ) φ k / ( k + 1 ) | χ ,   j | w j ( k ) w j ( k + 2 ) φ k / ( k + 1 ) φ ( k + 1 ) / ( k + 2 ) | χ ,   j j = 1 n w j = 1 ,   j w j 0 ,   j
By solving the model (5), the final values of the evaluation criteria ( w 1 , w 2 , , w n ) T and the degree of DFC ( χ ) are generated.

3.4. SERVQUAL Model

The model was developed in 1985 [55] and purified and improved in 1988 [56] and 1994 [57]. In current practice, it has become one of the most distinguished models in the area of service quality. It is expressed by the “perception minus expectation” algorithm.
The SERVQUAL model includes five basic quality dimensions: Tangibles, reliability, responsiveness, assurance, and empathy. Each of these dimensions is described by its attributes. The SERVQUAL model quality function is expressed by Equation (6):
S Q i   = Σ W j   ( P i j   E i j )
where: SQi—perceived dimension quality; Wjattribute importance factor; Pijperception of dimension i in relation to attribute j; Eijexpected level of attribute; and j, which is a normative of dimension i.
Five SERVQUAL dimensions (reliability, responsiveness, assurance, empathy, and tangibles) concisely represent an essential criterion used by customers when assessing the quality of services. The value of the dimensions in a classic SERVQUAL model is determined based on a questionnaire that contains 44 quality characteristics, 22 of which refer to expectations (E) and 22 to perceptions (P).
In this paper, as already mentioned, a modification of the SERVQUAL model has been carried out, which contains a total of 50 quality characteristics arranged equally for expectations and perceptions.

4. Case Study: Measuring the Quality of Logistics Service in a Company of Express Post

In this paper, the quality of logistics service was determined by applying the developed Delphi-FUCOM-SERVQUAL model. The aim of the research from the aspect of the company for which it was conducted was to determine the current level of logistics service quality and to improve it. For the survey of customers, a “Google forms” online application was used. The questionnaire consisted of 25 questions, including five dimensions: Reliability, assurance, tangibles, empathy, and responsiveness. Prior to filling in the questionnaire, respondents provided information, such as: Customer’s status, gender, age, and employment status. The survey was conducted using the questionnaire in which a Likert scale was applied, including points from one to five. At the end of the questionnaire, the customer determined the values of weight coefficients depending on which dimension was most important to them. For every individual, each dimension that determines the quality level of service was different importance.
Regarding the status of respondents, 42 out of 70 customers were natural persons, while the remaining 28 were legal entities, i.e., 60% of respondents were natural persons, and 40% of respondents were legal entities. Division by gender shows that customers of both genders were approximately of the same percentage. Then, the highest number of respondents were aged 35–50, i.e., 25 respondents of 70. The percentage of 30% was taken by those aged 24–35, namely 21 respondents. Out of 70 respondents, the highest percentage of 68% belongs to the employed customers of the company’s express post services. The target group are young entrepreneurial people with a frequent need for express post services. Table 1 shows the questions included into the questionnaire from the aspect of customer expectations.
Table 1 presents all the questions that were used to test the degree of customer satisfaction. The questions are related to customer expectations about the services provided by the express post company. The questions are divided into five basic dimensions, i.e., the questions from one to six relate to the dimension of reliability, from seven to 10 to the dimension of assurance. The questions from 11 to 16 relate to the dimension of tangibles, from 17 to 21, to the dimension of empathy, and from 22 to 25 to the dimension of responsiveness. In this part of the questionnaire, questions are written in the future tense as they relate to customer expectations for the quality of logistics service. The form of questions for both aspects, expectations and perceptions, is the same, but questions in terms of perceptions are set in the past tense. Perception questions define the real customer perception of the quality of the service provided.
Based on all the above, a hypothesis of the research was set: There is no significant difference between expectations and perceptions of the SERVQUAL model in providing logistics services. In addition to the main hypothesis in the paper, some regularity of certain questions and attitudes of the customers has been established.
The dimension of reliability is mainly related to the timely delivery of a service that directly affects the quality of express post-delivery. The questions from the order number seven to 10 relate to the dimension of assurance. Within this dimension, it can be seen the degree of quality that refers to the trust and confidence of customers regarding the services of the express post company. The dimension of tangibles includes the questions that relate exclusively to couriers, delivery vehicles of the company, and the cost of the service. The results of the tangible dimension significantly provide information about the company where the research was conducted. This dimension also carries useful information on the real degree of quality of logistics service. Particular attention should be paid to each customer. Throughout the dimension of empathy, we can see how much the company really focuses on customers, their needs, and their problems. By understanding customers and anticipating their needs, the company can strive for an extremely high quality of service. Within the dimension of responsiveness, there are questions solely related to both daily and extraordinary situations. These are questions related to all necessary information and customers’ requests, which can be obtained by employees in the company.

4.1. Determining Dimension Ranks by Supplying the Delphi Method

At the end of the questionnaire, the percentage of the dimensions most important for each customer were determined. The total sum of the assessed dimensions should be 100%. While assessing, customers considered which dimension was personally the most important factor affecting the quality of the logistics service. Table 2 shows the rank of SQ dimensions, used as a basis to create prerequisites for applying the FUCOM.
Table 2 shows the ranks obtained by the customers’ responses. The method used to obtain these ranks is as follows: At the end of the questionnaire, all respondents determined the percentage for each dimension. After that, the sum of all values for one dimension was divided by 7000. The coefficient values for each dimension were obtained in the same way. Table 3 shows the percentages of dimensions for each dimension stated.
From Table 3, we can see that the sum of all percentage values is 7000. The procedure to obtain the weight coefficients is as follows: The sum of the percentage values of one dimension was divided by the sum of percentage values for all dimensions. The following example shows how to calculate the value of the weight coefficient for the dimension of assurance (wjweight coefficient).
The weight coefficient value for the dimension of assurance is 0.2629:
w j = s u m   o f   p e r c e n t a g e   v a l u e s   f o r   t h e   d i m e n s i o n   o f   a s s u r a n c e s u m   o f   p e r c e n t a g e   v a l u e s   f o r   a l l   d i m e n s i o n s w j = 1840 7000 = 0.2629

4.2. Determining the Weight Values of Dimensions Applying the FUCOM

Step 1. In the first step, decision-makers need to rank criteria (dimensions). Compared to the original FUCOM, where the experts themselves perform the ranking, in this paper, the same was performed using the Delphi method based on the responses of 70 customers of logistics service. The dimensions ranking is as follows: D1 > D2 > D5 > D3 > D4.
Step 2. In the second step (Step 2b), the decision-maker performed the pairwise comparison of the ranked dimensions from Step 1. The comparison was made with respect to the first-ranked D1 dimension. In this step, it a team of five experts was formed who assessed previously ranked dimensions. The experts carried out the assessment based on the scale [ 1 , 9 ] . Thus, the priorities of the dimensions ( ϖ C j ( k ) ) by the first decision-maker for all the criteria ranked in Step 1 were obtained (Table 4). Based on the obtained priorities of the dimensions, the comparative priorities of the dimensions were calculated: φ C 1 / C 2 = 1.2 / 1 = 1.200 , φ C 2 / C 5 = 1.5 / 1.2 = 1.250 , φ C 5 / C 3 = 2.7 / 1.5 = 1.800 , and φ C 3 / C 4 = 3.2 / 2.7 = 1.185 .
Step 3. The final values of the weight coefficients should meet the following two conditions:
(1)
The final values of the weight coefficients should meet condition (3), i.e., that w 1 w 2 = 1.2 , w 2 w 5 = 1.250 , w 5 w 3 = 1.800 and w 3 w 4 = 1.185 .
(2)
In addition to condition (3), the final values of the weight coefficients should meet the condition of mathematical transitivity, i.e., that w 1 w 5 = 1.2 × 1.25 = 1.500 , w 2 w 3 = 1.25 × 1.8 = 2.250 , and w 5 w 4 = 1.8 × 1.185 = 2.133 . By applying expression (5), the final model for determining the weight coefficients can be defined as:
min χ s . t . { | w 1 w 2 1.200 | χ ,   | w 2 w 5 1.250 | χ ,   | w 5 w 3 1.800 | χ ,   | w 3 w 4 1.185 | χ , | w 1 w 5 1.500 | χ ,   | w 2 w 3 2.250 | χ ,   | w 5 w 4 2.133 | χ , j = 1 5 w j = 1 ,   w j 0 , j
By solving this model, the final values of the weight coefficients ( 0.315 , 0.263 , 0.210 , 0.113 , 0.099 ) T and DFC of the results χ = 0.000 were obtained. Weight coefficient values are shown in the ranked order of dimensions from the first step. The individual values of weight coefficients for all dimensions were obtained in the same way. Table 5 shows dimension ratings according to all criteria and values of weight coefficients using the previously demonstrated steps. The final values of weight coefficients of the dimension of reliability (D1 = 0.291), assurance (D2 = 0.259), tangibles (D3 = 0.130), empathy (D4 = 0.109), and responsiveness (D5 = 0.207) were calculated using the geometric mean.

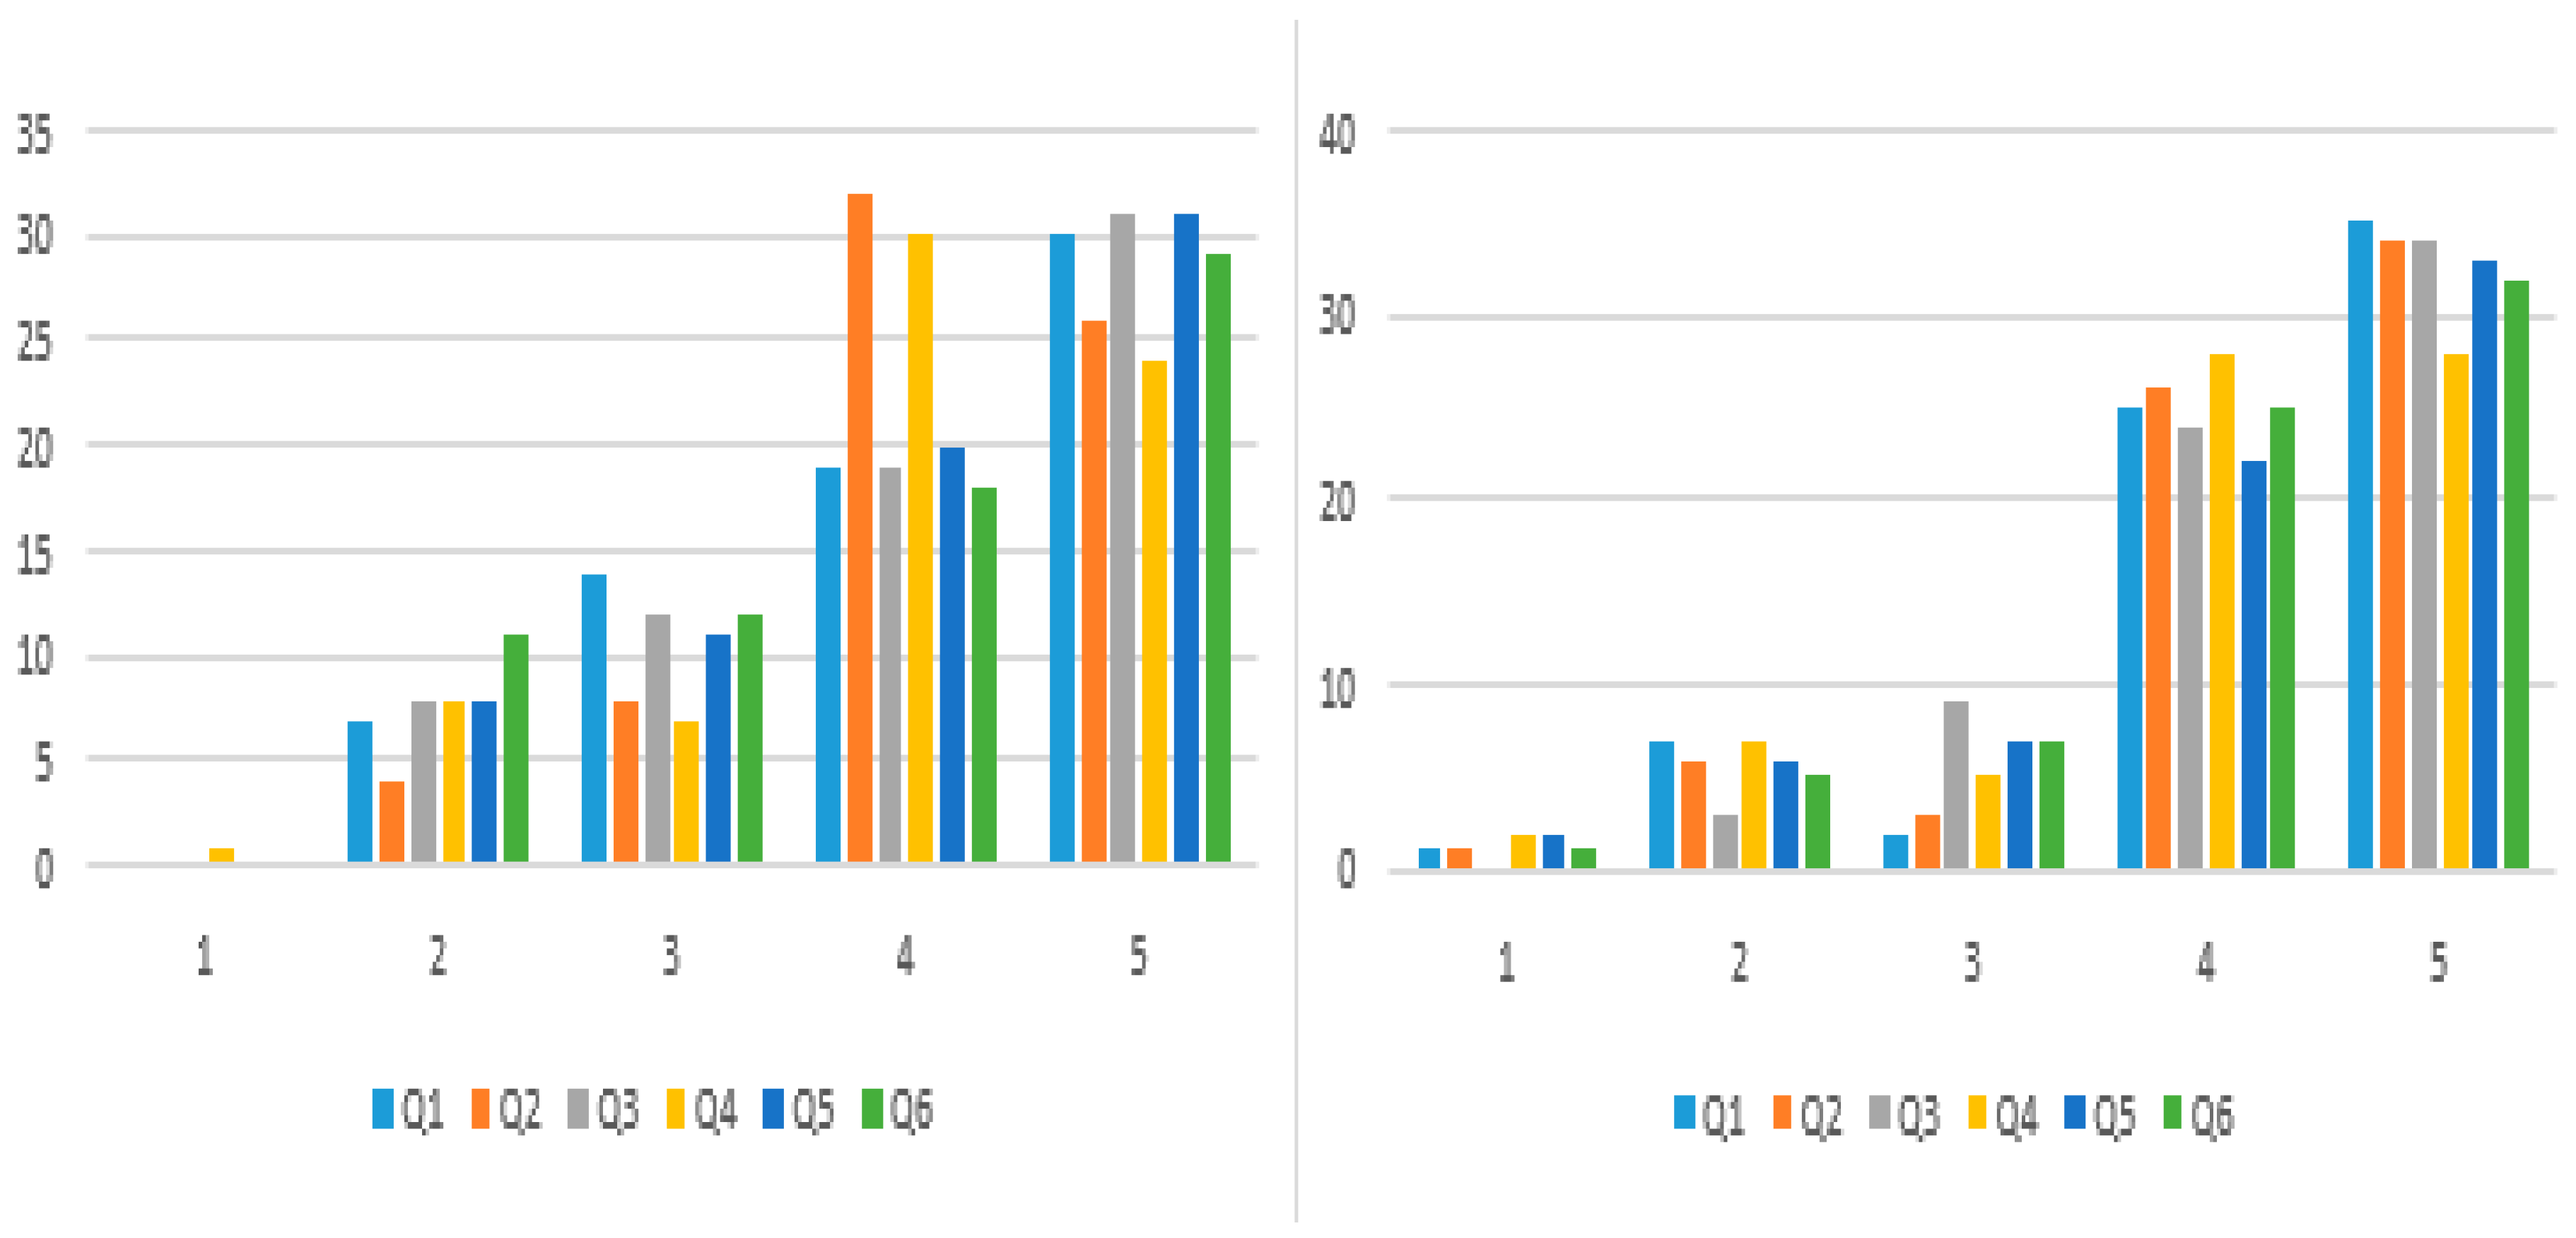
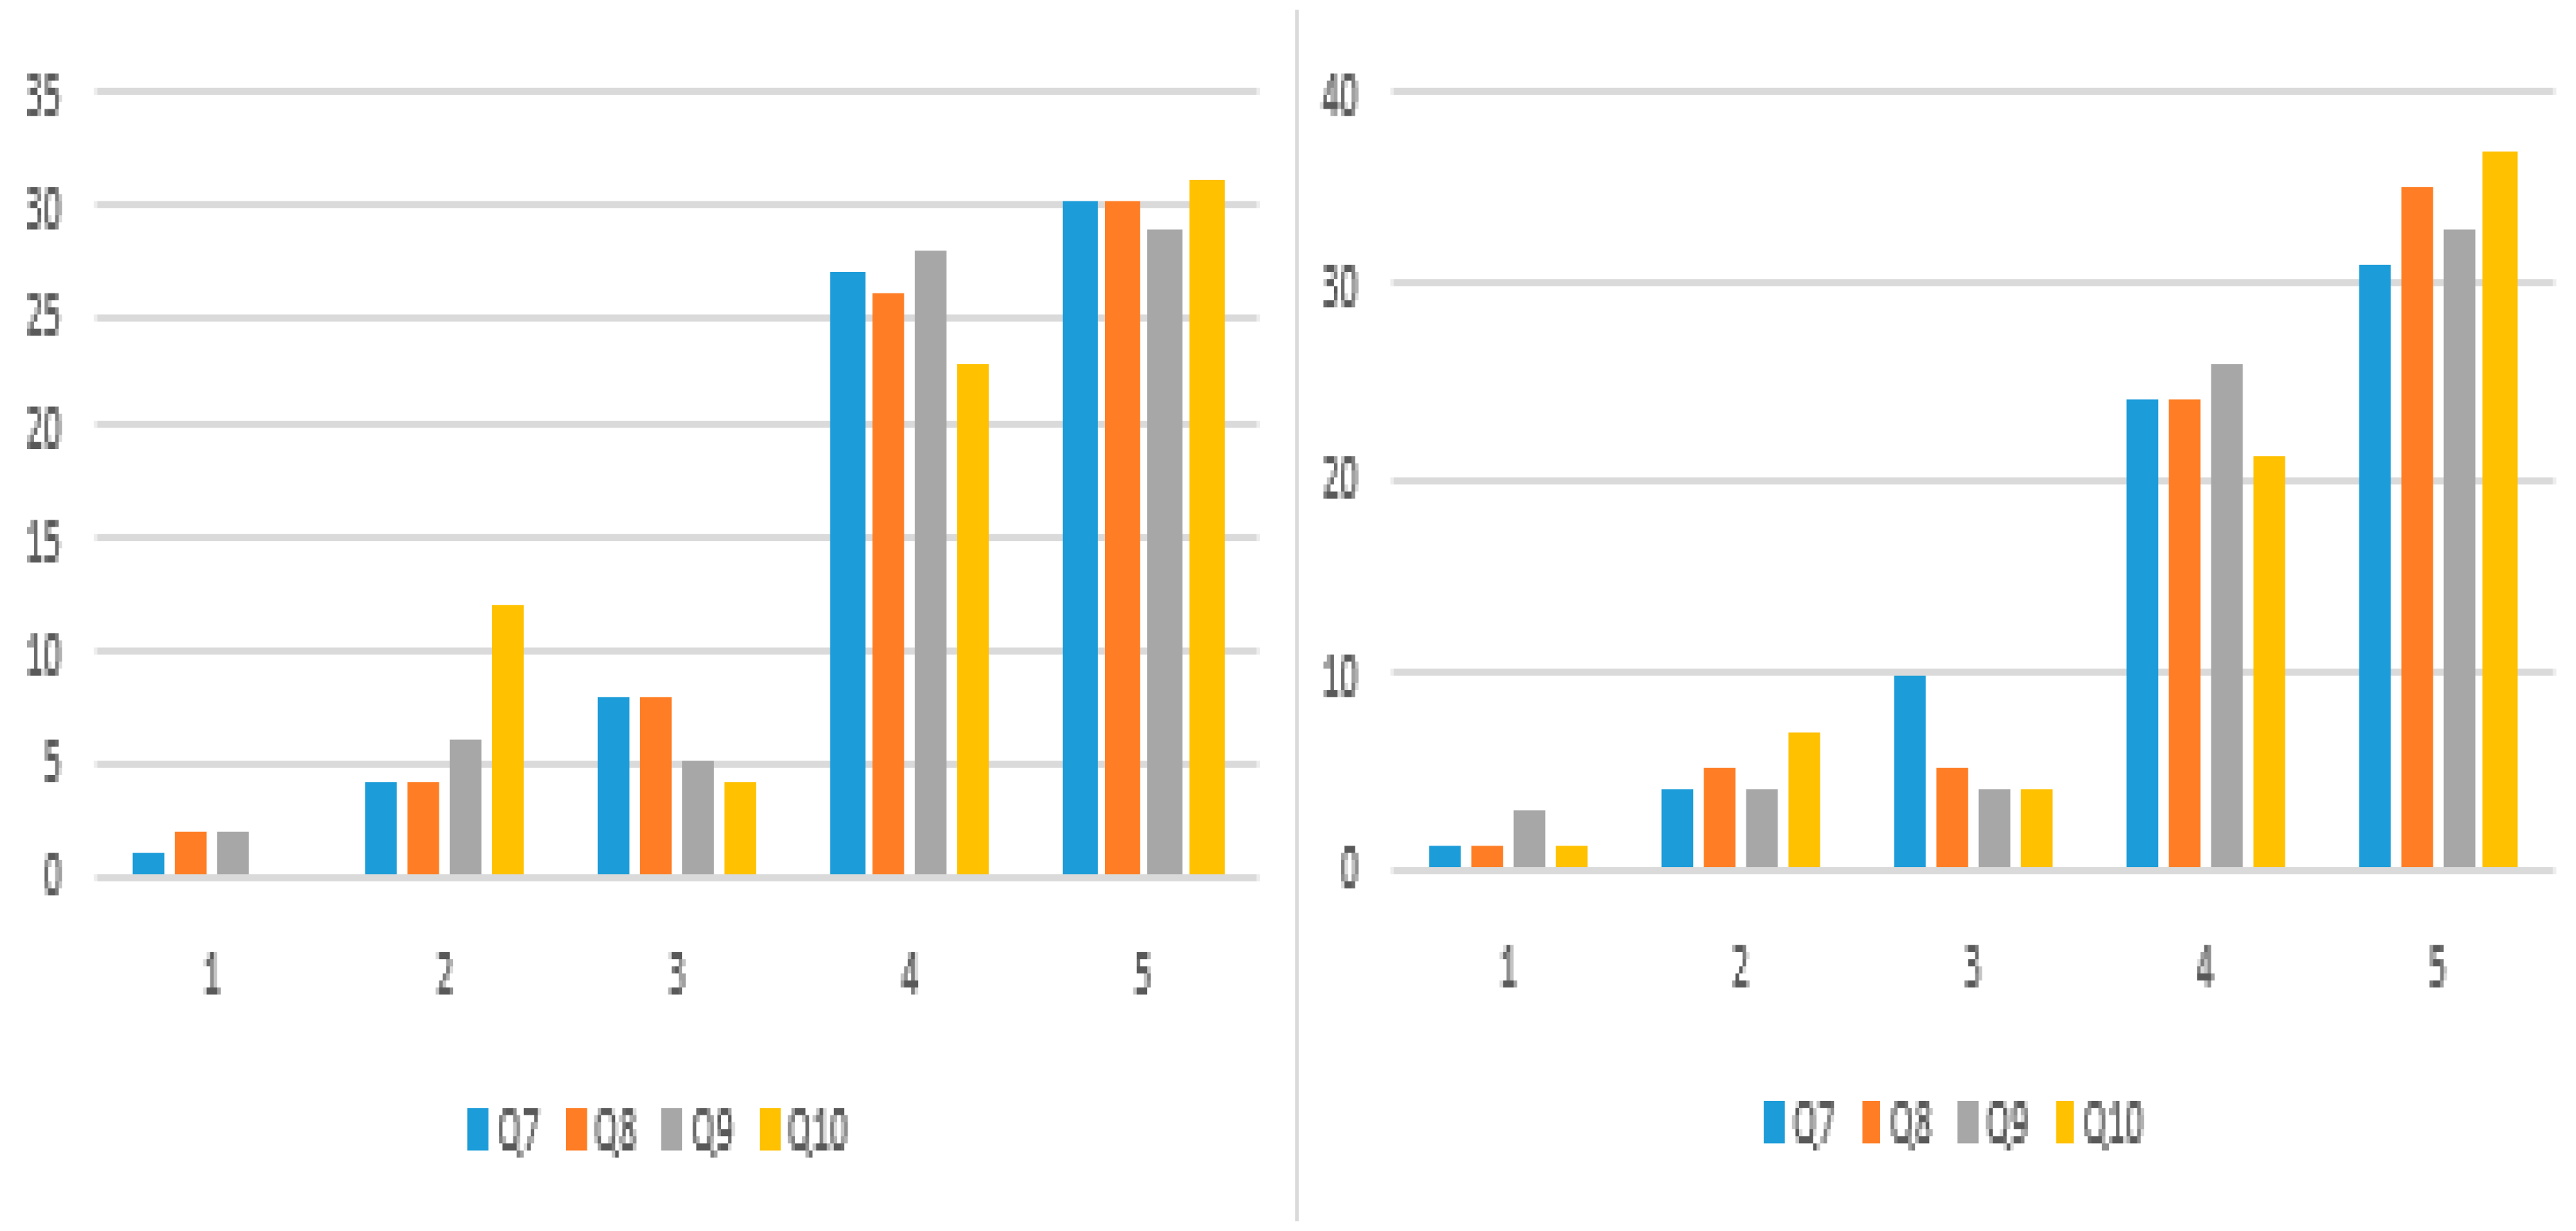
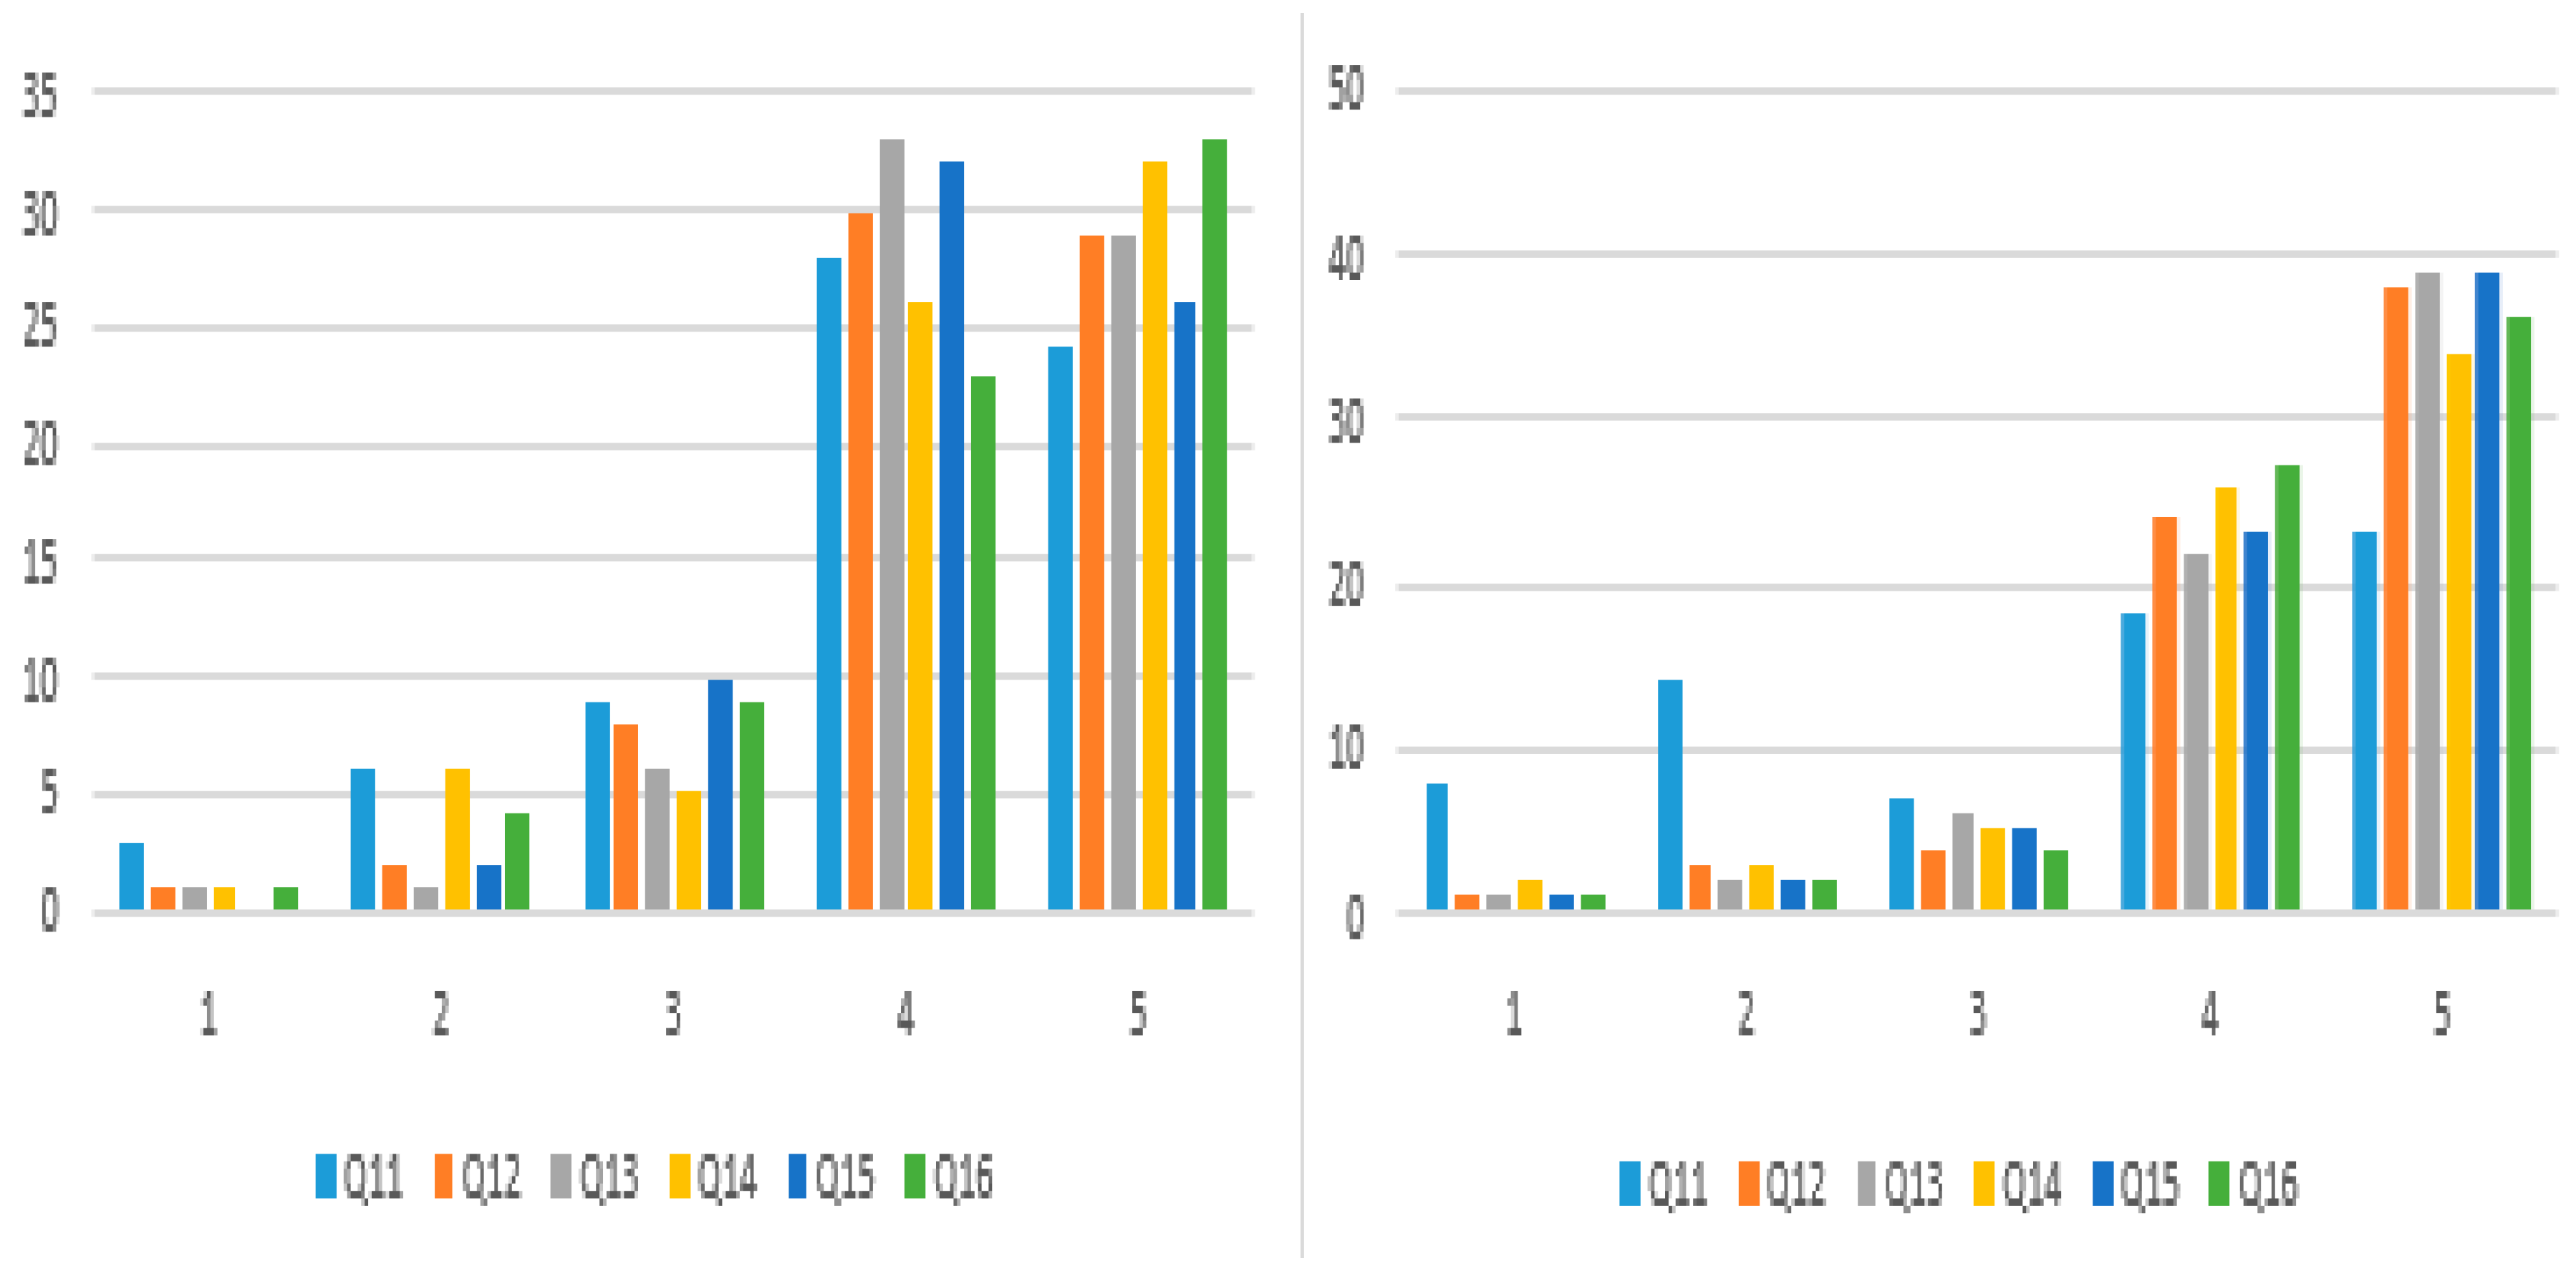
4.3. The Frequency of Responses

The frequency of the occurrence of a response is called the frequency of responses. As mentioned earlier, when filling out a questionnaire, customers used a Likert scale, or more precisely for each question, they assigned a point from one to five: 1—completely disagree; 2—partially disagree; 3—have no opinion; 4—partially agree; 5—completely agree. According to the frequency of responses, customers had extremely high expectations because they only responded 14 times with a rating of 1 and 769 times with the highest rating. Compared to the frequency of responses in terms of expectations, a significant difference can be noticed for rating 1, but also a difference for the highest rating. Based on the response frequency, it can be assumed that there will be significant differences between customer expectations and perceptions of the service provided. There were 33 responses with a rating of 1, which further implies that a certain number of customers are dissatisfied with the service provided. In addition, while perceiving the service provided, customers mostly gave a rating of 5, and then a rating of 4.
Figure 2 shows a graph of customers’ responses in terms of expectations and perceptions. Regarding expectations, only one customer assigned the lowest rating to Q4, while we had more responses with the lowest rating referring to perceptions. Q3 did not record any of the lowest ratings regarding either expectations or perceptions. From the aspect of perceptions, Q1 recorded the highest number of answers with the highest rating, namely 35, compared to the expectations where 30 customers responded with a rating of 5. For Q2, customers expressed great satisfaction, where in terms of expectations, 26 customers responded with a rating of 5, while 34 customers responded with the same rating for the same question regarding perceptions. The lowest rating for Q5 was given by two customers, while no response with a rating of 1 was given for expectations. The number of customers for the same question with the highest rating from the aspect of perception was 33, while 31 customers marked 5 regarding expectations for the question. Customers also expressed satisfaction with Q6 with a rating of 4, i.e., regarding expectations, 18 customers marked 4, while in response to perceptions, 25 customers responded by that rating. Generally, it can be noticed that the quality of the service provided is very high for this dimension.
After the dimension of reliability, high satisfaction was expressed for the dimension of assurance (Figure 3). No significant difference in customers’ responses regarding expectations and perceptions was noticed for Q7. For each question of that dimension, the response with the lowest rating was recorded. Q8 recorded 35 responses with a rating of 5 when perceived by customers, while the same rating was assigned to expectations by 30 customers. Three customers responded by rating 1 for Q9 regarding perception. For the same question, there is a difference in rating 5, where the highest rating was given by 33 customers regarding the perception, and when the expectation was recorded, the rating was recorded by 29 customers. Q10, the last question in the dimension of assurance, had the highest number of responses, with a rating of 5. Namely, customer satisfaction can be seen by the number of customers’ responses, with a rating of 2 and 5. Regarding expectations, 12 customers responded with a rating of 2, while five customers less responded with the same rating for perceptions. The highest mark, rating 5, was selected by 31 customers for expectations while regarding perceptions, 37 customers responded to Q10 with a rating of 5.
The results of the dimension of tangibles (Figure 4) are specific because of customers’ responses to Q11. Generally, the Q11 results did not significantly affect the overall customer satisfaction. Concerning expectations, three customers selected a rating of 1, while 8 customers responded with the same rating for perceptions. Additionally, a rating of 2 was given by six customers, while 14 customers responded with a rating of 2 for perceptions. The customer dissatisfaction for Q11 can be noticed by the number of customers’ responses with a rating of 4 where, in reference to expectations, 28 customers responded with that rating, while after the service provided, 18 customers responded with a rating of 4. The total satisfaction of the customers for assessing the tangibles was influenced by the results of Q12. For question Q12, after the service was provided, 38 customers responded with a rating of 5, while for the same question, when responding to expectations, 29 customers answered with a rating of 5. For question Q13, it is also possible to notice the difference in customers’ responses for the highest rating. With regard to expectations, 29 customers selected a rating of 5, while the same rating after the perception of the service was selected by 39 customers. Rating 4 for Q14 was chosen by the same number of customers, namely 26. After the service was provided, 34 customers answered with a rating of 5 for that question, while 32 customers responded with the highest rating regarding perceptions. The great satisfaction of customers concerning the dimension of tangibles was expressed for Q15. Before the service was provided, a rating of 5 was selected by 26 customers, and after the service was perceived, 39 customers answered with the highest rating. For Q16, there was also a significant difference expressed by rating 4 and 5. For that question, before the service was provided, 23 customers answered with a rating of 4, and 27 customers after its realization. Rating 5 was given by three customers more after the service was provided.
From Figure 5, it can be seen that there is very little positive difference in terms of customer perception. For customer expectations, one response with a rating of 1 was noted for Q21. Customers expressed satisfaction for Q17, where 35 customers responded with a rating of 5 after the service was provided, and 30 customers responded with the same rating before its realization. Concerning Q18, a large number of customers (34) responded with a rating of 5, while 39 customers answered with the same rating after the service was provided. Question Q19 was the only question that customers did not answer with a rating of 1 after the service was perceived. In addition, customers had high expectations for Q19, i.e., 33 customers answered with a rating of 5, while 38 customers answered with the same rating after the service was provided. In reference to Q20, 32 customers responded with a rating of 4 in terms of perceptions, while 25 responses were recorded with the same rating regarding expectations. For the same question, the diagram shows a much larger number of responses with a rating of 3 from the aspect of customer expectations, where 11 customers responded with that rating, and after the realization, only four customers responded with a rating of 3. Concerning question Q21, customers had very high expectations, with 44 customers responding with a rating of 5. A slight decrease in satisfaction could be noticed after the service was provided, where 44 respondents answered Q21 with a rating of 5.
In Figure 6, in terms of customer expectations, it can be noticed that there were no responses with a rating of 1. Final survey results indicated that there was no difference between the customer expectations and perceptions of the quality of the service provided. Concerning Q22, 41 customers responded with a rating of 5 for perceptions, while regarding expectations, 33 customers answered with a rating of 5 for the same question. For Q23, customers did not generally express satisfaction, where 37 customers responded with a rating of 5 regarding expectations, and 34 customers responded with the highest rating after the service was provided. The number of customers’ responses to Q23 with a rating of 4 was the same, i.e., 24 responses for both aspects of the SERVQUAL model. Question Q24 showed a small positive difference in customer satisfaction, i.e., 35 respondents answered with a rating of 5 prior to the service being provided, and after its realization, 38 customers responded with the highest rating. In the diagram, the biggest positive difference can be identified for question Q25. The number of customers who answered with a rating of 5 for that question regarding expectations was 28, and after the service was provided, 38 customers responded with a rating of 5. The positive difference regarding the last question, Q25, had a significant impact on the ultimate result of the dimension of responsiveness.

5. Research Results

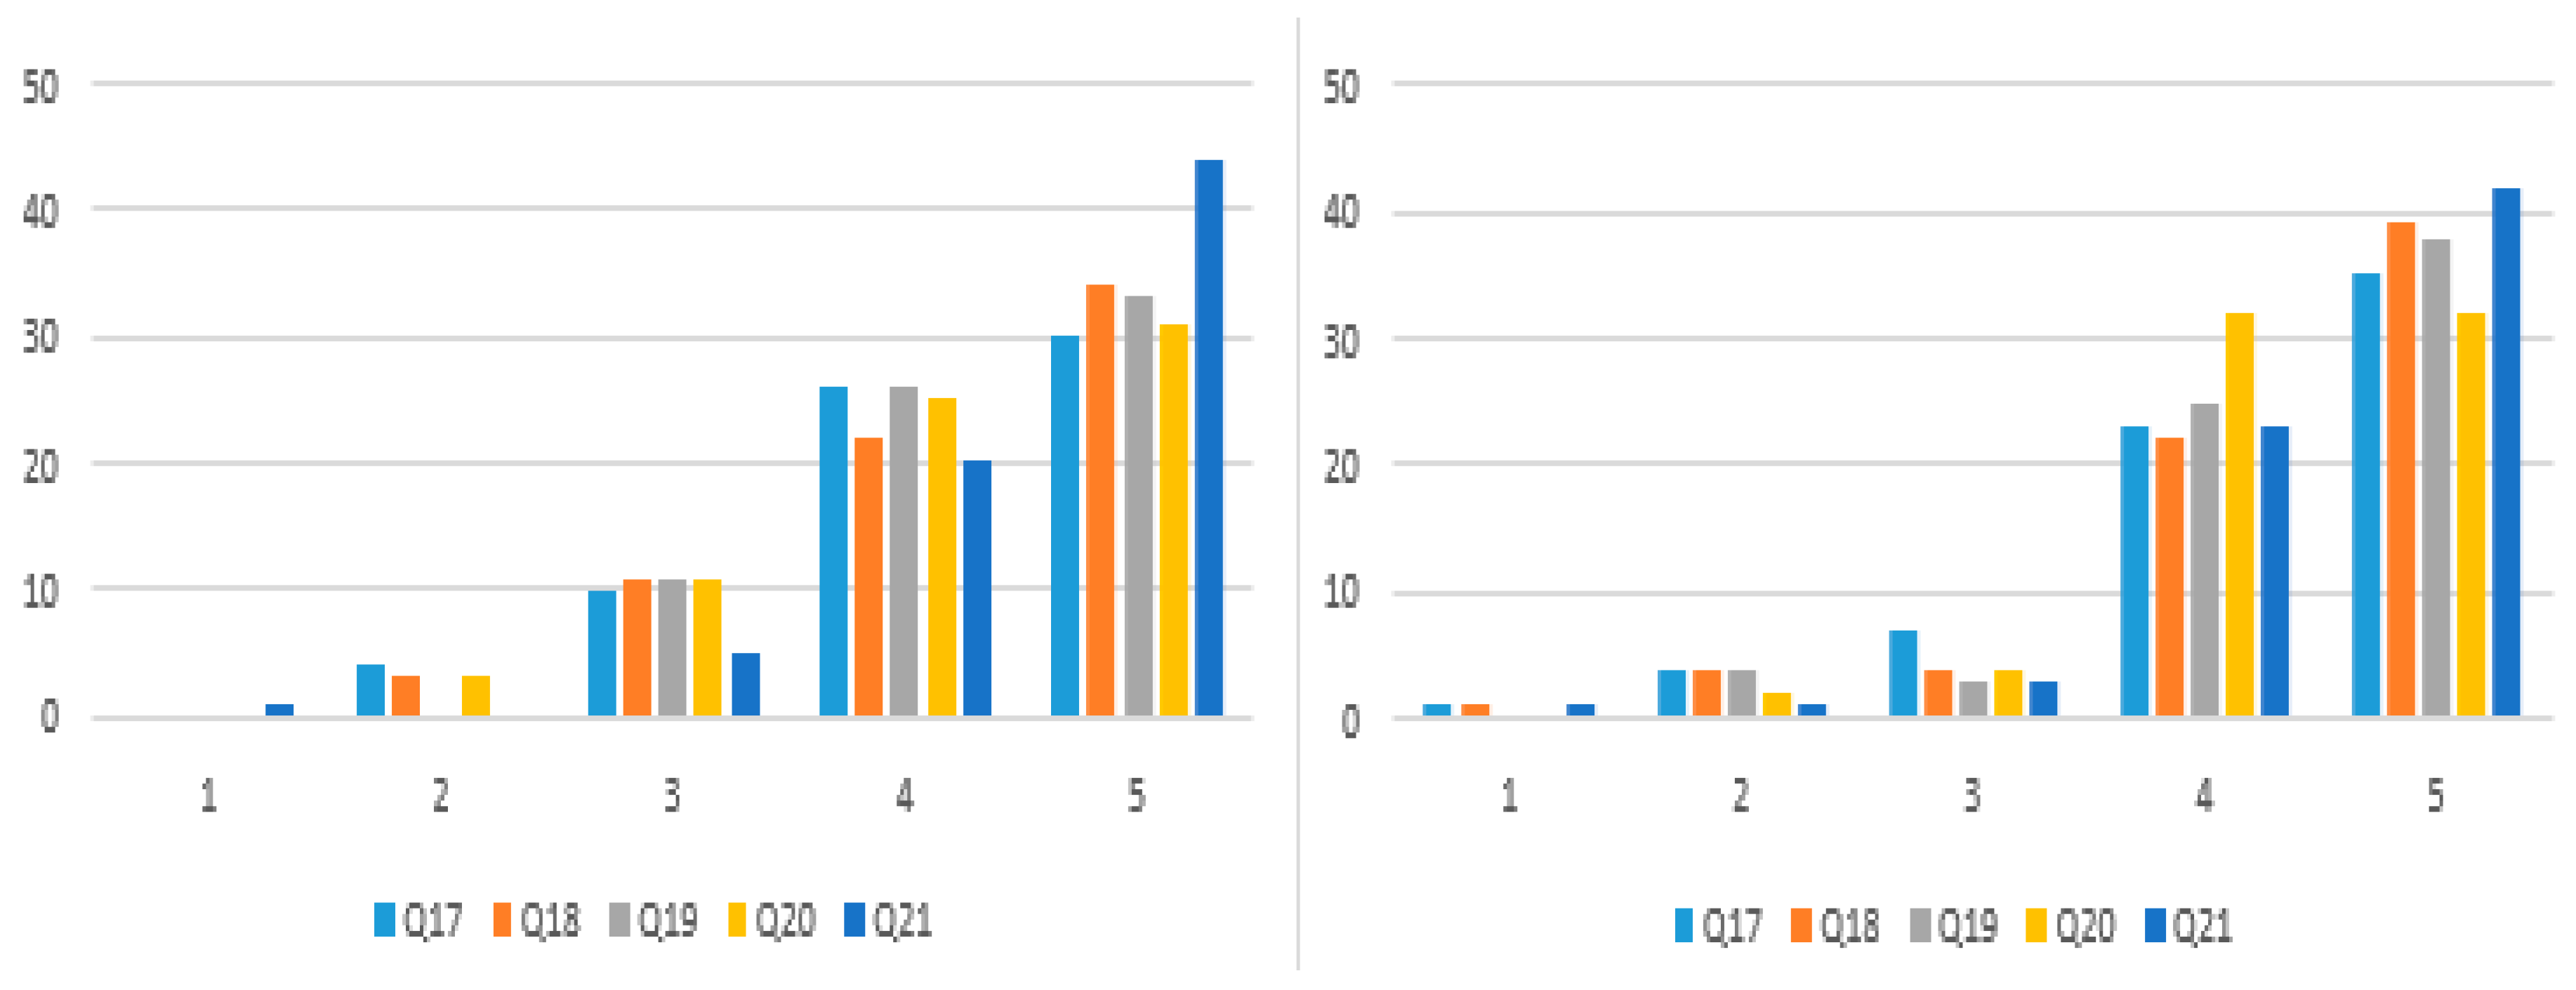
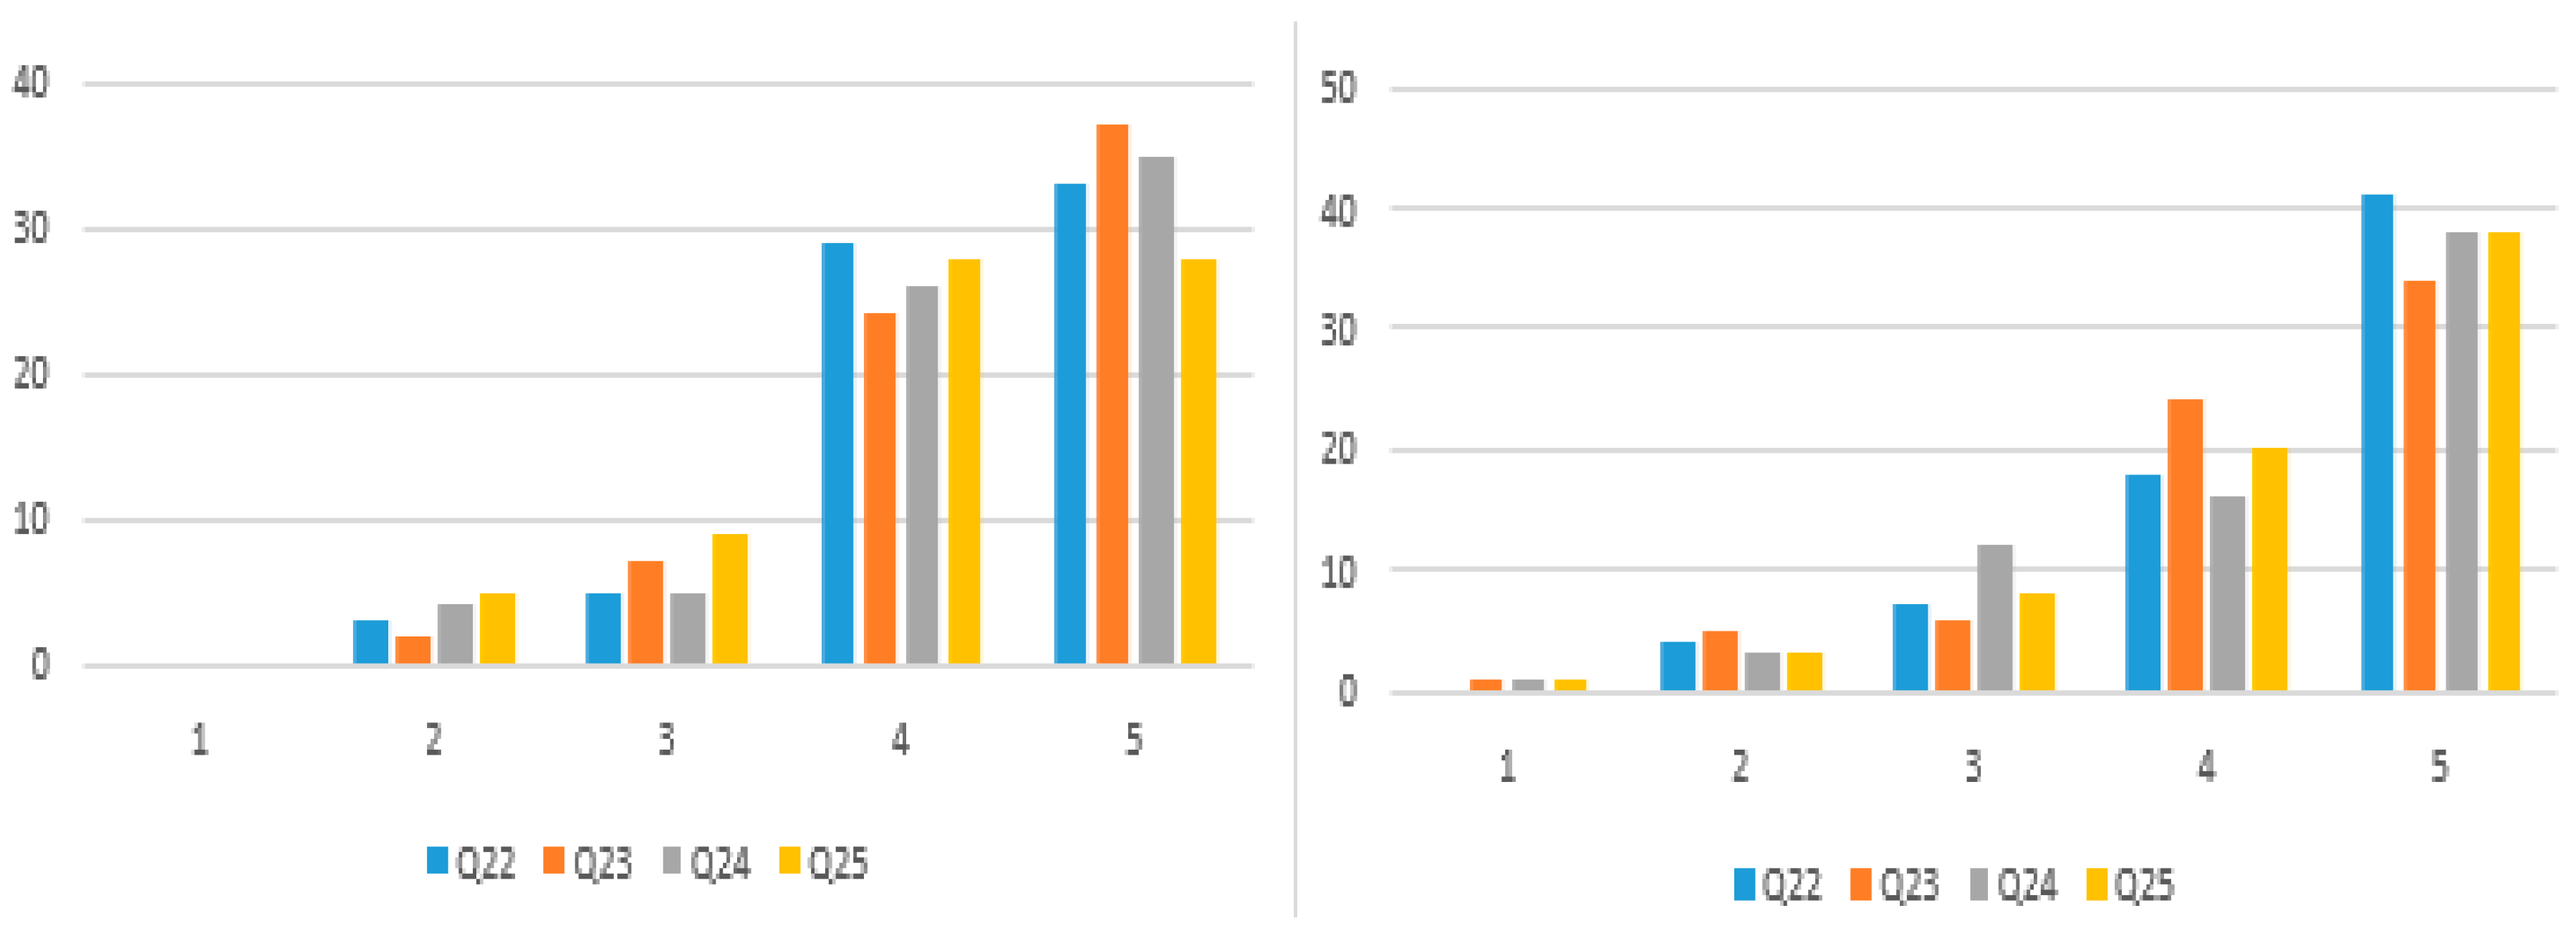
5.1. The Results of Dimensions in Terms of Customer Expectations

Table 6 shows the results of dimensions with expectations. Dimensions are presented in terms of expectations and their average value, standard deviation, weight coefficients, and the value of the Cronbach alpha coefficient.
The Cronbach alpha test is considered positive only if coefficients above 0.7 are obtained. Certain sources state that a reliable value of the Cronbach alpha test is 0.5. From the table of percentage values, it can be seen that customers have the highest expectations regarding the reliability dimension, and the least expectations regarding the dimension of empathy. The average value for the dimension of responsiveness was 4.282, which is the highest average value. For the dimension of reliability, there is the smallest average value and it was 4.029. The standard deviation for all dimensions was 0.923 and the average value of the Cronbach alpha test for all dimensions was 0.876. The weight coefficient values for both expectations and perceptions were the same.

5.2. Results of Dimensions in Terms of Customer Perceptions

Table 7 shows the results of dimensions regarding customer perceptions.
From the previous two tables, it can be seen that the value of the Cronbach alpha test was far above 0.7, which means that the dimensions are reliable. The highest quality perceptions were for the dimension of empathy, 4.360, and then for the dimension of responsiveness, 4.282. The lowest perceptions were related to the reliability dimension and were 4.176. It can be seen that the values for the dimension of responsiveness were the same for both expectations and perceptions, which means that there were no significant changes in relation to the quality of the service provided. In addition, it can be seen that the values for the dimension of responsiveness were the least from both aspects.
Table 8 shows the results obtained by using the developed Delphi-FUCOM-SERVQUAL methodology.
Table 8 shows the difference between customer perceptions and expectations. Generally, customers are satisfied with the quality of the logistics service of the express post company. For all dimensions except for the dimension of responsiveness, the result is positive. It can be noticed that the greatest satisfaction of customers was expressed for the dimension of reliability. According to customers’ percentage rating, the dimension of reliability is the most important of all the five dimensions for customers. The results of the dimension of responsiveness remains the same, as the expectations of customers are equal to their perceptions. The questions of the reliability dimension included a part of the logistics service where the company can create the biggest improvements.
Table 9 outlines the questions of responsiveness from the aspect of customer perceptions. According to the results, after the responsiveness dimension, the dimension of tangibles with +0.064 also has opportunity for improvement. From the results obtained, it can be seen that Q11 has a significant impact on the quality of this dimension. Namely, three customers from the aspect of expectations gave the lowest rating for this question, and after the service was provided, eight customers gave the lowest rating for that question. Concerning expectations, for the same question, six customers selected a rating of 2, or “partially disagree”, while regarding perceptions, 14 customers responded with “partially disagree”.
According to the analysis, customers expressed the highest satisfaction for the dimension of reliability, with +0.0392. The dimension of reliability is focused on delivery quality and delivery time. For all six questions of the reliability dimension, customers gave higher ratings than the ratings in terms of customer expectations.

5.3. Statistical Analysis

For the set of expectations and perceptions, n N = 70 (Table 10), so that the parameter of binomial distribution for n [1, 5] can fully substitute mathematical expectation.
The mean value of the binomial distribution parameter for expectations was pE = 0.8307, and the mean value of the binomial distribution parameter for perceptions was pp = 0.8477. Between these values, there was a high significant correlation of mean values of p = 0.9303.
Although the distributions of expectations and perceptions are the same and in most cases, they have nonparametric correlation (not in one case out of 25, E15/P15), it should be noticed that the coefficients of liner correlations are, on average, small and of a normal distribution N (0.2562; 0.0233), with the significance threshold of p = 0.5708. This means that there is a large fluctuation between expectations and perceptions, i.e., there is a large number of respondents who had high expectations, but were disappointed with perceptions and vice versa.
The ANOVA test significantly confirmed that there are 17 out of 25 such cases. The Duncan test of post-hoc ANOVA was used to determine the mean values of perceptions for the factor of expectation estimates for all variables, where the variance analysis showed significant differences.
In Table 11, the values of the mean estimates for perceptions for given estimates of expectation where the ANOVA analysis has identified significant differences are given.
Based on the established mean values of binomial distribution parameters for expectations, pE = 0.8307 and pP = 0.8477 and for N = 70, we can estimate the mean number of respondents who, according to binomial distribution, assigned the ratings n [1, 5]. The expected average number of respondents who selected one of the ratings for expectations and perceptions is given in Table 12.
Further as follows:
The respondents with the expected rating, E(n) = 1, provided an average perception estimate of 2.0916, so we can conclude that the increase in the values of estimates was not significant, with p = 0.1616 (the minimum number of respondents adopted for one side test difference between two means was two for expectations and perceptions).
Respondents with the expected rating, E(n) = 2, provided an average perception estimate of 4.2329, so we can conclude that the increase in values of estimates was significant, with p = 0.0176 (the minimum number of respondents adopted for two side test differences between two means was two for expectations and perceptions). Respondents with the expected rating, E(n) = 3, provided an average perception estimate of 3.7761, so we can conclude that the increase in values of estimates was significant, with p = 0.0002 (the number of respondents adopted for two side test differences between two means was eight for expectations and seven for perceptions). Respondents with the excepted rating, E(n) = 4, provided an average perception estimate of 4.0590, so we can conclude that the increase in values of estimates was not significant with p = 0.0970 (the number of respondents adopted for two side test differences between two means was 27 for expectations and 26 for perceptions).
Respondents with the expected rating, E(n) = 5, provided an average perception estimate of 4.4621, so we can conclude that the decrease in values of estimates was significant, with p = 0.0000 (the number of respondents adopted for one side test difference between two means was 33 for expectations and 36 for perceptions)
To conclude:
Respondents who had low expectations of 2 or 3 significantly identified a perception increase to 4.0590 or 3.7761, respectively, but respondents with high expectations of 5, significantly reduced their perceptions to 4.4621.
Respondents who had expectations of 4 significantly maintained the same level of 4.0590. Considering the above, there is a stable rating of 4 for expectations, which can be adopted as the company’s final assessment.
Regarding the system of expectation and perception assessment:
There were no significant quantitative differences between expectations and perceptions. Most of the estimates were significantly binomially distributed with approximately the same parameter, as confirmed by the Signum test in 24 out of 25 estimates;
there were significant qualitative differences in assessing the expectations and perceptions contained in the fluctuation according to a stable rating of “4”. These differences are in favor of the objectivity of respondents and the concept of assessment, the correctness of the questions asked, etc., and realistically assess the company with ratings of 4.
The impact of expectations (E) as a factor on reliability, assurance, tangibles, empathy, and responsiveness is given in the Table 13. The variance analysis identified one significant case of the impact of expectations on reliability (E03), four on empathy (E05, E08, E13, E15, and E18), and two on responsiveness (E03 and E20). The expectations of assurance and tangibles had no impact.
Duncan’s test of post-hoc ANOVA revealed the values that led to the emphasis of factors as follows (Table 14):
Expectation E03 with a rating of “3” was significantly the lowest mean value for reliability, “15.000”;
expectation E03 with a rating of “3” was significantly the highest mean value for responsiveness, “33.333”;
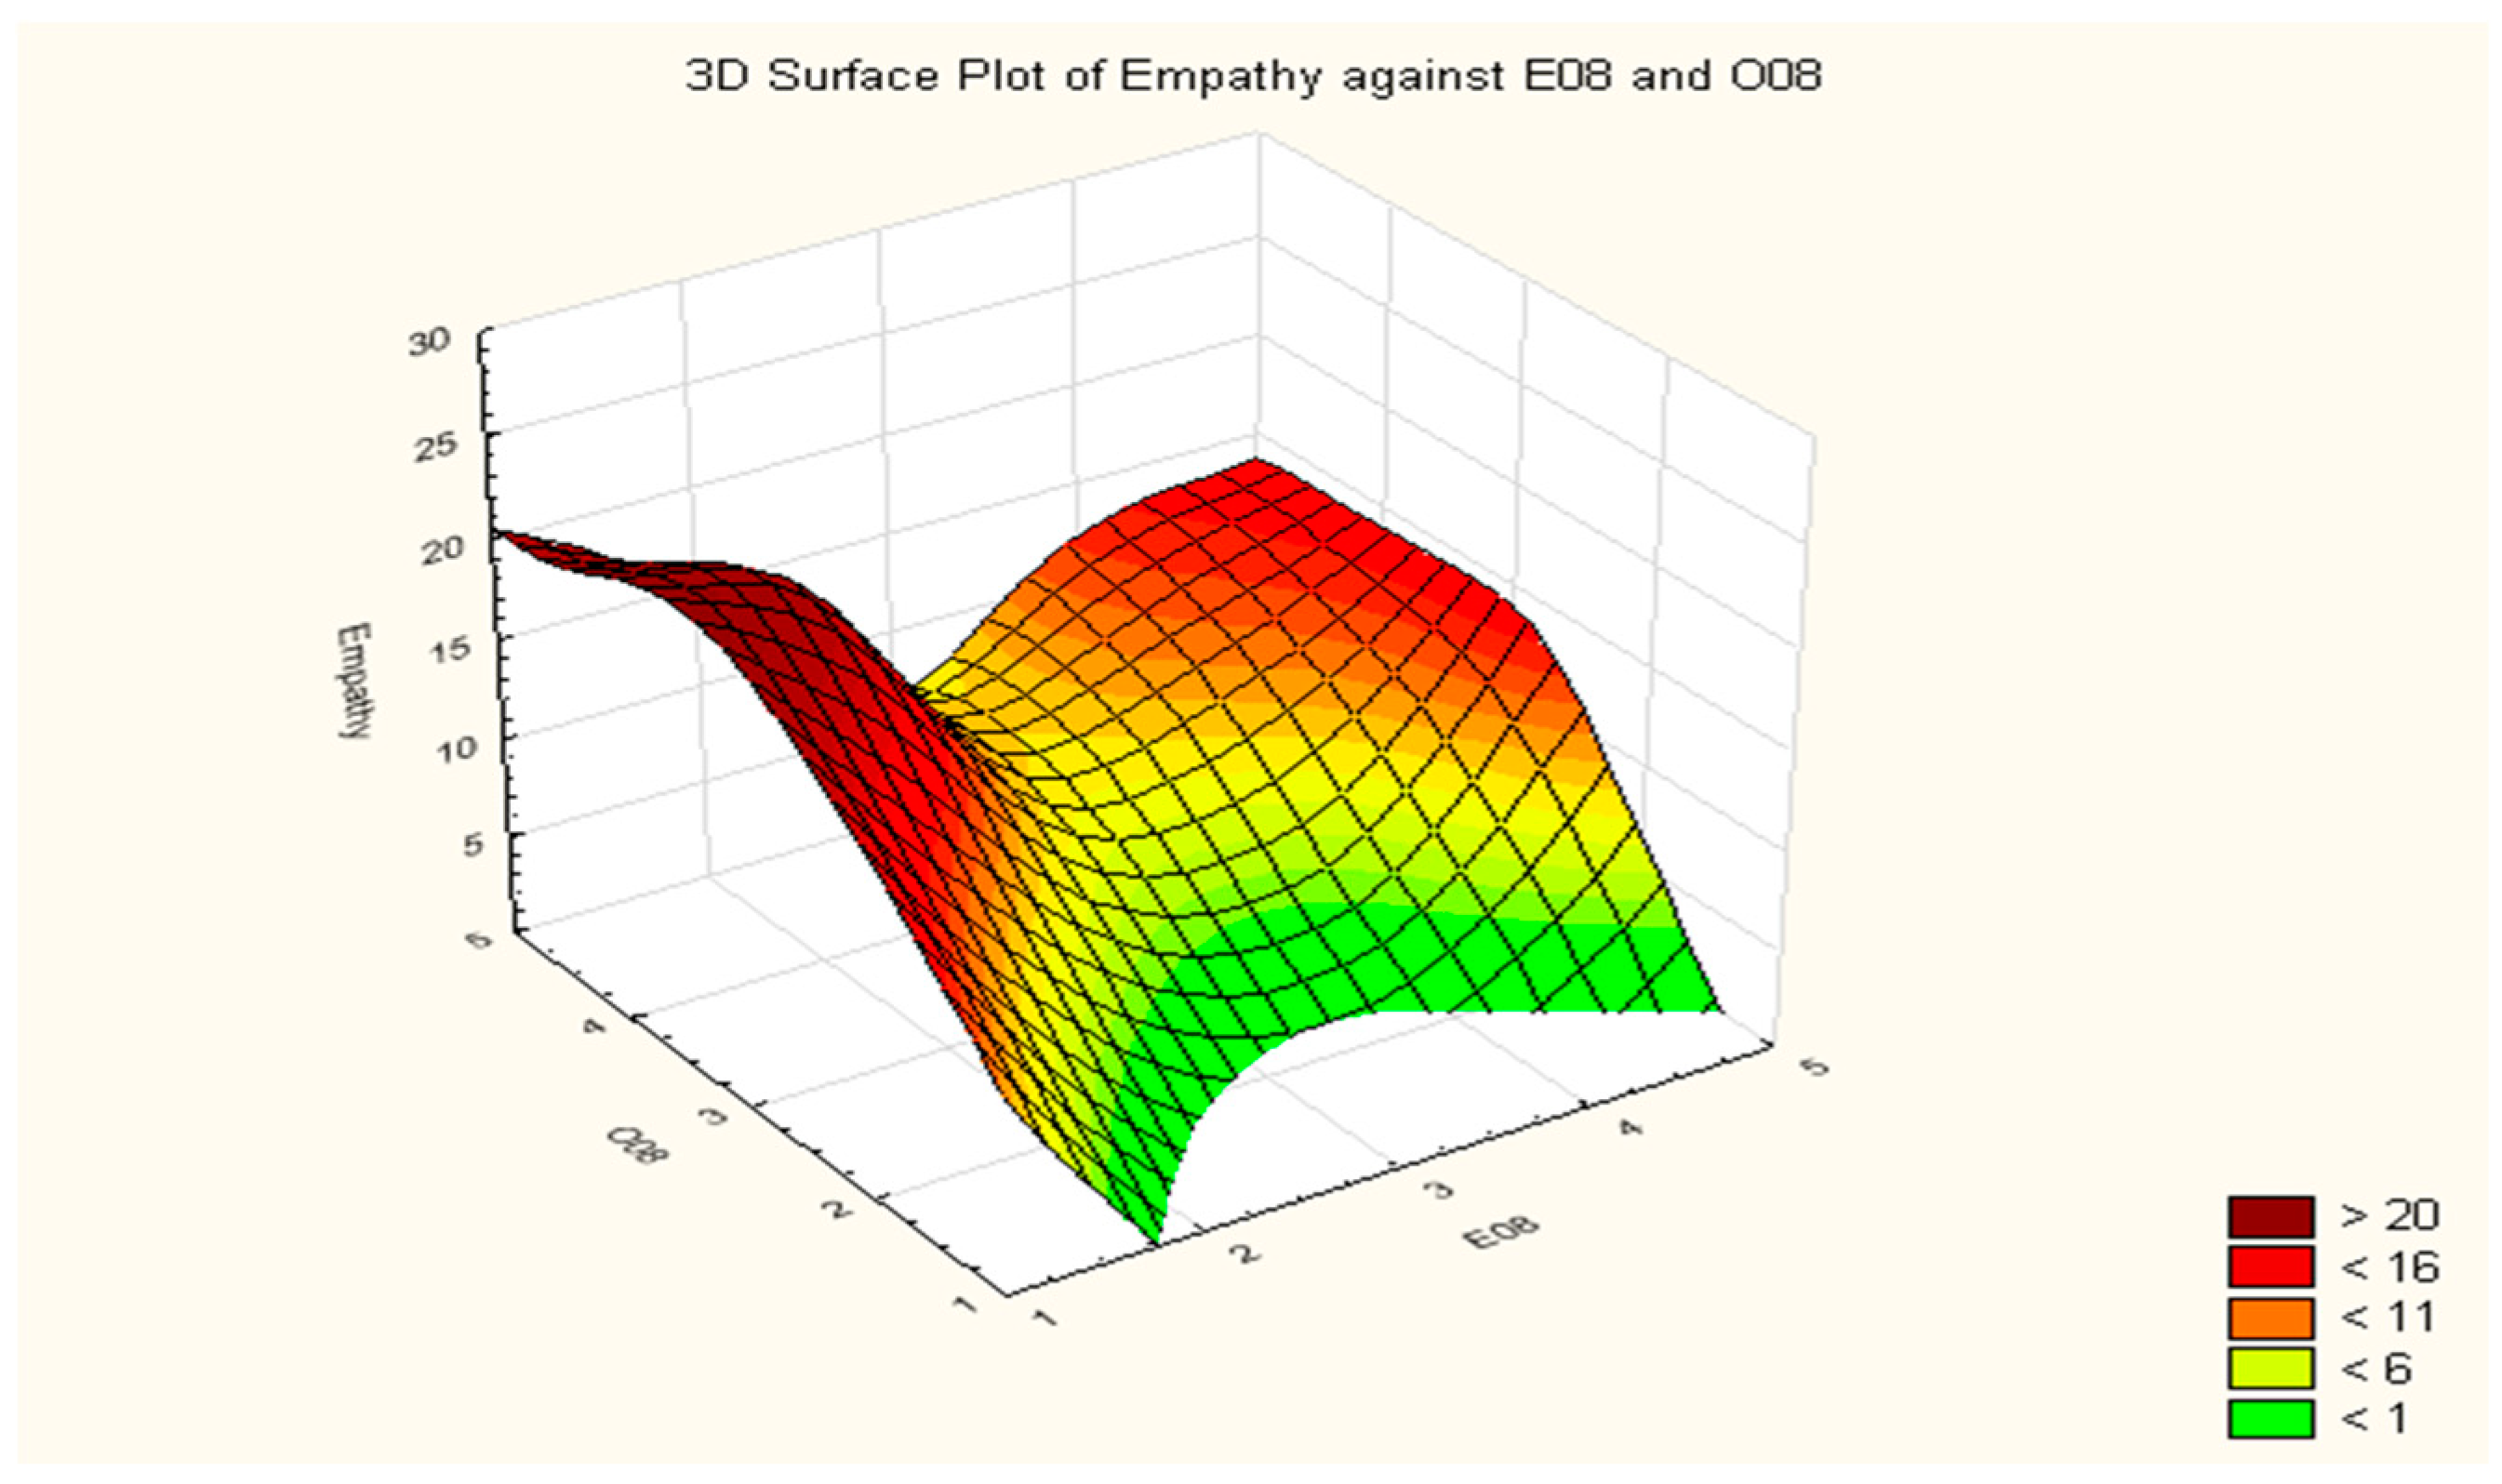
expectation E05 with a rating of “4” was significantly the lowest mean value for empathy, “6.500”;
expectation E08 with a rating of “3” was significantly the lowest mean value for empathy, “3.750”;
Expectation E13 with a rating of “2” had significantly the highest mean value for Empathy of “30.000”;
expectation E15 with a rating of “2” was significantly the highest mean value of empathy, “20.000”;
expectation E18 with a rating of “3” and “4” was significantly the lowest mean value for empathy, “9.545” and “7.954”. There were no significant differences between these values; and
expectation E20 with a rating of “3” was significantly the highest mean value for responsiveness, “35.445”.
For a significant influence of expectations, it is necessary to have at least three significant differences (p(2) = 0.0745 > 0.05, no significant influence, p(3) = 0.0370 < 0.05 influence was significant) for one of the dimensions (reliability, assurance, tangibles, empathy, and responsiveness). With the significance threshold of p(5) = 0.0092, we confirm the significant influence of expectations on empathy.
The impact of perceptions (P) as a factor on reliability, assurance, tangibles, empathy, and responsiveness is given in Table 15. The variance analysis determined one significant case of the impact of expectation on assurance (P18), two on tangibles (P09, P21), and three on empathy (P08, P10, and P23). Perceptions had no influence on reliability and responsiveness.
Duncan’s test of post-hoc ANOVA revealed the values that led to the emphasis of factors as follows (Table 16):
Perception P08 with a rating of “2” was significantly the lowest mean value for empathy, “2.000”;
perception P09 with a rating of “2” was significantly the lowest mean value for tangibles, “2.500”;
perception P10 with a rating of “2” was significantly the lowest mean value for empathy, “0.714”;
perception P18 with a rating of “3” was significantly the highest mean value for assurance, “52.500”;
perception P21 with a rating of “2” was significantly the lowest mean value for tangibles, “0.000”; and
perception P23 with a rating of “2” was significantly the lowest mean value for empathy, “3.000”.
Regarding expectations, for a significant influence of perceptions, it is necessary to have at least three significant differences for one of the dimensions (reliability, assurance, tangibles, empathy, and responsiveness), which was only recorded for empathy. With the significance threshold, p(3) = 0.0370, we confirm the significant influence of perceptions on empathy.
A particularly specific case is the empathy function as a variable depending on expectation E08 and perception P08, which at the same time, had a significant impact on empathy. From the graph, it is evident that respondents who had low expectations (1 or 2) and identified great perceptions (4 or 5) had excessively high empathy (15 to 20), which was likely to be generated as a reactive compensation to the determined difference between perceptions and expectations (Figure 7).
Here, it is necessary to recall that a significant difference between expectation E08 and perception P08 was determined in the distribution changes, and it is also necessary to notice that the difference of binomial parameters (which is analogous to mathematical expectation) had the largest increase (+0.0629), particularly in the difference between the binomial parameters for P08 and E08.
Between the impact of expectations on reliability (1 of 25) and the impact of perceptions on reliability (0 of 25), there was no significant difference, p = 0.3145 > 0.05.
Between the impact of expectations on assurance (0 of 25) and the impact of perceptions on assurance (1 of 25), there was no significant difference, p = 0.3145 > 0.05.
Between the impact of expectations on tangibles (0 of 25) and the impact of perceptions on tangibles (2 of 25), there was no significant difference, p = 0.1525 > 0.05.
Between the impact of expectations on empathy (5 of 25) and the impact of perceptions on empathy (3 of 25), there was no significant difference, p = 0.5755 > 0.05 (expectations and perceptions had a significant impact on empathy, but there were no differences between their significant impacts).
Between the impact of expectations on responsiveness (2 of 25) and the impact of perceptions on responsiveness (0 of 25), there was no significant difference p = 0.1525 > 0.05.
The others (R, A, T, R) had no significant impact, and there was no significant difference between them, too.

6. Conclusions

By applying appropriate scientific tools and techniques, it is possible to make improvements from a professional aspect in different areas, one of which is certainly quality management. In this paper, therefore, a new Delphi-FUCOM-SERVQUAL methodology was developed to improve the process of service quality measurement. The company where the case study was conducted provides express post services, so it can be said that this paper has a twofold contribution. The first contribution relates to a scientific aspect that implies the development of an integrated methodology to improve a quality measurement process that can be applied without any restrictions in various areas. The advantages of the developed methodology are reflected in the fact that it enables precision treatment of input and output parameters and provides results that are more objective. In addition, from a professional aspect of the study, it is possible to determine the quality and efficiency of the company based on the satisfaction of its customers, but it also enables further application and re-application of this methodology. This methodology can be very helpful for strategic management of the company to improve their efficiency. Considering all the relevant factors, it is possible to conclude that this paper contributes to the overall literature, enriching it in a certain way, as it provides future researchers with a new methodology that more precisely treats input parameters and achieves better results than traditional quality measurement methods.
All contributions and conclusions were confirmed throughout a comprehensive and detailed statistical analysis in which even the regularity of interaction between certain questions was established. The Cronbach alpha coefficient showed the reliability of the formed questionnaire, while ANOVA showed that there was a large fluctuation between expectations and perceptions, i.e., there was a large number of respondents who had high expectations and were disappointed with perceptions, and vice versa. Considering it at the general level, the research conducted on the system of estimating expectations and perceptions shows that: There were no significant quantitative differences between expectations and perceptions, which means that the hypothesis set in the paper was confirmed. Most of the estimates were significantly binomially distributed with approximately the same parameter, as confirmed by the Signum test in 24 out of 25 estimates. From the aspect of qualitative differences, there was significance in assessing expectations and perceptions, which was contained in the fluctuation towards a stable rating of “4”. These differences support the objectivity of the respondents and the concept of assessment, the correctness of the questions asked, etc., and realistically evaluate the company with a rating of 4. Future research related to this paper may imply the improvement of the proposed methodology by defining a universal linguistics scale for expressing customer satisfaction. In addition, depending on specific cases, it is possible to modify the structure of dimensions within the SQ questionnaire.

Author Contributions

Each author has participated and contributed sufficiently to take public responsibility for appropriate portions of the content.

Conflicts of Interest

The authors declare no conflict of interest.

References

  1. Nowotarski, P.; Pasławski, J.; Kadler, A. Quality Management Systems as a key element for company strategy selection—Case study. MATEC Web Conf. 2018, 222, 01012. [Google Scholar] [CrossRef]
  2. Wang, Y.L.; Luor, T.; Luarn, P.; Lu, H.P. Contribution and Trend to Quality Research—A literature review of SERVQUAL model from 1998 to 2013. Inform. Econ. 2015, 19, 34. [Google Scholar] [CrossRef]
  3. Kersten, W.; Koch, J. The effect of quality management on the service quality and business success of logistics service providers. Int. J. Qual. Reliabil. Manag. 2010, 27, 185–200. [Google Scholar] [CrossRef] [Green Version]
  4. Memić, Z.; Vasiljević, M.; Stević, Ž.; Tanackov, I. Measuring the quality of logistics services in the transport company using the SERVQUAL MODEL. In Proceedings of the 2nd International Conference on Management, Engineering and Environment, Belgrade, Serbia, 11–12 October 2018. [Google Scholar]
  5. Gajewska, T.; Grigoroudis, E. Estimating the performance of the logistics services attributes influencing customer satisfaction in the field of refrigerated transport. Int. J. Shipp. Transport Logist. 2017, 9, 540–561. [Google Scholar] [CrossRef]
  6. Roslan, N.A.A.; Wahab, E.; Abdullah, N.H. Service Quality: A case study of logistics sector in Iskandar Malaysia using SERVQUAL Model. Procedia Soc. Behav. Sci. 2015, 172, 457–462. [Google Scholar] [CrossRef]
  7. Tsai, J.Y.; Ding, J.F.; Liang, G.S.; Ye, K.D. Use of a hybrid MCDM method to evaluate key solutions influencing service quality at a port logistics center in Taiwan. Brodogradnja Teorija i Praksa Brodogradnje i Pomorske Tehnike 2018, 69, 89–105. [Google Scholar] [CrossRef]
  8. Awasthi, A.; Sayyadi, R.; Khabbazian, A. A combined approach integrating gap analysis, QFD and AHP for improving logistics service quality. Int. J. Logist. Syst. Manag. 2018, 29, 190–214. [Google Scholar] [CrossRef]
  9. Cavana, R.Y.; Corbett, L.M.; Lo, Y.L. Developing zones of tolerance for managing passenger rail service quality. Int. J. Qual. Reliabil. Manag. 2007, 24, 7–31. [Google Scholar] [CrossRef]
  10. Sohn, J.I.; Woo, S.H.; Kim, T.W. Assessment of logistics service quality using the Kano model in a logistics-triadic relationship. Int. J. Logist. Manag. 2017, 28, 680–698. [Google Scholar] [CrossRef]
  11. Lin, F.H.; Tsai, S.B.; Lee, Y.C.; Hsiao, C.F.; Zhou, J.; Wang, J.; Shang, Z. Empirical research on Kano’s model and customer satisfaction. PLoS ONE 2017, 12, e0183888. [Google Scholar] [CrossRef] [PubMed]
  12. Hu, K.C.; Lee, P.T.W. Novel 3D model for prioritising the attributes of port service quality: Cases involving major container ports in Asia. Int. J. Shipp. Transport Logist. 2017, 9, 673–695. [Google Scholar] [CrossRef]
  13. Bulut, E.; Duru, O.; Huang, S.T. A multidimensional QFD design for the service quality assessment of Kansai International Airport, Japan. Total Qual. Manag. Bus. Excell. 2018, 29, 202–224. [Google Scholar] [CrossRef]
  14. Huang, S.T.; Su, I. Applying Multilayer QFD to Assess Quality of Short Sea Shipping: An Empirical Study on Maritime Express Service between Taiwan and Mainland China. In Proceedings of the International Forum on Shipping, Ports and Airports (IFSPA) 2017: Innovative Transport Logistics in Shaping the Future of Supply Chains, Hong Kong, China, 22–25 May 2017. [Google Scholar]
  15. Al-Aomar, R.; Chaudhry, S. Simulation-based Six Sigma value function for system-level performance assessment and improvement. Int. J. Product. Perform. Manag. 2018, 67, 66–84. [Google Scholar] [CrossRef]
  16. Raja Sreedharan, V.; Raju, R.; Rajkanth, R.; Nagaraj, M. An empirical assessment of Lean Six Sigma Awareness in manufacturing industries: Construct development and validation. Total Qual. Manag. Bus. Excell. 2018, 29, 686–703. [Google Scholar] [CrossRef]
  17. Van Der Vorst, J.G.; Tromp, S.O.; Zee, D.J.V.D. Simulation modelling for food supply chain redesign; integrated decision making on product quality, sustainability and logistics. Int. J. Prod. Res. 2009, 47, 6611–6631. [Google Scholar] [CrossRef] [Green Version]
  18. Cho, I.J.; Kim, Y.J.; Kwak, C. Application of SERVQUAL and fuzzy quality function deployment to service improvement in service centres of electronics companies. Total Qual. Manag. Bus. Excell. 2016, 27, 368–381. [Google Scholar] [CrossRef]
  19. Paryani, K.; Masoudi, A.; Cudney, E.A. QFD application in the hospitality industry: A hotel case study. Qual. Manag. J. 2010, 17, 7–28. [Google Scholar] [CrossRef]
  20. Peprah, A.A.; Atarah, B.A. Assessing patient’s satisfaction using SERVQUAL model: A case of Sunyani Regional hospital, Ghana. Int. J. Bus. Soc. Res. 2014, 4, 133–143. [Google Scholar] [CrossRef]
  21. Behdioğlu, S.; Acar, E.; Burhan, H.A. Evaluating service quality by fuzzy SERVQUAL: A case study in a physiotherapy and rehabilitation hospital. Total Qual. Manag. Bus. Excell. 2017, 1–19. [Google Scholar] [CrossRef]
  22. Singh, A.; Prasher, A. Measuring healthcare service quality from patients’ perspective: Using Fuzzy AHP application. Total Qual. Manag. Bus. Excell. 2017, 1–17. [Google Scholar] [CrossRef]
  23. Khan, A.M.R.; Prasad, P.N.; Rajamanoharane, S. A decision-making framework for service quality measurements in hospitals. Int. J. Enterp. Netw. Manag. 2010, 4, 80–91. [Google Scholar] [CrossRef]
  24. Chou, C.C.; Liu, L.J.; Huang, S.F.; Yih, J.M.; Han, T.C. An evaluation of airline service quality using the fuzzy weighted SERVQUAL method. Appl. Soft Comput. 2011, 11, 2117–2128. [Google Scholar] [CrossRef]
  25. Saeedpoor, M.; Vafadarnikjoo, A.; Mobin, M.; Rastegari, A. A servqual model approach integrated with fuzzy AHP and fuzzy TOPSIS methodologies to rank life insurance firms. In Proceedings of the International Annual Conference of the American Society for Engineering Management, Indianapolis, IN, USA, 7–10 October 2015; American Society for Engineering Management (ASEM): Huntsville, AL, USA. [Google Scholar]
  26. Ahmed, R.R.; Vveinhardt, J.; Štreimikienė, D.; Ashraf, M.; Channar, Z.A. Modified SERVQUAL model and effects of customer attitude and technology on customer satisfaction in banking industry: Mediation, moderation and conditional process analysis. J. Bus. Econ. Manag. 2017, 18, 974–1004. [Google Scholar] [CrossRef]
  27. Long, S. The Correlation Research between Express Company Service Quality and Undergraduate Customer Satisfaction Degree Based on SERVQUAL Model. Korean Rev. Corp. Manag. 2016, 7, 1–23. [Google Scholar] [CrossRef]
  28. Apornak, A. Customer satisfaction measurement using SERVQUAL model, integration Kano and QFD approach in an educational institution. Int. J. Product. Perform. Manag. 2017, 21, 129–141. [Google Scholar] [CrossRef]
  29. Oskooii, N.; Albonaiemi, E. Measuring the customer satisfaction based on SERVQUAL model (case study: Mellat Bank in Tehran city). Innov. Mark. 2017, 13, 13–22. [Google Scholar] [CrossRef]
  30. Bourne, P.A. Customer Satisfaction of Policing the Jamaican Society: Using SERVQUAL to Evaluate Customer Satisfaction. J. Healthc. Commun. 2016, 1, 25. [Google Scholar] [CrossRef]
  31. Raza, S.A.; Jawaid, S.T.; Hassan, A. Internet banking and customer satisfaction in Pakistan. Qual. Res. Financ. Mark. 2015, 7, 24–36. [Google Scholar] [CrossRef] [Green Version]
  32. Ananda, S.; Devesh, S. Service quality and customer satisfaction: A study in the perception of retail banking customers in oman. In Proceedings of the 17th International Scientific Conference on Economic and Social Development—Managerial Issues in Modern Business, Warsaw, Poland, 20–21 October 2016; p. 333. [Google Scholar]
  33. Ali, M.; Raza, S.A. Service quality perception and customer satisfaction in Islamic banks of Pakistan: The modified SERVQUAL model. Total Qual. Manag. Bus. Excell. 2017, 28, 559–577. [Google Scholar] [CrossRef]
  34. Wang, R.; Yan, Z.; Liu, K. An Empirical Study: Measuring the service quality of an e-learning system with the model of ZOT SERVQUAL. In Proceedings of the IEEE 2010 International Conference on E-Business and E-Government (ICEE), Guangzhou, China, 7–9 May 2010; pp. 5379–5382. [Google Scholar] [CrossRef]
  35. Yang, X.S.; Zhu, Y.Y. SERVQUAL-based evaluation study on the quality of community-based service provided by university-affiliated stadiums. In Proceedings of the IEEE 2010 International Conference on Management and Service Science (MASS), Wuhan, China, 24–26 August 2010; pp. 1–4. [Google Scholar] [CrossRef]
  36. Luo, F.; Zhong, Y.; Zhang, X. Perceived performance measurement of outward bound tourists: An empirical study of SERVQUAL model. In Proceedings of the IEEE 2010 International Conference on Management and Service Science (MASS), Wuhan, China, 24–26 August 2010; pp. 1–4. [Google Scholar] [CrossRef]
  37. Altuntas, S.; Dereli, T.; Yilmaz, M.K. Multi-criteria decision making methods based weighted SERVQUAL scales to measure perceived service quality in hospitals: A case study from Turkey. Total Qual. Manag. Bus. Excell. 2012, 23, 1379–1395. [Google Scholar] [CrossRef]
  38. Badi, I.; Ballem, M. Supplier selection using the rough BWM-MAIRCA model: A case study in pharmaceutical supplying in Libya. Decis. Mak. Appl. Manag. Eng. 2018, 1, 16–33. [Google Scholar] [CrossRef]
  39. Liu, F.; Aiwu, G.; Lukovac, V.; Vukic, M. A multicriteria model for the selection of the transport service provider: A single valued neutrosophic DEMATEL multicriteria model. Decis. Mak. Appl. Manag. Eng. 2018, 1, 121–130. [Google Scholar] [CrossRef]
  40. Petrović, I.; Kankaraš, M. DEMATEL-AHP multi-criteria decision making model for the selection and evaluation of criteria for selecting an aircraft for the protection of air traffic. Decis. Mak. Appl. Manag. Eng. 2018, 1, 93–110. [Google Scholar] [CrossRef]
  41. Pamučar, D.; Božanić, D.; Lukovac, V.; Komazec, N. Normalized weighted geometric bonferroni mean operator of interval rough numbers—Application in interval rough DEMATEL-COPRAS. Facta Univ. Ser. Mech. Eng. 2018, 16, 171–191. [Google Scholar] [CrossRef]
  42. Stević, Ž.; Stjepanović, Ž.; Božičković, Z.; Das, D.K.; Stanujkić, D. Assessment of Conditions for Implementing Information Technology in a Warehouse System: A Novel Fuzzy PIPRECIA Method. Symmetry 2018, 10, 586. [Google Scholar] [CrossRef]
  43. Paddeu, D.; Fancello, G.; Fadda, P. An experimental Customer Satisfaction Index to evaluate the performance of city logistics services. Transport 2017, 32, 262–271. [Google Scholar] [CrossRef]
  44. Nunić, Z. Evaluation and selection of the PVC carpentry Manufacturer using the FUCOM-MABAC model. Oper. Res. Eng. Sci. Theory Appl. 2018, 1, 13–28. [Google Scholar]
  45. Sharma, H.; Roy, J.; Kar, S.; Prentkovskis, O. Multi Criteria Evaluation Framework for Prioritizing Indian Railway Stations Using Modified Rough AHP-Mabac Method. Transport Telecommun. J. 2018, 19, 113–127. [Google Scholar] [CrossRef] [Green Version]
  46. Verseckiene, A.; Palsaitis, R.; Yatskiv, I. Evaluation of Alternatives to Integrate Special Transportation Services for People with Movement Disorders. Transport Telecommun. J. 2017, 18, 263–274. [Google Scholar] [CrossRef] [Green Version]
  47. Csiszár, C.; Sándor, Z. Method for analysis and prediction of dwell times at stops in local bus transportation. Transport 2017, 32, 302–313. [Google Scholar] [CrossRef]
  48. Stanujkić, D.; Karabašević, D. An extension of the WASPAS method for decision-making problems with intuitionistic fuzzy numbers: A case of website evaluation. Oper. Res. Eng. Sci. Theory Appl. 2018, 1, 29–39. [Google Scholar]
  49. Nathanail, E.; Gogas, M.; Adamos, G. Assessing the Contribution of Urban Freight Terminals in Last Mile Operations. Transport Telecommun. J. 2016, 17, 231–241. [Google Scholar] [CrossRef] [Green Version]
  50. Grzegorzewski, P. On Separability of Fuzzy Relations. Int. J. Fuzzy Logic Intell. Syst. 2017, 17, 137–144. [Google Scholar] [CrossRef] [Green Version]
  51. Stojaković, M.; Twrdy, E. A decision support tool for container terminal optimization within the berth subsystem. Transport 2016, 31, 29–40. [Google Scholar] [CrossRef]
  52. Rezaei, J.; Kothadiya, O.; Tavasszy, L.; Kroesen, M. Quality assessment of airline baggage handling systems using SERVQUAL and BWM. Tour. Manag. 2018, 66, 85–93. [Google Scholar] [CrossRef]
  53. Ji, X. SERVQUAL-Model-Based Fuzzy Evaluation of Express Service Quality. Int. J. Transp. Eng. Technol. 2018, 4, 20. [Google Scholar] [CrossRef]
  54. Pamučar, D.; Stević, Ž.; Sremac, S. A New Model for Determining Weight Coefficients of Criteria in MCDM Models: Full Consistency Method (FUCOM). Symmetry 2018, 10, 393. [Google Scholar] [CrossRef]
  55. Parasuraman, A.; Zeithaml, V.A.; Berry, L.L. A conceptual model of service quality and its implications for future research. J. Mark. 1985, 49, 41–50. [Google Scholar] [CrossRef]
  56. Parasuraman, A.; Zeithaml, V.A.; Berry, L.L. SERVQUAL: A multiple-item scale for measuring consumer perceptions of service quality. J. Retail. 1988, 64, 12–40. [Google Scholar]
  57. Parasuraman, A.; Zeithaml, V.A.; Berry, L.L. Reassessment of expectations as a comparison standard in measuring service quality: Implications for further research. J. Mark. 1994, 58, 111–124. [Google Scholar] [CrossRef]
Figure 1. New methodology for improving service quality measurement.
Symmetry 10 00757 g001
Figure 2. Graph of customers’ responses regarding the dimension of reliability (left-expectations and right-perceptions).
Symmetry 10 00757 g002
Figure 3. Graph of customers’ responses regarding the dimension of assurance (left-expectations and right-perceptions).
Symmetry 10 00757 g003
Figure 4. Graph of customers’ responses regarding the dimension of tangibles (left-expectations and right-perceptions).
Symmetry 10 00757 g004
Figure 5. Graph of customers’ responses regarding the dimension of empathy (left-expectations and right-perceptions).
Symmetry 10 00757 g005
Figure 6. Graph of customers’ responses regarding the dimension of responsiveness (left-expectations and right-perceptions).
Symmetry 10 00757 g006
Figure 7. Empathy function as a variable depending on expectation E08 and perception P08.
Symmetry 10 00757 g007
Table 1. A questionnaire form from the aspect of customer expectations.
Order No.Questions
1.The company will provide a service at the expected time.
2.Employees in the company will show interest in customers’ problems.
3.The company will provide a service as promised.
4.Delivery of the shipment will be carried out on the first attempt.
5.The company will reliably carry out delivery of large value shipment.
6.The company will deliver the shipment at the expected time for long distance.
7.Employees’ conduct will create trust of customers.
8.Customers will be safe while using services.
9.Senders/receivers will be informed if the service is not possible.
10.Couriers will pick up and/or deliver the shipment at the expected time.
11.The cost of the service will be acceptable.
12.Couriers in the company will be kind.
13.Company’s delivery vehicles will be visually appealing.
14.Packaging of delivered shipment will be clean and neat.
15.Employees in the company will look neat.
16.Delivery vehicles will be modern and will have all necessary equipment.
17.Individual attention will be given to the customer.
18.Customers will feel comfortable in contact with employees.
19.Employees in the company will show understanding.
20.The company will recognize the needs of customers.
21.The working hours of the company will be appropriate and acceptable to customers.
22.Employees in the company will be willing and able to help.
23.Customers will obtain right answers to their questions.
24.Employees at the Call Center will provide all necessary information to customers.
25.Upon request, customers will respond quickly and reliably.
Table 2. The ranks of dimensions by applying the Delphi method.
DimensionRank
Reliability1
Assurance2
Tangibles4
Empathy5
Responsiveness3
Table 3. Percentage values of five dimensions by 70 respondents.
Main IndicatorsReliabilityAssuranceTangiblesEmpathyResponsiveness
Respondent 12520151525100
Respondent 23030101020100
Respondent 32515152025100
Respondent 450305510100
Respondent 52525151520100
Respondent 62525251510100
Respondent 740305520100
Respondent 82020202020100
Respondent 92020202020100
Respondent 102020202020100
Respondent 112520201520100
...
Respondent 6780100010100
Respondent 6820500030100
Respondent 69202020040100
Respondent 70252053020100
SUM1860184089577516307000
wj0.26570.26290.12790.11070.23291
Rank12345
Table 4. Priorities of dimensions.
DimensionD1D2D5D3D4
ϖ C j ( k ) 11.21.52.73.2
Table 5. Priorities of dimensions by five experts and obtained weights of dimensions.
E1
DimensionD1D2D5D3D4DFC
ϖ C j ( k ) 11.21.52.73.2
Weights0.3150.2630.2100.1130.0990.000
E2
DimensionD1D2D5D3D4DFC
ϖ C j ( k ) 11.31.52.73.2
Weights0.3370.2600.1780.1160.1090.000
E3
DimensionD1D2D5D3D4DFC
ϖ C j ( k ) 11.051.151.82.2
Weights0.2610.2480.2270.1450.1190.000
E4
DimensionD1D2D5D3D4DFC
ϖ C j ( k ) 111.21.92.6
Weights0.2670.2670.2220.1410.1030.000
E5
DimensionD1D2D5D3D4DFC
ϖ C j ( k ) 11.11.422.4
Weights0.2820.2570.2020.1410.1180.000
Table 6. The results of dimensions with customer expectations.
DimensionAVSDWjCronbach Alpha Coefficient
Reliability4.0291.0100.2910.918
Assurance4.1001.0220.2590.891
Tangibles4.1500.9240.1300.845
Empathy4.2600.8290.1090.851
Responsiveness4.2820.8310.2070.875
SERVQUAL (1)4.1640.92310.876
Table 7. The results of dimensions regarding customer perceptions.
DimensionAVSDWjCronbach Alpha Coefficient
Reliability4.1760.9950.2910.947
Assurance4.1961.0060.2590.889
Tangibles4.2001.0400.1300.824
Empathy4.3600.8440.1090.891
Responsiveness4.2820.9440.2070.894
SERVQUAL (2)4.2430.96610.889
Table 8. Research results.
Delphi-FUCOM-SERVQUAL
DimensionsPEREXPGap
Reliability1.1721.2150.043
Assurance1.0621.0870.025
Tangibles0.5400.5460.006
Empathy0.4640.4750.011
Responsiveness0.8860.8860.000
Total0.017
Table 9. Statements for the dimension of responsiveness in terms of customer perceptions.
Responsiveness
22. Employees in the company are willing and able to help.
23. Customers obtained right answers to their questions.
24. Employees at the Call Center provided all necessary information to the customers.
25. Customer requests are responded quickly and reliably.
Table 10. Verification of distribution for the set of expectations and perceptions.
ExpectationsPerceptionsSignum TestCorrelation CoefficientANOVA
Binomial Distribution ParameterVerification by χ2 Test Binomial Distribution ParameterVerification by χ2 Test
E010.80570.0184P01084570.24600.6264+0.09200.5038
E020.82850.3297P020.84570.33920.3613+0.11830.4417
E030.80850.0177P030.85420.43590.4291+0.11760.6555
E040.79420.3839P040.80850.27370.6434−0.11830.6561
E050.81140.0331P050.82280.07831.0000+0.26560.0168
E060.78570.0068P060.83430.35520.2683+0.18550.1438
E070.83140.5879P070.82850.28040.8596+0.13400.0764
E080.78560.3754P080.84850.30360.7277+0.31010.0131
E090.81710.3079P090.83430.23010.6170+0.32560.0061
E100.80850.0780P100.84570.07930.4291+0.08040.4144
E110.78260.0359P110.69710.00000.0743+0.51810.0000
E120.84000.5127P120.87140.49800.1762+0.43710.0001
E130.85140.1261P130.87420.35530.1762+0.42640.0000
E140.834203614P140.84850.41480.5107+0.36280.0003
E150.83420,3381P150.87710.50930.0311+0.48570.0001
E160.83710.2123P160.87140.49890.3239+0.29360.0105
E170.83420.6026P170.84850.25230.7353+0.17320.1517
E180.84850.1715P180.86850.26700.1884+0.18090.0311
E190.86280.7082P190.87710.61050.2299+0.13270.0129
E200.84000.4780P200.86850.10610.2962+0.28510.0055
E210.90280.4991P210.89710.64460.8598+0.43270.0000
E220.86280.4420P220.87420.05150.8638+0.14110.4380
E230.87420.6696P230.84280.28870.4576+0.38710.0005
E240.86280.6829P240.84850.00450.7277+0.29070.0172
E250.82570.7607P250.86000.09420.0909+0.34870.0053
Table 11. The values of mean estimates for perceptions for given estimates of expectations where the ANOVA analysis has identified significant differences.
Score for P(n)Rating 1Rating 2Rating 3Rating 4Rating 5
Score P052.00004.16674.00003.81824.3333
Score P075.00004.50003.60003.95834.4194
Score P081.00003.80004.00004.00004.3428
Score P092.00004.25004.00004.03854.3030
Score P112.87503.64282.85714.11114.6087
Score P121.00003.66674.25003.95834.4737
Score P131.00004.00004.00004.13644.4615
Score P141.50004.66673.80004.03854.4414
Score P152.00004.00003.60003.86964.4872
Score P161.00004.00004.25004.07414.3611
Score P183.00004.75003.75003.90914.4615
Score P19-4.75003.33334.12004.4737
Score P20-4.50003.00004.06254.4688
Score P211.00005.00003.66674.52174.6429
Score P234.00003.60004.50004.00004.7353
Score P242.00004.33333.91674.43754.4474
Score P252.00004.33333.50003.95004.3947
Mean value2.09164.23293.76614.05904.4621
Std. deviation1.19190.42560.43200.18140.1127
Table 12. Calculation of the average number of respondents based on the binomial distribution parameters, pE and pP, the number of respondents, N = 70, and ratings, n [1, 5].
Rating 1Rating 2Rating 3Rating 4Rating 5Σ
Expectations E0.05741.12698.299627.167633.348470
Perceptions P0.03760.83816.998825.974836.150670
Table 13. The variance analysis of influencing factors of expectations on reliability, assurance, tangibles, empathy, and responsiveness.
ReliabilityAssuranceTangiblesEmpathyResponsiveness
E010.23330.32830.92820.14980.8148
E020.75510.45210.29270.09020.2.855
E030.02980.98130.73760.70550.0342
E040.99250.89590.85930.44290.7441
E050.28100.65940.12810.02540.4000
E060.19040.57990.72430.15640.9151
E070.80860.23670.46550.20650.7040
E080.65190.71030.64250.01360.8606
E090.42480.58020.69670.88210.3657
E100.57890.93850.53140.57160.4891
E110.45540.79110.29010.16730.7318
E120.66030.97520.42800.46460.7597
E130.55090.13550.29930.01950.8361
E140.92890.46190.93770.90590.2006
E150.43640.11130.15490.00080.8963
E160.45090.36880.90110.59420.2297
E170.26140.97140.49000.60010.4829
E180.35860.41110.50820.03270.4736
E190.76230.18670.64610.51030.1482
E200.24890.37890.22940.12400.0114
E210.40910.96420.18520.43200.7649
E220.89180.39740.10060.08270.3012
E230.81180.13970.55390.14200.2649
E240.37250.38000.81760.97270.0757
E250.88640.56910.93780.91550.6695
Table 14. Calculation of the attribute mean values for a given rating of significant expectation influence.
12345
E03Reliability-30.62515.00026.59730.000
E03Responsiveness-18.12533.33323.42120.645
E05Empathy-11.25013.6366.50013.065
E08Empathy15.00016.2503.7509.42315.500
E13Empathy10.00030.00014.1678.33312.931
E15Empathy-20.0008.5007.81215.358
E18Empathy-20.0009.5457.95412.794
E20Responsiveness-15.00035.44520.80021.774
Table 15. The influence of perceptions (P) on dimensions using ANOVA.
ReliabilityAssuranceTangiblesEmpathyResponsiveness
P010.62220.89000.96620.16280.5745
P020.74850.85570.25430.09650.3145
P030.24460.65830.22280.13440.2166
P040.65160.97240.86060.14060.3944
P050.95250.28860.78840.11460.7364
P060.10710.75450.27500.13660.5060
P070.67140.26010.25850.06110.9407
P080.31000.23530.37480.04950.5877
P090.73290.27390.04490.06810.7172
P100.18760.52620.18790.00370.3463
P110.98350.51570.72000.54120.4980
P120.43870.78170.23650.15700.9112
P130.36070.47810.12400.16660.2573
P140.17630.62970.07150.14300.8599
P150.21350.32810.25780.06050.3694
P160.96700.50750.80830.98100.4574
P170.74420.37760.54580.21590.3887
P180.71280.01170.23180.10940.4439
P190.26580.60420.28760.28850.8120
P200.98670.08730.43120.06970.5619
P210.55510.70170.04040.45820.8648
P220.58020.62910.31150.15670.5822
P230.08320.44120.08100.00740.2661
P240.57260.60540.78900.18160.5781
P250.37340.81360.89650.06470.6609
Table 16. Calculation of the attribute mean values for given ratings of significant perception influence.
12345
P08Empathy10.0002.0006.00012.08312.429
P09Tangibles13.3332.50018.75014.61511.818
P10Empathy10.0000.71410.00010.47613.514
P18Assurance25.00035.00052.50025.00023.426
P21Tangibles10.0000.00023.33310.21713.810
P23Empathy20.0003.0009.1668.54114.118

