Mapping and Analyzing the Park Cooling Effect on Urban Heat Island in an Expanding City: A Case Study in Zhengzhou City, China


Abstract
:
1. Introduction
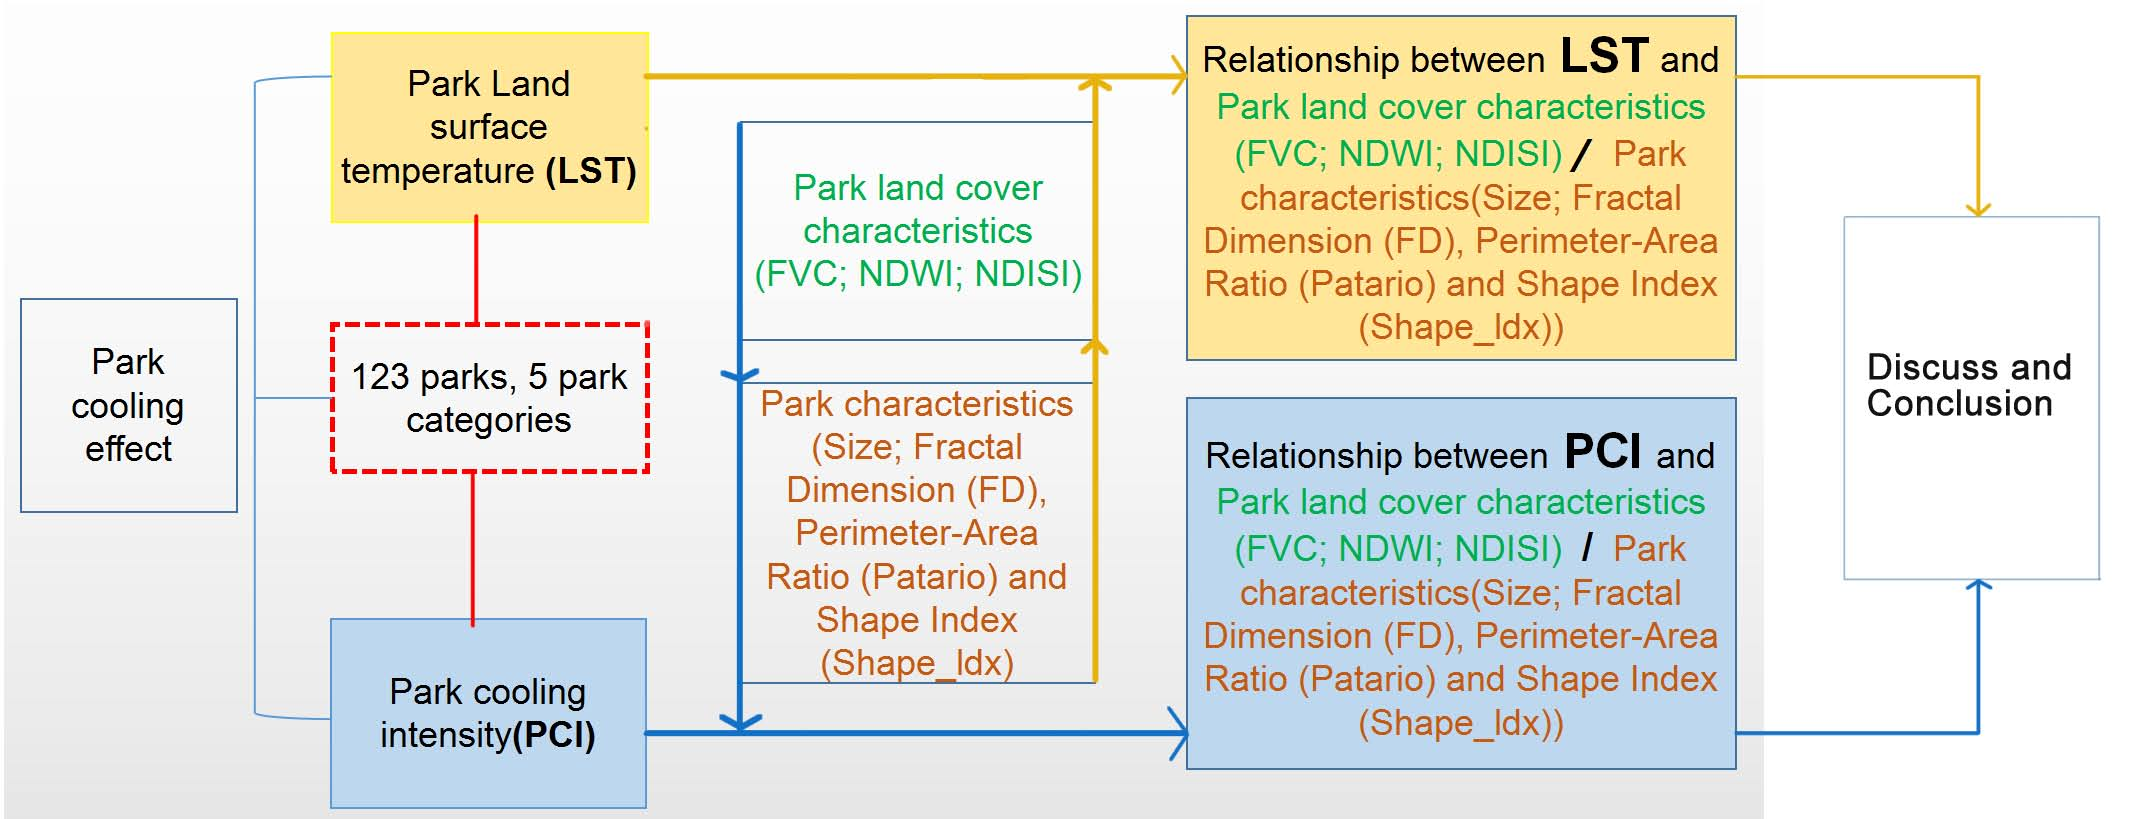
2. Study Area
3. Data Sources and Methods
3.1. Data Used
3.2. Retrieval of LST and the Average LST Calculation
- (1)
- Conversion to Spectral Radiance [49];
- (2)
- Conversion to top of Atmosphere Radiance [49];
- (3)
- Conversion to Top of Atmosphere Brightness Temperature [49];
- (4)
- Calculation of Proportion of Vegetation [50];
- (5)
- Estimation of estimate land surface emissivity (LSE) [48];
- (6)
- Retrieval of land surface temperature (LST).
3.3. Sample Selection
3.4. Determination of the Park Cooling Intensity (PCI)
3.5. Patch Descriptors of the Park
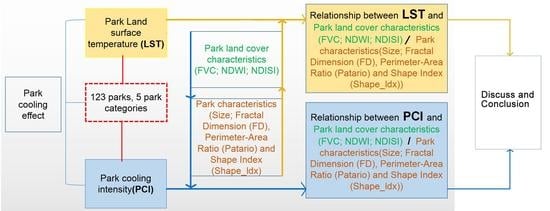
3.6. Analysis Methods
4. Results
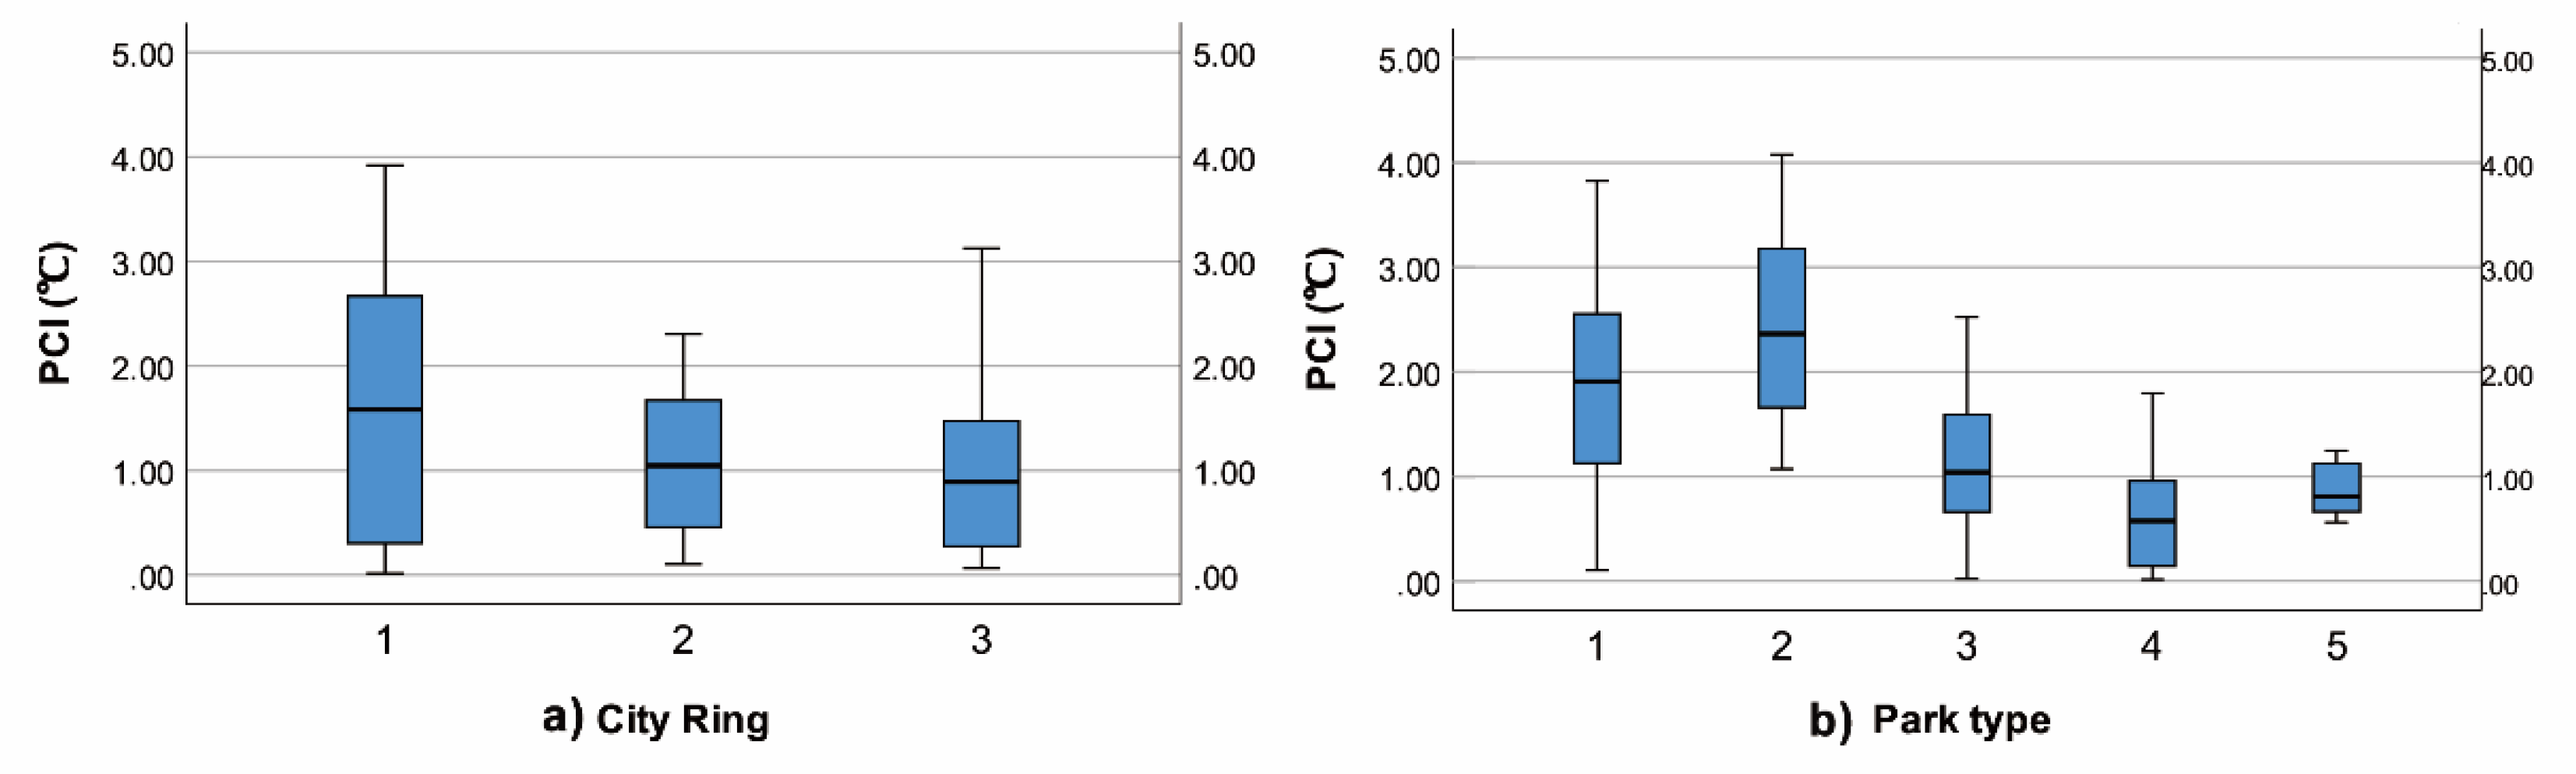
4.1. Relation between Park Types, LST and PCI
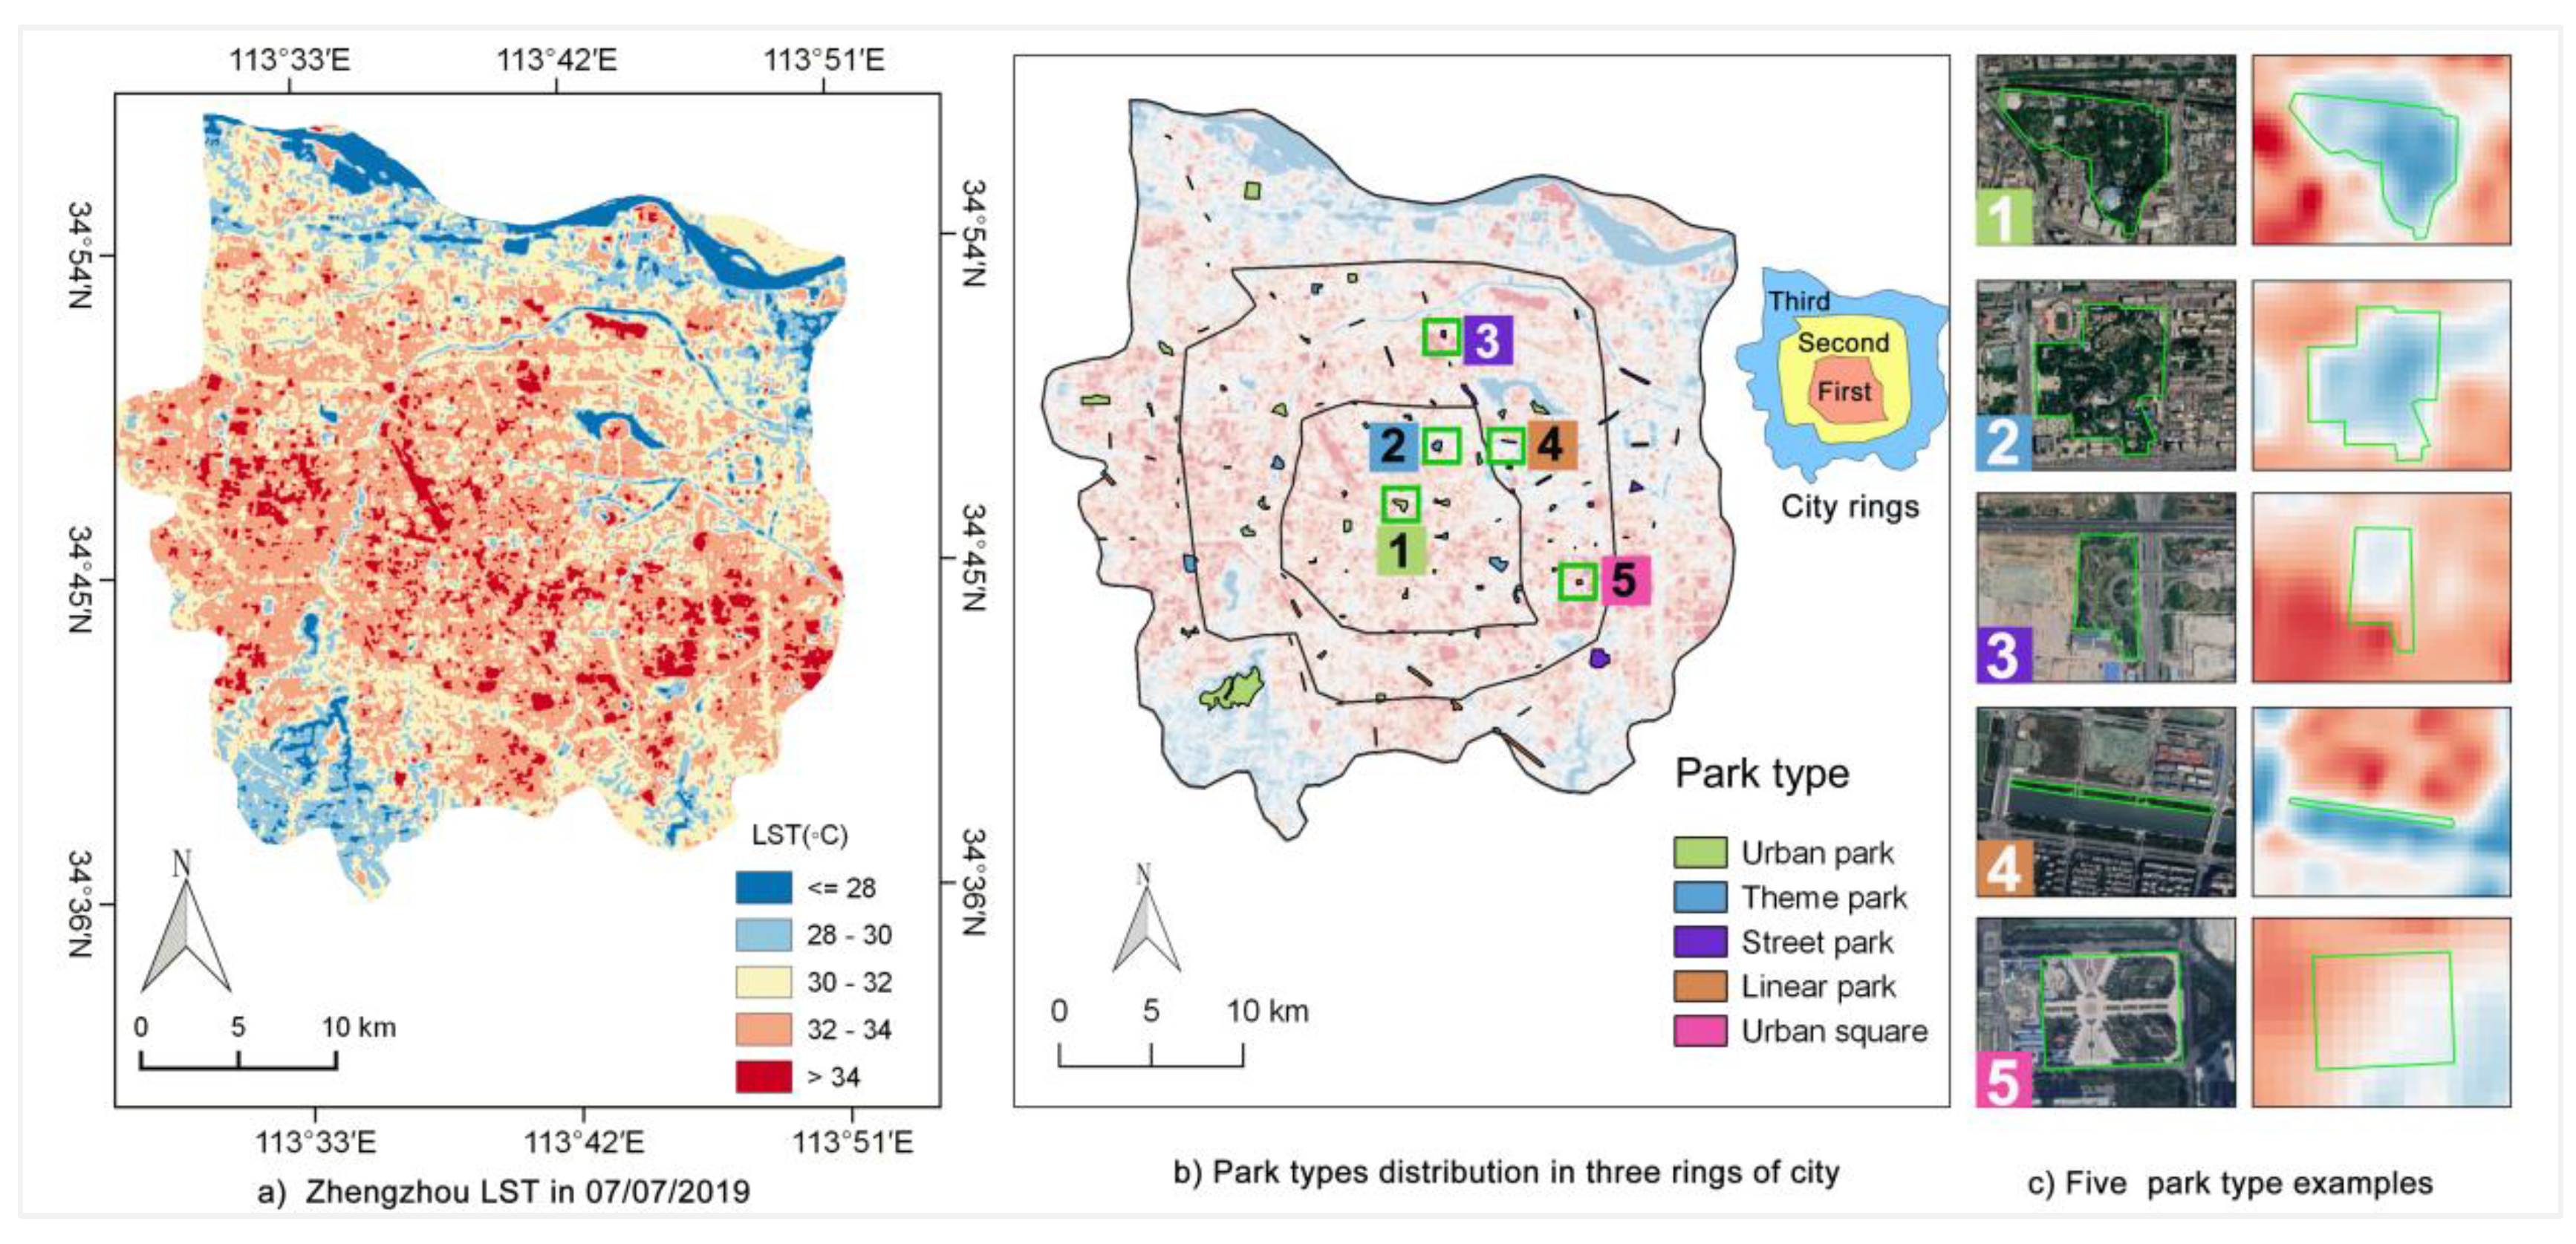
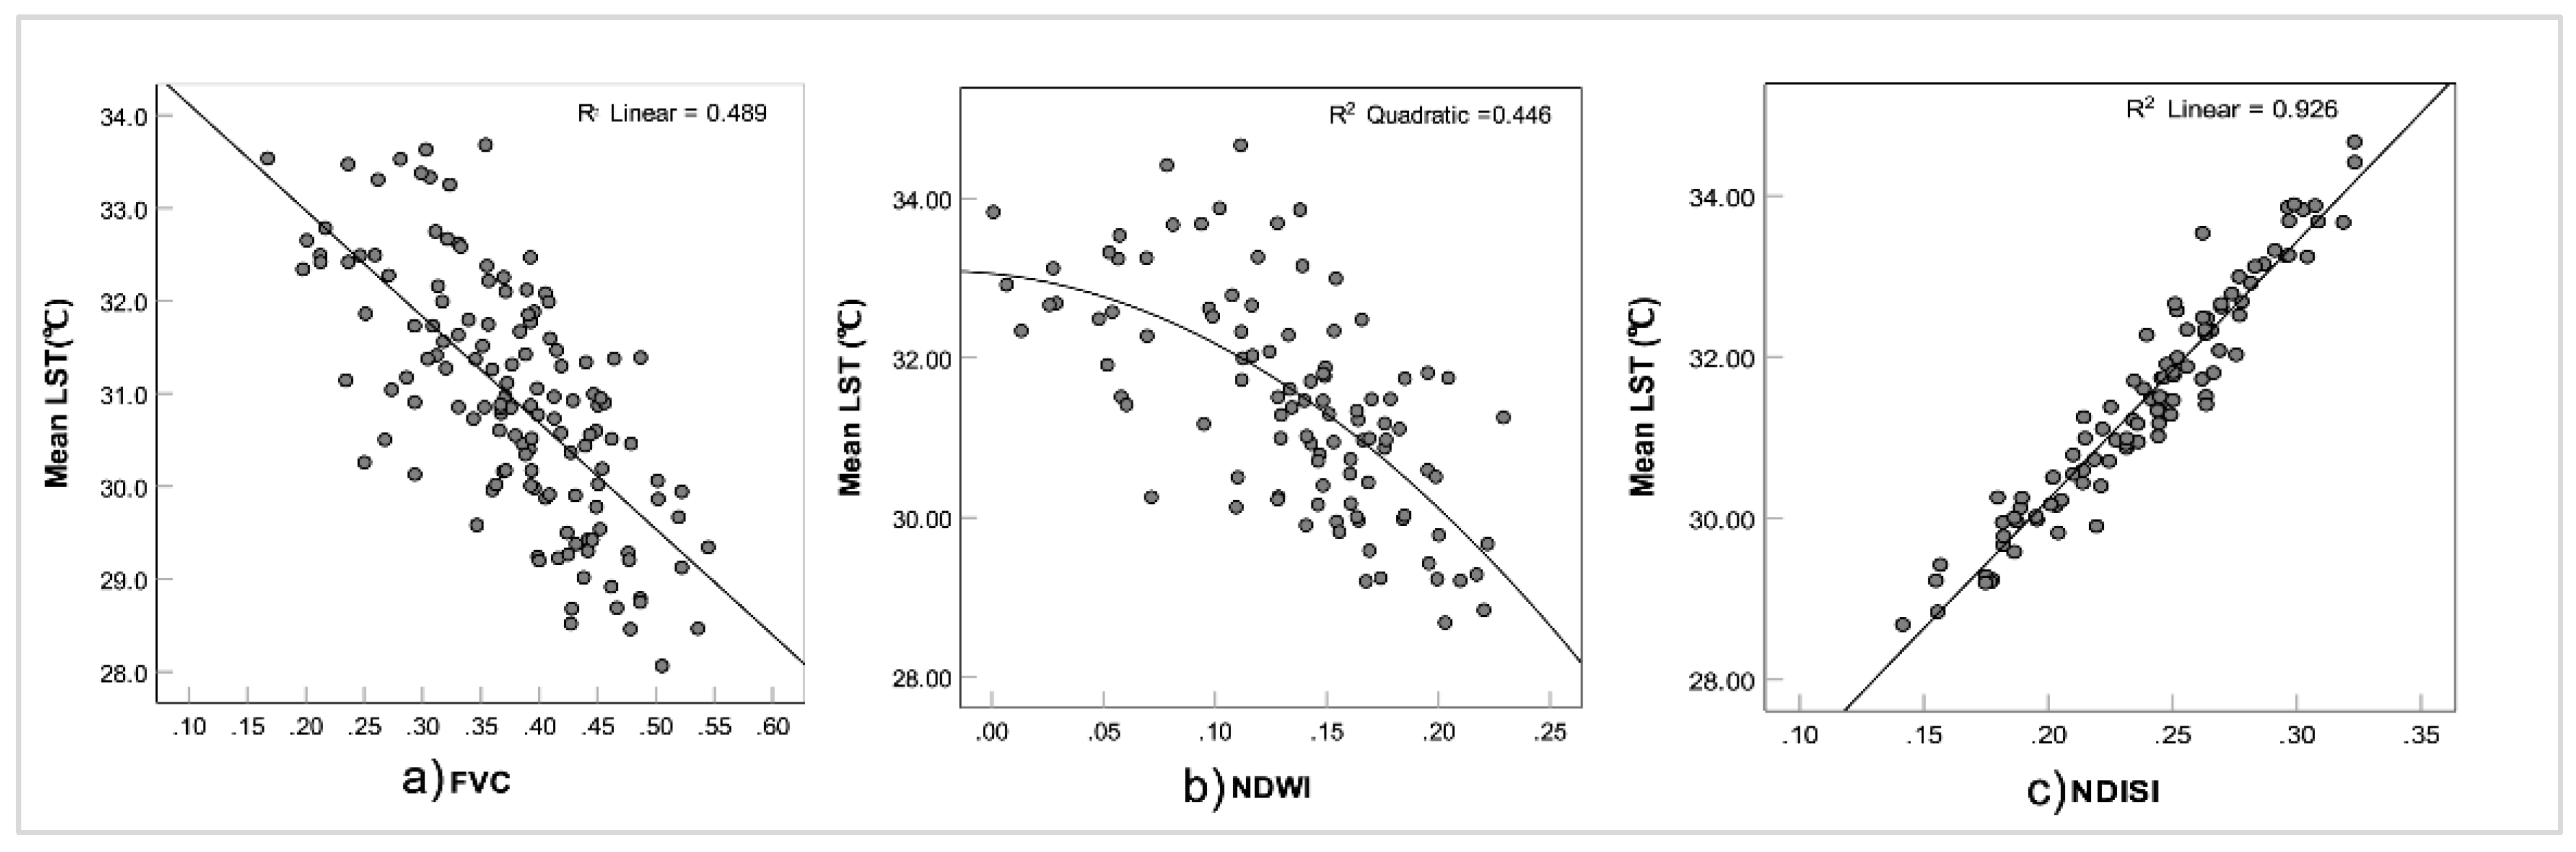
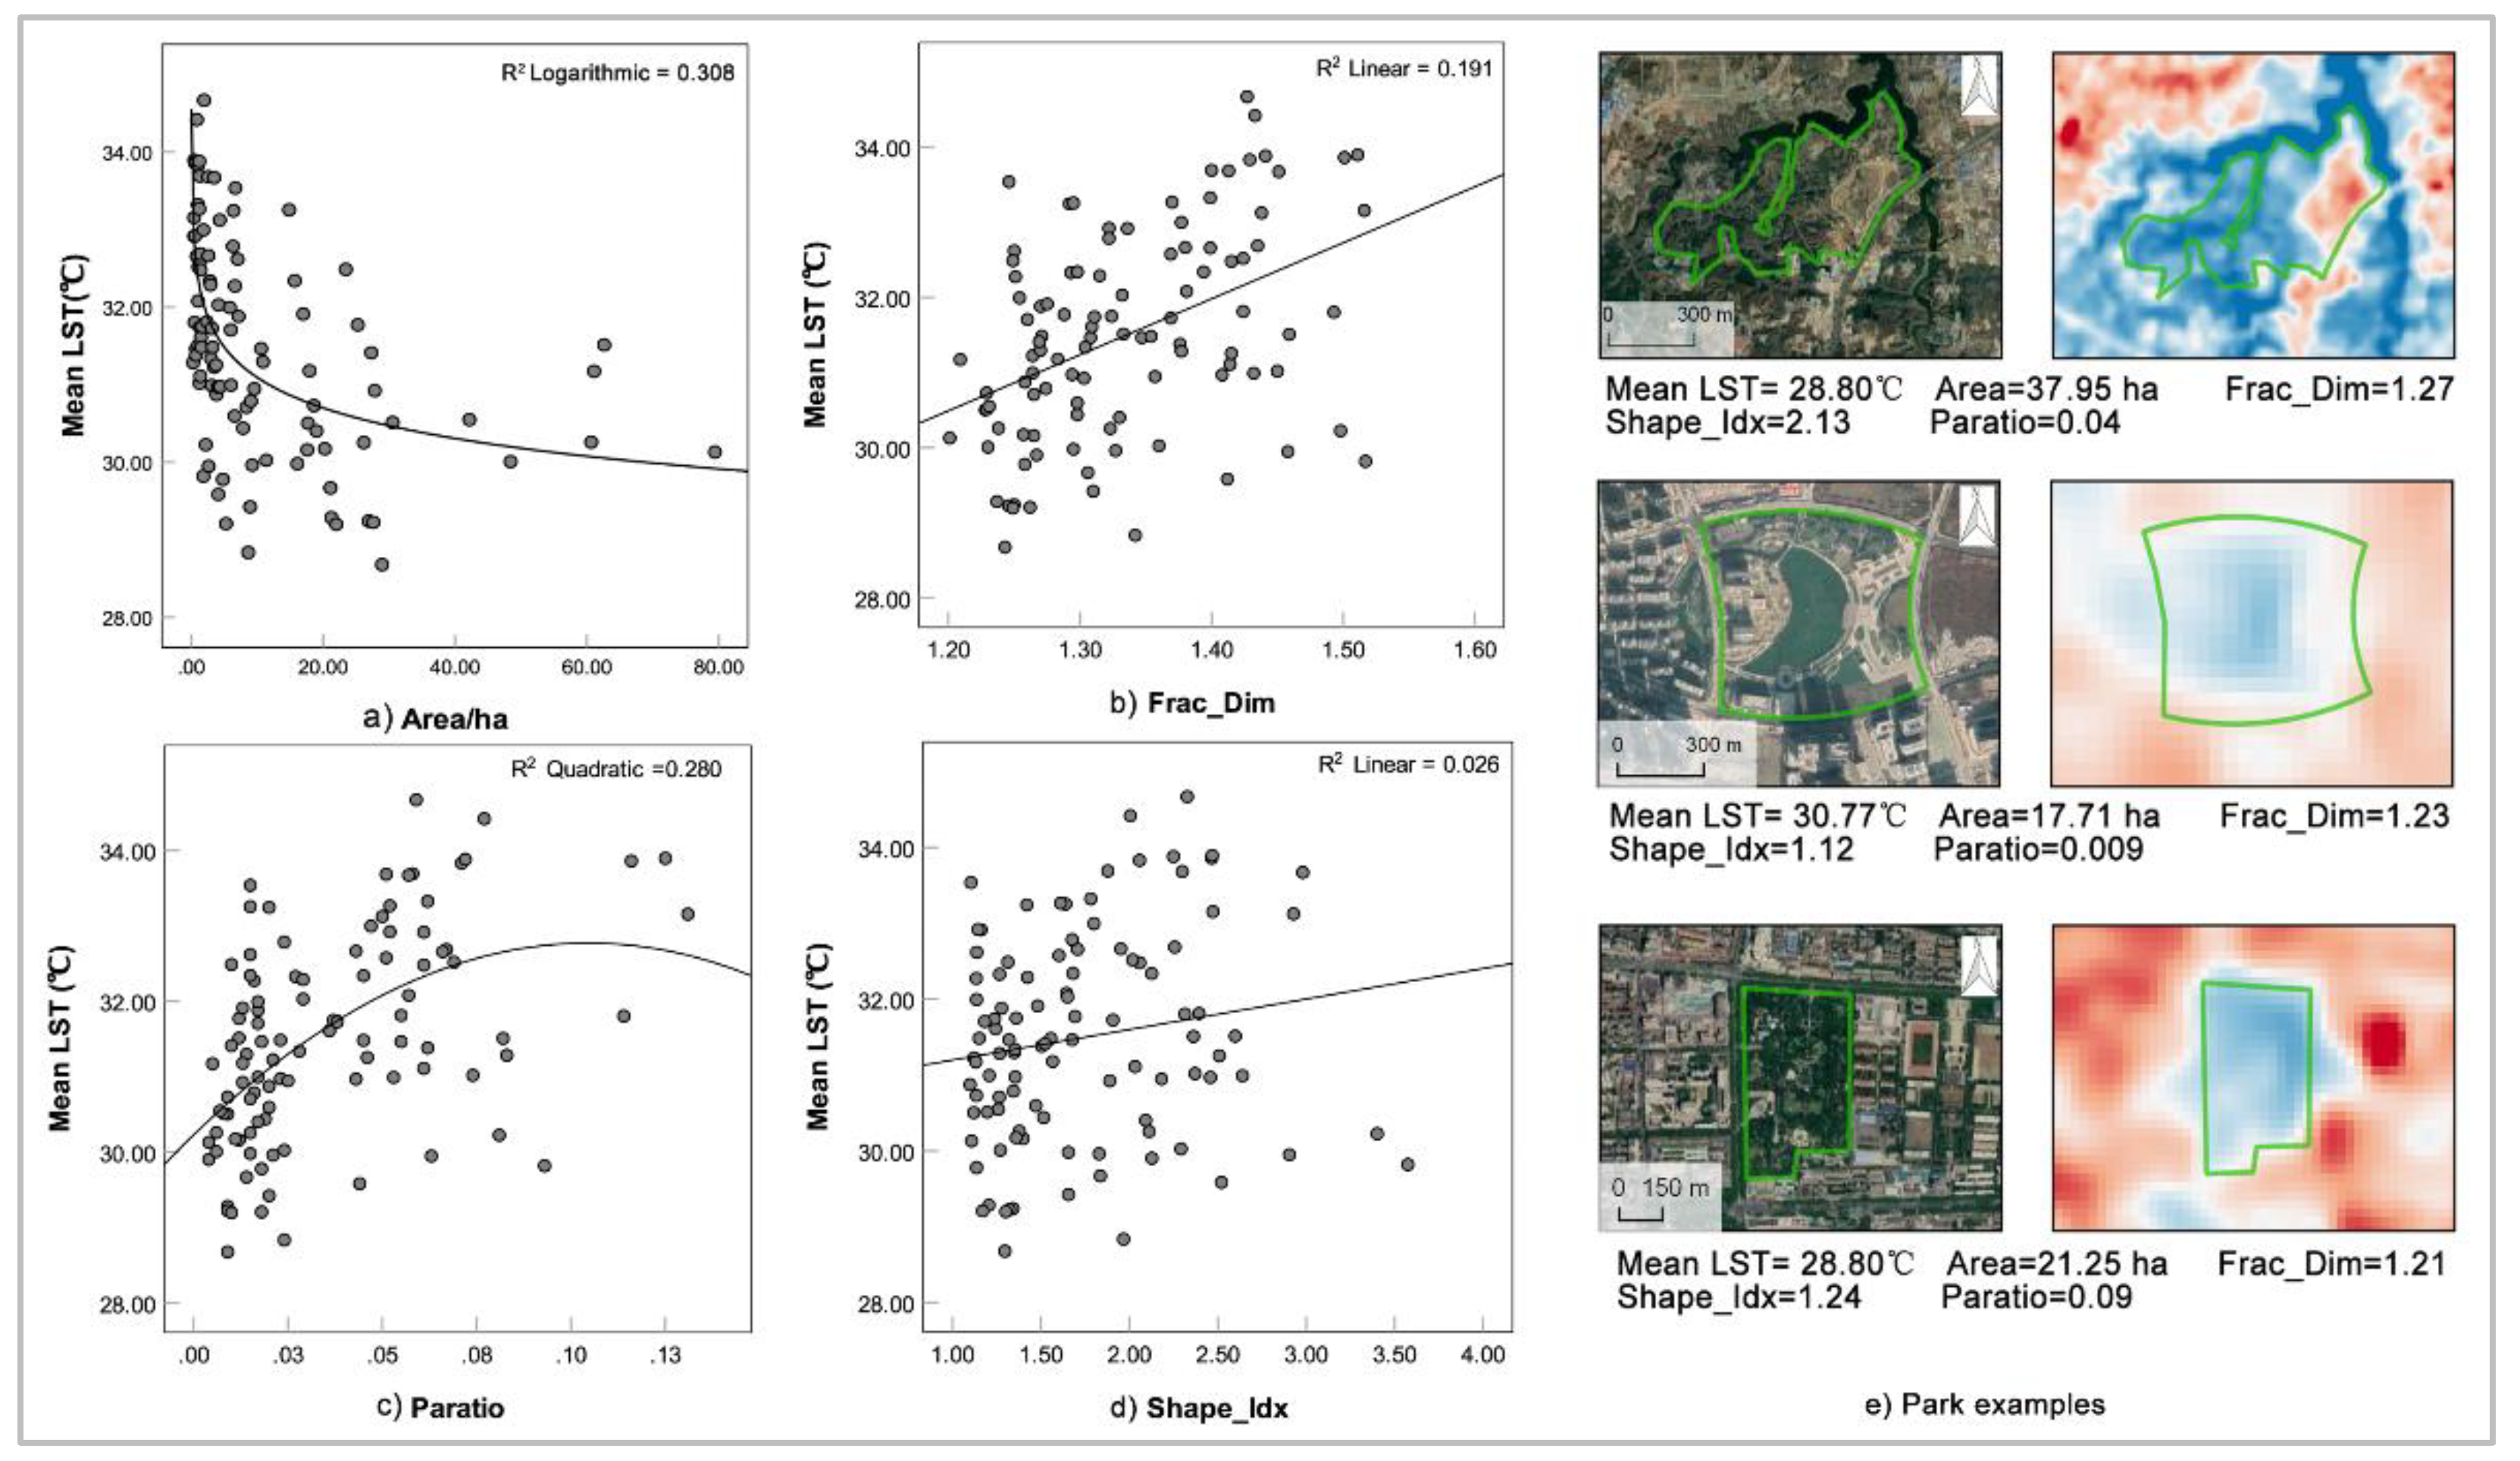
4.2. Relation between Park LST and Its Impact Factor
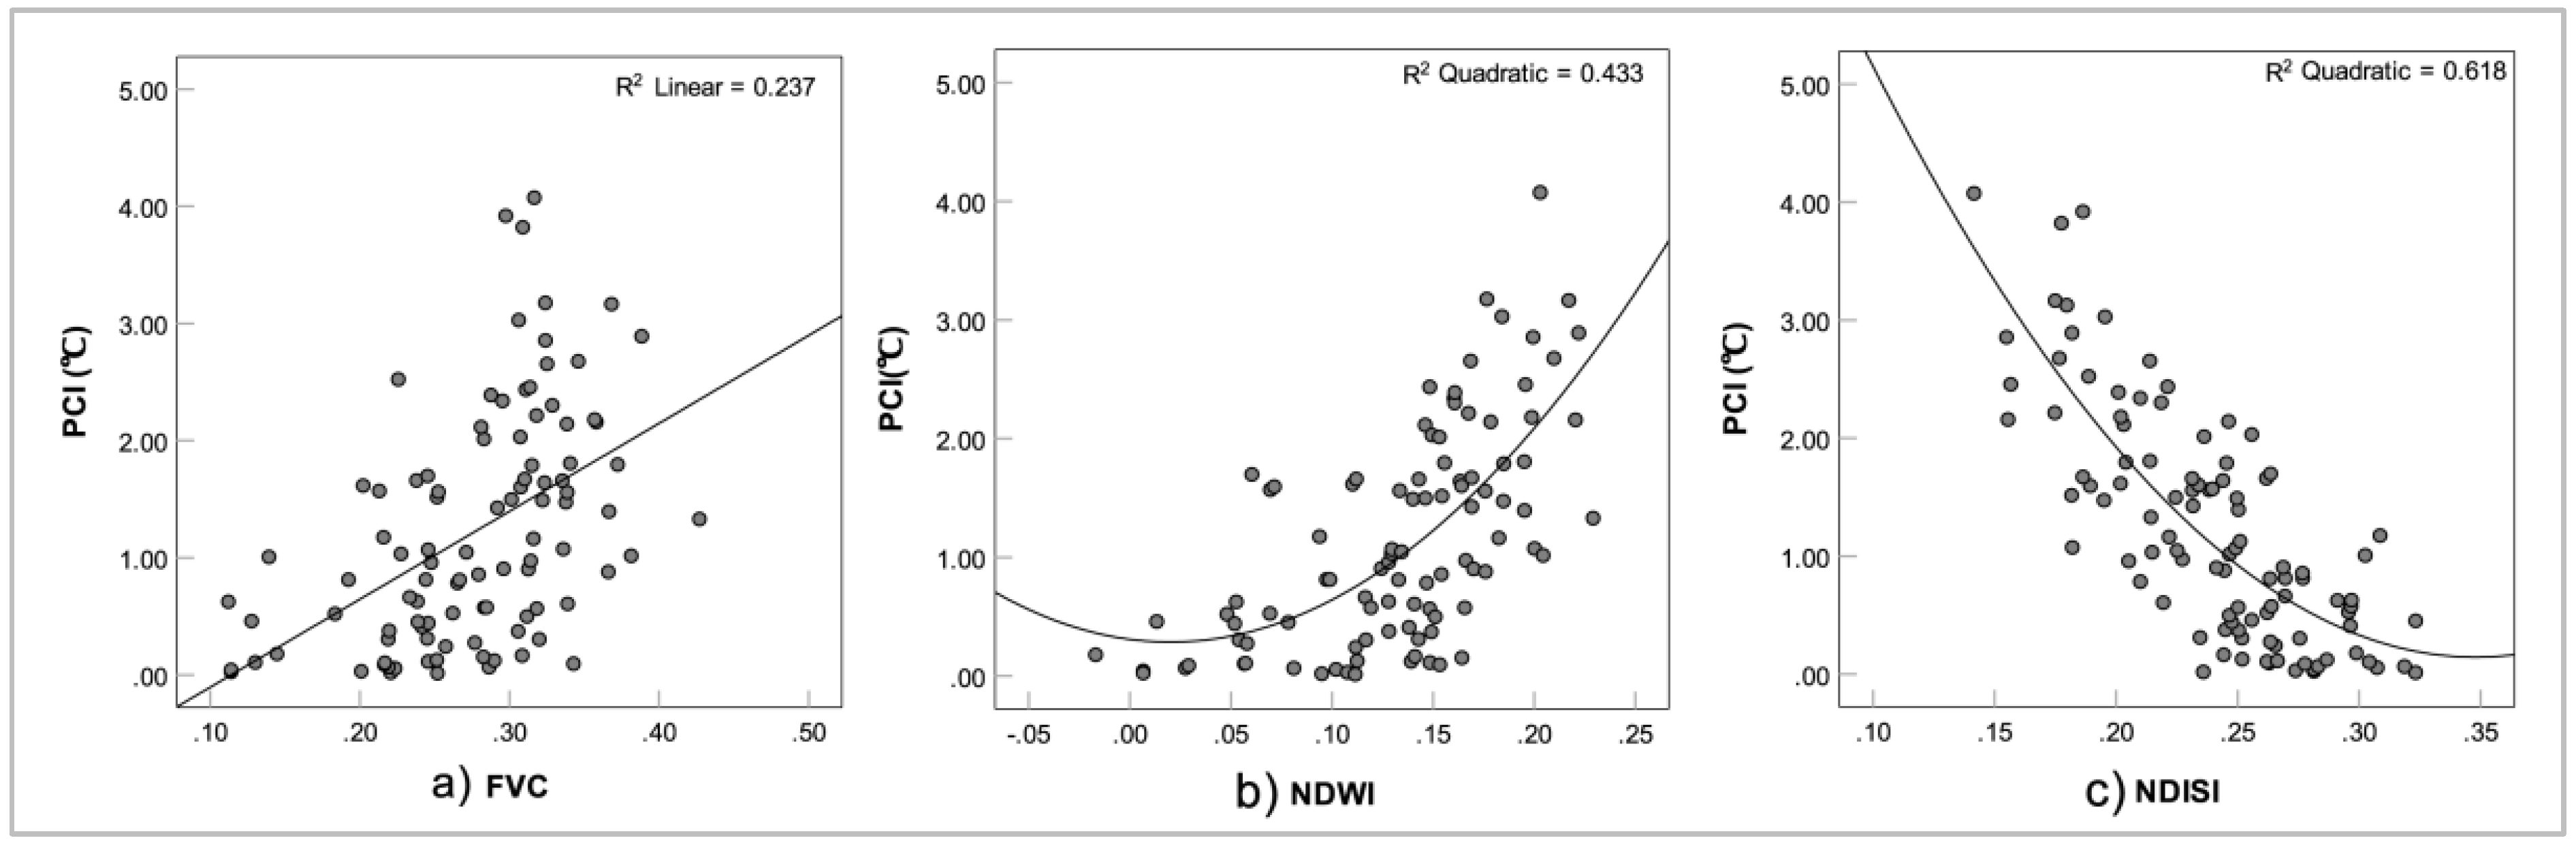
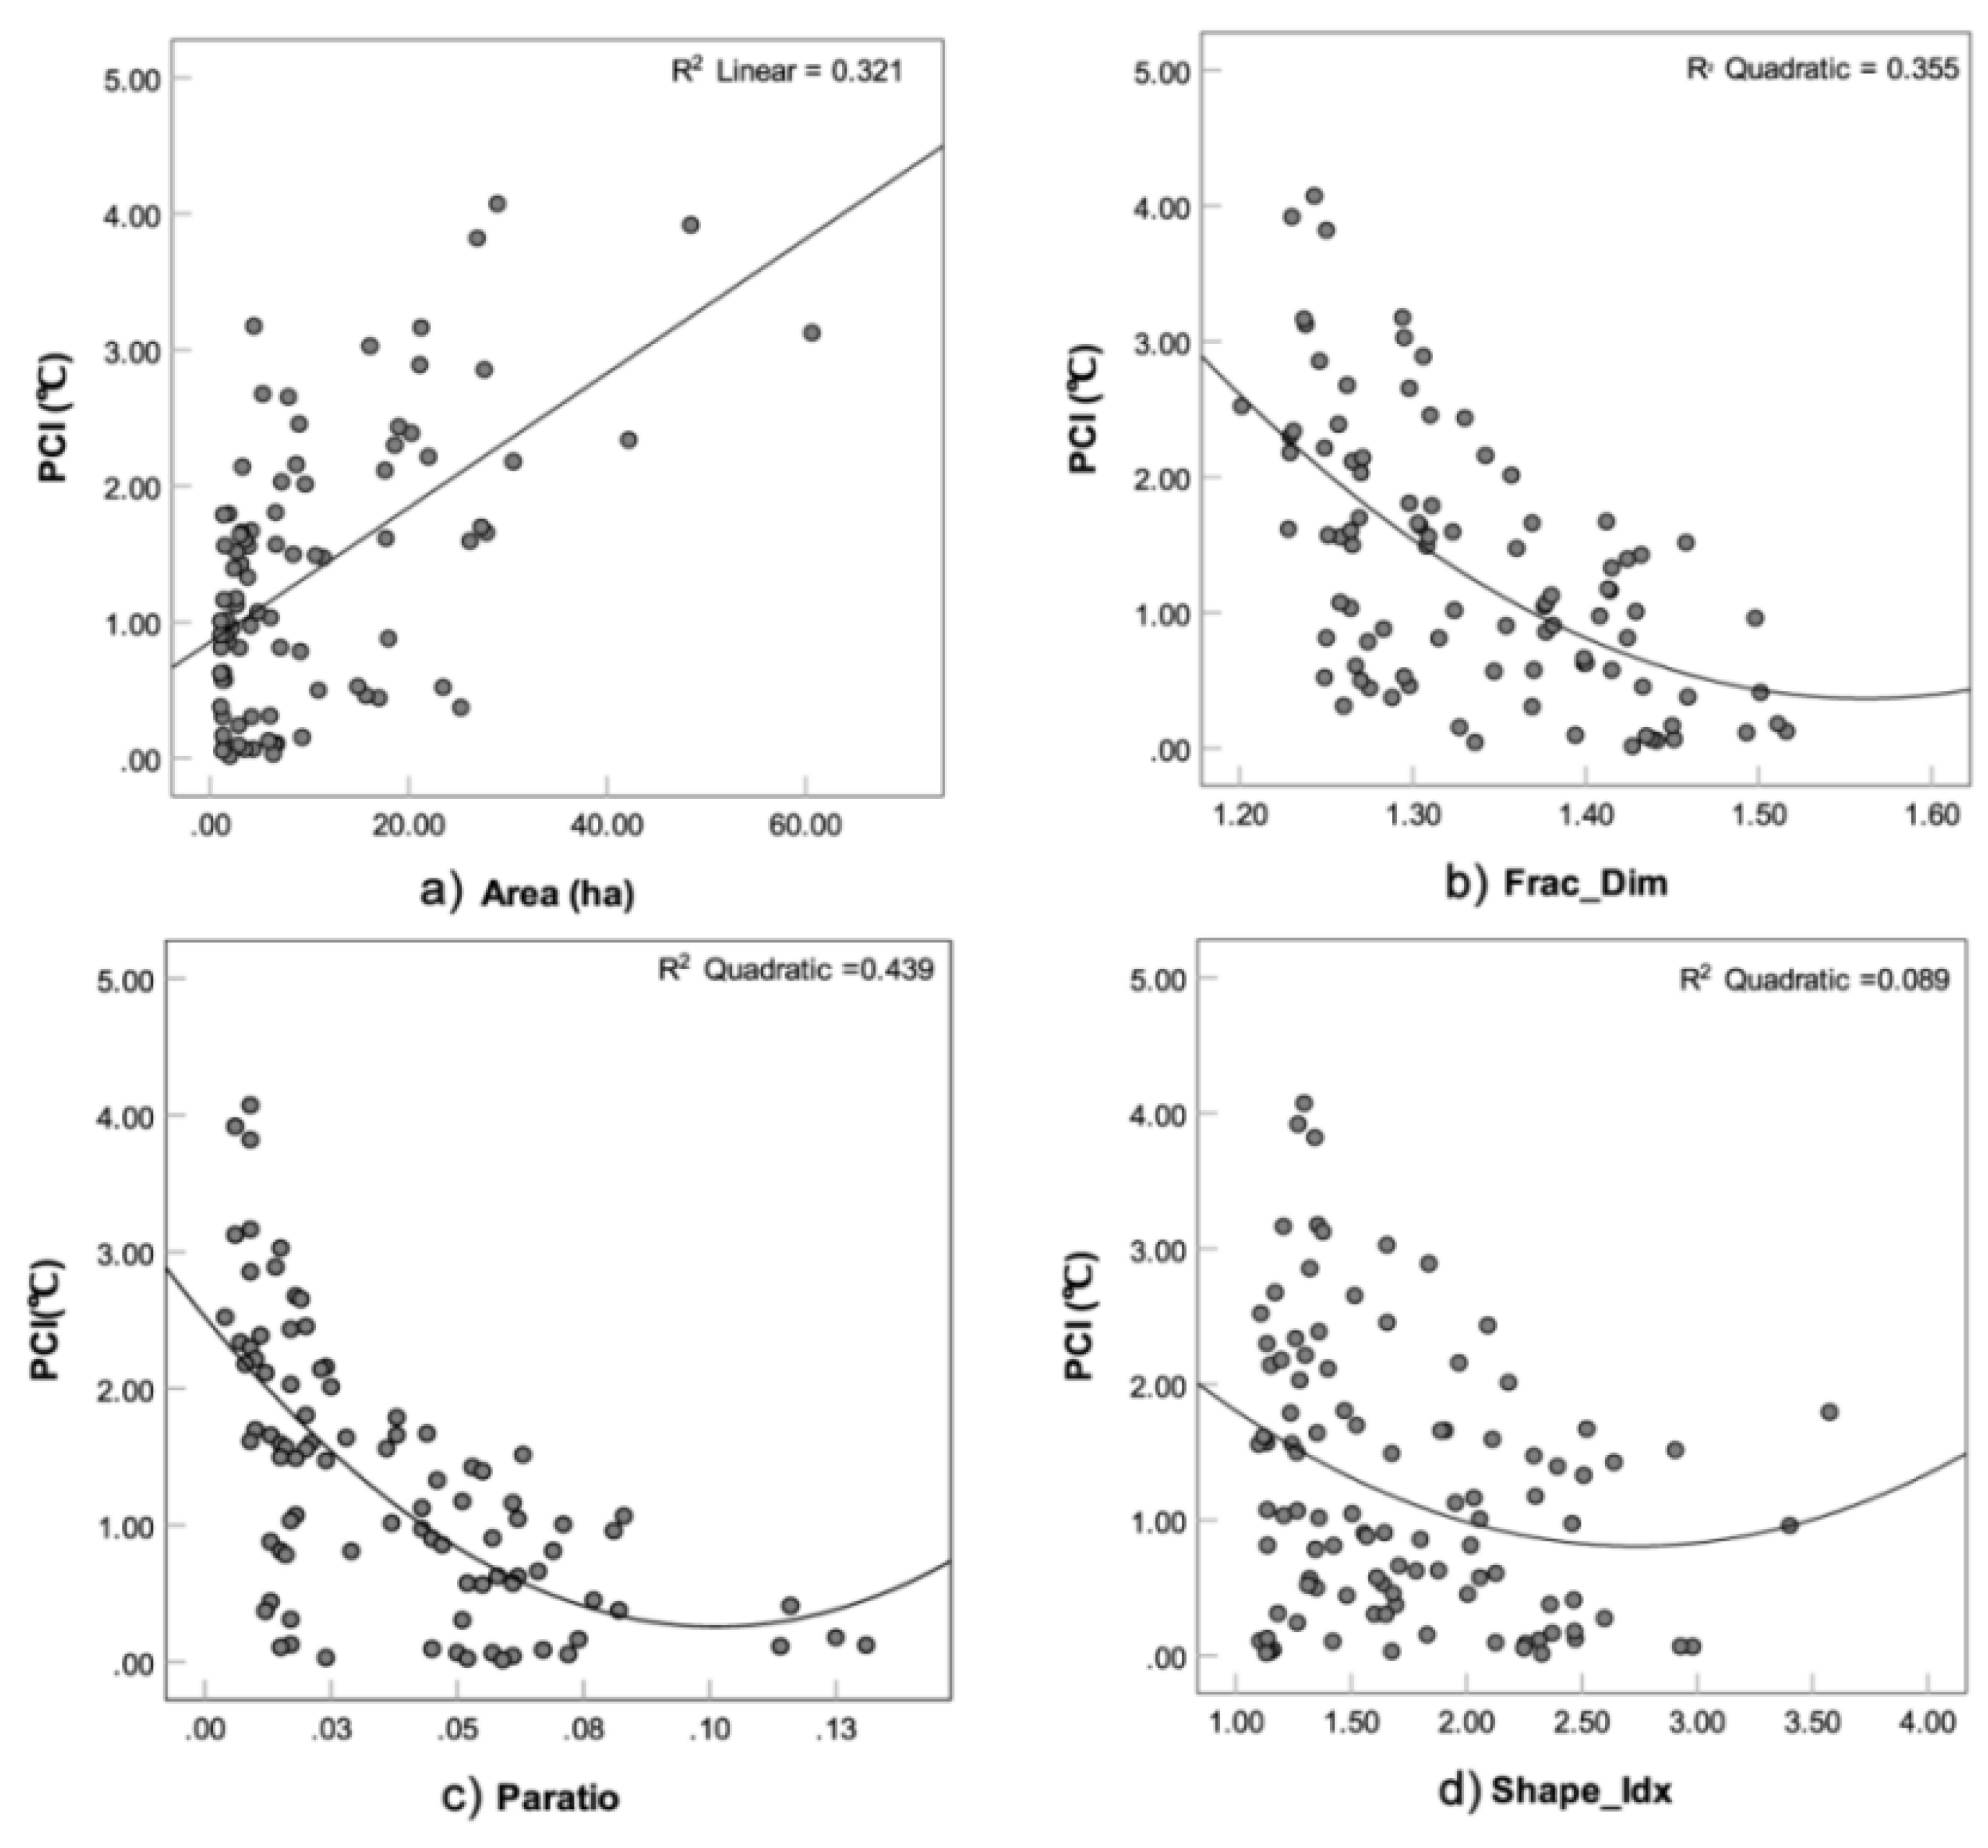
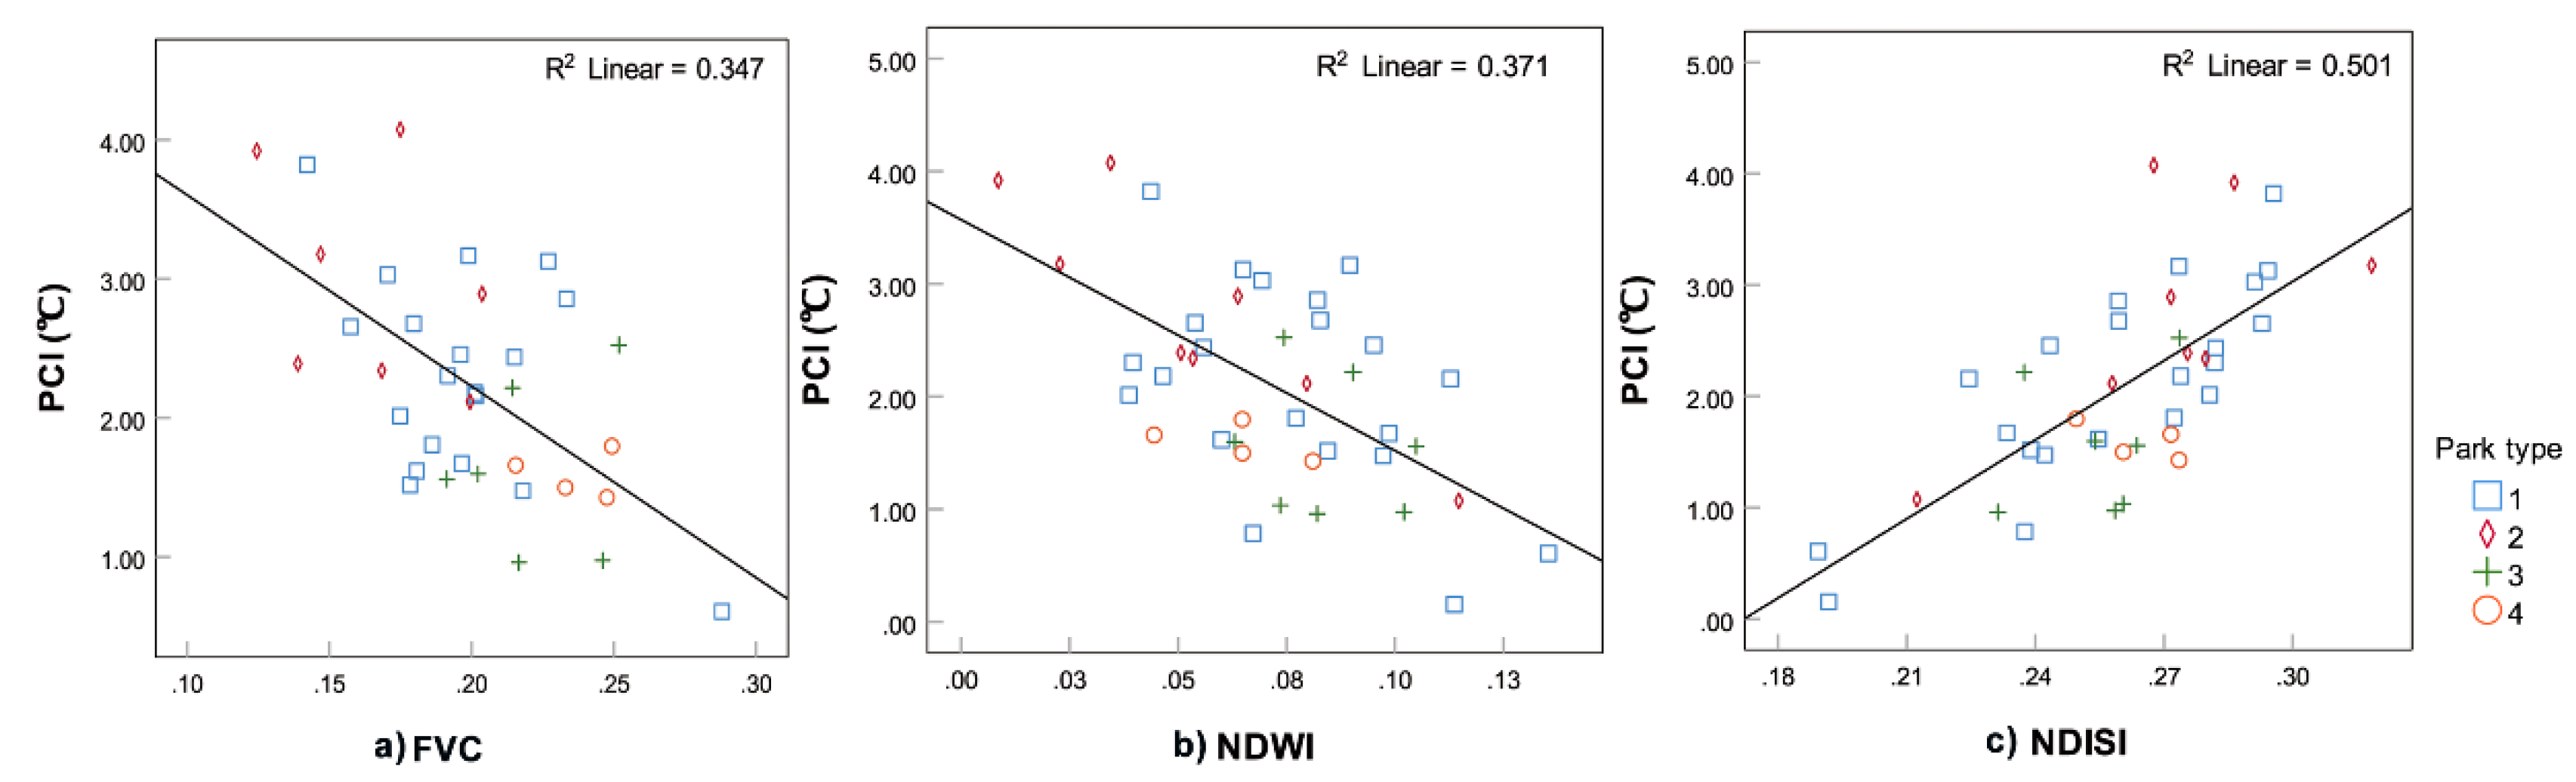
4.3. Relation between PCI and Its Impact Factor
5. Discussion
5.1. Impact Factors of PCI
5.2. Impact Factors of Park LST
5.3. Implications for Urban Planning and Landscape Design
- (1)
- In urban planning and design: increase the number of theme park types in the city, increase the park size and number in a new town/district planning;
- (2)
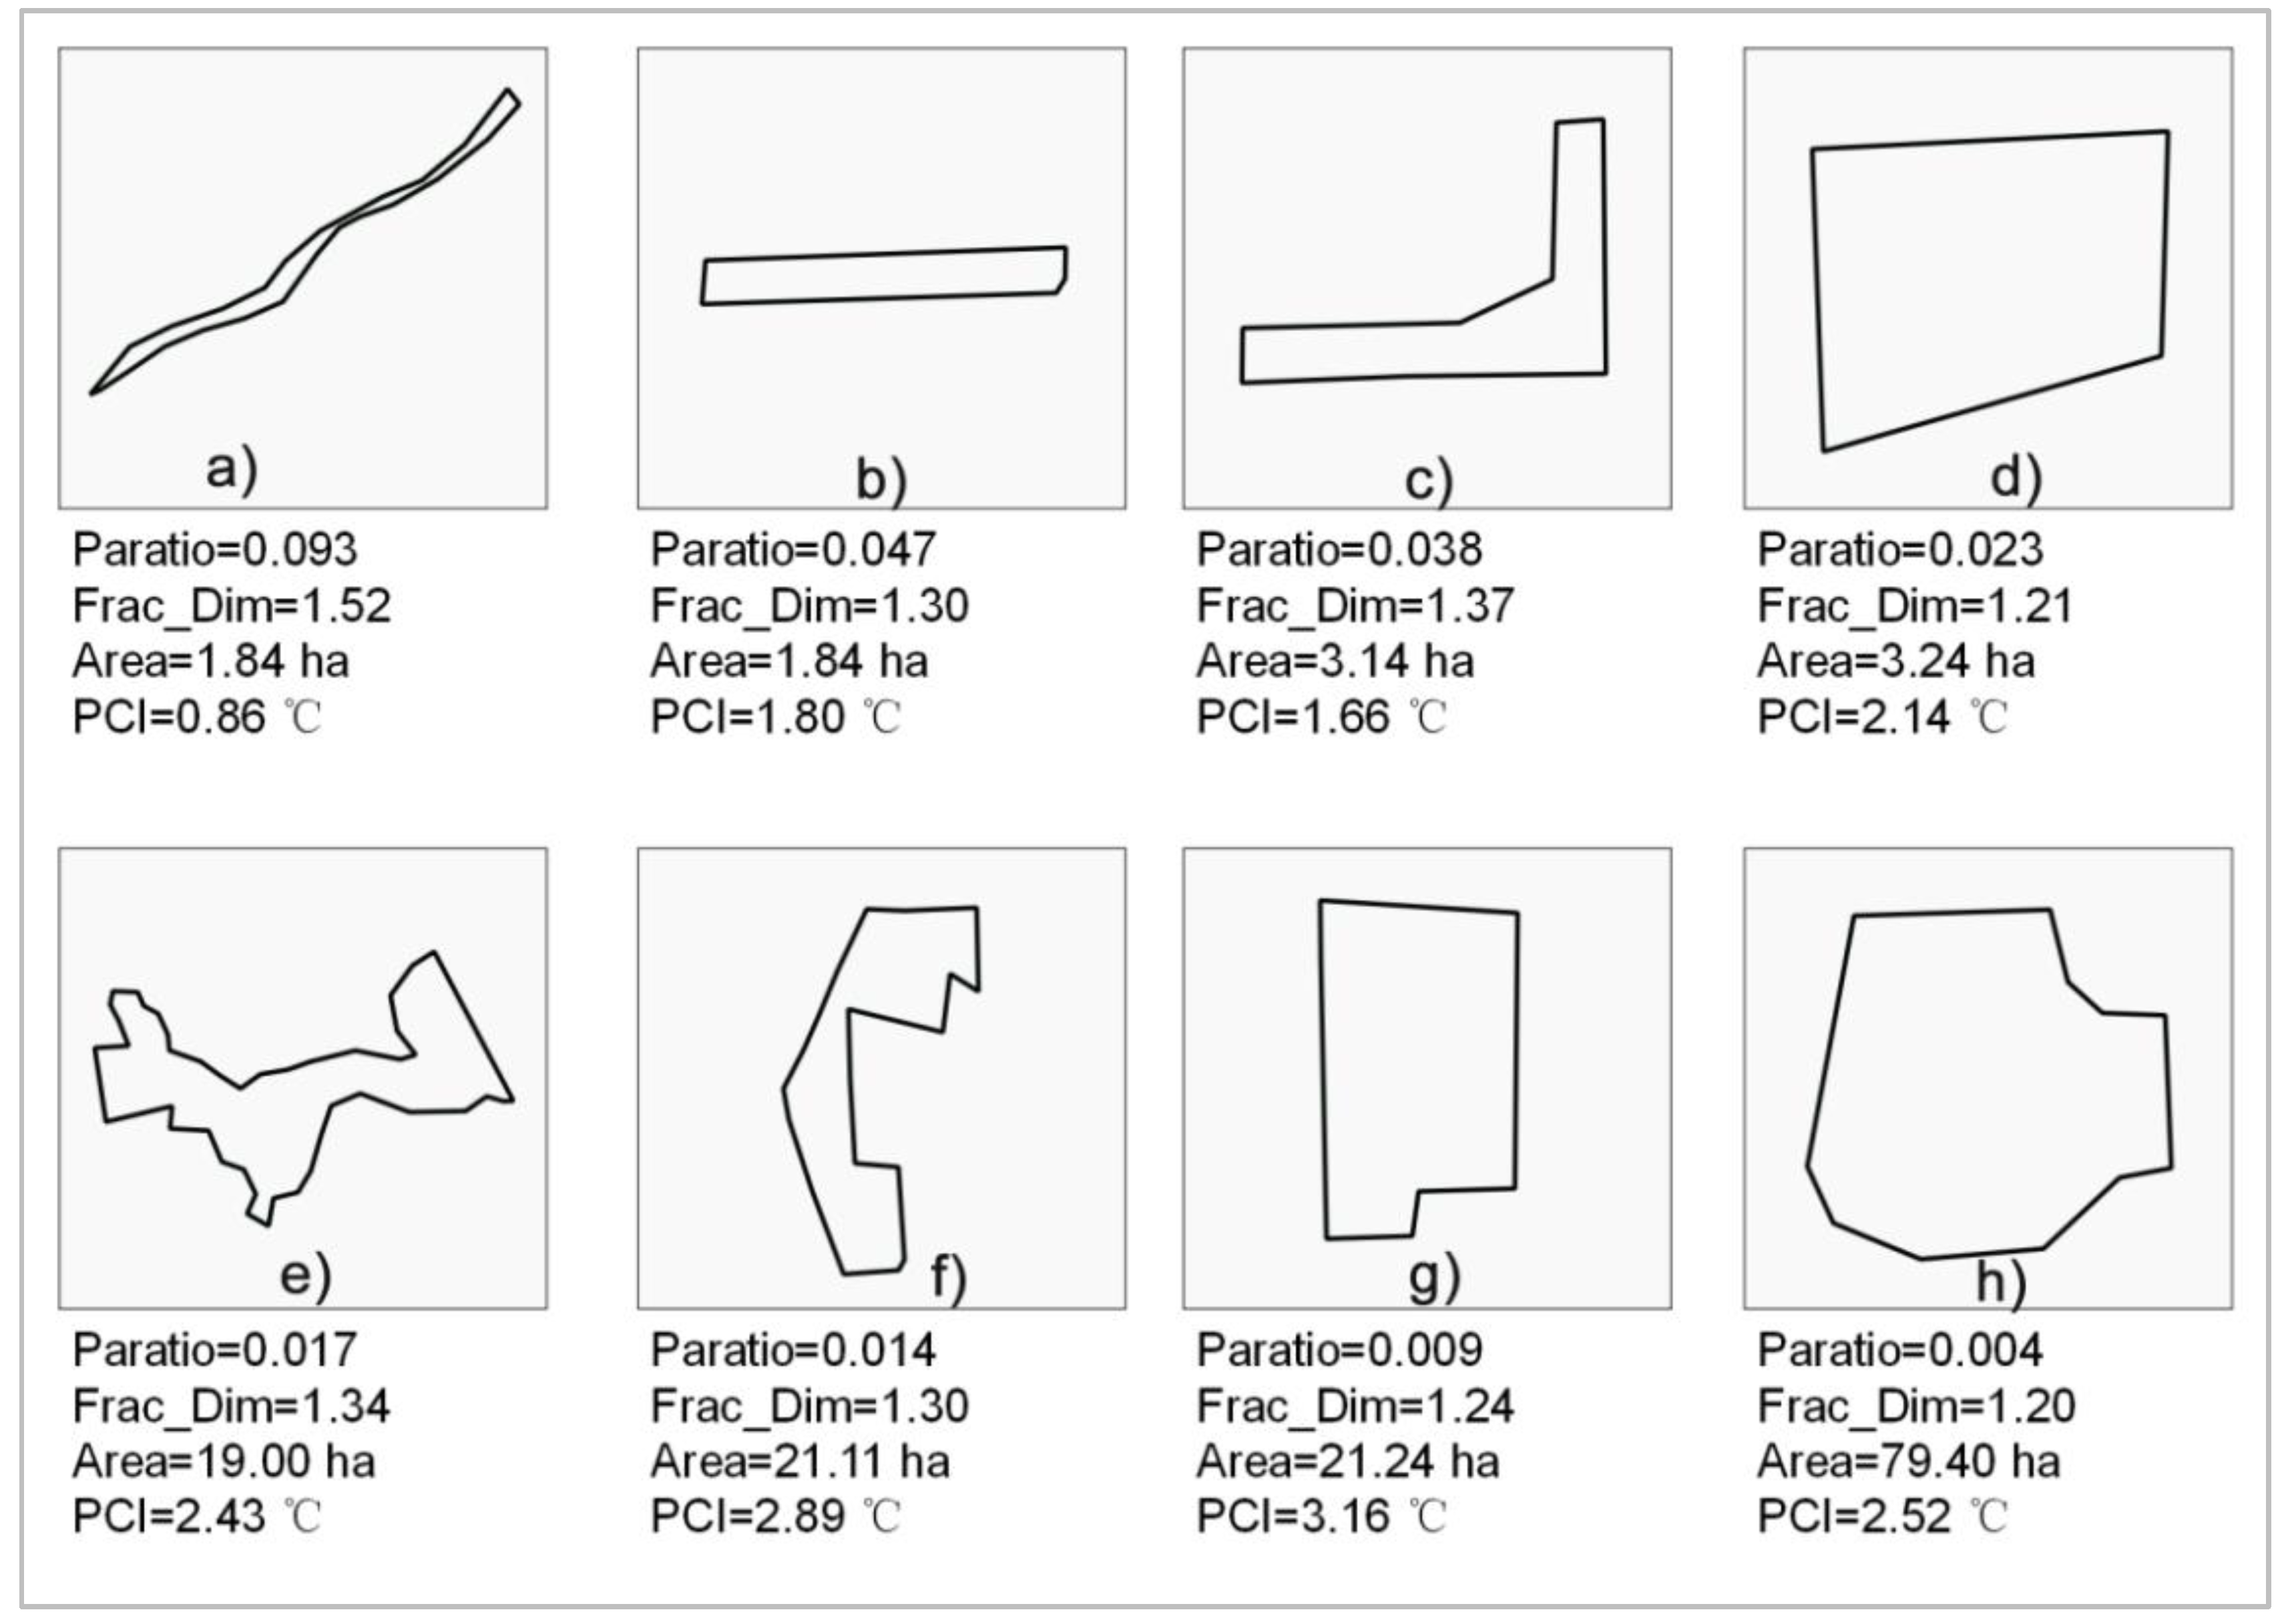
- In landscape design and renewal: increase the park size, plan more vegetation and water area in parks, as well as reduce the impervious surface. At the same time, in case we follow PCI aspect of decreasing UHI we could make the park shape less complex in site design with less curving boundaries and less waving edges (based on Frac_Dim), we can consider the options of lowering the perimeter area ratio of the park by designing compact layout (Figure 9). Of course, in urban planning and design there are many other aspects to be considered, such as existing ecological corridors, road network, residential areas, wind corridors, visual preferences;
- (3)
- Add more parks (green spaces) in the area within high impervious surface ratio, in central urban area, represented by tall buildings and impervious surfaces of commercial and built-up areas. In addition, increase the park type of high cooling effect such as theme parks and urban parks in Zhengzhou.
6. Conclusions
- (1)
- The characteristics of the park defined by its size, perimeter area ratio and fractal dimensions all affect the PCI directly. Because of these defining factors, there seems to be a positive correlation with FVC and NDWI, while NDISI has a negative impact on the PCI;
- (2)
- The PCI is influenced by the surrounding land cover types coupled with the type of vegetation cover and water coverage. Because of these surrounding influences, the PCI has a directly proportional relationship to the surrounding impervious surface cover. A park’s PCI has many factors to consider when understanding its mitigating effects on the UHI of its surrounding context. By first considering the factors that influence a park’s temperature, we can start to change the cooling properties which help mitigate the UHI effects seen throughout cities.
Author Contributions
Funding
Acknowledgments
Conflicts of Interest
References
- Howard, L. The Climate of London: Deduced from Meteorological Observations, Made at Different Places in the Neighbourhood of the Metropolis; W. Phillips: Cambridge, MA, USA, 1820; Volume 1. [Google Scholar]
- Oke, T.R. City size and the urban heat island. Atmos. Environ. 1973, 7, 769–779. [Google Scholar] [CrossRef]
- Stewart, I.D.; Oke, T.R.; Krayenhoff, E.S. Evaluation of the ‘local climate zone’ scheme using temperature observations and model simulations. Int. J. Climatol. 2014, 34, 1062–1080. [Google Scholar] [CrossRef]
- Deilami, K.; Kamruzzaman, M.D.; Liu, Y. Urban heat island effect: A systematic review of spatio-temporal factors, data, methods, and mitigation measures. Int. J. Appl. Earth Obs. Geoinf. 2018, 67, 30–42. [Google Scholar] [CrossRef]
- US EPA, O. Heat Island Effect. Available online: https://www.epa.gov/heat-islands (accessed on 17 October 2018).
- Yu, Z.; Guo, X.; Zeng, Y.; Koga, M.; Vejre, H. Variations in land surface temperature and cooling efficiency of green space in rapid urbanization: The case of Fuzhou city, China. Urban For. Urban Green. 2018, 29, 113–121. [Google Scholar] [CrossRef]
- Gray, G. EPA’s 2008 Report on the Environment; United States Environmental Protection Agency: Washington, DC, USA, 2008.
- Voogt, J.A.; Oke, T.R. Thermal remote sensing of urban climates. Remote Sens. Environ. 2003, 86, 370–384. [Google Scholar] [CrossRef]
- Oke, T.R. Boundary Layer Climates, 1st ed.; Taylor and Francis Group: New York, NY, USA, 1987. [Google Scholar]
- Yuan, F.; Bauer, M.E. Comparison of impervious surface area and normalized difference vegetation index as indicators of surface urban heat island effects in Landsat imagery. Remote Sens. Environ. 2007, 106, 375–386. [Google Scholar] [CrossRef]
- Li, J.; Song, C.; Cao, L.; Zhu, F.; Meng, X.; Wu, J. Impacts of landscape structure on surface urban heat islands: A case study of Shanghai, China. Remote Sens. Environ. 2011, 115, 3249–3263. [Google Scholar] [CrossRef]
- Mohamed, A.A.; Odindi, J.; Mutanga, O. Land surface temperature and emissivity estimation for Urban Heat Island assessment using medium- and low-resolution space-borne sensors: A review. Geocarto Int. 2017, 32, 455–470. [Google Scholar] [CrossRef]
- Jiang, J.; Tian, G. Analysis of the impact of Land use/Land cover change on Land Surface Temperature with Remote Sensing. Procedia Environ. Sci. 2010, 2, 571–575. [Google Scholar] [CrossRef] [Green Version]
- Zhao, H.; Ren, Z.; Tan, J. The Spatial Patterns of Land Surface Temperature and Its Impact Factors: Spatial Non-Stationarity and Scale Effects Based on a Geographically-Weighted Regression Model. Sustainability 2018, 10, 2242. [Google Scholar] [CrossRef] [Green Version]
- Kawashima, S.; Ishida, T.; Minomura, M.; Miwa, T. Relations between Surface Temperature and Air Temperature on a Local Scale during Winter Nights. J. Appl. Meteorol. 2000, 39, 1570–1579. [Google Scholar] [CrossRef]
- Doick, K.J.; Peace, A.; Hutchings, T.R. The role of one large greenspace in mitigating London’s nocturnal urban heat island. Sci. Total Environ. 2014, 493, 662–671. [Google Scholar] [CrossRef] [PubMed]
- Yan, H.; Wu, F.; Dong, L. Influence of a large urban park on the local urban thermal environment. Sci. Total Environ. 2018, 622–623, 882–891. [Google Scholar] [CrossRef] [PubMed]
- Yu, Z.; Xu, S.; Zhang, Y.; Jørgensen, G.; Vejre, H. Strong contributions of local background climate to the cooling effect of urban green vegetation. Sci. Rep. 2018, 8, 6798. [Google Scholar] [CrossRef] [PubMed]
- Lindén, J.; Fonti, P.; Esper, J. Temporal variations in microclimate cooling induced by urban trees in Mainz, Germany. Urban For. Urban Green. 2016, 20, 198–209. [Google Scholar] [CrossRef]
- Yahia, M.W.; Johansson, E.; Thorsson, S.; Lindberg, F.; Rasmussen, M.I. Effect of urban design on microclimate and thermal comfort outdoors in warm-humid Dar es Salaam. Tanzan. Int. J. Biometeorol. 2018, 62, 373–385. [Google Scholar] [CrossRef] [PubMed] [Green Version]
- Chatterjee, S.; Khan, A.; Dinda, A.; Mithun, S.; Khatun, R.; Akbari, H.; Kusaka, H.; Mitra, C.; Bhatti, S.S.; Doan, Q.V.; et al. Simulating micro-scale thermal interactions in different building environments for mitigating urban heat islands. Sci. Total Environ. 2019, 663, 610–631. [Google Scholar] [CrossRef]
- US EPA, O. Learn About Heat Islands. Available online: https://www.epa.gov/heat-islands/learn-about-heat-islands (accessed on 17 October 2018).
- Ng, E.; Chen, L.; Wang, Y.; Yuan, C. A study on the cooling effects of greening in a high-density city: An experience from Hong Kong. Build. Environ. 2012, 47, 256–271. [Google Scholar] [CrossRef]
- Rasul, A.; Balzter, H.; Smith, C.; Remedios, J.; Adamu, B.; Sobrino, J.; Srivanit, M.; Weng, Q. A Review on Remote Sensing of Urban Heat and Cool Islands. Land 2017, 6, 38. [Google Scholar] [CrossRef] [Green Version]
- Oliveira, S.; Andrade, H.; Vaz, T. The cooling effect of green spaces as a contribution to the mitigation of urban heat: A case study in Lisbon. Build. Environ. 2011, 46, 2186–2194. [Google Scholar] [CrossRef]
- Du, H.; Cai, W.; Xu, Y.; Wang, Z.; Wang, Y.; Cai, Y. Quantifying the cool island effects of urban green spaces using remote sensing Data. Urban For. Urban Green. 2017, 27, 24–31. [Google Scholar] [CrossRef]
- Cao, X.; Onishi, A.; Chen, J.; Imura, H. Quantifying the cool island intensity of urban parks using ASTER and IKONOS data. Landsc. Urban Plan. 2010, 96, 224–231. [Google Scholar] [CrossRef]
- Lin, W.; Yu, T.; Chang, X.; Wu, W.; Zhang, Y. Calculating cooling extents of green parks using remote sensing: Method and test. Landsc. Urban Plan. 2015, 134, 66–75. [Google Scholar] [CrossRef]
- Kawashima, S. Effect of vegetation on surface temperature in urban and suburban areas in winter. Energy Build. 1990, 15, 465–469. [Google Scholar] [CrossRef]
- Weng, Q.; Lu, D.; Schubring, J. Estimation of land surface temperature–vegetation abundance relationship for urban heat island studies. Remote Sens. Environ. 2004, 89, 467–483. [Google Scholar] [CrossRef]
- Chen, X.-L.; Zhao, H.-M.; Li, P.-X.; Yin, Z.-Y. Remote sensing image-based analysis of the relationship between urban heat island and land use/cover changes. Remote Sens. Environ. 2006, 104, 133–146. [Google Scholar] [CrossRef]
- Gartland, L. Heat Islands: Understanding and Mitigating Heat in Urban Areas; Earthscan: London, UK, 2008. [Google Scholar]
- Liu, H.; Weng, Q. Seasonal variations in the relationship between landscape pattern and land surface temperature in Indianapolis, USA. Environ. Monit. Assess. 2008, 144, 199–219. [Google Scholar] [CrossRef]
- Li, J.; Wang, X.; Wang, X.; Ma, W.; Zhang, H. Remote sensing evaluation of urban heat island and its spatial pattern of the Shanghai metropolitan area, China. Ecol. Complex. 2009, 6, 413–420. [Google Scholar] [CrossRef]
- Estoque, R.C.; Murayama, Y.; Myint, S.W. Effects of landscape composition and pattern on land surface temperature: An urban heat island study in the megacities of Southeast Asia. Sci. Total Environ. 2017, 577, 349–359. [Google Scholar] [CrossRef]
- Kolokotroni, M.; Giridharan, R. Urban heat island intensity in London: An investigation of the impact of physical characteristics on changes in outdoor air temperature during summer. Sol. Energy 2008, 82, 986–998. [Google Scholar] [CrossRef] [Green Version]
- Kato, S.; Hiyama, K. Ventilating Cities: Air-Flow Criteria for Healthy and Comfortable Urban Living; Springer Science & Business Media: Berlin, Germany, 2012. [Google Scholar]
- Kanda, M.; Moriizumi, T. Momentum and Heat Transfer over Urban-like Surfaces. Bound. Layer Meteorol. 2009, 131, 385–401. [Google Scholar] [CrossRef]
- Monteith, J.L.; Unsworth, M.H. Principles of Environmental Physics: Plants, Animals, and the Atmosphere, 4th ed.; Elsevier/Academic Press: Amsterdam, The Netherlands, 2013. [Google Scholar]
- Kotthaus, S.; Grimmond, C.S.B. Energy exchange in a dense urban environment-Part I: Temporal variability of long-term observations in central London. Urban Clim. 2014, 10, 261–280. [Google Scholar] [CrossRef] [Green Version]
- Min, M.; Zhao, H.; Miao, C. Spatio-Temporal Evolution Analysis of the Urban Heat Island: A Case Study of Zhengzhou City, China. Sustainability 2018, 10, 1992. [Google Scholar] [CrossRef] [Green Version]
- Wang, Z.; Mao, P.; Yang, H.; Zhao, Y.; He, T.; Dawson, R.J.; Li, Z. Measuring the Urban Land Surface Temperature Variations in Zhengzhou City Using the Landsat-Like Data. Available online: https://www.preprints.org/manuscript/201809.0192/v1 (accessed on 17 October 2018).
- Urban construction over the years-Zhengzhou Statistics Bureau. Available online: http://tjj.zhengzhou.gov.cn/ndsj/216688.jhtml (accessed on 17 October 2018).
- Mu, B.; Mayer, A.L.; He, R.; Tian, G. Land use dynamics and policy implications in Central China: A case study of Zhengzhou. Cities 2016, 58, 39–49. [Google Scholar] [CrossRef]
- Price, J.C. Estimating surface temperatures from satellite thermal infrared data—A simple formulation for the atmospheric effect. Remote Sens. Environ. 1983, 13, 353–361. [Google Scholar] [CrossRef]
- Zhou, J.; Li, J.; Zhang, L.; Hu, D.; Zhan, W. Intercomparison of methods for estimating land surface temperature from a Landsat-5 TM image in an arid region with low water vapour in the atmosphere. Int. J. Remote Sens. 2012, 33, 2582–2602. [Google Scholar] [CrossRef]
- Sekertekin, A. Validation of Physical Radiative Transfer Equation-Based Land Surface Temperature Using Landsat 8 Satellite Imagery and SURFRAD in-situ Measurements. J. Atmos. Sol. Terr. Phys. 2019, 196, 105161. [Google Scholar] [CrossRef]
- Sobrino, J.A.; Jimenez-Munoz, J.C. Minimum configuration of thermal infrared bands for land surface temperature and emissivity estimation in the context of potential future missions. Remote Sens. Environ. 2014, 148, 158–167. [Google Scholar] [CrossRef]
- Department of the Interior, U.S. Geological Survey Landsat 8 Data Users Handbook. Available online: https://www.usgs.gov/land-resources/nli/landsat/landsat-8-data-users-handbook (accessed on 17 October 2018).
- Carlson, T.N.; Ripley, D.A. On the relation between NDVI, fractional vegetation cover, and leaf area index. Remote Sens. Environ. 1997, 62, 241–252. [Google Scholar] [CrossRef]
- Spronken-Smith, R.A.; Oke, T.R. The thermal regime of urban parks in two cities with different summer climates. Int. J. Remote Sens. 1998, 19, 2085–2104. [Google Scholar] [CrossRef]
- Chang, C.-R.; Li, M.-H.; Chang, S.-D. A preliminary study on the local cool-island intensity of Taipei city parks. Landsc. Urban Plan. 2007, 80, 386–395. [Google Scholar] [CrossRef]
- Li, Y.; Zhang, H.; Kainz, W. Monitoring patterns of urban heat islands of the fast-growing Shanghai metropolis, China: Using time-series of Landsat TM/ETM+ data. Int. J. Appl. Earth Obs. Geoinf. 2012, 19, 127–138. [Google Scholar] [CrossRef]
- Leitao, A.B.; Miller, J.; Ahern, J.; McGarigal, K. Measuring Landscapes: A Planner’s Handbook; Island Press: Washington, DC, USA, 2012; ISBN 978-1-59726-772-4. [Google Scholar]
- Gao, B. NDWI—A normalized difference water index for remote sensing of vegetation liquid water from space. Remote Sens. Environ. 1996, 58, 257–266. [Google Scholar] [CrossRef]
- Kikon, N.; Singh, P.; Singh, S.K.; Vyas, A. Assessment of urban heat islands (UHI) of Noida City, India using multi-temporal satellite data. Sustain. Cities Soc. 2016, 22, 19–28. [Google Scholar] [CrossRef]
- Xu, H. Analysis of impervious surface and its impact on urban heat environment using the normalized difference impervious surface index (NDISI). Photogramm. Eng. Remote Sens. 2010, 76, 557–565. [Google Scholar] [CrossRef]
- Zhang, Y.; Odeh, I.O.A.; Ramadan, E. Assessment of land surface temperature in relation to landscape metrics and fractional vegetation cover in an urban/peri-urban region using Landsat data. Int. J. Remote Sens. 2013, 34, 168–189. [Google Scholar] [CrossRef]
- Han-qiu, X. A Study on Information Extraction of Water Body with the Modified Normalized Difference Water Index (MNDWI). J. Remote Sens. 2005, 9, 589–595. [Google Scholar]
- Bowen, I.S. The Ratio of Heat Losses by Conduction and by Evaporation from any Water Surface. Phys. Rev. 1926, 27, 779–787. [Google Scholar] [CrossRef] [Green Version]
- Jiang, Z.; Huete, A.R.; Chen, J.; Chen, Y.; Li, J.; Yan, G.; Zhang, X. Analysis of NDVI and scaled difference vegetation index retrievals of vegetation fraction. Remote Sens. Environ. 2006, 101, 366–378. [Google Scholar] [CrossRef]
- Xu, H. Modification of normalised difference water index (NDWI) to enhance open water features in remotely sensed imagery. Int. J. Remote Sens. 2006, 27, 3025–3033. [Google Scholar] [CrossRef]
- Sun, Z.; Wang, C.; Guo, H.; Shang, R. A Modified Normalized Difference Impervious Surface Index (MNDISI) for Automatic Urban Mapping from Landsat Imagery. Remote Sens. 2017, 9, 942. [Google Scholar] [CrossRef] [Green Version]
- Wang, Y.; Bakker, F.; de Groot, R.; Wörtche, H. Effects of urban green infrastructure (UGI) on local outdoor microclimate during the growing season. Environ. Monit. Assess. 2015, 187, 732. [Google Scholar] [CrossRef] [PubMed] [Green Version]
- Antoniadis, D.; Katsoulas, N.; Kittas, C. Simulation of schoolyard’s microclimate and human thermal comfort under Mediterranean climate conditions: Effects of trees and green structures. Int. J. Biometeorol. 2018, 62, 2025–2036. [Google Scholar] [CrossRef] [PubMed]


| Date | Path/Row | Band | Wavelength (μm) | Resolution (m) |
|---|---|---|---|---|
| 07 July 2019 | 124/36 | Band 1—Ultra Blue | 0.435–0.451 | 30 |
| Band 2—Blue (B) | 0.452–0.512 | 30 | ||
| Band 3—Green (G) | 0.533–0.590 | 30 | ||
| Band 4—Red (R) | 0.636–0.673 | 30 | ||
| Band 5—Near Infrared (NIR) | 0.851–0.879 | 30 | ||
| Band 6—Shortwave Infrared (SWIR) 1 | 1.566–1.651 | 30 | ||
| Band 7—Shortwave Infrared (SWIR) 2 | 2.107–2.294 | 30 | ||
| Band 10 *—Thermal Infrared (TIR) | 10.60–11.19 | 100 * (30) |
| Types | Number | Percentage | Maximal Area (ha) | Minimal Area (ha) | Main Example |
|---|---|---|---|---|---|
| Urban Park | 59 | 48% | 87.16 | 3.12 | City park, District park |
| Theme Park | 10 | 8% | 108.53 | 10.61 | Botanical garden, Zoo |
| Street Park | 28 | 23% | 25.26 | 1.23 | Pocket park, community park. |
| Linear Park | 19 | 15% | 62.02 | 2.13 | Riverside park, roadside park |
| Urban Square | 7 | 6% | 6.64 | 2.15 | Square |
| Name | Equation | Description |
|---|---|---|
| Perimeter-Area Ratio * | Pi = perimeter (m) of patch i. Ai = area (m2) of patch i. Paratio equals the ratio of the patch perimeter (m) to area (m2) [54]. | |
| Landscape Shape Index * | Landscape shape index provides a standardized measure of total edge or edge density that adjusts for the size of the landscape [54]. | |
| Fractal Dimension Index * | Fractal Dimension Index reflects the extent of shape complexity across a range of spatial scales [54]. |
| Name | Equation | Description |
|---|---|---|
| NDWI | Normalize Difference Water Index (NDWI) is a remote sensing based indicator sensitive to the open water surface and water content of leaves [55]. | |
| NDVI | Normalize Difference Vegetation Index (NDVI) is used o determine the density of green on a patch of land [10]. | |
| FVC* | The Fractional Vegetation Cover (FVC) is mainly depicts the vegetation abundance of ground surface [58]. | |
| MNDWI | Modified Normalize Difference Water Index (MNDWI) is an indicator used to determine the open water area [59]. | |
| NDISI | Normalize Difference Impervious Surface Index (NDISI) indicator is used to estimate impervious surface [57]. |
| Code | Type | Number | Mean LST (°C) | Max (°C) | Min (°C) | Average PCI (°C) |
|---|---|---|---|---|---|---|
| 1 | Urban park | 59 | 30.43 | 33.63 | 27.63 | 1.71 |
| 2 | Theme park | 10 | 30.01 | 34.62 | 25.97 | 2.76 |
| 3 | Street park | 28 | 31.32 | 37.80 | 25.34 | 0.8 |
| 4 | Linear park | 19 | 31.47 | 35.42 | 28.56 | 0.64 |
| 5 | Urban square | 7 | 32.13 | 33.90 | 31.10 | 1.44 |
| 6 | Zhengzhou city | - | 32.15 | 46.09 | 20.11 | - |
© 2020 by the authors. Licensee MDPI, Basel, Switzerland. This article is an open access article distributed under the terms and conditions of the Creative Commons Attribution (CC BY) license (http://creativecommons.org/licenses/by/4.0/).
Share and Cite
Li, H.; Wang, G.; Tian, G.; Jombach, S. Mapping and Analyzing the Park Cooling Effect on Urban Heat Island in an Expanding City: A Case Study in Zhengzhou City, China. Land 2020, 9, 57. https://doi.org/10.3390/land9020057
Li H, Wang G, Tian G, Jombach S. Mapping and Analyzing the Park Cooling Effect on Urban Heat Island in an Expanding City: A Case Study in Zhengzhou City, China. Land. 2020; 9(2):57. https://doi.org/10.3390/land9020057
Chicago/Turabian StyleLi, Huawei, Guifang Wang, Guohang Tian, and Sándor Jombach. 2020. "Mapping and Analyzing the Park Cooling Effect on Urban Heat Island in an Expanding City: A Case Study in Zhengzhou City, China" Land 9, no. 2: 57. https://doi.org/10.3390/land9020057