Article

How Effective Is Spatial Planning for Cropland Protection? An Assessment Based on Land-Use Scenarios

1
Land-Use Systems Group, Swiss Federal Research Institute WSL, Zürcherstrasse 111, 8903 Birmensdorf, Switzerland
2
Remote Sensing Group, Swiss Federal Research Institute WSL, Zürcherstrasse 111, 8903 Birmensdorf, Switzerland
*
Author to whom correspondence should be addressed.
Submission received: 30 December 2019 / Revised: 3 February 2020 / Accepted: 6 February 2020 / Published: 7 February 2020
(This article belongs to the Section Urban Contexts and Urban-Rural Interactions)

Abstract

:
Spatial planning plays an important role in cropland protection, but its effectiveness is often questioned in the face of ongoing urban and infrastructure growth. Moreover, methods to assess the effectiveness of spatial planning are lacking. In Switzerland, the revision of the national spatial planning act in 2014 was a new starting point for stricter prescriptions on urban development. We assessed whether the new regulations would better protect dedicated prime cropland from conversion to urban areas using land-use suitability models and land-use scenarios. The findings show that with the planning according to the revised planning act, the potential consumption of prime cropland for new urban areas is six times smaller than that occurring through extrapolation of the observed trend in urban development over the past 25 years. However, scenario modeling suggests that, still, more prime cropland will be converted into urban areas than necessary, and that it may be difficult to protect prime cropland to the extent mandated by the Swiss prime cropland protection policy. We have developed an approach to a priori evaluate spatial planning measures. However, the strict implementation of these planning measures will be needed in order to maintain prime cropland to a level required for agricultural self-sufficiency and food security.

1. Introduction

Traditionally, humans have settled in areas of high agricultural productivity, resulting in urban expansion leading to a continued loss of the most fertile soils [1]. Gardi et al. [2] calculated a current yield loss of 6 million tons of wheat per year due to urbanization in 19 EU member states. Considering the expected growth of the global population to up to 9 billion people in the next four decades, this land-take for urban development has severe consequences for food security [3,4,5,6,7]. Bren d’Amour et al. [8] estimate that future urban growth will entail a global cropland loss of 1.8%–2.4% by 2030, particularly on soils that are almost twice as productive as the global average.
Since the 1980s, urban area has expanded at a greater rate than ever before and has become far more dispersed [9,10,11]. From 2000 to 2006, there was a 3% increase in artificial surfaces in the EU 27 member-states, which is greater than the total population increase of 2%. This development led to a continuous rise in land-take per capita per year of approx. 2 m2 of additional artificial surface over this period [12].
Spatial planning was introduced in many European countries in the second half of the 20th century when urban regions began to grow rapidly. This planning largely focused on managing urban growth in a manner that optimizes city functionality and maintains public health, conservation of nature and land rent dynamics within publicly acceptable bounds [13,14]. Although there has been a decline in the growth rate of land-take in many European countries since 2000, policy makers often find that spatial planning is not effective enough to limit urban growth [12]. However, no one can say how the urban area of a given country would have developed in the absence of spatial planning legislation. In addition, evaluation of the implementation and results of spatial planning is rarely carried out in practice [15,16]. Some countries have introduced Strategic Environment Assessment (SEA), Integrated Assessment (IA) and Sustainability Impact Assessment (SIA) instruments for ex-ante evaluations of spatial planning regulations and their changes. As Lee [17] points out, definition of the reference baseline is the key challenge with these prospective assessment tools since assessment is not of the current state but of potential future states that would occur in the absence of the new spatial planning legislations. Simulation of potential future states by means of land-use scenarios offers a potential way to overcome this problem [18,19]. In addition, this approach makes the assessments reproducible and traceable [20]. In the recent past, a number of studies in land change science have developed sophisticated algorithms, e.g., cellular automata or artificial neural networks, to model land-use change and scenarios that can support planners in the preparation of spatial plans [21,22,23,24]. Urban development scenarios in particular have often been developed, e.g., for the Greater Dublin Region [25,26], for the Seoul metropolitan area [27], for the Beijing urban area [28], and for case studies in Mozambique [29].
Switzerland revised its national spatial planning act in 2014 and provided a new starting point for land-use planning. Moreover, Switzerland has a national prime cropland protection program, similar to China [30,31]. The most productive agricultural soils (mostly arable land) are designated as prime cropland areas and should not be built over [32]. However, a large amount of prime cropland area is located in the vicinity of urban areas, since settlements have traditionally been established close to fertile soils, and therefore further urban growth places increased pressure on prime cropland.
The Swiss case is an opportunity for an a priori assessment of the potential effectiveness of new planning regulations, where the potential loss of prime cropland, occurring when new planning legislation is implemented, serves as a measure of effectiveness / ineffectiveness. Our hypothesis is that the new planning legislation is effective in cropland protection, if land-take on prime cropland under the new legislation was smaller than the modeled prime cropland consumption in our land-use scenarios. We used land-use scenarios for the year 2035 for Switzerland developed by Price et al. [33]. We compared the potential increase in urban area with the estimates from current planning and calculated the probabilities of converting prime cropland into urban area. Four specific research questions were addressed:
i.
How much dedicated prime cropland might be converted to new construction zones by 2035?
ii.
To what extent can the loss of prime cropland to new construction zones be compensated through conversion of undeveloped areas within the current construction zones back to farmland?
iii.
Does the implementation of the revised spatial planning legislation have the potential to break the trend of urban sprawl observed since 1985?
iv.
Is the potential take of prime cropland up to 2035 in line with expected population growth?

2. Methods and Materials

2.1. Study Area

Switzerland is a land-locked country in the center of Europe, which is not part of the European Union (EU). The total surface area is 42,295 km2 and comprised of five bio-geographic regions: Central Plateau, Jura, Northern Alps, Central Alps and Southern Alps. Switzerland is a federation of 26 cantons that have strong political autonomy and can be considered equivalent to ‘states’. As in many federal countries, the competence for spatial planning rests at the state level, i.e., at the level of the cantons. The Confederation provides framework directives, one of which is the Federal Act on Spatial Planning enacted in 1979 with the primary goal of separating land for construction from land on which construction is prohibited. This act was revised substantially in 2014 resulting in stricter regulations for the development of new construction zones.
The aim of the Swiss national prime cropland protection program is to ensure food security for the Swiss population in times of crises and limited import. Prime cropland is defined as agricultural land with favorable climate and soil conditions for crop growth, i.e., cereals, maize or root crops. Further, the land should be suitable for management with modern agricultural machinery, i.e., the area must be coherent, at least 1 ha in size and with max. 18% inclination. All agricultural areas with the qualities mentioned above have to be assigned to prime cropland and should be protected against construction. In 1992, the Federal Council defined a minimum of 438,460 hectares of prime cropland area which must absolutely stay available for agriculture in order to feed the population in the case of a longer-term crisis [32].
Each canton must preserve a distinct quota of its best agricultural land (Figure 1). However, the cantons are responsible for the spatial allocation of the prime cropland areas. The total area assigned as prime cropland is estimated to amount to ca. 30% of the total agricultural area of Switzerland [32]. This still exceeds the mandatory minimum set by the Federal Council, but there are no uniform Swiss-wide data about the development of prime cropland areas covering the full period of the national cropland protection program which started in 1992. A Swiss-wide inventory of prime cropland was only recently facilitated due to increasing pressure on prime cropland areas from urbanization and advances in GIS technology [34]. The Swiss land-use statistics do not explicitly detail prime cropland, but they report a Swiss-wide loss of arable land of 29,510 ha or 6.8% from 1985 to 2009, with the strongest decreases observed in the densely populated urban regions. In the same period, the urban area grew by almost one quarter, 584 km2 [35].
The key planning instrument of the cantons is the comprehensive plan, which determines where new construction zones can be established and the location of prime cropland areas. The cantonal comprehensive plans define the outer limits of urban growth spatially. They also determine the maximum area that can be converted to construction zones within the subsequent 15 years, based on estimates of population and economic development. The extent of these potential future construction zones is usually far smaller than the perimeters of the outer limits of urban growth, and they are not defined spatially explicitly within the comprehensive plans. The municipalities determine which particular parcels will be assigned to construction zones in their zoning plans, but the total amount of new construction zones must not exceed the number defined in the cantonal comprehensive plan. Every 15 years, the cantons are required to revise their comprehensive plans and have them approved by the Federal Office of Spatial Development (FOSD). Due to the revision of the Federal Act on Spatial Planning, all cantons had to provide revised comprehensive plans in line with the new legislation by 2019. At the time of our study, not all cantons had submitted their revised comprehensive plans.

2.2. Data

Land-use data for Switzerland at the resolution of 1 ha were obtained from the Swiss land-use statistics [36]. These data are derived from aerial photographs and have been updated every 12 years. Data are available from three assessment time periods: 1979–1985, 1992–1997 and 2004–2009. The ‘current state’ for our modeling was the 2004–2009 data. Data describing the prime cropland allocation were provided by the Federal Office of Spatial Development (FOSD) and comprised the mandatory quota, the current amount in 2017 and its aerial extent for each canton, provided in shapefile format.
The current Swiss-wide standardized map of construction zones, which dates from 2012, was sourced from FOSD [37]. Data on the planned increase in new construction zones stem from the revised cantonal comprehensive plans, compiled by the FOSD. This dataset provides information on the total amount of new construction zones in each canton, but not their spatial location. For cantons that had not yet completed their revision processes at the time of this study, the FOSD provided estimates of new construction zones based on the Swiss Federal Statistics Office ‘high population growth’ scenario [38]. Although, the different datasets date from somewhat different points in time, each dataset is the most up-to-date version available standardized for the entire country. This spatial definition of the construction zones remained the current legal definition at the time of the study.

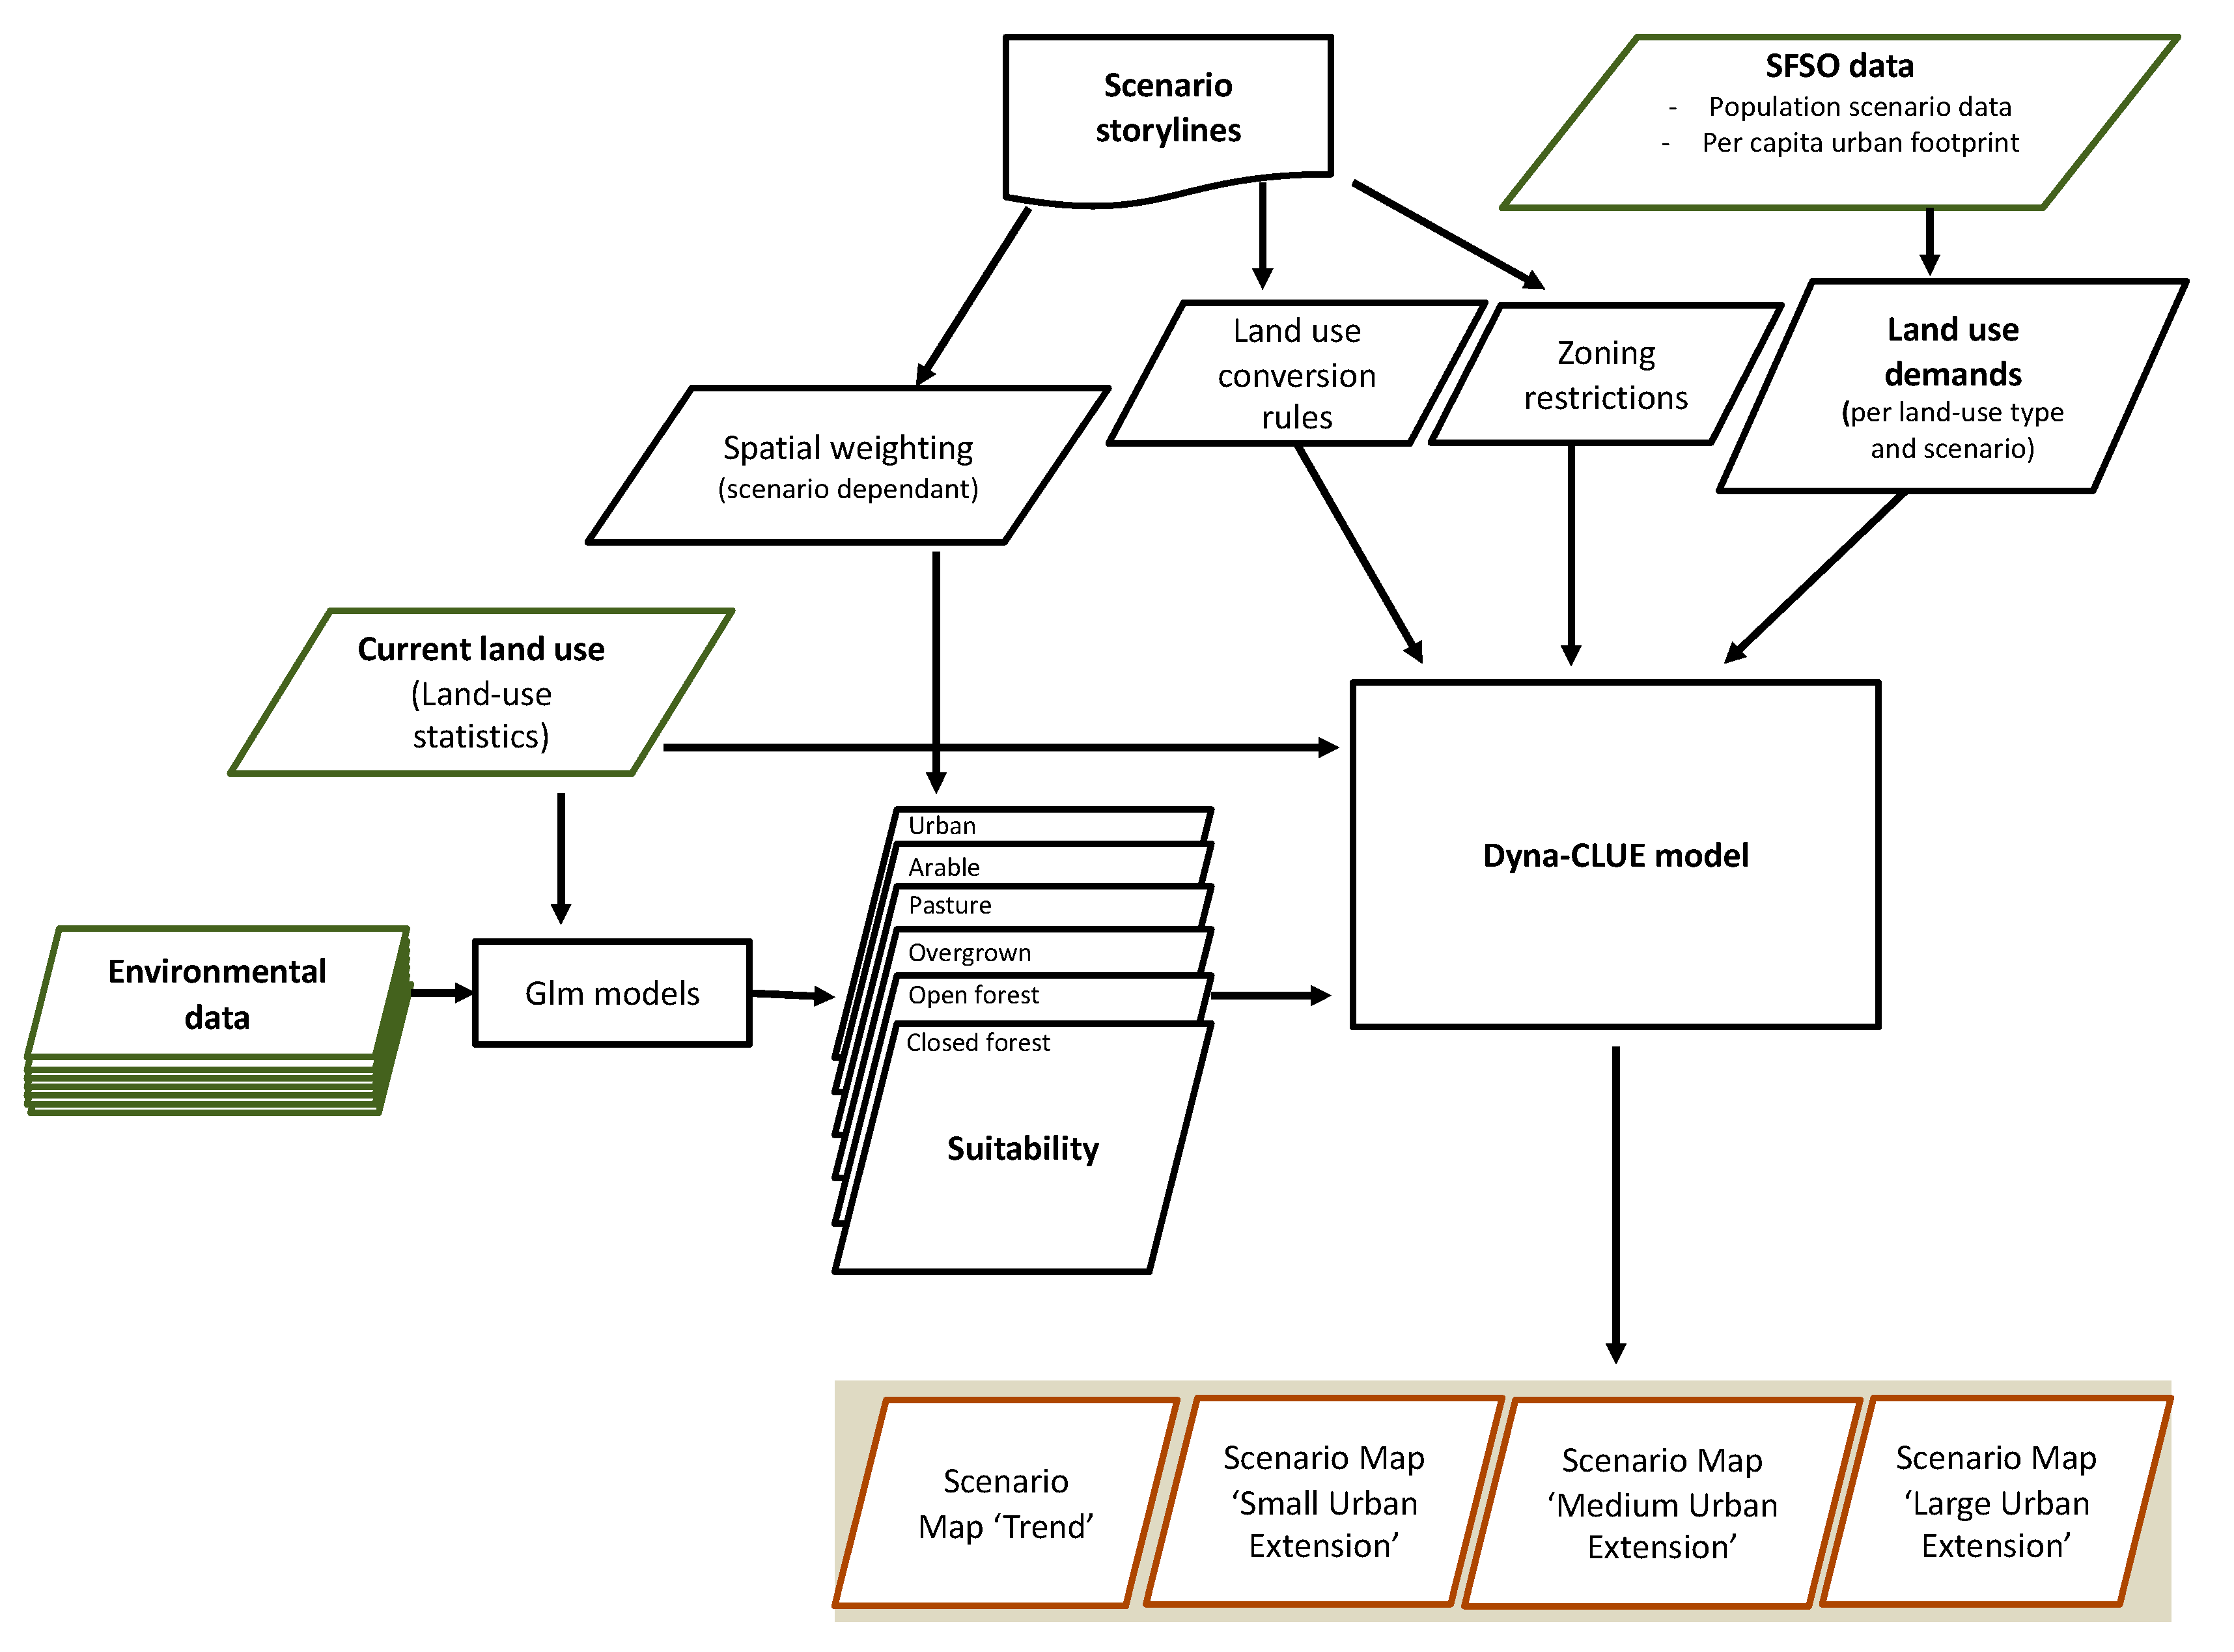
2.3. Spatial Modeling of Land-Use Suitability

The first two research questions were addressed with land use suitability models. These models were available for 6 coarse land-use types (urban areas, intensive (arable) agriculture, pasture agriculture, closed forest, open forest and overgrown areas) for Switzerland [33], where suitability for each land-use type has been modeled through a generalized linear modeling (glm) approach. In this approach random samples of the ‘current state’ of land-use from the Swiss land-use statistics [36] form the observation data. The models use 17 spatially explicit explanatory variables grouped into five main classes (for details see [33]): i) climate (continentality index and yearly moisture index in 1 ha resolution, average May precipitation in 1 km2 resolution, average March solar radiation in 1.25° minutes resolution), ii) topography (altitude above sea level, inclination; both in 1 ha resolution), iii) soil (suitability for agricultural management, permeability, stoniness; all vector data 1:200,000), iv) infrastructure/neighborhood (distance to forest in 1 ha resolution and to roads as vector data 1:25,000), v) socio-economic parameters (public transport accessibility in 1 ha resolution, percentage of residents working in the primary sector per municipality). The glm modeling resulted in a probability of occurrence map for each land-use type which was taken to be a proxy for suitability for each land-use type. The modeling was implemented at a 1-hectare spatial resolution for the five Swiss bio-geographic regions and then combined to form a whole of Switzerland suitability map for each land-use type. Model validation showed that the land change model was able to reproduce the observed land-use changes over the period 1985 to 2009 with a figure of merit of 0.902, where the figure of merit is the ratio of the proportion of correctly predicted pixels to the union of all observed changing pixels and predicted changing pixels [39]. A detailed description of the modeling can be found in [33] where the model was applied for land-use change simulations without considering spatial planning as a factor of land change.
Within the current study the focus is on the land-use types urban area and arable agricultural land. High suitability for arable land-use was generally predicted for areas of low elevation and gentle slopes (where topography allowed for mechanical management), and under climate and soil conditions favorable for crop growth. High suitability for urban land-use was predicted in areas with good public transport accessibility, proximity to roads and low inclination and elevations. Using the suitability models resulting from the glm modeling we identified the areas outside the current construction zones with a probability of urban land-use of at least 50%. We cut the Swiss-wide urban land-use suitability model to the area of each individual canton and allocated the amount of potential new construction zones, as defined in the cantonal comprehensive plans, pixel-wise (each pixel is 1 hectare) to areas outside of current constructions zones and without current ‘urban’ land-use iteratively to those pixels with the highest suitability for urban land-use according to the suitability model until the total amount stipulated in the comprehensive plan was allocated. Conversely, we identified the areas inside the current construction zones as having moderate and good suitability for prime cropland if they had a probability of arable agriculture occurrence of at least 50% and at least 75%, respectively.
We chose a rather low suitability threshold of 50% for urban land-use because urban development is also strongly driven by political decisions and not only according to physical suitability. On the other hand, the suitability for arable land-use is strongly influenced by natural properties and, therefore, we set a suitability threshold of 75% for potential prime cropland. However, in some regions, for example mountainous cantons, there is a very limited amount of land modelled as high suitability for arable land-use due to climatic or topographic conditions. Therefore, we also identified land moderately suitable for prime cropland as that with a probability of arable land-use of 50%.

2.4. Land-Use Scenarios

To answer the research questions (iii) and (iv) we used the land-use change scenarios developed by Price et al. [33] to identify the areas of prime cropland with a particular risk of conversion to urban areas by the year 2035. In these scenarios potential land-use change was determined with the spatially explicit land-use allocation modeling framework Dyna-CLUE [21]. Dyna-CLUE allocates land-use changes in a given area on the basis of the demand for a certain land-use, competition between land-use types, any planning or conversion restrictions and the land-use suitability of this area. Based on different storylines related to demographic, economic [36,38] and governance development, four scenarios had been drawn up along two trajectory axes: a globalization vs regionalization axis and an axis of market orientation versus a high degree of policy and planning intervention. They are related to the IPCC Special Report on Emission Scenarios (SRES). In addition, we modeled a Trend Scenario, which is a linear extrapolation of the observed land-use change trends 1985–2009. Figure 2 shows a flow chart of the modeling process; see [33] for more details on the scenario modeling.
In the present study, we were only interested in conversions into urban areas and used the scenarios to model different amounts of urban growth. We ignored one scenario (B1), in which there was no net population growth and the urban area increased only within the current undeveloped construction zones, since we are interested in the implications of the planned additions to construction zones. We also adapted the Trend Scenario to model it with no restrictions on the location of urban area with respect to the current construction zones. In the other three scenarios, urban growth occurs outside the current construction zones according to suitability for urban land-use, different assumptions of population growth and per capita urban demand. To model population growth, we used the Swiss Federal Statistical Office’s population growth scenarios [38]. The demand of urban area per capita was determined from the range of ‘current’ (2009) values observed across the cantons [36]. We modeled the following scenarios:
  • ‘small urban extension’: population growth from 2010 to 2035 of 12.5% related to 2010; urban area per capita of 407 m2;
  • ‘medium urban extension’: population growth from 2010 to 2035 of 12.5% related to 2010; urban area per capita of 407 m2 but with regionalization—urban growth targeting regional centers and outside of current centers;
  • ‘large urban extension’: population growth from 2010 to 2035 of 25.2% related to 2010; urban area per capita of 509 m2.

3. Results

3.1. Potential Consumption of Prime Cropland and Buffer for Compensation

Our first research question asked how much prime cropland might be converted into new construction zones according to the revised cantonal comprehensive plans. Comparison between the spatial model of urban land-use suitability and the prime cropland areas showed that in most cantons 10% to 30% of prime cropland area has at least a 50% suitability for urban land-use (Table 1). This result illustrates the general conflict between urban and arable land-use. Potential new construction zones could cover a total of 3908 ha of Switzerland’s prime cropland, which amounts to 60% of the current buffer of total prime cropland above the national quota given by the Federal Council (Table 1). The modeling results for Canton Zurich are not included in this calculation because spatial planning practice within Canton Zurich defines areas dedicated for potential urban development only outside the prime cropland areas, nevertheless these spatial data are included in the tables (cf. footnote in Table 1).
Under the assumption that new construction zones will be allocated to areas that are the most ‘suitable’ for urban land-use, the modeled allocation of potential new construction zones could lead to a considerable loss of prime cropland. Our results for modeled land-use suitability reveal that 10 out of 26 cantons could drop below their mandatory quota of prime cropland within the current planning period (Figure 3). Particularly the cantons Berne and Vaud, which contribute considerably to the national prime cropland quota, might drop well below their mandatory quota. Conflicts between current prime cropland and potential new construction zones are most likely to occur close to current urban areas and are most serious in the urban fringes of larger cities (Figure 4).
From a spatial planning point of view, the conversion of prime cropland to urban areas may be acceptable in specific cases, provided that the loss of prime cropland is compensated by conversion of undeveloped construction zones with high suitability for arable land-use to agricultural zones and then designating these areas prime cropland. Hence, our second research question addressed the availability of undeveloped areas within current construction zones with suitability for prime cropland. Most cantons can potentially utilize this compensation approach, since there are often considerable areas with at least 75% suitability for arable land within undeveloped areas of the construction zones (Table 1). This area equals 19,548 ha, over the whole of Switzerland, which is four times larger than the potential new construction zones on prime cropland, assuming assignment of new construction zones will be to the areas modeled as highest suitability. However, these undeveloped areas of construction zones with high arable suitability are usually small spatially dispersed patches (Figure 5). In practice, this kind of compensation for the loss of prime cropland would probably only be feasible to a very limited extent.

3.2. Current Planning vs. Scenarios of Urban Development

The third research question asked whether the implementation of the new spatial planning legislation, as intended in the cantonal comprehensive plans, would reduce land-take for urbanization compared to past observations. Extrapolating the trend of urban development between 1985 and 2009 until 2035 resulted in a far larger area of potential urban development outside the current construction zones than the area of planned new construction zones stipulated in the cantonal comprehensive plans (Table 2). The extrapolated trend of urban development on prime cropland is also far higher than the modeled conversion of prime cropland to potential new construction zones. According to the Trend Scenario, 45% of the new urban area in Switzerland could accrue on prime cropland. The modeled loss of prime cropland due to potential new construction zones, according to the cantonal comprehensive plans, equals only one sixth of prime cropland take resulting from the Trend Scenario.
In a fourth research question, we asked whether future land-take for urban development corresponded to the expected population development. This question is addressed through variation in the values of population growth and land-take per capita within the land-use scenario modeling (cf. Section 2.4). If a given area of prime cropland converted to urban areas in all three scenario models, it is considered at ‘high risk’ of urbanization, also because this conversion occurs even under assumptions of low population growth and moderate land-take per capita. An area of prime cropland is considered to be at moderate risk of urbanization if conversion to urban areas occurs in at least two of the scenarios (Table 2).
Across Switzerland, the prime cropland area at ‘high risk’ (conversion in three scenarios) of urbanization according to the scenarios amounts to only approximately 60% of the planned new construction zones (from cantonal comprehensive plans) that would occur on prime cropland assuming spatial allocation according to urban suitability modeling (Table 2). However, the area of prime cropland at ‘moderate risk’ of urbanization (conversion in at least two scenarios) is 4.4 times larger than the amount of the planned new construction zones that would occur on prime cropland assuming spatial allocation according to urban suitability modeling. In most cantons, the area of the potential new construction zones defined in their comprehensive plans that would occur on prime cropland (assuming spatial allocation of construction zones to areas modeled as most suitable) is also considerably larger than the area of prime cropland that is at ‘high risk’ of urbanization (conversion in three scenarios). This means that in most cantons the planning of new construction zones is not based on minimum assumptions for population growth and land-take per capita. Exceptions are Zurich (assuming no new construction zones on prime cropland as planned), Zug, Aargau, Ticino and Geneva. In these cantons, the potential land-take of prime cropland according to modeled suitability is smaller than the area of prime cropland at ‘high risk’ of urbanization. The prime cropland at high risk of being converted into urban area is mostly adjacent to current urban areas, as Figure 6 shows for the surroundings of the Swiss capital of Berne.

4. Discussion

Our results demonstrate that prime agricultural land is at high risk of being converted to urban areas not only in developing countries but also in industrialized countries such as Switzerland. According to our modeling, urban expansion may lead to a number of cantons falling below their mandated quota of prime cropland. Since human settlements have traditionally been located close to fertile soils and planning principles call for the allocation of new urban areas adjacent to the existing ones, this take of prime agricultural land for urban areas is an issue facing peri-urban areas worldwide [3,4,5,6,7]. There are associated risks to food security and the maintenance of a level of agricultural self-sufficiency, which is a policy goal in many countries [40] and should be mitigated with effective spatial planning policy. Schwaab et al. [41] developed an alternative scenario of urban growth that minimizes consumption of productive agricultural soils for a number of Swiss municipalities. However, this scenario allocates the new urban areas at larger distances from the traditional village centers and results in a less compact urban pattern, the implementation of which may not be realistic in practice. The authors further underline that with increasing demand for new residential areas the loss of productive agricultural soils increases as soon as the soils of lower agricultural productivity are used up for residential areas. Hence, the key to safeguard fertile soils remains a restrictive assignment of new urban areas.
We demonstrate how prime cropland lost to new construction zones may be partly compensated by re-assigning unbuilt areas of current construction zones to agricultural areas. This compensation can be the basis of an exchange market of the prime cropland quota and development rights between urban and rural areas; a practice already implemented in some Chinese provinces. Rural regions generate new prime cropland by converting undeveloped construction zones or through land consolidation, and sell their new prime cropland quota to urban regions which then gain the opportunity to convert more prime cropland to urban area [30,31]. A similar exchange market was established in the US with tradeable development rights (TDR) [42,43]. As several Swiss cantons face serious difficulties maintaining their mandatory quota of prime cropland, there is an increasing political interest in compensating for the loss of prime cropland in one canton by assigning additional prime cropland areas in another canton [44]. Our results indicate the potential of such trans-cantonal compensation actions. However, there are several challenges with establishing this kind of exchange market in Switzerland. First, the areas of prime cropland quality are usually small and scattered across unbuilt construction zones (Figure 5). Second, soil and climate conditions differ strongly between cantons, particularly between mountainous and lowland cantons, which should be considered in the exchange market. Third, there is a risk of extensive development in urban regions if there are no explicit areas protected from development. These challenges have also been observed with the TDR market [42] and, therefore, Tan and Beckmann [43] recommend determining distinct regions where TDRs (and prime cropland quota) can be traded.
With the scenario modeling and land-use suitability approach, we developed a method to compare the potential performance of spatial plans with past urbanization trends. Unlike the case studies for single urban areas mentioned in the introduction [25,26,27,28,29], our model can be applied for a whole country including its urban and rural areas. Our results show that if new construction zones are located in the areas modeled as most suitable, the potential consumption of prime cropland will be much lower under the comprehensive plans than a continuation of the observed trend. Hence, the changes to spatial planning legislation could be considered to be successfully implemented in the cantonal comprehensive plans. It should be noted, however, that the Trend land-use change scenario extrapolates the observed changes of the total urban area including areas of infrastructure and agricultural buildings outside the construction zones. The urban area will probably increase to a larger extent than the planned new construction zones, even if the cantonal comprehensive plans are strictly implemented. However, the differences between the Trend Scenario and the planned new construction zones are large and we can assume that, with implementation of the comprehensive plans, the growth rate of urban areas should decrease in the future in Switzerland compared to past development.
Examining the scenario modeling results and making a comparison across scenarios allows us to identify areas which are at high risk of urban land-take. While it is unlikely that any of the scenarios would be realized exactly as modeled, they represent generally feasible land-use outcomes under a range of development trajectories. Areas which undergo the same kind of land-use change under multiple scenarios are likely more at risk of that change occurring. In most cantons the area of prime cropland at ‘high risk’ of consumption, as indicated by urbanization in three scenarios, is much lower than the area converted under the comprehensive plan when new construction zones are allocated according to urban suitability. In only five cantons is the area of prime cropland modeled as at ‘high risk’ of conversion larger than the potential uptake following the comprehensive plans and allocation of construction zones according to modeled urban suitability. These cantons probably developed their comprehensive plans under the assumption of lower land-take per capita than we used in our modeling and will have to absorb part of their growing population by upgrading existing construction zones and through infill development. Hence, our approach allows to assess how the spatial planning regulations are implemented in different regions. It particularly identifies regions that could contribute more to prime cropland protection by planning more compact urban development than they have in the past.
There are, however, a number of limitations to this study. First, our estimates of the area of prime cropland that will be converted under the planned extensions of the construction zones assume that the locations of any new constructions will be according to the highest suitability for urban land-use. In practice this assumption may not be realistic as there are a number of political, financial, social or other factors that could define the location of new construction zones. Second, our models are based on soil data of a rough resolution at a small scale. In practice, particularly the suitability of unbuilt current construction zones for prime cropland has to be approved by detailed large-scale (1:5000) soil mapping campaigns. Third, when comparing the modeled allocation of new construction zones with the extrapolated trend of urban expansion, it should be noted that an extrapolation of past trends of land-use change does not address causal relationships. This makes it generally difficult to assess the effectiveness of planning [22]. Finally, our assumptions of population growth and land-take per capita, which form the basis of our land-use scenarios, are probably not the same as the cantons made when they designed their new comprehensive plans. This holds certainly true for the five cantons where we overestimated the prime cropland area at high risk of being converted into urban area.
Land use change scenarios such as those used in this study allow the incorporation of existing and potential policy interventions and ex-ante exploration of the consequences. Spatially explicit models of such scenarios are therefore key land change science tools that allow policy makers and land managers to understand potential trajectories of change and to manage uncertainty and anticipate change [45]. Nevertheless, there are drawbacks to the land use scenarios modelling approach, not least in that their very ability to incorporate uncertainty is an aspect that can make them unpalatable to policy makers, who may then disregard the uncertainty and focus only on a narrow set of the results. In addition, observed past changes and policies are not necessarily a blueprint for future changes, and as such it is difficult to produce realistic results for the future [45].

5. Conclusions

In this paper, we demonstrated a way to use land-use scenarios for policy evaluation; a field that should be further developed in land change science [18,19]. The land-use scenarios applied in this study are freely available and based on open data which simplifies their application and comprehensibility for use in evidence-based decision-making in planning practice [17,20]. Using land-use scenarios has the particular advantage that the consequences of potential planning decisions can be visualized and the efficacy of planning instruments can be evaluated [26]. In this study, we emphasized the potential loss of dedicated prime cropland due to future urban development according to the revised Swiss spatial planning act. Compared to the growth trend of the urban area over the past 25 years, we can say that the new planning legislation is effective in reducing the growth rate of urban areas. However, compared to the scenarios of population growth and land-take per capita, the new planning legislation is still not as efficient as it should be, since most cantons still plan to convert a larger area to construction zones than the minimum necessary. Finally, it has to be noted that assigning prime cropland areas according to the Swiss prime cropland protection program itself has been an important pillar of cropland protection [46]. Huang et al. [47] also showed for China that the Prime Farmland Protection Policy successfully contributed to protect cropland against urban development around Beijing. Aside from restrictive urban growth policies, such national cropland protection programs will gain importance in view of the expected global increase in urban areas on the most fertile soils [8].

Author Contributions

Conceptualization, S.T. and B.P.; Methodology, S.T. and B.P.; Formal Analysis, B.P.; Data Curation, B.P.; Writing—Original Draft Preparation, S.T.; Writing—Review and Editing, B.P. and S.T.; Visualization, B.P.; Project Administration, S.T.; Funding Acquisition, S.T. All authors have read and agreed to the published version of the manuscript.

Funding

This research was funded by the Swiss Federal Office of Spatial Development (FOSD).

Acknowledgments

The authors thank the three anonymous reviewers for their valuable comments to a previous version of the manuscript.

Conflicts of Interest

The authors declare no conflict of interest.

References

  1. Ceccarelli, T.; Bajocco, S.; Salvati, L.; Perini, L. Investigating syndromes of agricultural land degradation through past trajectories and future scenarios. Soil Sci. Plant Nutr. 2014, 60, 60–70. [Google Scholar] [CrossRef] [Green Version]
  2. Gardi, C.; Panagos, P.; Van Liedekerke, M.; Bosco, C.; De Brogniez, D. Land-take and food security: Assessment of land-take on the agricultural production in Europe. J. Environ. Plann. Manag. 2014, 58, 898–912. [Google Scholar] [CrossRef]
  3. Döös, B.R. Population Growth and Loss of Arable Land. Glob. Environ. Chang. 2002, 12, 303–311. [Google Scholar] [CrossRef]
  4. Godfray, H.C.J.; Beddington, J.R.; Crute, J.I.; Haddad, L.; Lawrence, D.; Muir, J.F.; Pretty, J.; Robinson, S.; Thomas, S.; Toulmin, C. Food security: The challenge of feeding 9 billion people. Science 2010, 327, 812–818. [Google Scholar] [CrossRef] [PubMed] [Green Version]
  5. Foley, J.A.; Ramankutty, N.; Brauman, K.A.; Cassidy, E.S.; Gerber, J.S.; Johnston, M.; Mueller, N.D.; O’Connell, C.; Ray, D.K.; West, P.C.; et al. Solutions for a cultivated planet. Nature 2011, 478, 337–342. [Google Scholar] [CrossRef] [PubMed] [Green Version]
  6. Gregory, P.J.; George, T.S. Feeding nine billion: The challenge to sustainable crop production. J. Exp. Bot 2011, 62, 5233–5239. [Google Scholar] [CrossRef] [Green Version]
  7. Seto, K.S.; Ramankutty, N. Hidden linkages between urbanization and food systems. Science 2016, 352, 943–945. [Google Scholar] [CrossRef]
  8. Bren d’Amour, C.; Reitsma, F.; Baiocchi, G.; Barthel, S.; Güneralp, B.; Erb, K.-H.; Creutzig, F.; Seto, K.C. Future urban land expansion and implications for global croplands. Proc. Natl. Acad. Sci. USA 2017, 114, 8939–8944. [Google Scholar] [CrossRef] [Green Version]
  9. Hammer, R.B.; Stewart, S.I.; Winkle, R.L.; Radeloff, V.C.; Voss, P.R. Characterizing dynamic spatial and temporal residential density patterns from 1940–1990 across the North Central United States. Landsc. Urban. Plan. 2004, 69, 183–199. [Google Scholar] [CrossRef]
  10. Kasanko, M.; Barredo, J.I.; Lavalle, C.; McCormick, N.; Demicheli, L.; Sagris, V.; Brezger, A. Are European cities becoming dispersed? A comparative analysis of 15 European urban areas. Landsc. Urban. Plan. 2006, 77, 111–130. [Google Scholar] [CrossRef]
  11. EEA. Urban Sprawl in Europe; EEA: Copenhagen, Denmark, 2006. Available online: https://www.eea.europa.eu/publications/eea_report_2006_10 (accessed on 1 February 2020).
  12. Prokop, G.; Jobstmann, H.; Schönbauer, A. Overview of Best Practices for Limiting Soil Sealing or Mitigating Its Effects in EU–27; European Communities: Brussels, Belgium, 2011; p. 227. Available online: https://publications.europa.eu/en/publication-detail/-/publication/c20f56d4-acf0-4ca8-ae69-715df4745049. (accessed on 11 November 2014).
  13. Newman, P.; Thornley, A. Urban. Planning in Europe; Routledge: London, UK, 1996. [Google Scholar] [CrossRef]
  14. Janssen-Jansen, L. Taking national planning seriously: A challenged planning agenda in The Netherlands. Administration 2016, 64, 23–43. [Google Scholar] [CrossRef] [Green Version]
  15. Oliveira, V.; Pinho, P. Evaluation in Urban Planning: Advances and Prospects. J. Plan. Lit. 2010, 24, 343–361. [Google Scholar] [CrossRef]
  16. Oliveira, E.; Hersperger, A.M. Disentangling the governance configurations of strategic spatial plan-making in European urban regions. Plan. Pract. Res. 2019, 34, 47–61. [Google Scholar] [CrossRef]
  17. Lee, N. Bridging the gap between theory and practice in integrated assessment. Environ. Impact Asses 2006, 26, 57–78. [Google Scholar] [CrossRef] [Green Version]
  18. Turner, B.L.; Lambin, E.F.; Reenberg, A. The emergence of land change science for global environmental change and sustainability. Proc. Natl. Acad. Sci. USA 2007, 104, 20666–20671. [Google Scholar] [CrossRef] [Green Version]
  19. Nielsen, J.Ø.; Bremond, A.; Chowdhury, R.; Friis, C.; Metternicht, G.; Meyfroidt, P.; Muroe, D.; Pascual, U.; Thomson, A. Toward a normative land system science. Curr. Opin. Environ. Sustain. 2019, 38, 1–6. [Google Scholar] [CrossRef]
  20. Koomen, E.; Koekoek, A.; Dijk, E. Simulating Land-use Change in a Regional Planning Context. Appl. Spat. Anal. 2011, 4, 223–247. [Google Scholar] [CrossRef] [Green Version]
  21. Verburg, P.H.; Overmars, K.P. Combining top-down and bottom-up dynamics in land-use modeling: Exploring the future of abandoned farmlands in Europe with the Dyna-CLUE model. Landsc. Ecol. 2009, 24, 1167–1181. [Google Scholar] [CrossRef]
  22. Koomen, E.; Rietveld, P.; de Nijs, T. Modelling land-use change for spatial planning support. Ann. Reg. Sci 2008, 42, 1–10. [Google Scholar] [CrossRef] [Green Version]
  23. Lu, Y.; Laffan, S.; Pettit, C.; Cao, M. Land-use change simulation and analysis using a vector cellular automata (CA) model: A case study of Ipswich City, Australia. Environ. Plan. B 2019. [Google Scholar] [CrossRef]
  24. Bugday, E.; Erkan Bugday, S. Modeling and simulating land-use/cover change using artificial neural network from remote sensing data. CERNE 2019, 25. [Google Scholar] [CrossRef]
  25. Petrov, L.O.; Shahumyan, H.; Williams, B.; Convery, S. Scenarios and Indicators Supporting Urban Regional Planning. Procedia Soc. Behav. Sci. 2011, 21, 243–252. [Google Scholar] [CrossRef] [Green Version]
  26. Shahumyan, H.; Williams, B.; Petrov, L.; Foley, W. Regional Development Scenario Evaluation through Land-use Modelling and Opportunity Mapping. Land 2014, 3, 1180–1213. [Google Scholar] [CrossRef] [Green Version]
  27. Choi, H.-S.; Lee, G.-S. Planning Support Systems (PSS)-Based Spatial Plan Alternatives and Environmental Assessment. Sustainability 2016, 8, 286. [Google Scholar] [CrossRef] [Green Version]
  28. Han, H.; Yang, C.; Song, J. Scenario simulation and the prediction of land-use and land cover change in Beijing, China. Sustainability 2015, 7, 4260–4279. [Google Scholar] [CrossRef] [Green Version]
  29. Geneletti, D. Environmental assessment of spatial plan policies through land-use scenarios. A study in a fast-developing town in Mozambique. Environ. Impact Assess. 2012, 32, 1–10. [Google Scholar] [CrossRef]
  30. Wang, H.; Tao, R.; Wang, L.; Su, F. Farmland preservation and land development rights trading in Zhejiang, China. Habitat Int. 2010, 34, 454–463. [Google Scholar] [CrossRef]
  31. Chien, S.-S. Local farmland loss and preservation in China: A perspective of quota territorialisation. Land Use Policy 2015, 49, 65–74. [Google Scholar] [CrossRef]
  32. Federal Judiciary and Police Department, Federal Office of Spatial Planning, Federal Department of National Economy, Federal Office of Agriculture. Sectorial Plan of Cropland Protection; Planning Materials; FAO: Rome, Italy, 1992; p. 231. Available online: https://www.are.admin.ch/are/de/home/raumentwicklung-und-raumplanung/strategie-und-planung/konzepte-und-sachplaene/sachplaene-des-bundes/sachplan-fruchtfolgeflaechen-sp-fff.html (accessed on 20 October 2017).
  33. Price, B.; Kienast, F.; Seidl, I.; Ginzler, C.; Verburg, P.H.; Bolliger, J. Future landscapes of Switzerland: Risk areas for urbanization and land abandonment. Appl. Geogr. 2015, 57, 32–41. [Google Scholar] [CrossRef]
  34. Messer, M.A.; Bonriposi, M.; Chenal, J.; Hasler, S.; Niederoest, R. Management of the Best Agricultural Areas in Switzerland; CEAT: Lausanne, Switzerland, 2016; p. 118. Available online: https://pdfs.semanticscholar.org/986c/1b66d0be0cbd4df66aeb6ecf5c7298c64237.pdf (accessed on 28 February 2018).
  35. SFSO Swiss Federal Statistical Office. Land-use in Switzerland: Results of the Swiss Land-Use Statistics; SFSO: Neuchatel, Switzerland, 2013. Available online: https://www.bfs.admin.ch/asset/en/002-0904 (accessed on 2 February 2020).
  36. SFSO Swiss Federal Statistical Office. STAT-TAB: The Interactive Statistic Database 2013. Accessed 10 July 2013. Available online: https://www.bfs.admin.ch/bfs/en/home.html (accessed on 2 February 2020).
  37. FOSD Federal Office of Spatial Development. Statistics of Construction Zones 2012. Available online: https://www.are.admin.ch/are/en/home/media-and-publications/publications/fundamentals/bauzonenstatistik-schweiz-2012.html (accessed on 20 July 2017).
  38. SFSO Swiss Federal Statistical Office. Scenarios of Population Development in Switzerland 2010 to 2060; Statistics Switzerland, SFSO: Neuchatel, Switzerland, 2010. Available online: https://www.bfs.admin.ch/bfs/en/home/fso/swiss-federal-statistical-office.html (accessed on 2 February 2020).
  39. Pontius, R.; Boersma, W.; Castella, J.; Clarke, K.; de Nijs, T.; Dietzel, C.; Duan, Z.; Fotsing, E.; Goldstein, N.; Kok, K.; et al. Comparing the input, output, and validation maps for several models of land change. Ann. Reg. Sci. 2008, 42, 11e37. [Google Scholar] [CrossRef] [Green Version]
  40. Kopainsky, B.; Le, Q.B.; Spörri, A. Resilience in Food Value Chains. Feasibility Study; Report to the World Food System Center ETH Zurich; Flury&Giuliani GmbH/ETH Zürich: Zürich, Switzerland, 2013; Available online: https://www.zef.de/uploads/tx_zefportal/Publications/qle_download_Kopainsky_Le_Spoeri_2014.pdf. (accessed on 1 February 2018).
  41. Schwaab, J.; Deb, K.; Goodman, E.; Lautenbach, S.; van Strien, M.; Grêt-Regamey, A. Reducing the loss of agricultural productivity due to compact urban development in municipalities of Switzerland. Comput. Environ. Urban 2017, 65, 162–177. [Google Scholar] [CrossRef]
  42. Fang, L.; Howland, M.; Kim, J.; Peng, Q.; Wu, J. Can transfer of development rights programs save farmland in metropolitan counties? Growth Chang. 2019, 50, 926–946. [Google Scholar] [CrossRef]
  43. Tan, R.; Beckmann, V. Diversity of practical quota systems for farmland preservation: A multicountry comparison and analysis. Environ. Plan. C 2010, 28, 211–224. [Google Scholar] [CrossRef]
  44. DETEC Federal Department of Environment, Transportation, Energy and Communication. Revision of the Sectorial Plan of Cropland Protection; DETEC: Berne, Switzerland, 2018. Available online: https://www.are.admin.ch/are/de/home/raumentwicklung-und-raumplanung/strategie-und-planung/konzepte-und-sachplaene/sachplaene-des-bundes/sachplan-fruchtfolgeflaechen-sp-fff/uberarbeitung-und-starkung-des-sachplans-fff.html (accessed on 1 February 2018).
  45. Reid, R.S.; Tomich, T.P.; Xu, J.C.; Geist, H.; Mather, A.S. Linking land-change science and policy: Current lessons and future integration. In Land-Use and Land-Cover Change: Local Processes and Global Impacts; Lambin, E.F., Geist, H.J., Eds.; Springer: Berlin, Germany, 2006; pp. 157–171. [Google Scholar]
  46. Oliveira, E.; Leuthard, J.; Tobias, S. Spatial planning instruments for cropland protection in Western European countries. Land Use Policy 2019, 87, 104031. [Google Scholar] [CrossRef]
  47. Huang, D.; Jin, H.; Zhao, X.; Liu, S. Factors Influencing the Conversion of Arable Land to Urban Use and Policy Implications in Beijing, China. Sustainability 2015, 7, 180–194. [Google Scholar] [CrossRef] [Green Version]
Figure 1. Division of Switzerland in 26 cantons with their specific contribution to the total quota of Swiss prime cropland. The figure shows the abbreviations of the cantons’ names. Their full names are given in Table 1.
Land 09 00043 g001
Figure 2. Flow chart of the land-use suitability and scenario modeling.
Land 09 00043 g002
Figure 3. The cantons’ capability to fulfil their mandatory quota of prime cropland after allocating new construction zones to areas most suitable for urban land-use. Blue to green colors indicate the cantons will maintain a buffer of available prime cropland above their quota. Red to yellow colors indicate the cantons which may run the risk of falling below their quota.
Land 09 00043 g003
Figure 4. Conflicts between prime cropland area and potential new construction zones in the urban fringe of the city of Berne (dark blue squares). Brown areas = dedicated prime cropland; grey = current urban areas.
Land 09 00043 g004
Figure 5. Areas of high suitability for arable land-use within unbuilt current construction zones in the urban fringe of the city of Berne. Red = areas with > 75% suitability for arable land use; violet = areas with > 50% suitability for arable land use; dark grey = current construction zones; white = forest and agricultural land not dedicated as prime cropland; blue = water bodies.
Land 09 00043 g005
Figure 6. Prime cropland at risk of being converted into urban areas according to different scenarios of population development in the urban fringe of the city of Berne. Red = prime cropland at high risk of conversion since urban development is predicted in three scenarios; Violet = prime cropland at moderate risk of conversion – urban development in two scenarios; brown = prime cropland; grey = current construction zones.
Land 09 00043 g006
Table 1. Suitability for urban land-use outside current construction zones, and suitability for arable land inside current construction zones.
CantonAerial Extent of Prime Cropland
(ha)
Prime Cropland with Suitability for Urban Land-Use ≥50%
(ha)
Planned New Construction Zones (From Cantonal Comprehensive Plans)
(ha)
Potential New Construction Zones within Prime Cropland
(ha)
Area Inside Current Undeveloped Construction Zones with High Suitability for Arable Land-Use
(ha)
Suitability > 50%Suitability > 75%
Zurich (ZH)49,740546812000 (723) **29281767
Berne (BE)84,22758681400100833011811
Lucerne (LU)29,433172670033817081012
Uri (UR)262123548253
Schwyz (SZ)357393228695464275
Obwalden (OW)63922363 * 1912359
Nidwalden (NW)58028266910972
Glarus (GL)347550 * 0167110
Zug (ZG)38861077103347243
Fribourg (FR)36,378532647 * 32124651201
Solothurn (SO)19,5942166363 * 3071494925
Basel Stadt (BS)262154006025
Basel Land (BL)9860798268 * 192996608
Schaffhausen (SH)890082331 * 29408245
Appenzell Ausserrhoden (AR)969101−100270
Appenzell Innerrhoden (AI)3653617.50230
St. Gall (SG)15,04320295972421752937
Grisons (GR)732239710047298126
Aargau (AG)48,107350223420533012093
Thurgau (TG)38,756142049010520531554
Ticino (TI)39630287 * 1371603929
Vaudt (VD)79,4582880112065645273165
Valais (VS)8104113−1096018431203
Neuchâtel (NE)72949910 * 0382192
Geneva (GE)85271954257191627444
Jura (JU)18,1827520 * 0753499
Switzerland (CH)483,77334,4027035.53908 **31,84119,548
* The italic figures result from estimations of the FOSD based on the scenario of “high population growth“; ** In Canton Zurich, prime cropland is actually excluded from new construction zones because the comprehensive plan defines outer limits of urban growth outside the prime cropland, within which new construction zones can be assigned. Due to lack of data, we could not integrate these outer limits of urban growth in our model. Consequently, our model allocates 723 ha of new construction zones inside the prime cropland. For calculating the total consumption of prime cropland for entire Switzerland, we assumed cropland consumption for new construction zones in Canton Zurich of 0 ha.
Table 2. Estimated risk of converting prime cropland into urban land by 2035 according to land use trend (1985–2009) extrapolation, and according to modeled land-use change scenarios.
CantonTrend Extrapolation: Potential New Urban Area Outside Current Construction Zones
(ha)
Trend Extrapolation: Potential New Urban Area within Prime Cropland
(ha)
Amount of Prime Cropland Converted to Urban Area (ha)Planned New Construction Zones (from Table 1)
(ha)
Potential New Construction Zones within Prime Cropland (from Table 1)
(ha)
In Three Scenarios
(‘High Risk’)
In at Least Two Scenarios
(‘Mod Risk’)
Zurich36282318394273712000 (723) **
Berne72923761389284314001008
Lucerne250491554854700338
Uri71511684854
Schwyz23264984857028695
Obwalden87615789263 * 19
Nidwalden1171178492669
Glarus836233400 * 0
Zug1667664136684103
Fribourg3493147422317647 * 321
Solothurn24411403101883363 * 307
Basel Stadt172114239600
Basel Land100954723420268 * 192
Schaffhausen7205392233131 * 29
Appenzell Ausserrhoden42721152−100
Appenzell Innerrhoden287602017.50
St. Gall36168431941256597242
Grisons17824385644810047
Aargau222318062361559234205
Thurgau56642788518490105
Ticino490826241851073287 * 137
Vaudt497025679810531120656
Valais19342239166−10960
Neuchâtel171898102770 * 0
Geneva13421022236705257191
Jura145375311380 * 0
Switzerland54,07624,418233917,2727035.53908 **
* The italic figures result from estimations of the FOSD based on the scenario of “high population growth”. ** In Canton Zurich, prime cropland is actually excluded from new construction zones because the comprehensive plan defines outer limits of urban growth outside the prime cropland, within which new construction zones can be assigned. Due to lack of data, we could not integrate these outer limits of urban growth in our model. Consequently, our model allocates 723 ha of new construction zones inside the prime cropland. For calculating the total consumption of prime cropland for entire Switzerland, we assumed cropland consumption for new construction zones in Canton Zurich of 0 ha.

