Article

Mineral Soil Texture–Land Cover Dependency on Microwave Dielectric Models in an Arid Environment

by
Saeid Gharechelou
1,*,
Ryutaro Tateishi
2 and
Brian A. Johnson
3
1
Faculty of Civil Engineering, Shahrood University of Technology, Shahrood 3619995161, Iran
2
Center for Environmental Remote Sensing (CEReS), Chiba University, Chiba 2638522, Japan
3
Natural Resources and Ecosystem Services Area, Institute for Global Environmental Strategies (IGES), Hayama 240-0115, Japan
*
Author to whom correspondence should be addressed.
Submission received: 25 December 2019 / Revised: 22 January 2020 / Accepted: 24 January 2020 / Published: 1 February 2020

Abstract

:
In this study, we measured and characterized the relative dielectric constant of mineral soils over the 0.3–3.0 frequency range, and compared our measurements with values of three dielectric constant simulation models (the Wang, Dobson, and Mironov models). The interrelationship between land cover and soil texture with respect to the dielectric constant was also investigated. Topsoil samples (0–10 cm) were collected from homogenous areas based on a land unit map of the study site, located in the Gamsar Plain in northern Iran. The field soil samples were then analyzed in the laboratory using a dielectric probe toolkit to measure the soil dielectric constant. In addition, we analyzed the behaviors of the dielectric constant of the soil samples under a variety of moisture content and soil fraction conditions (after oven-drying the field samples), with the goal of better understanding how these factors affect microwave remote sensing backscattering characteristics. Our laboratory dielectric constant measurements of the real part (ε′) of the frequency dependence between the factors showed the best agreement with the results obtained by the Mironov, Dobson, and Wang models, respectively, but our laboratory measurements of the imaginary part (ε″) did not respond well and showed a higher value in low frequency because of salinity impacts. All data were analyzed by integrating them with other geophysical data in GIS, such as land cover and soil textures. The result of the dielectric constant properties analysis showed that land cover influences the moisture condition, even within the same soil texture type.

1. Introduction

In microwave remote sensing backscattering models, the value of the soil dielectric constant is important for retrieving soil water contents. Generally, the emissivity and permittivity parts of the dielectric constant are determined using tool kit measurements or based on simulation models. For the tool kit measurement approach, usually soil samples are taken from the field, and the real and imaginary part of the dielectric constant are measured using a dielectric constant tool kit [1,2]. In microwave remote sensing studies of soil moisture, the emissivity and backscattering coefficient of the soil at different frequencies are typically simulated, and soil moisture is estimated from satellite data using a microwave backscattering model. In an alternating electric field, permittivity varies depending on the applied frequency. This frequency dependence can be described by complex permittivity [3,4]:
ε* = ε′ – jε′′,
where ε′ is the dispersive part and ε″ is the absorptive part of permittivity. The real part ε′ of the permittivity is frequency dependent on the water content in the soil because of the relatively high frequency of the system. The values of ε″ are very small at low frequencies, and therefore ε″ has been previously stated to be of minimal importance for the determination of water content in soil [5]. Equation (1) is a function of the water content in the porous materials. The real part ε′ can be expressed as
ε = [ 1 λ ο 2 + β 2 α 2 4 Π 2 ] ,
where λ0 is the free space wavelength, Π is the cutoff wavelength, and α and β are the attenuation and phase constants, respectively. These variables can be measured experimentally [5,6,7]. The value of the dielectric constant (ε′) can be determined using Equation (2). The dielectric constant depends on the type of material, physico-chemical characteristics, as well as its moisture state [8,9,10,11,12,13,14,15,16].
Arid environments contain Aridisols, which belong to the thermic soil regime, including minerals in the soil profile due to high evaporation rates and low rainfall. Aridisols exhibit quite different behaviors in dielectric constant measurements compared to other soil types [17,18]. Most microwave remote sensing studies, however, have focused on analyzing/simulating the dielectric constant of wet soils rather than Aridisols, using models such as the Dobson and Wang models [7,12,14,15,16,19,20,21,22]. In 2009, Mironov presented another model of the dielectric constant dependency on mineralogy in cold regions, but this model has not yet been evaluated for arid regions [21,22,23,24]. The Mironov and Wang models also consider the effect of bound water on the dielectric constant [7,24], but are, however, limited to rather short frequencies of 1–10 GHz and 1–5 GHz, respectively. The Dobson model is valid for a larger frequency range (1–18 GHz). On the other hand, the dielectric constants computed from the Wang [7] and the Mironov et al. [22] models have been found to be in better agreement with tool kit measurements for a larger range of soil texture types [20,21,22,23,24].
Although several researchers have investigated the roles of temperature, water content, soil temperature and texture [12,13,14,15,16,17,18,19,20,21,22,23,24], a number of questions still remain in relation to the dielectric constant of arid soils and its dependency on microwave backscattering model. The main research gap is the effect of land cover and vegetation on the remote sensing-derived measurements of soil dielectric constant. The microwave remote sensing inverse backscattering model requires the soil moisture, roughness, and vegetation variables, for which dielectric constant models are very important [5,25]. Total backscatter is measured in decibels (dB) and is a function of vegetation, soil roughness, and soil moisture [25,26,27,28], as shown in Equation (3):
σ° total (dB) = f (vegetation, soil_roughness, soil_moisture)
where σ° total is the calibrated total backscatter. The sensitivity of radar backscattering to soil moisture and roughness has been demonstrated in different papers [25,27,29,30,31], considering the variation in dielectric constant of wet (~80) and dry (~6) soils.
In this study, we conducted laboratory experiments of the dielectric constant of mineral soils in the 0.3–3 frequency range under natural (i.e., field) conditions as well as a range of different moisture contents. The objectives were to analyze the effects of land cover (vegetation) on the dielectric constant, and also to compare the laboratory measurements with the simulated results of three dielectric models, Mironov, Wang, and Dobson, for mineral soils in an arid environment.

2. Materials and Methods

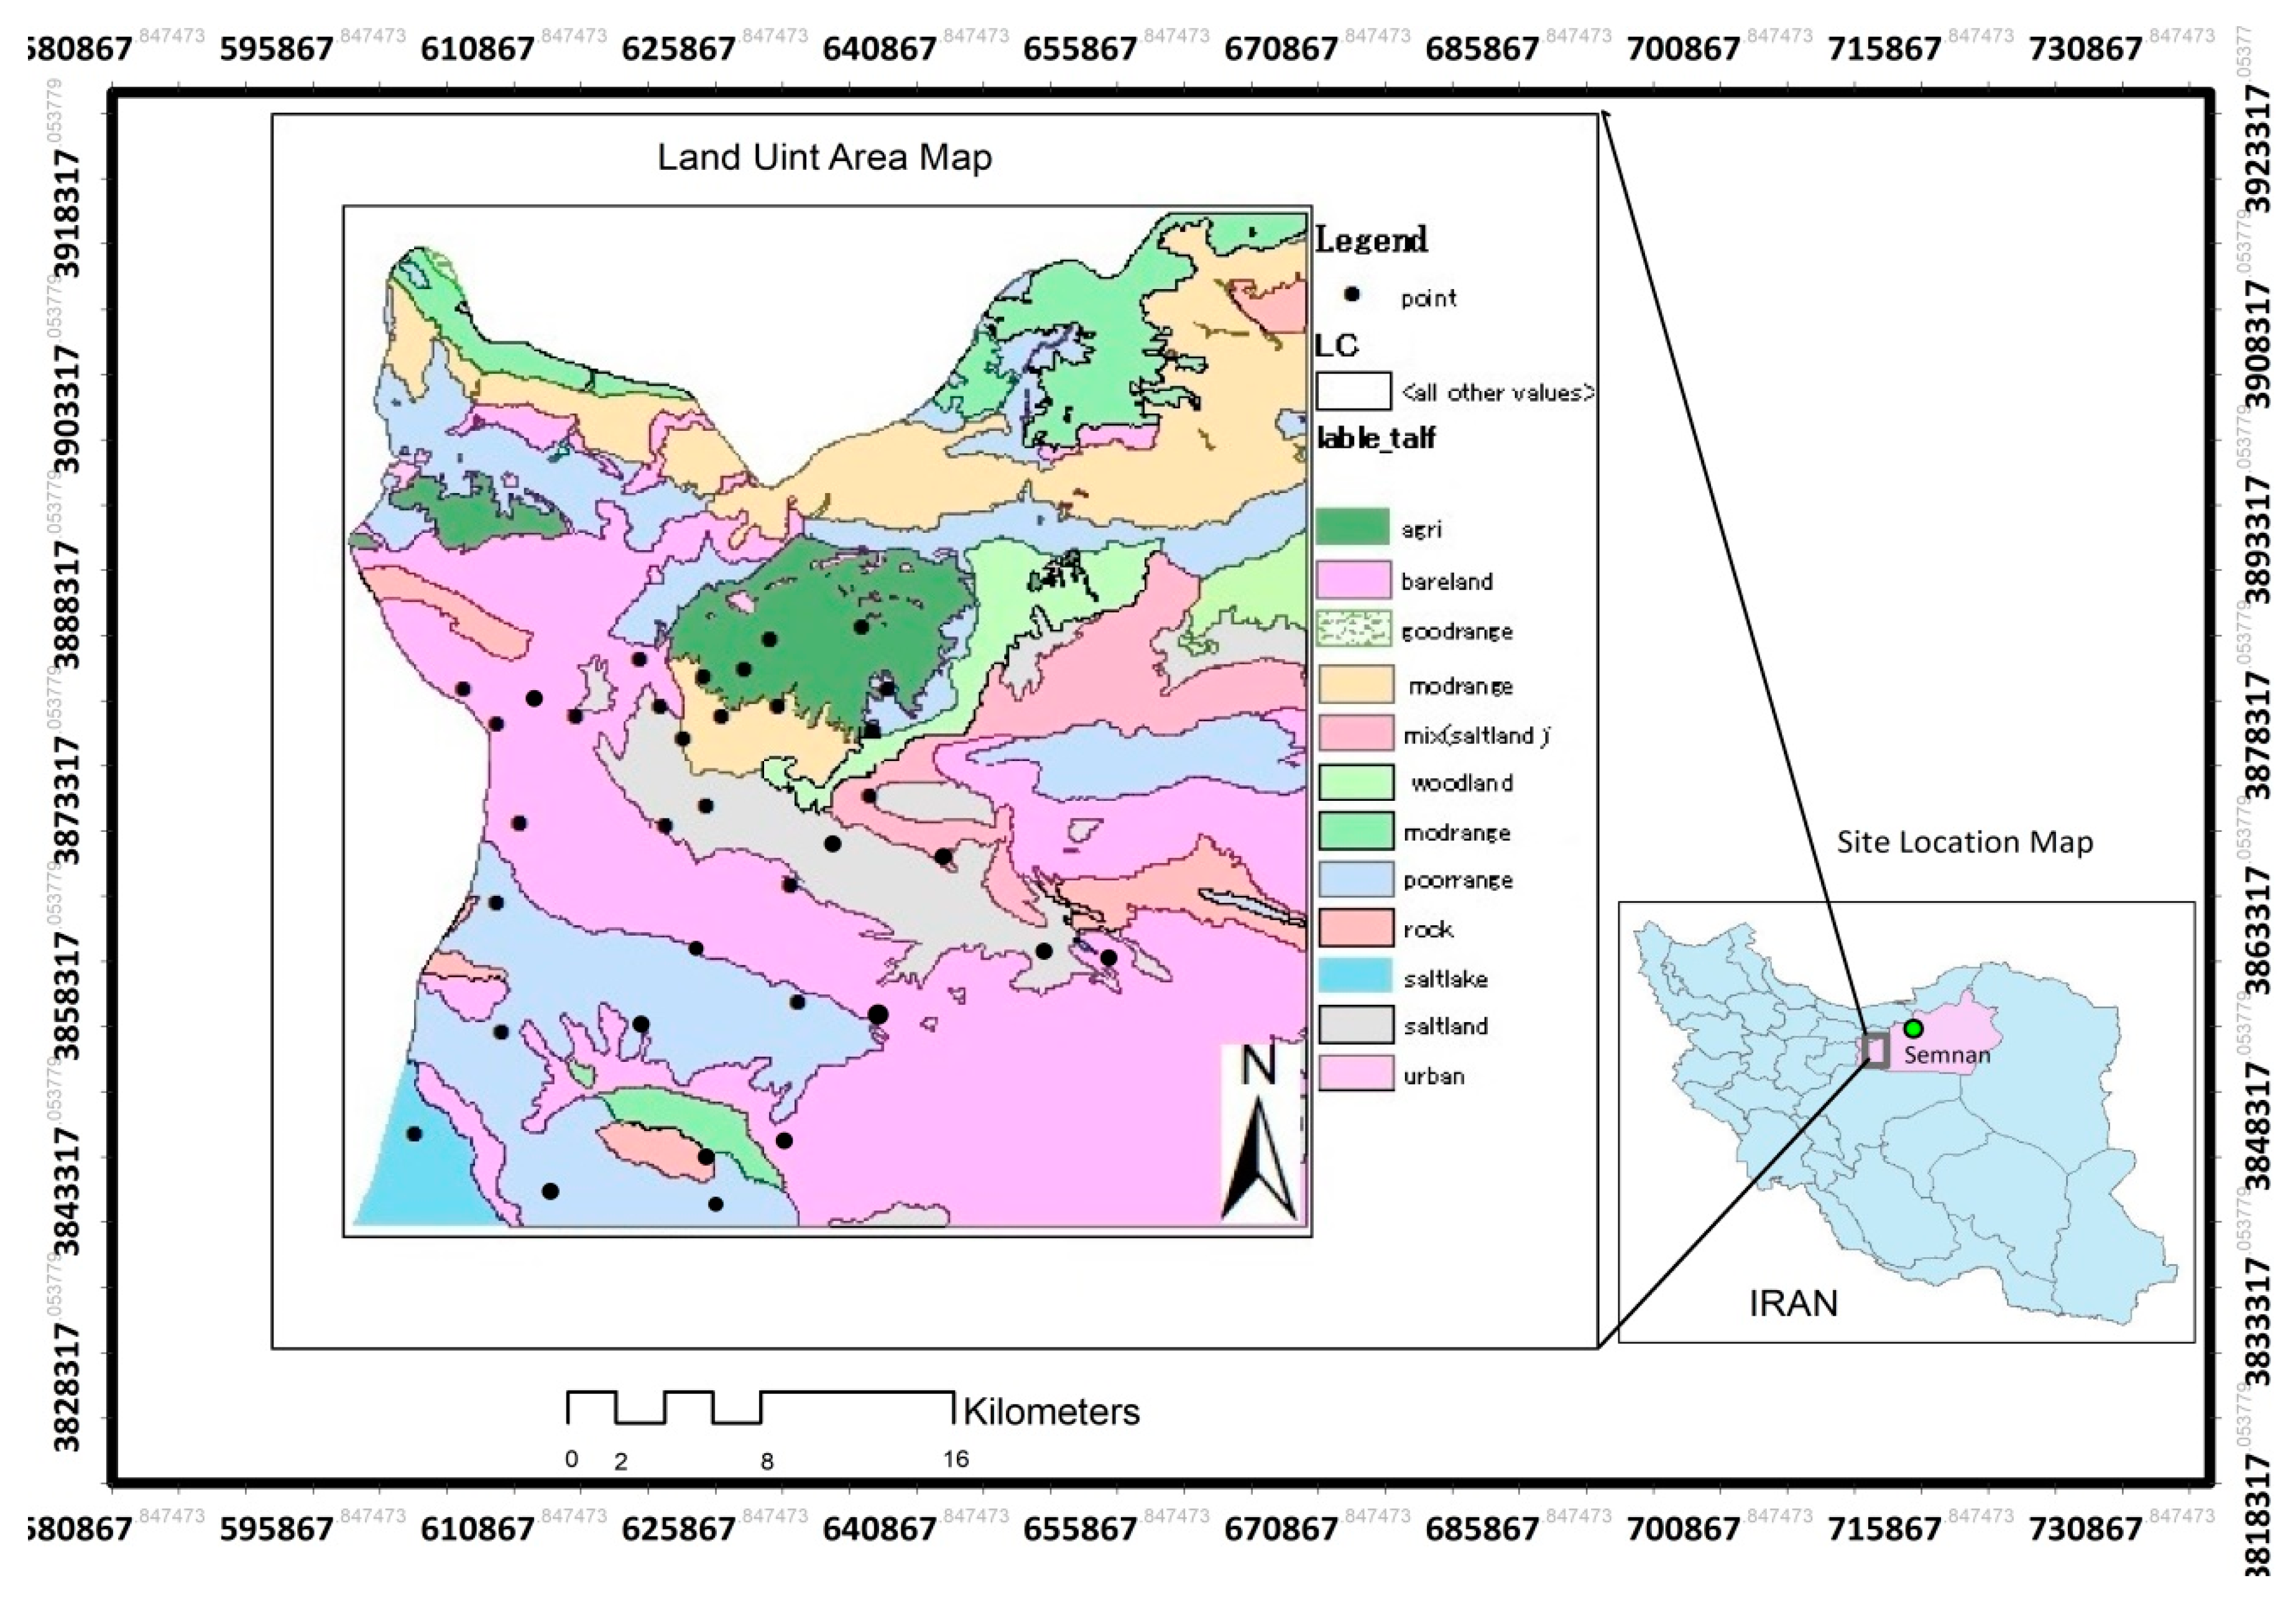
2.1. Site and Field Work

The test site for this work is located on the Garmsar plain in northern Iran (Figure 1). The average annual precipitation of this site is 140 mm, and the climate is arid and semi-arid. Based on the U.S soil taxonomy, the soils in this site are categorized as belonging to the Aridisols class (from Latin aridus, “dry”), which exhibit at least some subsurface horizon development [17,29,30]. Based on the temperature and humidity regime of the soil classification, the soil of this region is categorized as Aridic. The land cover mainly consists of bare land, sparse vegetation, and cropland. Aridisols have a very low concentration of organic matter, reflecting the paucity of vegetative production in these dry soils, with the most bound water content in their particles.
In this research, the first step was collecting field samples from near the topsoil layer (0–10 cm) in the test site. For this, 36 sample locations were selected from homogeneous areas based on a land unit map provided in an environmental GIS database that was produced by us [31] (Figure 2), and field samples were collected in July 2015. A GPS device was used to locate the sample locations in the field.

2.2. Soil Samples

All collected soil samples were put in zipped plastic bags to preserve their natural condition, and sent to a laboratory for analysis. In the laboratory, soil particle composition, moisture, temperature, and electro conductivity (EC) were analyzed. Field work properties and laboratory analysis of the measured soil samples are presented in the Table 1.
By changing the moisture content of each soil sample from the natural field soil condition to 10%, 20%, 30%, 40%, and saturated soil (>40% moisture content), as well as oven-dried soil, the dielectric constant was finally performed under seven different conditions (Figure 3). All measurements were repeated five times, and the mean value used in order to reduce measurement errors. Considering the cap size in Figure 3, the water volume (mL) needed to achieve each soil moisture content (%) is presented in Table 2. To overcome the uncertainties of the dielectric constant, values for the different types of soil and moisture conditions measured by TDR (time domain reflectance) were determined as well.
By adding known amounts of distilled water to dry soil enclosed in a known volume, soil moisture measurements were calibrated. The effect of salinity on the measurement was evaluated. Once calibration had been accomplished, actual soil moisture measurements were done in three tests at each depth.
For each soil sample, the measurement procedure was as follows:
  • Measurement of the soil moisture of field sample under natural conditions by TDR weight, and then measurement of the dielectric constant.
  • Complete drying of the soil inside an oven at 110 °C for 24 h.
  • Introduction of the soil sample inside a regular cup and weighing it after sieving the gravel.
  • Dielectric toolkit calibration.
  • Measurement of ε′ parameters and computation of the dielectric constant.
  • Introduction 27 mL of water (10% water content) uniformly distributed in the cavity.
  • Weighing of the new sample for gravimetric soil moisture.
  • Measurement of samples of the ε′ dielectric constant for each soil texture and computation of the dielectric constant for the next water content (e.g., 20%), and then repeating for the same soil texture.
  • Then the dielectric constant of 36 soil samples was measured in a microwave remote sensing laboratory using a dielectric constant toolkit. All data were analyzed by integrating it with other geophysical data in GIS, such as land cover and soil textures.

2.3. Soil Dielectric Models

Typically, peat and other soil types are composed of multiple materials, including, e.g., earth, various gases, and water. To estimate the dielectric constant of soil materials, several semi-empirical and empirical mixture models have been proposed, such as the Dobson, Wang, and Mironov models [7,12,16,23,25]. Generally, soil is considered as consisting of a mixture of four components—soil, air, free water, and bound water—but this assumption ignores soil salt content. To describe the dielectric constant of such a mixture, Dobson et al. [11,12] developed a semi-empirical model for soil. Dobson proposed an empirical approach to compute the dielectric constant of soil in the microwave spectrum of 1.4–18 GHz and a dielectric model in the range of 0.3–1.3 GHz [1,12,30,32]. The following input data is required for the Dobson model: soil moisture (m3/m3), dry soil bulk density (g/cm3), the clay (%) and sand (%), the soil effective temperature (K), and the solid particle density.
Given a bulk density ρb and specific density ρs, the model is described as
ε α m = 1 + b ρ ρ s   ( ε α s 1 ) + m β v ε α ω m v ,
where α = 0.65, εs = (1.01 + 0.44ρs)2 − 0.062 is the dielectric constant of soil particles, β is a coefficient expressed as a function of sand and clay contents, mv is the volumetric soil moisture content, and εαfw is the dielectric constant of the free water. Soil surface temperature is fixed at 23 °C, which is acceptable for an average value of sampling soils. The bulk density used in the Dobson model is 1.6 g/cm3; there was an average value of 36 ground points.
The physically based generalized refraction mixing dielectric model proposed by Mironov et al. [2,13], which was improved to account for the effect of the soil temperature [33], helps to distinguish between bound and free water. Soil moisture, soil effective temperature, and clay are used as the inputs of the Mironov model, thus avoiding uncertainties introduced by the computation of the global bulk density map compared with the Dobson model. This model was built and validated for soil data spanning the entire texture range, including the 36 samples used for the definition of the Dobson model.

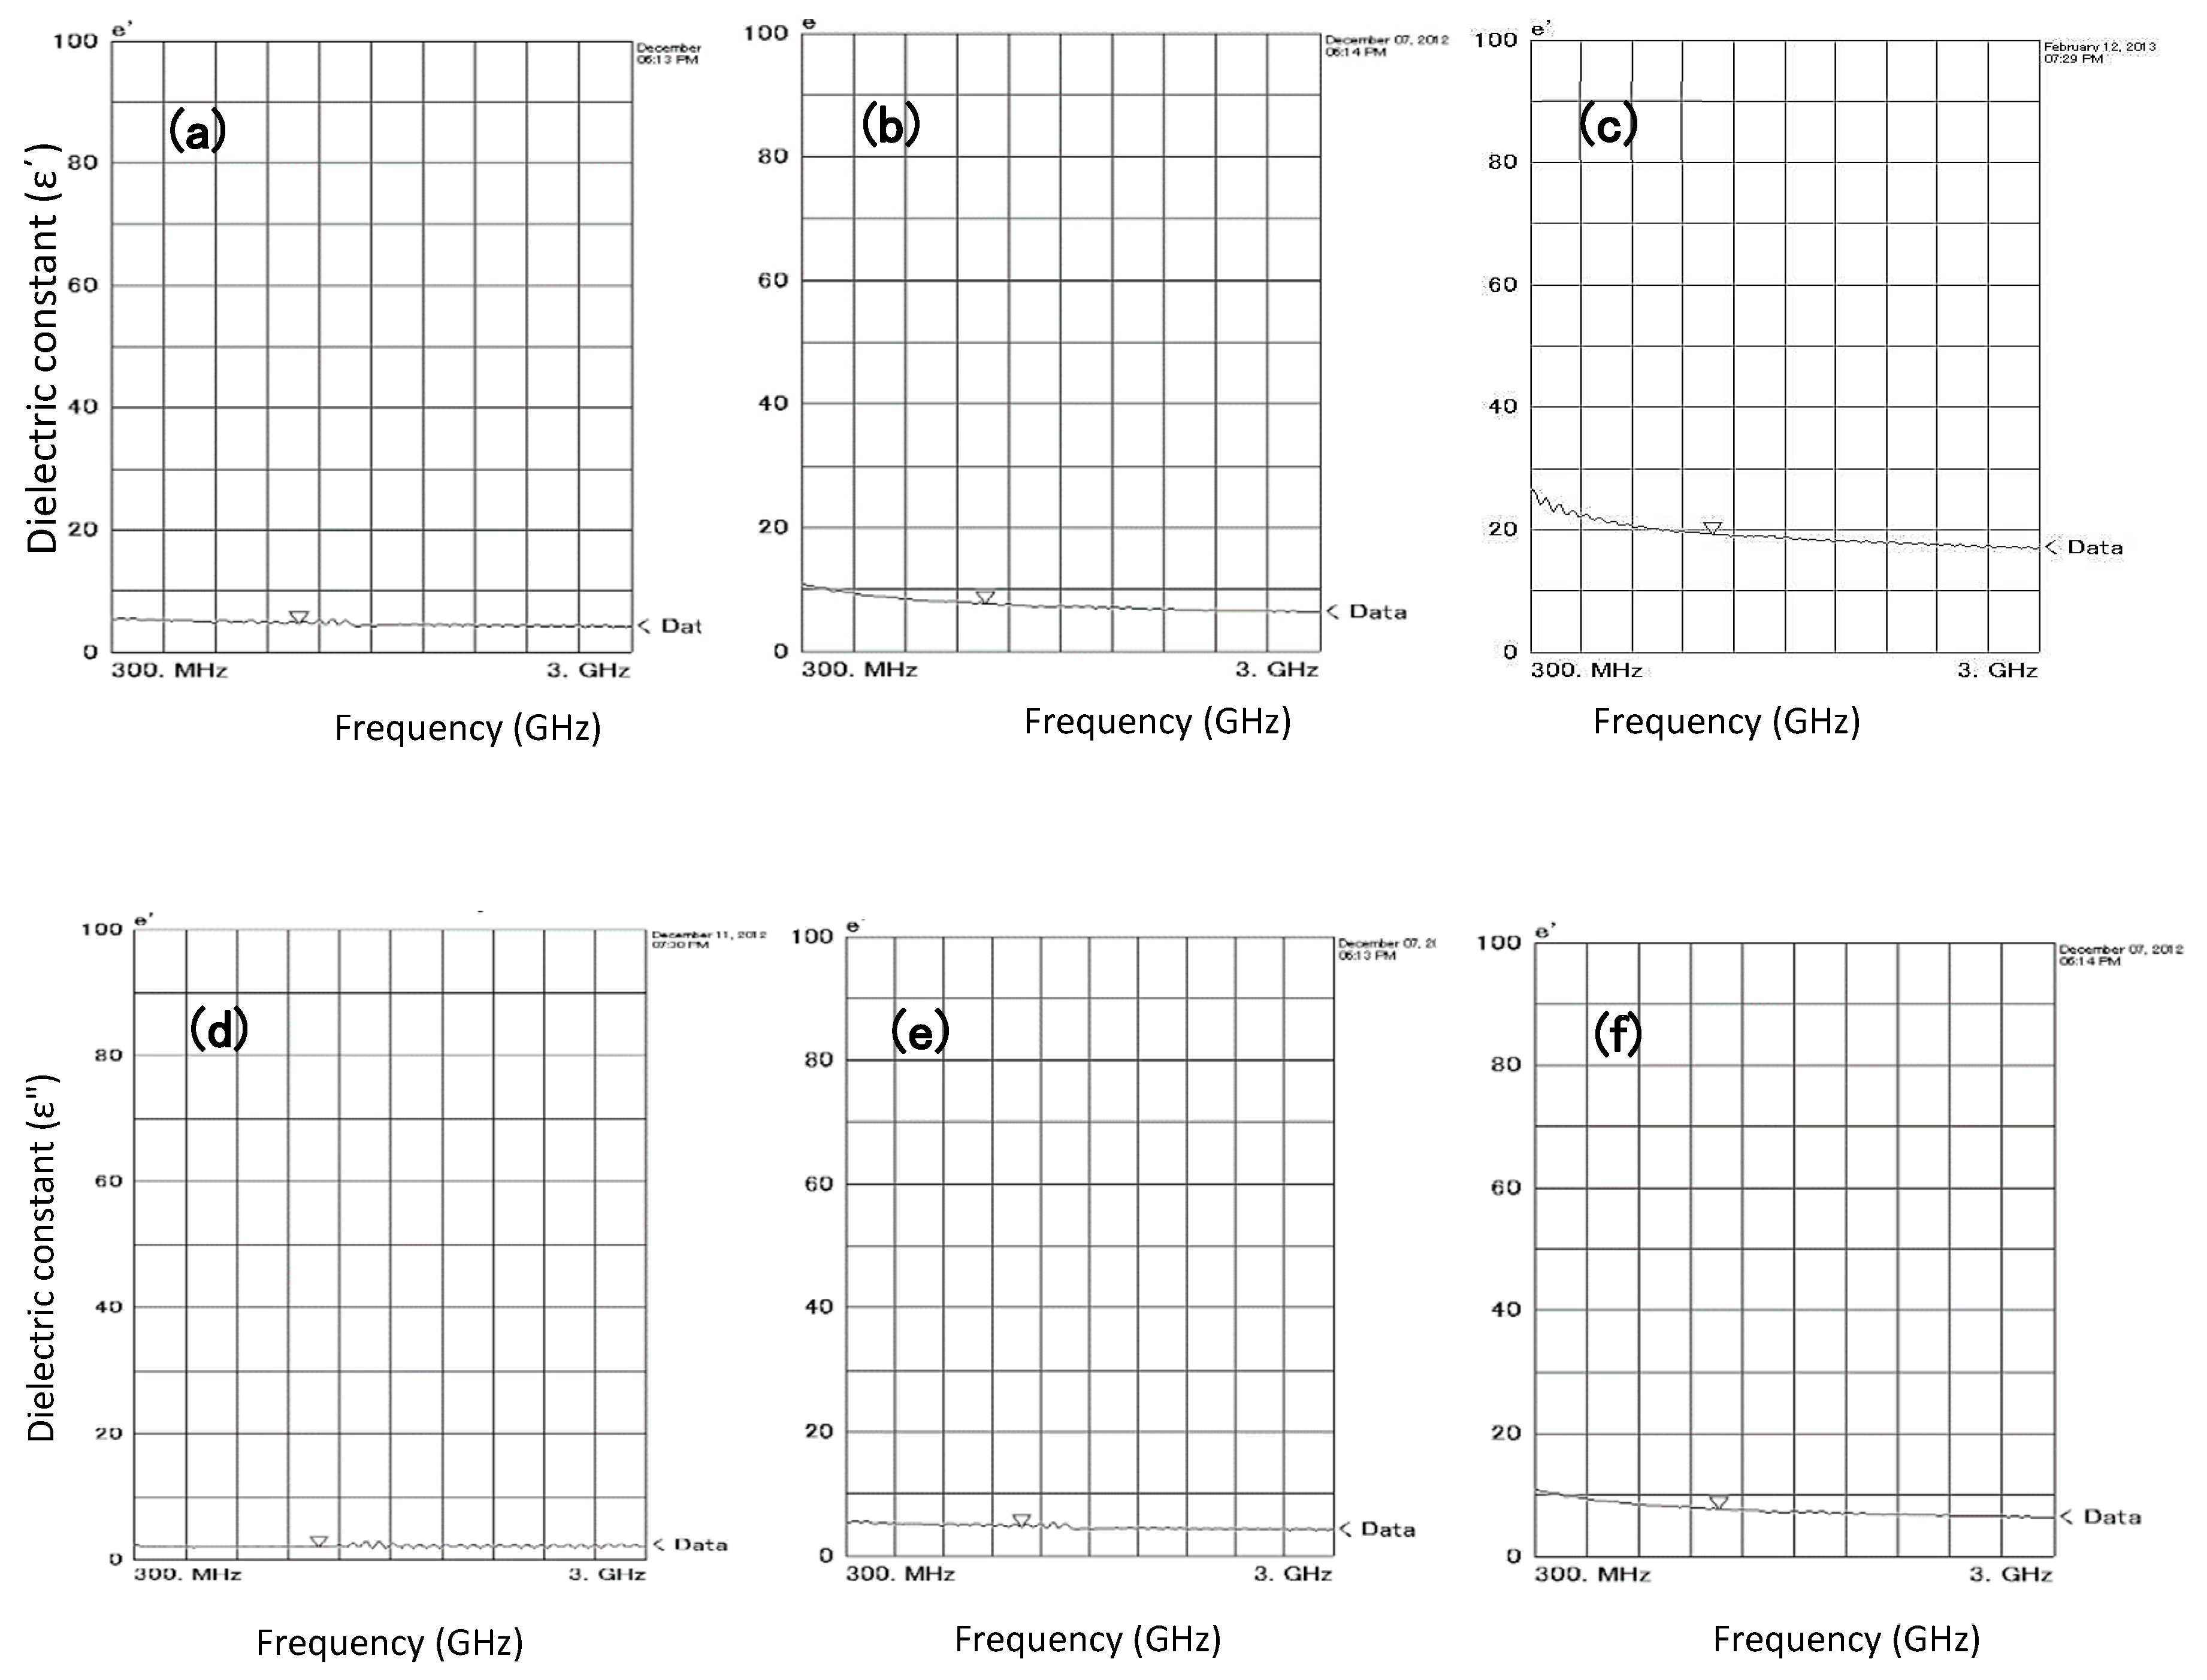
2.4. Dielectric Constant Measurement

In this research, dielectric constant measurements were carried out for 36 samples with different moisture contents (from dry soil to 40% moisture content in seven steps). A network analyzer coupled with an open-air probe technique was used in the measurement of the soil dielectric constant. The measurement frequency was from 0.3 to 3 GHz with 36 sampling points (Figure 3 and Figure 4). We focused our analysis on this frequency range because we were interested mainly in a better understanding of the microwave backscattering characteristics of the L-band and C-band microwave satellite sensors, such as ALOS PALSAR-1/PALSAR-2 and Sentinel-1 radar data.
The real and imaginary parts of the complex dielectric constant of different soil textures under different land covers with varied moisture content were determined experimentally under laboratory condition using Equation (1) [5,8,11,29,30].

3. Results

3.1. Dielectric Measurement for the 0.3–3 GHz Range

Overall, more than 520 measurements for ε′ and ε″, from a total of 36 soil samples, were performed from 0.3 to 3 GHz, on four different soil textures subjected to various moisture conditions and land cover types (Figure 4). The relative permittivity is a frequency-dependent variable and decreases with increasing frequency (Figure 4a–c) [16]. The imaginary part (ε″) of the dielectric permittivity is usually expressed in terms of dielectric losses, which include dispersive losses as well as free-water relaxation and bound-water relaxation losses (Figure 4d–f).
The first step in the analysis of the data was to compare the measured values with those calculated on the natural soil basis of the ε′ and ε” outlined in the dielectric constant toolkit (Figure 5 and Figure 6).
In the laboratory, a volumetric water content range from 10% to 40% was tested. The graph trend showed that, typically, the real part ε′ slowly decreases with an increase in frequency, while the imaginary part ε″ rapidly decreases with an increase in frequency, especially in the low-frequency range. However, we did not use a wide frequency range, and it was tough to discriminate. Furthermore, the same ε″ variation pattern was observed in the experimental measurements (Figure 7).

3.2. Analysis of the Simulated Dielectric Constants

The particle size of the different soil textures can affect the speed and height of the water movement through capillary action in the soil. In general, the capillary water in loamy soil rises relatively quickly and to a greater height compared to clay and sandy soils [29,30,31]. The five different soil textures from different land cover types were all analyzed, and the representative texture types of this region are sandy and clay as well as silt and loam soils, which were thoroughly analyzed at 0.3–3 GHz (Figure 8).

3.3. Dielectric Dependency on Soil Texture and Land Cover Type

Previous researchers have shown the dependence of ε′ and ε′′ on soil composition (Figure 9) [2,6,7,8,9,28,29]. According to the land cover types and interaction to soil textures, it seems that vegetation has an important role in the soil development process and on the soil texture and water content, which can influence to dielectric constant. For example, sparse vegetation compared with bare land in the test site show a higher dielectric constant (Figure 9). In this research, the relationship between the dielectric constant and soil texture for the four different moisture contents in the field were plotted and shown an interesting result (Figure 9). The results showed that the dielectric constant (ε′) has a direct relationship with land cover type. For instance, soil clay texture in the cropland and bare land, despite having the same soil texture, presented different dielectric constant measurement. On the other hand, bare land with the same clay soil texture and soil moisture contents presented different dielectric constant values. In summary, the results indicated that not only the soil texture, but also the vegetation cover is affecting the dielectric constant indirectly by influencing the soil water contents.

4. Discussion

The dielectric constant ε′ was more sensitive than ε″ to soil moisture, particularly for mineral soil, which can be identified by the εα component of ε. This indicates that the dielectric constant properties exhibited relatively minor variation in the real and imaginary parts within the 1–2 GHz frequency range, irrespective of the soil texture and moisture contents. This is consistent with the findings of other researchers [2,5,9,12,13,20,24,31,32]. At frequencies below 1.5 GHz, ε′ was only weakly frequency dependent, and dielectric losses were generally low. This may be attributed to the free water and air in the soil particles. However, at higher frequencies (2–3 GHz), ε′ increased significantly with increasing water content. Soil moisture content had the biggest effect on the dielectric constant, which is under an appendage effect of the land cover effects, because of the influence of vegetation cover and soil texture. The soil texture types had the second largest impact on the value of the dielectric constant. The moisture content, however, also depends on the soil texture and land cover type, meaning that the types of land cover are clearly affected by the background layers of soil in the surface. Thus, the land cover, and taking the soil samples of them for dielectric constant measurement, could account for most aspects of the soil properties. There was also a good agreement between the land cover and dielectric constant within each level of soil moisture content, even for the same soil texture types. Of the different types of soil texture, clay soil exhibited the highest ε′ values, followed by the loam, silt, and sandy soil texture types, respectively. The real part (ε′) was more sensitive to soil moisture than the imaginary part (ε″), particularly for mineral soils, which can be identified by the component of ε; it is because of bound water in the soil particles. For the real part of the dielectric constant, the measurements from our experiments were in highest agreement with the simulated results obtained by the Mironov model, followed by the results obtained by the Wang model and Dobson model, respectively. For the imaginary part of the dielectric constant, the measurements from our experimental were always higher than the values predicted by the other three simulated models it seems cause of salinity effects. The Mironov model was already shown to work well for modeling the dielectric constant behavior of mineral soil in cold regions, but the reactions of arid soils differ significantly according to depth, water content and organic matter [32,33,34]. After comparing the measured soil moisture in different soil texture types with the estimated soil moisture by using the Mironov, Dobson, and Wang models, we observed that all of the models were overestimating soil moisture.

5. Conclusions

In this research, we conducted laboratory measurements of the dielectric constant of 36 soil samples having different soil textures and land cover types, over the 0.3–3 GHz frequency range. The laboratory measurements were conducted for each soil sample under different soil moisture contents (natural field condition, 10%, 20%, 30%, 40%, saturated soil, and oven-dried soil). As a result, we found that the land cover types and soil textures showed a close relationship with the dielectric constant measurements and simulations. This means that, even if the soil contains the same water content and soil texture, if found in a different land cover, the behavior of the dielectric constant will differ. Thus, vegetation cover obviously has a key role for soil particle development, such as organic matter, salinity, depth, and water content saving, and all of these can influence the complex dielectric constant. In this research, the imaginary part of the relative dielectric constant exhibited higher values in low frequency because of salinity impacts. The result of three commonly used dielectric model showed that the generally the Mironov model had the highest level of agreement with our experimental measurements, followed by the Wang and Dobson models, respectively. The main significance of this research was the elucidation of the land cover influence on the soil dielectric constant in arid land, as well as the comparison of different simulation models. We found the Mironov model performed best in our study site, but it may be useful to further compare the performance of these empirical/semi-empirical approaches for time-series soil moisture retrieval to help identify the best model for arid soils with higher accuracy. Investigation of soil organic matter in different land cover conditions also can be useful for clarifying the effect on the dielectric constant.

Author Contributions

Data processing and first draft writing by S.G. and R.T.; B.A.J. advised the methodology and revised the manuscript. All authors have read and agreed to the published version of the manuscript.

Funding

This research received no external funding.

Conflicts of Interest

There is no conflict of interest.

References

  1. Ghosh, A.; Bihari, J.; Pyne, S. Dielectric parameters of dry and wet soils at 14.89 GHz. IJRSP 1998, 27, 130–134. [Google Scholar]
  2. Usowicz, B.; Marczewski, W.; Bogdan Usowicz, J.; Lipiec, J. Statistical Modelling of the Soil Dielectric constant. Geophys. Res. Abstr. 2020, 12, 6749. [Google Scholar]
  3. Lee, E.; Chase, T.N.; Rajagopalan, B.; Barry, R.G.; Biggs, T.W.; Lawrence, P.J. Effects of irrigation and vegetation activity on early Indian summer monsoon variability. Int. J. Clim. 2009, 29, 573–581. [Google Scholar] [CrossRef]
  4. Curtis, J.O. Moisture Effects on the Dielectric Properties of Soils. IEEE Trans. Geosci. Remote Sens. 2001, 39, 125–128. [Google Scholar] [CrossRef]
  5. Gadani, D.H.; Vyas, A.D. Measurement of complex dielectric constant of soils of Gujarat at X- and C-band microwave frequencies. IJRSP 2008, 37, 221–229. [Google Scholar]
  6. Chaudhari, H.C.; Shinde, V.J. Dielectric properties of soil at X-band microwave frequency. IJPAP 2012, 50, 64–66. [Google Scholar]
  7. Wang, J.R.; Schmugge, T.J. An Empirical Model for the Complex Dielectric Permittivity of Soils as a Function of Water Content. IEEE Trans. Geosci. Remote. Sens. 1980, 18, 288–295. [Google Scholar] [CrossRef] [Green Version]
  8. Campbell, J.E. Dielectric properties and influence of conductivity in soils at one to fifty megahertz. Soil Sci. Soc. Am. J. 1990, 54, 332–341. [Google Scholar] [CrossRef]
  9. Arya, L.M.; Paris, J.F. A Physicoempirical Model to Predict the Soil Moisture Characteristic from Particle-Size Distribution and Bulk Density Data. Soil Sci. Soc. Am. J. 1981, 45, 1023–1030. [Google Scholar] [CrossRef]
  10. WANG, L.; Qu, J.J. Satellite remote sensing applications for surface soil moisture monitoring: A review. Earth Sci. China 2009, 3, 237–247. [Google Scholar] [CrossRef]
  11. Hallikainen, M.; Ulaby, F.; Dobson, M.; El-Rayes, M.; Wu, L.-K. Microwave Dielectric Behavior of Wet Soil-Part 1: Empirical Models and Experimental Observations. IEEE Trans. Geosci. Remote. Sens. 1985, 23, 25–34. [Google Scholar] [CrossRef]
  12. Dobson, M.C.; Ulaby, F.T.; Hallikainen, M.T.; El-Rayes, M.A. Microwave dielectric behaviour of wet soils, Part II: Dielectric mixing models. IEEE Trans. Geosci. Remote. Sens. 1985, 23, 35–46. [Google Scholar] [CrossRef]
  13. Ulaby, F.T.; Dubois, P.C.; Van Zyl, J. Radar mapping of surface soil moisture. J. Hydrol. 1996, 184, 57–84. [Google Scholar] [CrossRef]
  14. Peplinski, N.; Ulaby, F.; Dobson, M. Dielectric properties of soils in the 0.3-1.3-GHz range. IEEE Trans. Geosci. Remote. Sens. 1995, 33, 803–807. [Google Scholar] [CrossRef]
  15. Baghdadi, N.; Zribi, M. Evaluation of radar backscatter models IEM, OH and Dubois using experimental observations. Int. J. Remote. Sens. 2006, 27, 3831–3852. [Google Scholar] [CrossRef]
  16. Calla, O.P.N.; Singh, R.K. Emission characteristics of dry and wet loamy sand soil layered packed at microwave frequencies. IJRSP 2002, 31, 285–292. [Google Scholar]
  17. Natural Resources Conservation Service (NRCS). Available online: http://www.nrcs.usda.gov (accessed on 24 February 2017).
  18. Li, Y.-Y.; Zhao, K.; Ren, J.-H.; Ding, Y.-L.; Wu, L.-L. Analysis of the Dielectric Constant of Saline-Alkali Soils and the Effect on Radar Backscattering Coefficient: A Case Study of Soda Alkaline Saline Soils in Western Jilin Province Using RADARSAT-2 Data. Sci. World J. 2014, 2014, 1–14. [Google Scholar] [CrossRef]
  19. Zribi, M.; Le Morvan, A.; Baghdadi, N. Dielectric Constant Modelling with Soil–Air Composition and Its Effect on Sar Radar Signal Backscattered over Soil Surface. Sensors 2008, 8, 6810–6824. [Google Scholar] [CrossRef]
  20. Mironov, V.L.; De Roo, R.D.; Savin, I.V. Temperature-dependable microwave dielectric model for an Arctic soil. IEEE Trans. Geosci. Remote Sens 2013, 48, 2544–2556. [Google Scholar] [CrossRef]
  21. Mironov, V.L.; Fomin, S.V. Temperature and Mineralogy Dependable Model for Microwave Dielectric Spectra of Moist Soils. PIERS Online 2009, 5, 411–415. [Google Scholar] [CrossRef] [Green Version]
  22. Mironov, V.L.; Dobson, M.C.; Kaupp, V.H.; Komarov, S.A.; Kleshchenko, V.N. Generalized refractive mixing dielectric model for moist soils. IEEE Trans. Geosci. Remote Sens. 2004, 42, 773–785. [Google Scholar] [CrossRef]
  23. Mironov, V.L.; Fomin, S.V. Temperature dependable microwave dielectric model for moist soils. PIERS Online 2009, 5, 831–835. [Google Scholar] [CrossRef] [Green Version]
  24. Mironov, V.; Kosolapova, L.; Fomin, S. Physically and Mineralogically Based Spectroscopic Dielectric Model for Moist Soils. IEEE Trans. Geosci. Remote. Sens. 2009, 47, 2059–2070. [Google Scholar] [CrossRef]
  25. Wang, S.G.; Li, X.; Han, X.J.; Jin, R. Estimation of surface soil moisture and roughness from multi-angular ASAR imagery in the Watershed Allied Telemetry Experimental Research (WATER). Hydrol. Earth Syst. Sci. 2011, 15, 1415–1426. [Google Scholar] [CrossRef] [Green Version]
  26. He, B.; Xing, M.; Bai, X. A Synergistic Methodology for Soil Moisture Estimation in an Alpine Prairie Using Radar and Optical Satellite Data. Remote. Sens. 2014, 6, 10966–10985. [Google Scholar] [CrossRef] [Green Version]
  27. Hajnsek, I.; Papathanassiou, K.P.; Jagdhuber, T.; Schon, H. Potential of Estimating Soil Moisture Under Vegetation Cover by Means of PolSAR. IEEE Trans. Geosci. Remote. Sens. 2009, 47, 442–454. [Google Scholar] [CrossRef] [Green Version]
  28. Gharechelou, S.; Tateishi, R.; Sumantyo, J.T.S. Interrelationship Analysis of L-Band Backscattering Intensity and Soil Dielectric Constant for Soil Moisture Retrieval Using PALSAR Data. Adv. Remote. Sens. 2015, 4, 15–24. [Google Scholar] [CrossRef] [Green Version]
  29. Gharechelou, S.; Tateishi, R.; Sumantyo J, T.S. Comparison of Simulated Backscattering Signal and ALOS PALSAR Backscattering over Arid Environment Using Experimental Measurement. Adv. Remote. Sens. 2015, 4, 224–233. [Google Scholar] [CrossRef] [Green Version]
  30. Gharechelou, S.; Tateishi, R.; Johnson, B.A. A Simple Method for the Parameterization of Surface Roughness from Microwave Remote Sensing. Remote. Sens. 2018, 10, 1711. [Google Scholar] [CrossRef] [Green Version]
  31. Gharechelou, S.; Tateishi, R.; Sharma, R.C.; Johnson, B.A. Soil Moisture Mapping in an Arid Area Using a Land Unit Area (LUA) Sampling Approach and Geostatistical Interpolation Techniques. ISPRS Int. J. Geo-Inf. 2016, 5, 35. [Google Scholar] [CrossRef] [Green Version]
  32. Mironov, V.L.; Kosolapova, L.G.; Lukin, Y.I.; Karavaysky, A.Y.; Molostov, I.P. Temperature-and texture-dependent dielectric model for frozen and thawed mineral soils at a frequency of 1.4 GHz. Remote Sens. Environ. 2017, 200, 240–249. [Google Scholar] [CrossRef]
  33. Mialon, A.; Richaume, P.; Leoroux, A.J.; Bircher, S.; Pellarin, T.; Wigneron, J.; Kerr, Y. Comparison of Dobson and Mironov Dielectric Models in the SMOS Soil Moisture Retrieval Algorithm. IEEE Trans. Geosci. Remote. Sens 2015, 53, 3084–3094. [Google Scholar] [CrossRef]
  34. Park, C.-H.; Montzka, C.; Jagdhuber, T.; Jonard, F.; De Lannoy, G.; Hong, J.; Jackson, T.J.; Wulfmeyer, V. A Dielectric Mixing Model Accounting for Soil Organic Matter. Vadose Zone J. 2019, 18, 190036. [Google Scholar] [CrossRef]
Figure 1. Site in the northern part of Iran (Landsat ETM+, 164/36).
Land 09 00039 g001
Figure 2. Field sampling locations in the land unit map in different land cover types.
Land 09 00039 g002
Figure 3. Dielectric constant measurement of soils in the laboratory using the dielectric probe toolkit.
Land 09 00039 g003
Figure 4. A sample result of dielectric constant measurement by a dielectric probe toolkit in the range of 0.3–3 GHz range (emissivity of dry clay soil (a), emissivity of clay soil with 10% moisture content (b), and emissivity of clay soil with saturated moisture content (c); permittivity of dry clay soil (d), permittivity of clay soil with 10% moisture content (e), and permittivity of clay soil with saturated moisture content (f)). The pointer on the graph shows the L-band (1.27 GHz).
Land 09 00039 g004
Figure 5. The clay soil texture dielectric constant for different water contents (red 0%, green 10%, yellow 20%, blue 30%, and black 40%) with respect to frequency (from 0.3 to 3 GHz): (a) real part and (b) imaginary part.
Land 09 00039 g005
Figure 6. Dielectric constant behavior (a) real (ε′) and (b) imaginary (ε″) part of different soil texture.
Land 09 00039 g006
Figure 7. Frequency variations of the real (a) and imaginary (b) parts of derived dielectric constant of the samples from laboratory measurements at different moisture levels.
Land 09 00039 g007
Figure 8. Comparison of the dielectric constants for (a) real, clay; (b) imaginary, clay; (c) real, loam; (d) imaginary, loam; (e) real, sand; and (f) imaginary, sand. Blue line: polynomial fitting from experimental data. Red line: Dobson model; green line: Wang model; and brown line Mironov model.
Land 09 00039 g008
Figure 9. Dielectric constant properties and its relationship with different land cover types and soil texture in varied moisture contents: Dried Soil (DS: 0%), Natural Soil (NS: 5%), Field capacity (FC: 15%), and Saturated Soil (SS: >35%).
Land 09 00039 g009
Table 1. The physical properties of some selected samples in the dominant land cover.
Field NoSoil TexturesBulk Density (g/cm3) TDR (SM %)Gravimetric (SM %)Land Cover
1Sandy1.732.31.8Bare land
2Silty1.706.99.3Fallow land
3Clay1.326.65.83Plowed land
4Clay1.5029.330.25Sparse vegetation
5Clay1.4520.718.81Sparse vegetation
6Clay1.354.35.42Fallow land
7Clay1.38910.21Cropland
8Clay1.2811.211.74Fallow land
9Silty clay1.502527.11Sparse vegetation
10Clay1.456.74.95Bare land
11Clay1.3819.718.26Bare land
12Clay1.4541.438.65Bare land
13Clay1.4242.636.79Bare land
14clay1.6010.69.6Bare land
15Clay1.3516.617.65Sparse vegetation
16Silty1.555.85.36Bagh
17Sandy1.787.66Bagh
18Sandy1.727.39.45Bagh
19Sandy1.831.10.85Sand dune
20Silty1.99.88.26Bare land
21Silt Loam1.828.67.92Bare land
22Loam1.550.20.1Bare land
23Loam1.583.34.12Sparse vegetation
24Clay1.329.48.66Sparse vegetation
25Loam1.428.57.54Sparse vegetation
26Silty1.596.57.98Sparse vegetation
27Clay1.361011.25Sparse vegetation
28Loam1.622.61.85Sparse vegetation
29Loam1.531513.55Bare land
30Sandy1.652.71.75Sparse vegetation
31Clay1.2810.112.25Fallow land
32Clay1.315.64.8Plowed land
33Clay1.379.212.45Cropland
34Loam1.612.52.12Sparse vegetation
35Loam1.522.21.65Sparse vegetation
36Loam1.677.23.25Bagh
Table 2. Volumetric soil moisture vs. volumetric water content.
Soil Moisture Content (%)Water Volume (mL)
40157
3024
2041
1057

