Between Abundance and Constraints: The Natural Resource Equation of Asia’s Diverging, Higher-Income City Models

 , , and
Abstract
:1. Introduction
1.1. Resource Conditions as Determinants of Urban Form
1.2. Urban Form Impacting on Resource Consumption
1.3. Knowledge Gap and Study Aim
- How do natural resource conditions impact the urban forms of cities, how does the resultant urban spatial structure lead to different patterns of resource use and which urban form characteristics mediate the relationship between resource constraints and consumption?
- What are the variations in theoretical building cooling and transport energy demands resulting from different urban forms in the case study cities and to what degree are these aligned with actual empirical data on energy consumption in these cities?
- For the selected higher-income case study cities, is it possible to identify a basic “resource urbanisms” logic whereby resource constraints ultimately lead to better environmental sustainability outcomes?
2. Materials and Methods
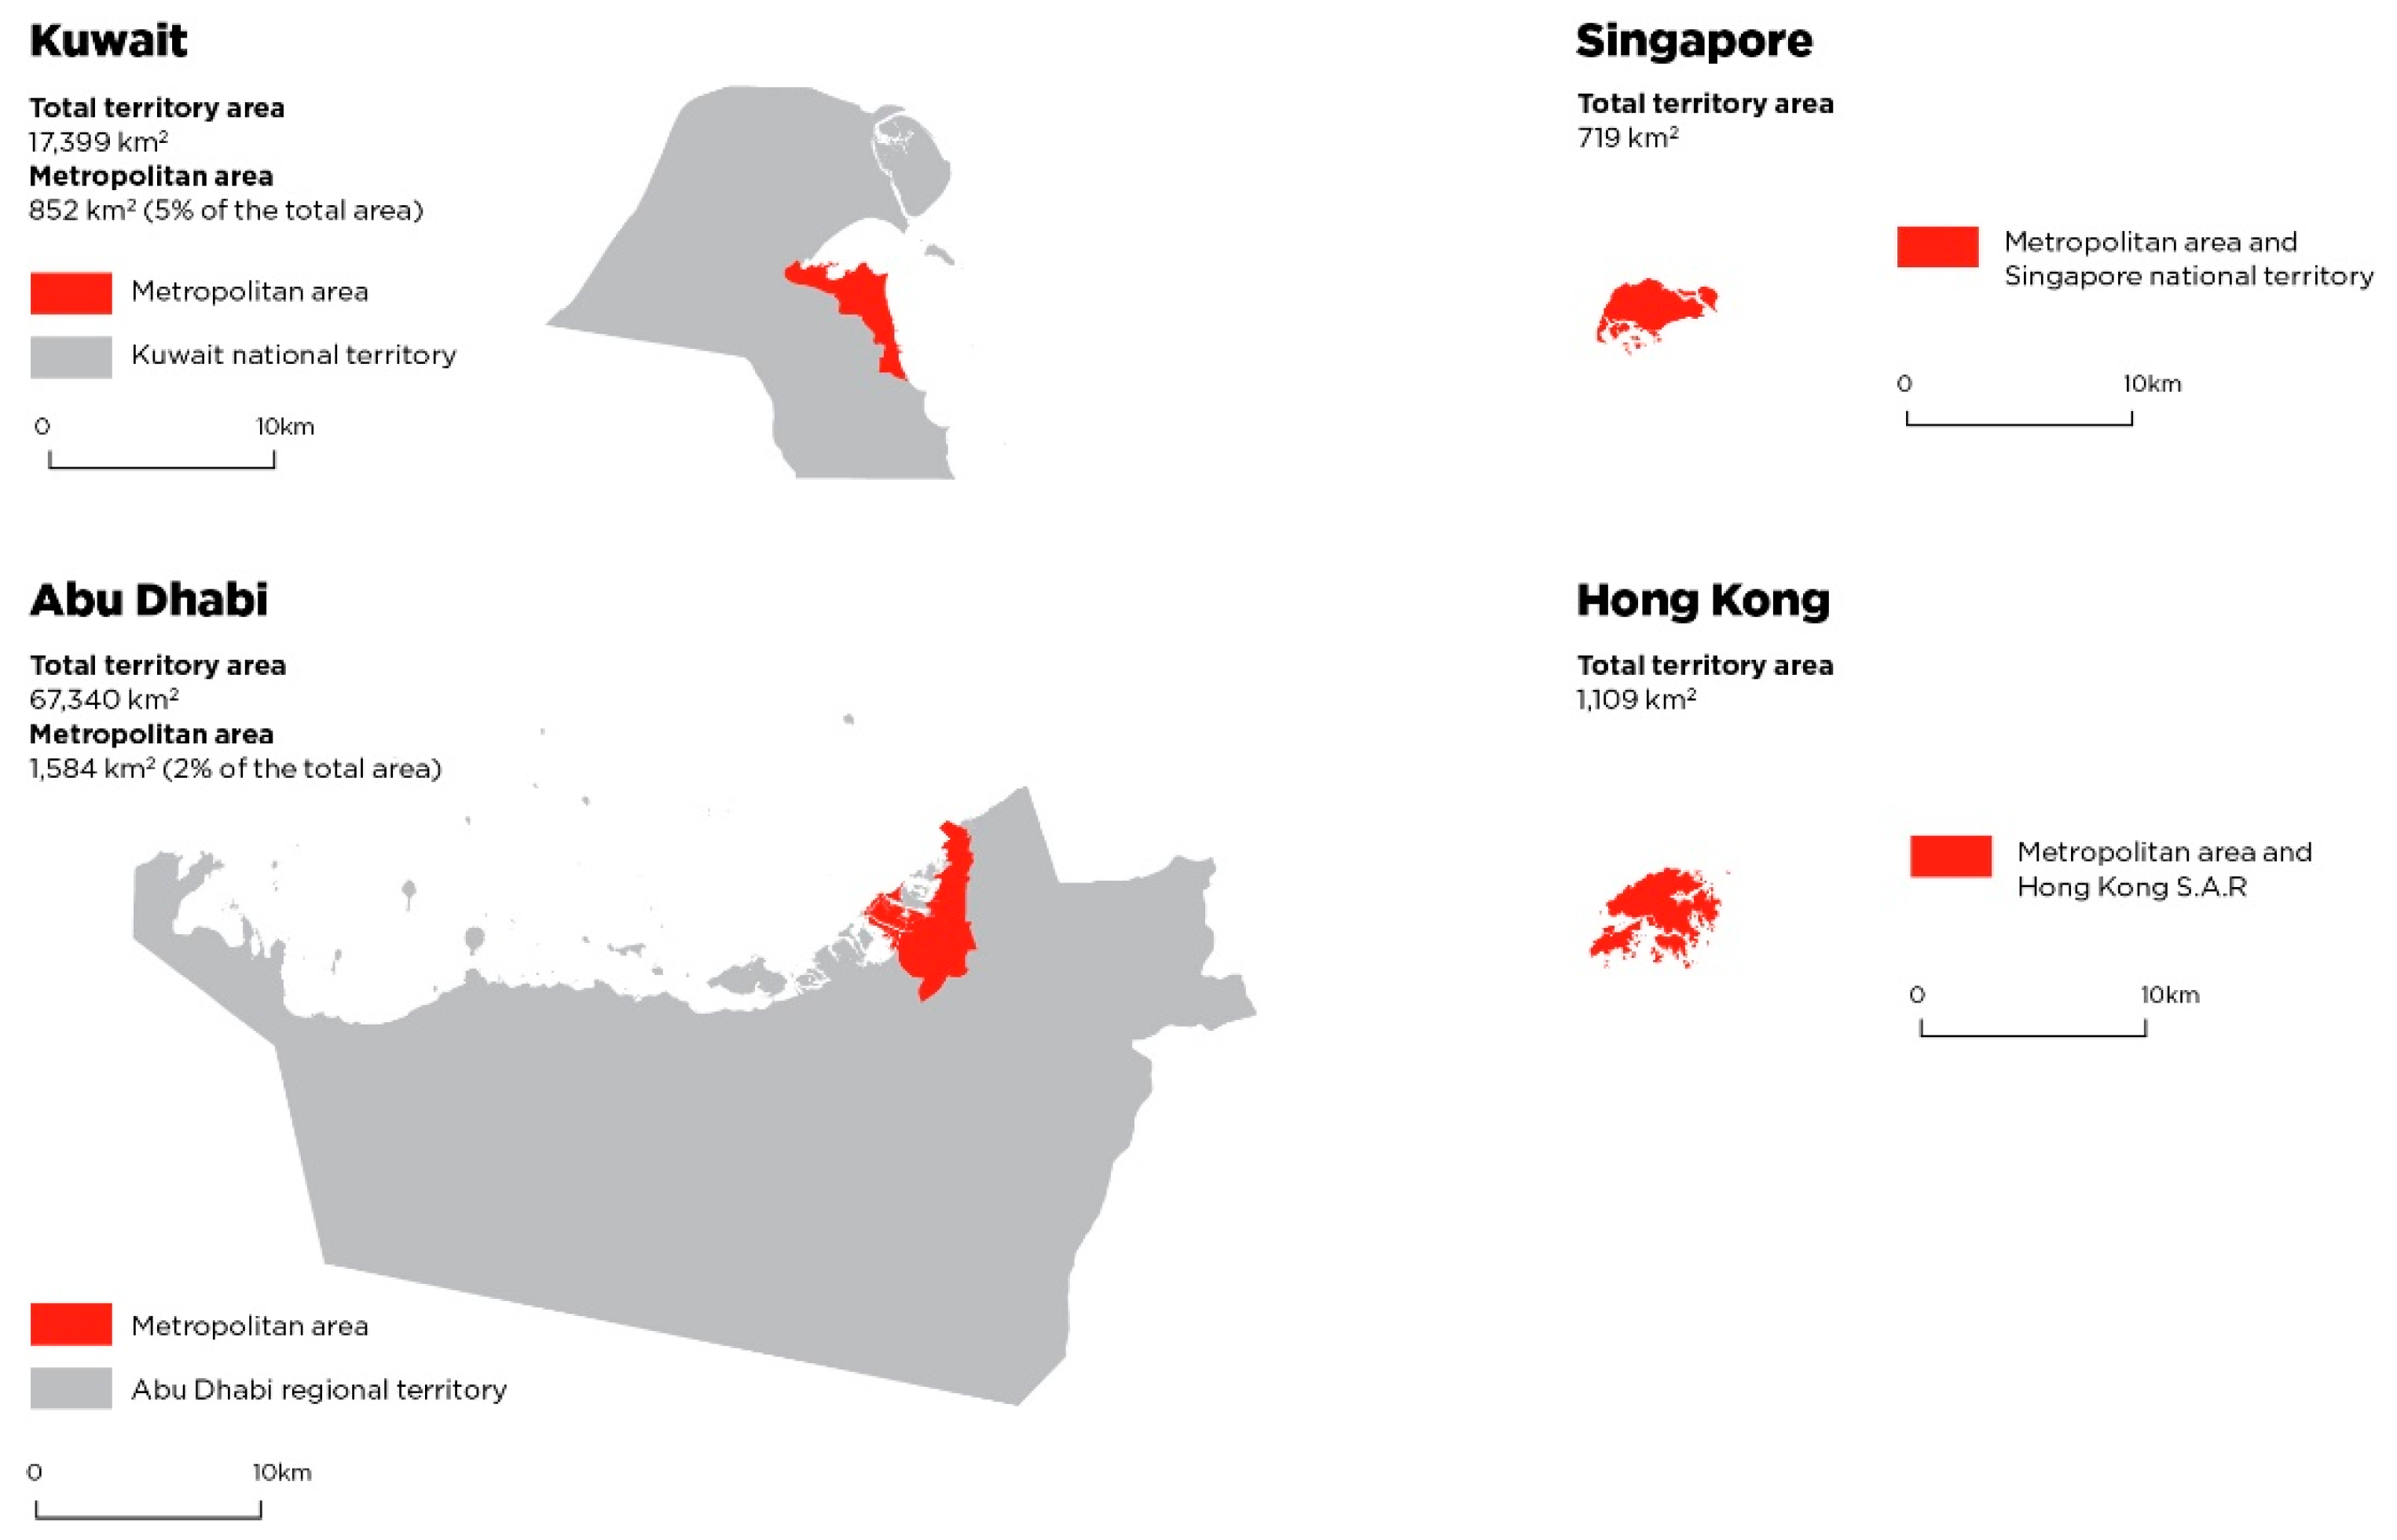
2.1. Case Study Cities
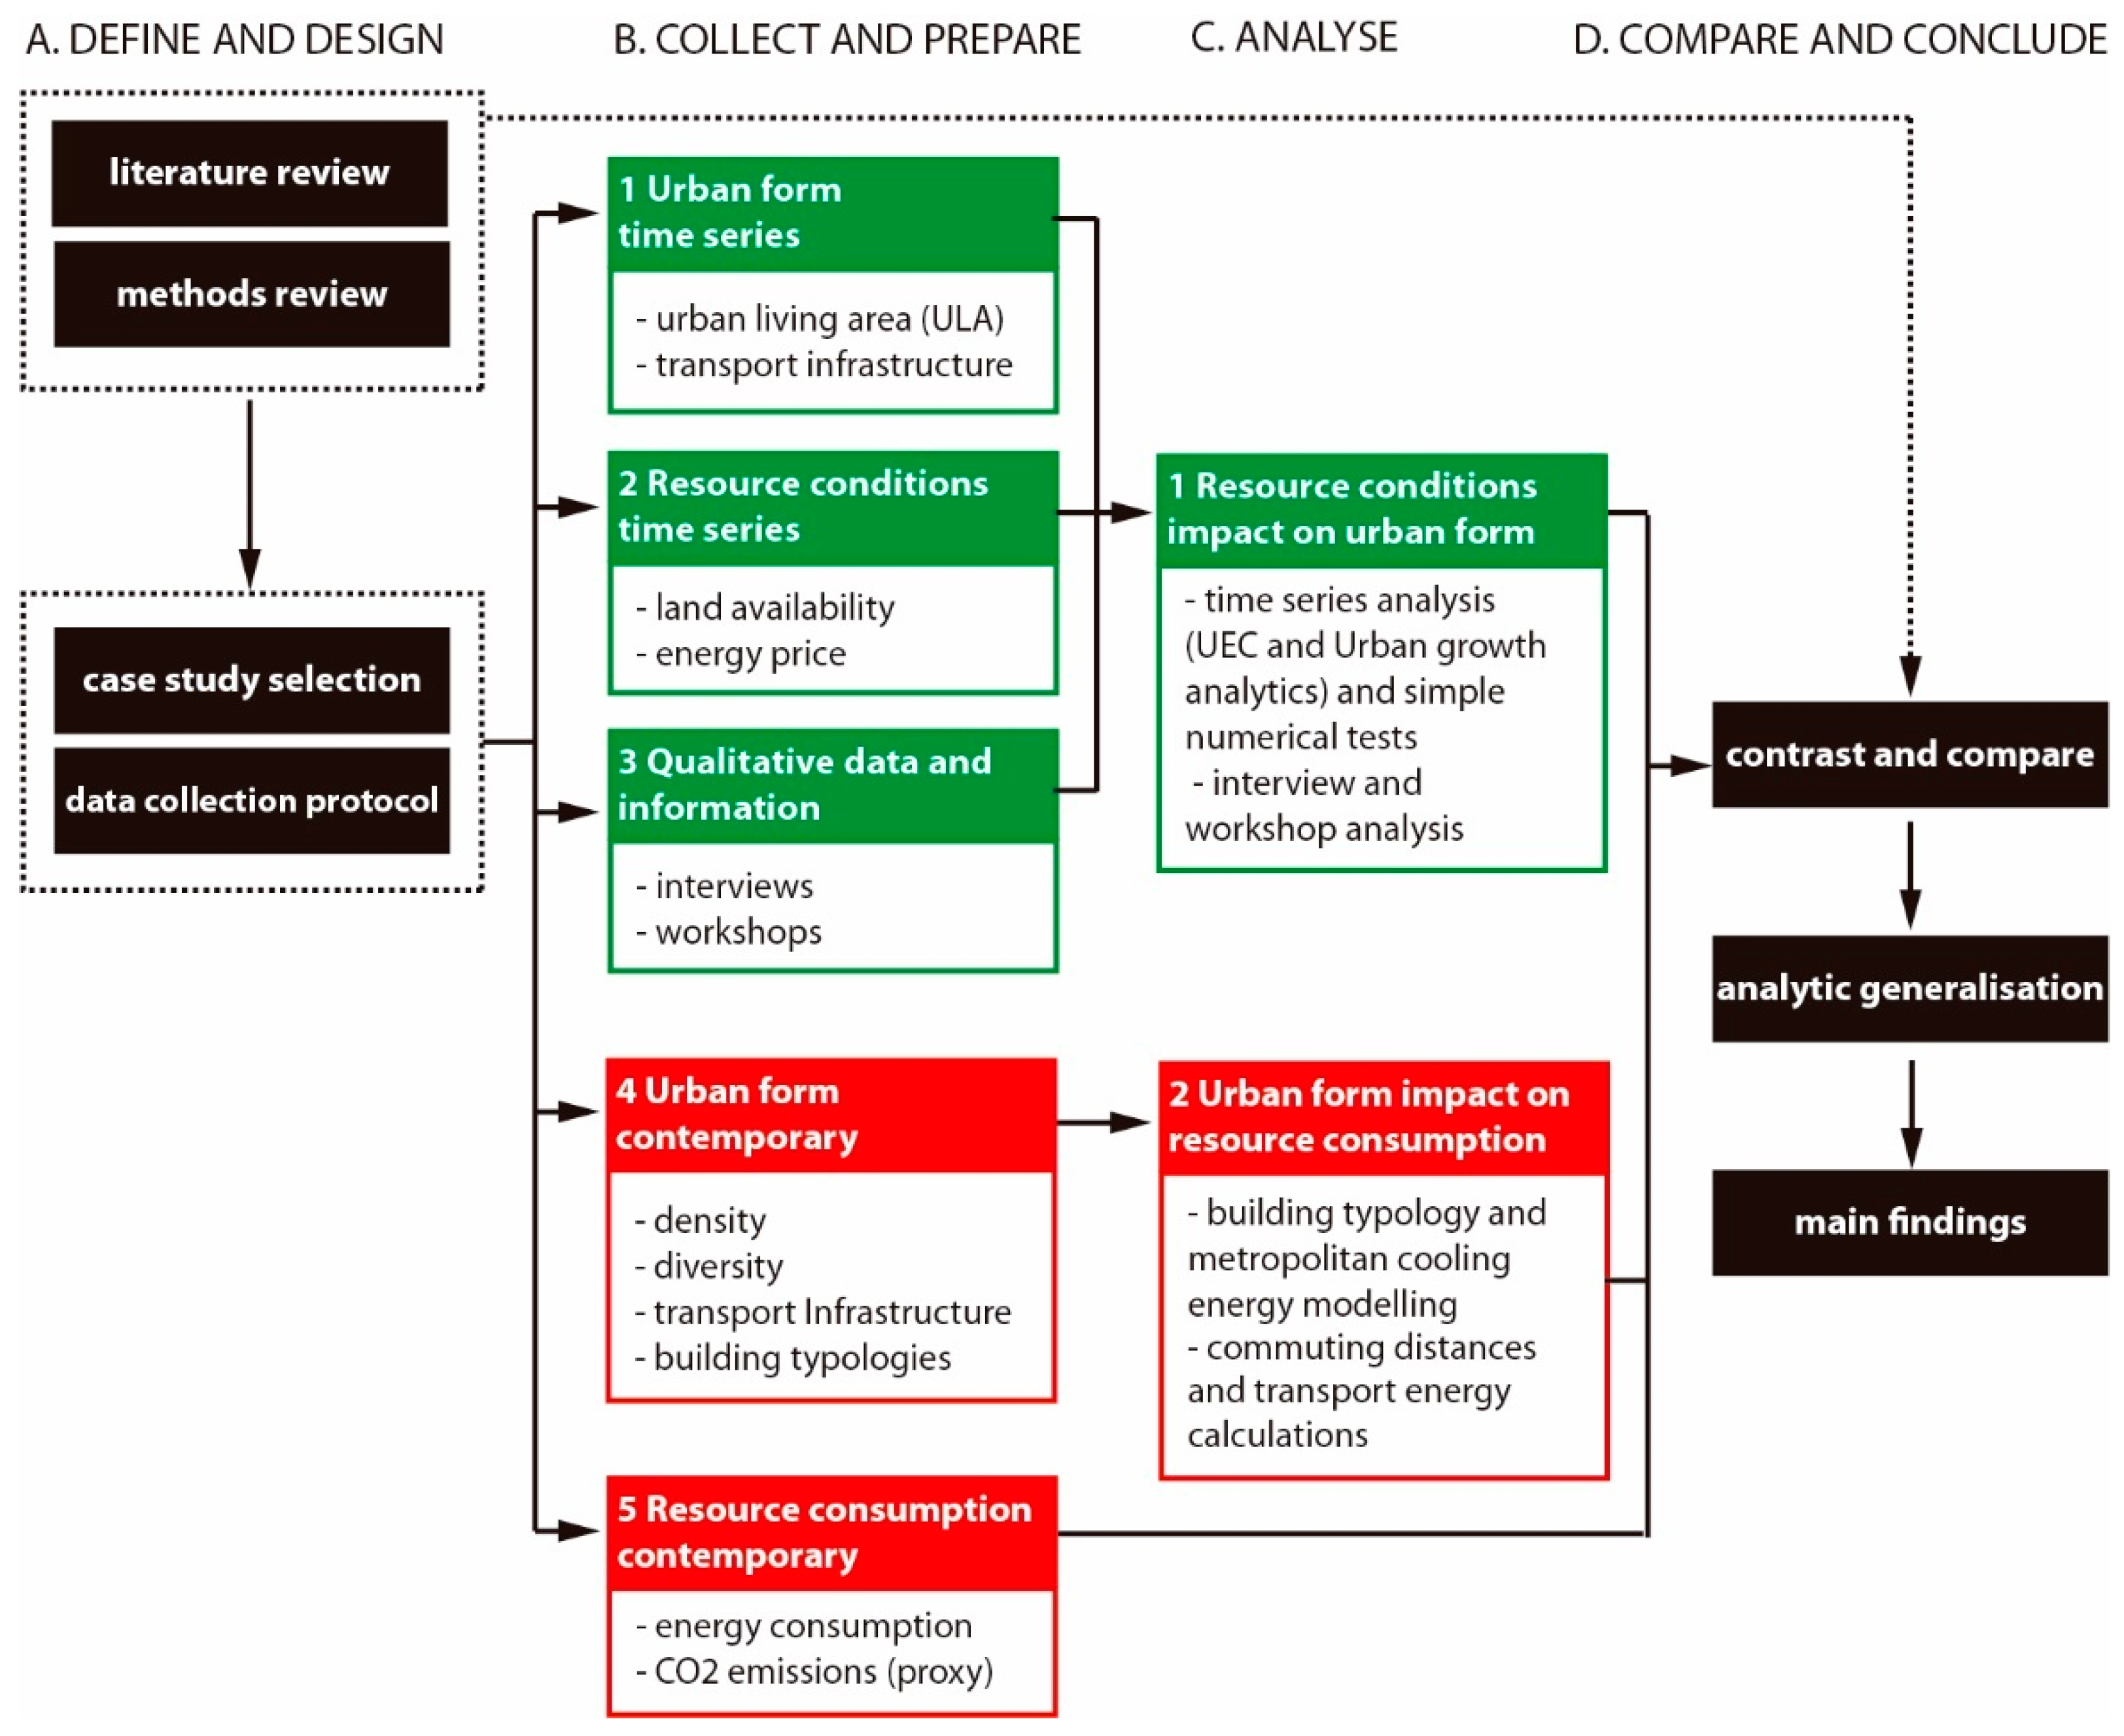
2.2. Establishing the Empirical Basis
2.3. Analysis
- Step 1, satellite image processing: Landsat ETM+ images were downloaded from the NASA’s Landsat database for the year 2015. A composite image was created after pan-sharpening of the downloaded image which enhanced the spatial resolution from 30 to 15m. The image was clipped to the study area boundary to save computation time and effort.
- Step 2, urban footprint delineation: built-up areas were identified from the imagery through the ArcGIS 9 tool “ISO cluster unsupervised classification” that uses ISO cluster and maximum likelihood classification algorithms. The identified built-up area classes were improved through visual inspection.
- Step 3, urban living area delineated from urban footprint: isolated roads and structures, such as containers or oil storage tanks, were erased from the identified built-up area pixels. Afterwards, all the built-up area polygons were aggregated within a distance threshold of 200 metres and enclosed open spaces which were smaller than 100,000 square metres in size were converted into urban areas through the GIS Spatial Analyst extension.
- and Heat transfer coefficient by transmission and ventilation [W/K];
- and Heat flows coefficient from internal sources and solar radiations [W];
- Set point temperature [°C];External temperature [°C];
- Total heat transfer (by transmission and ventilation) [kWh];
- Total heat gains (solar and internal gains) [kWh]; t Time step [h];
- Utilization factor for heat losses [-];
- Utilization factor for heat gains [-];
- Energy need for the continuous cooling mode [kWh];
- Energy need for the continuous heating mode [kWh]
3. Results
3.1. Contemporary Urban Form in the Case Study Cities
3.2. From Resource Conditions to Urban Form
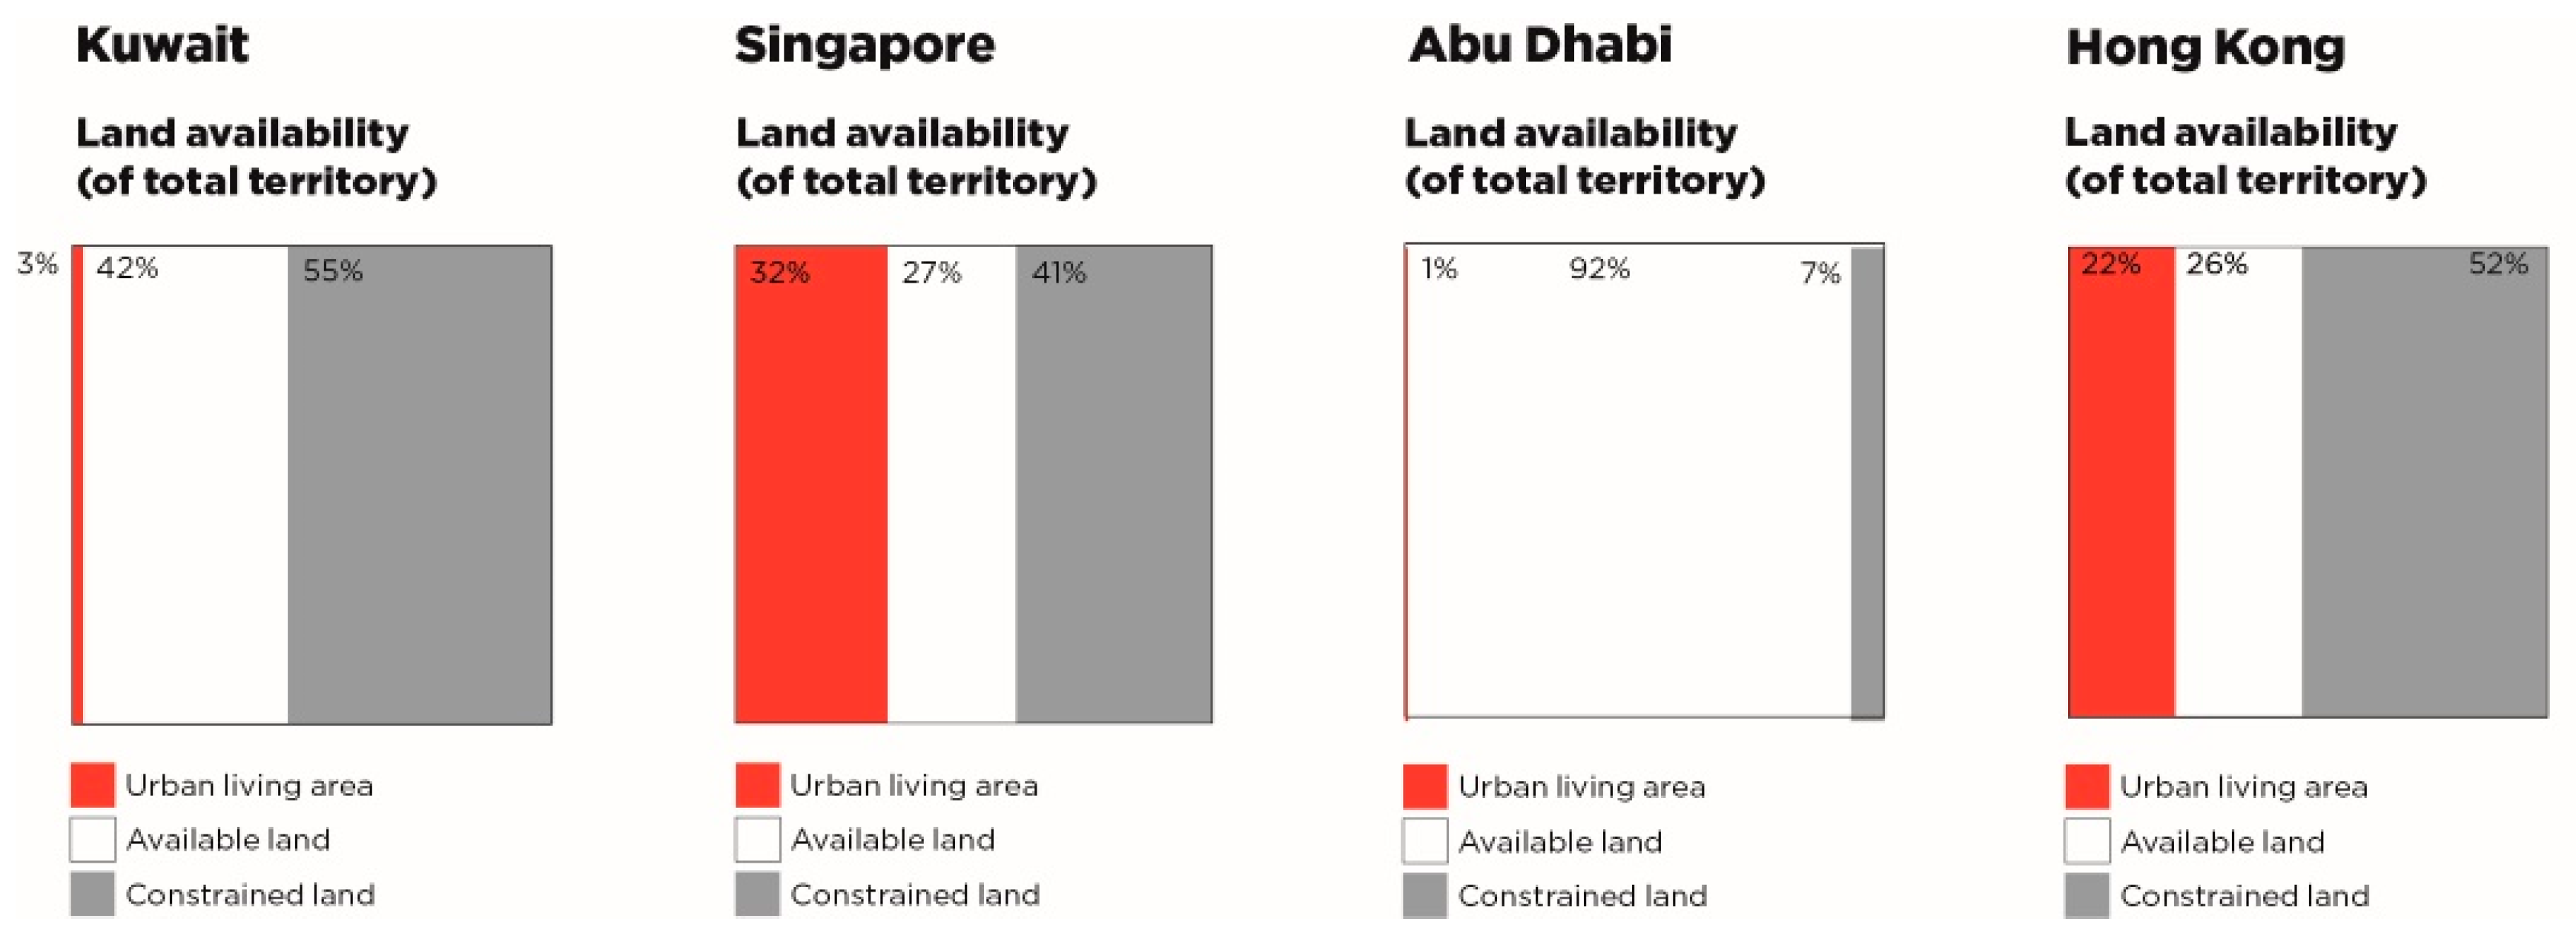
3.2.1. Land Availability and Urban Growth
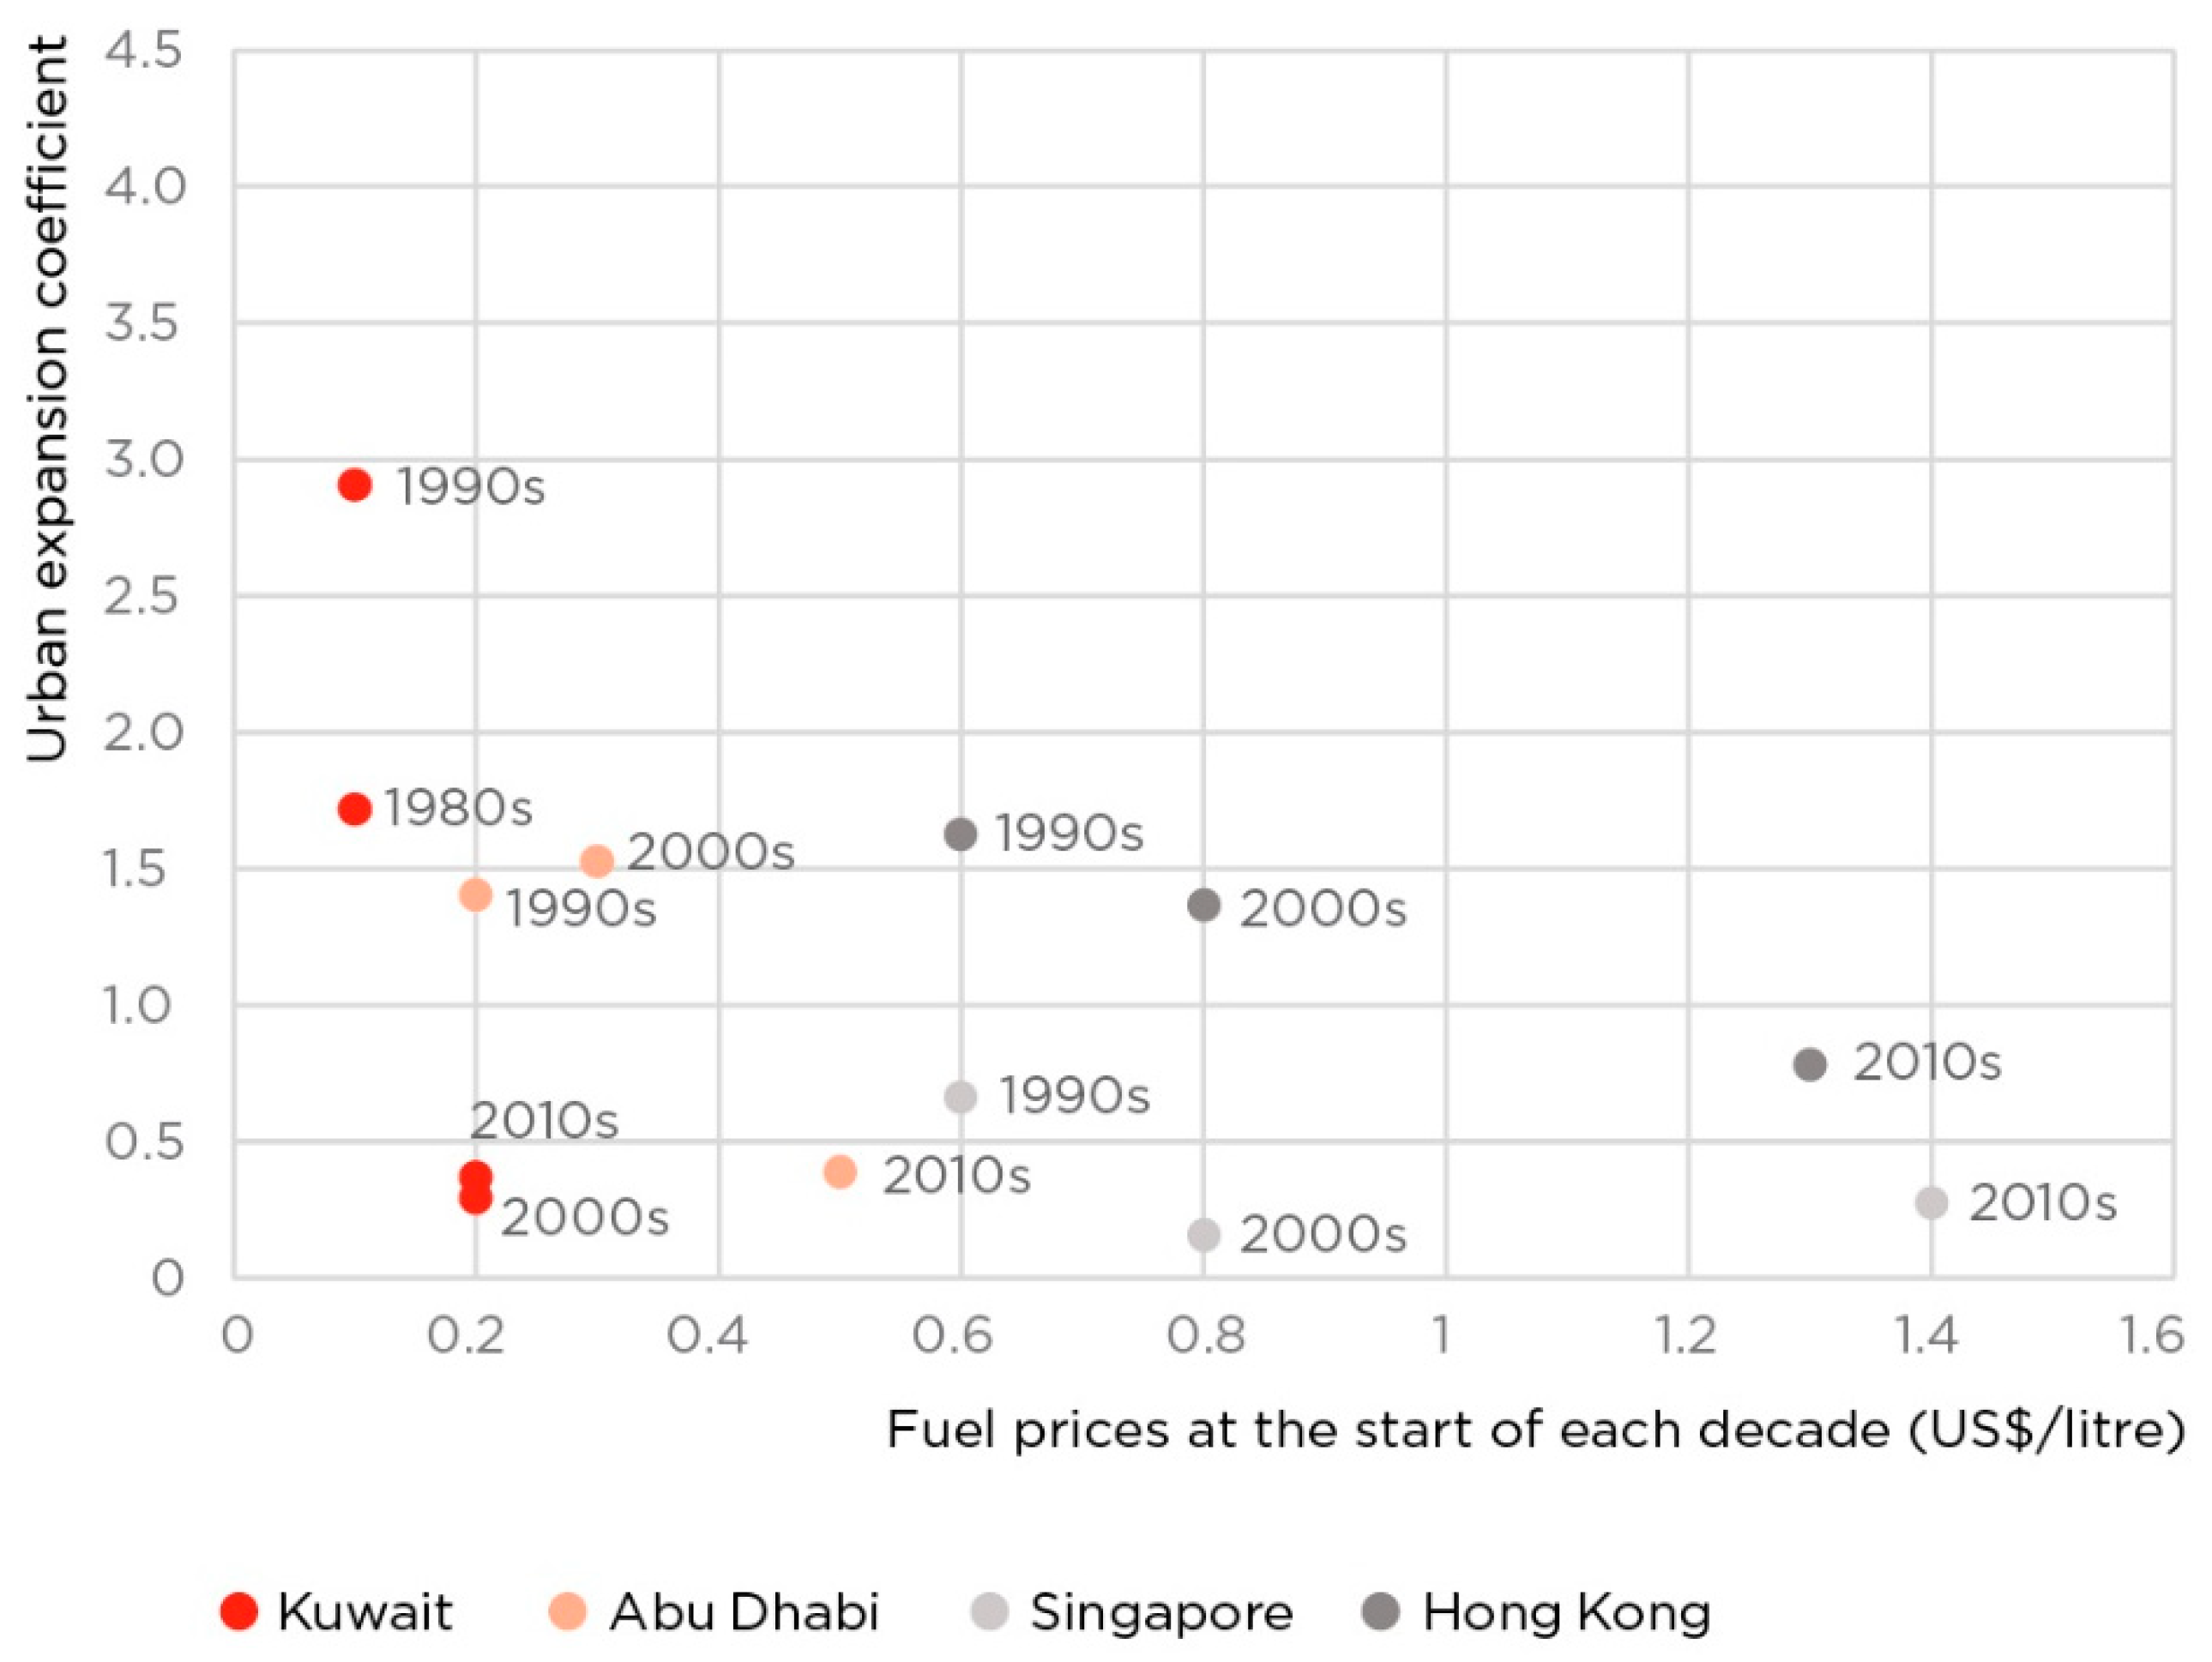
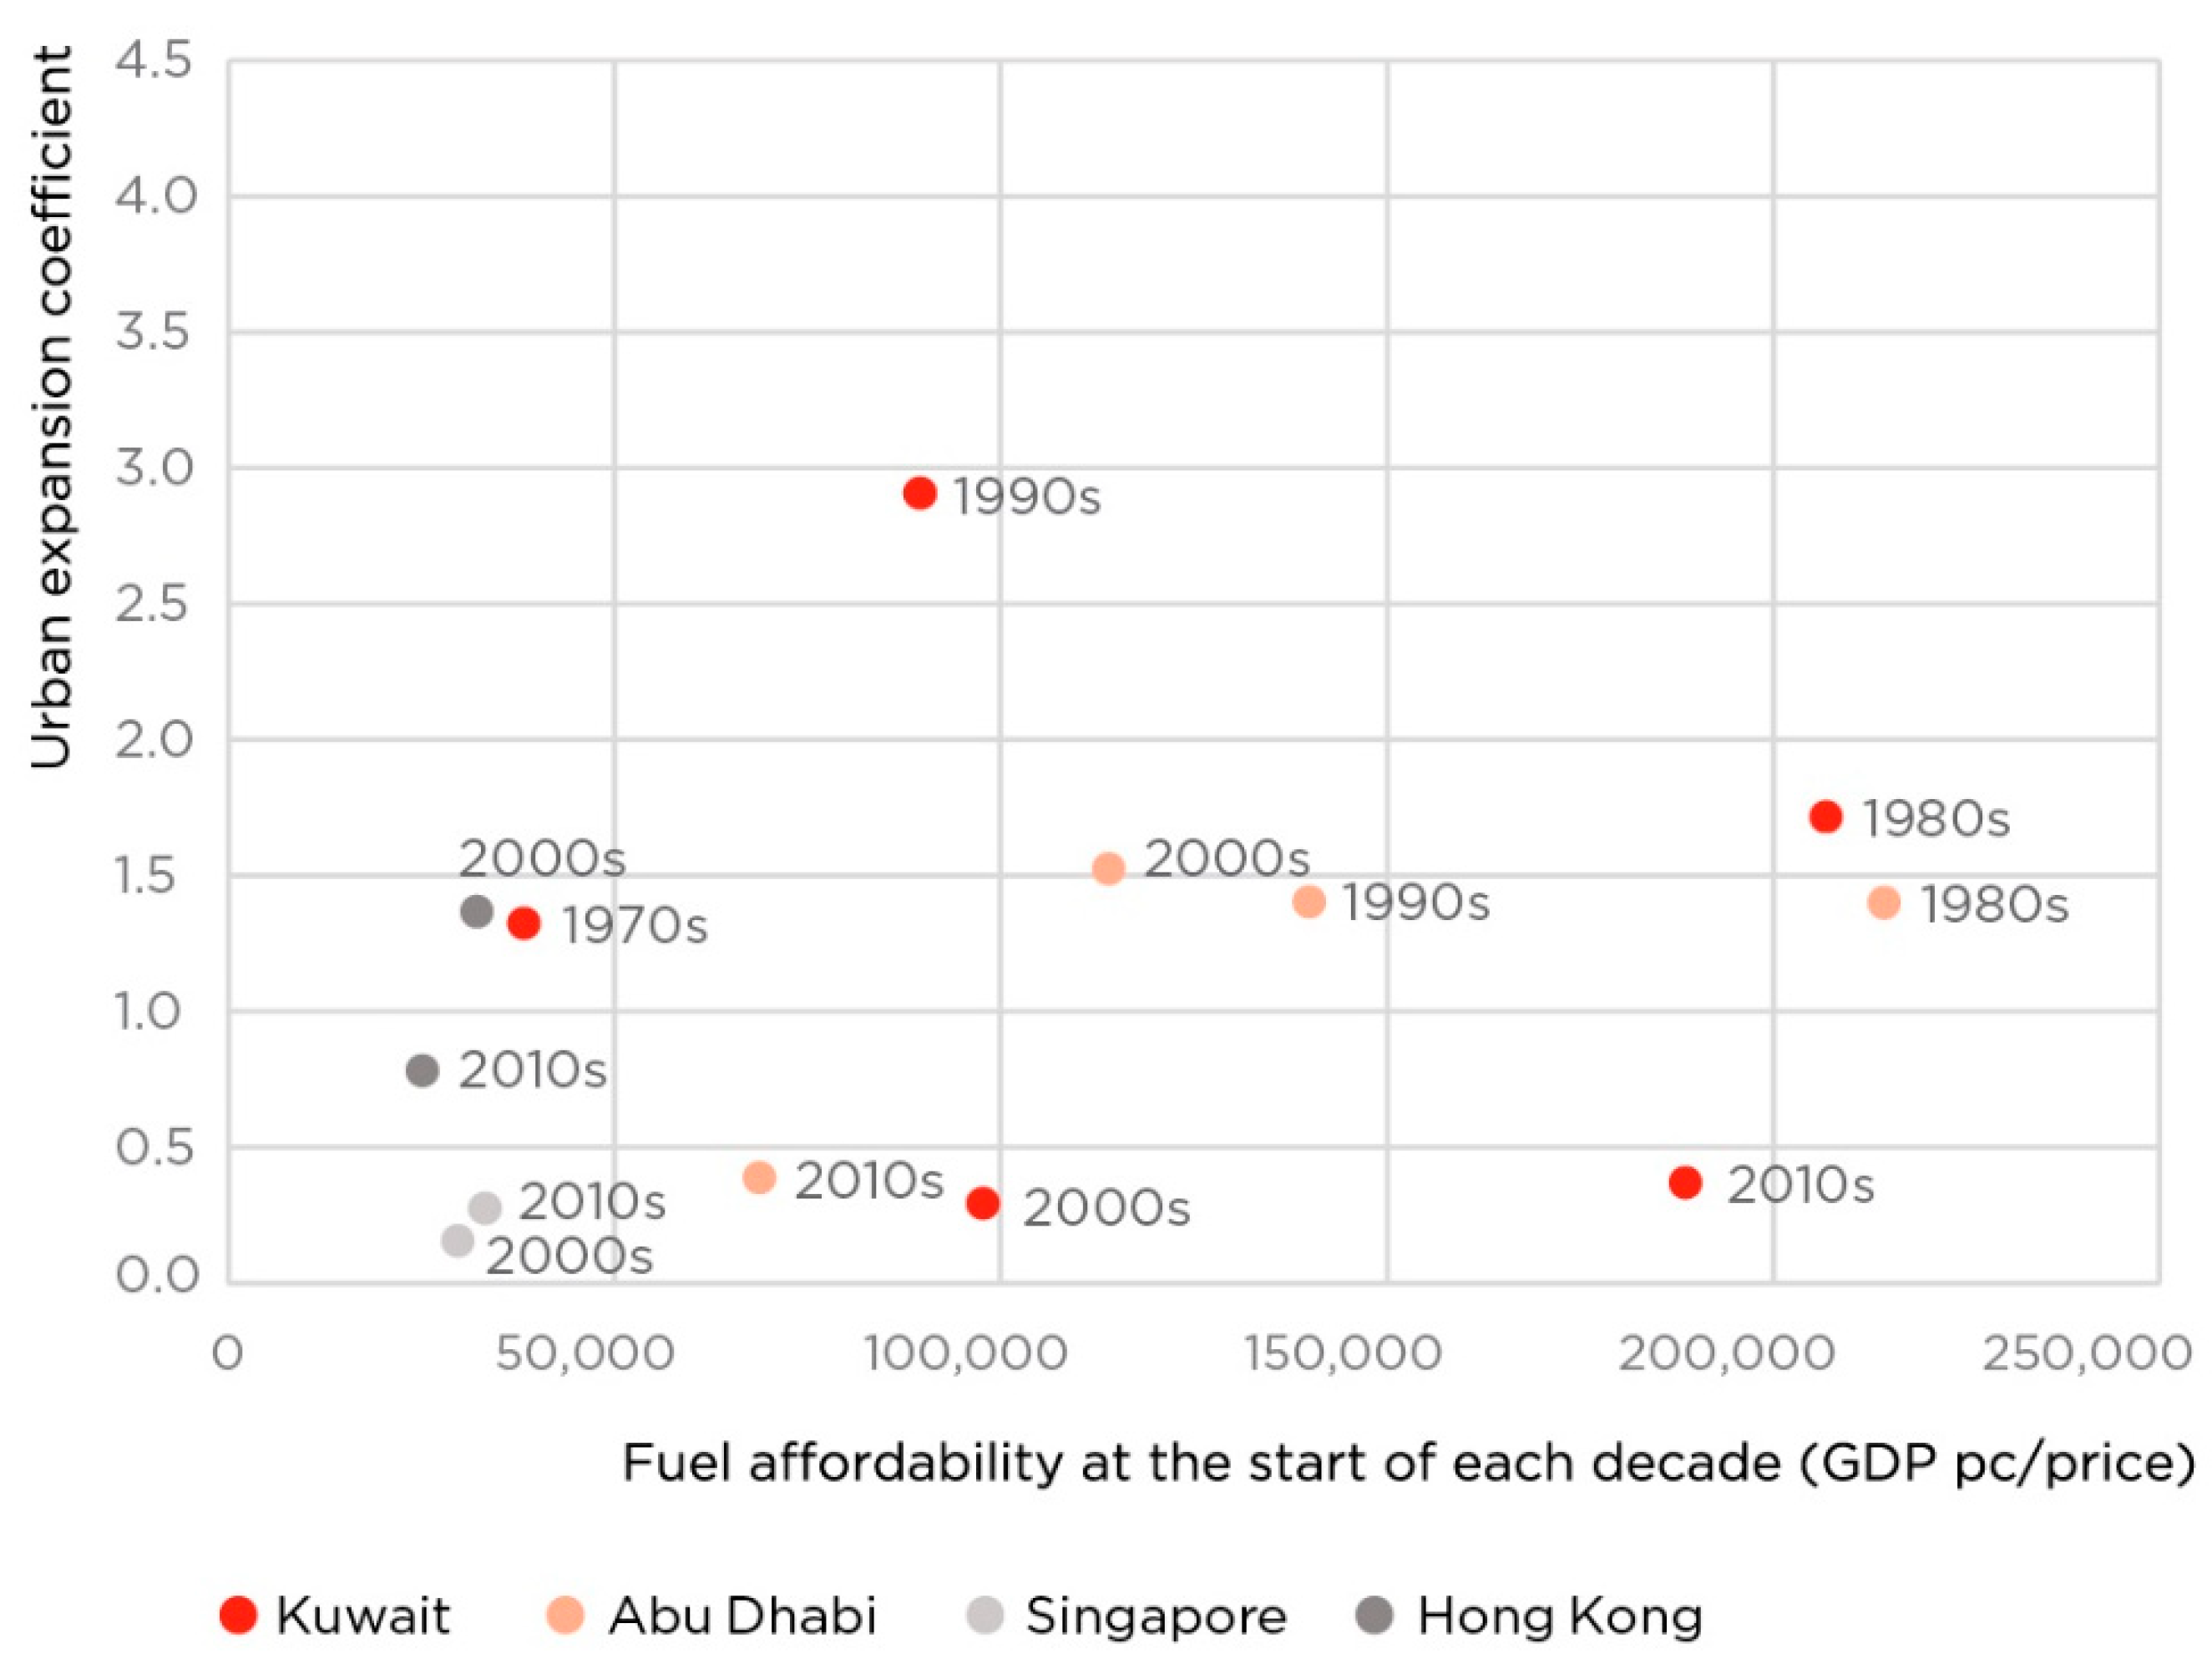
3.2.2. Energy Affordability and Urban Growth
3.3. From Urban Form to Resource Consumption
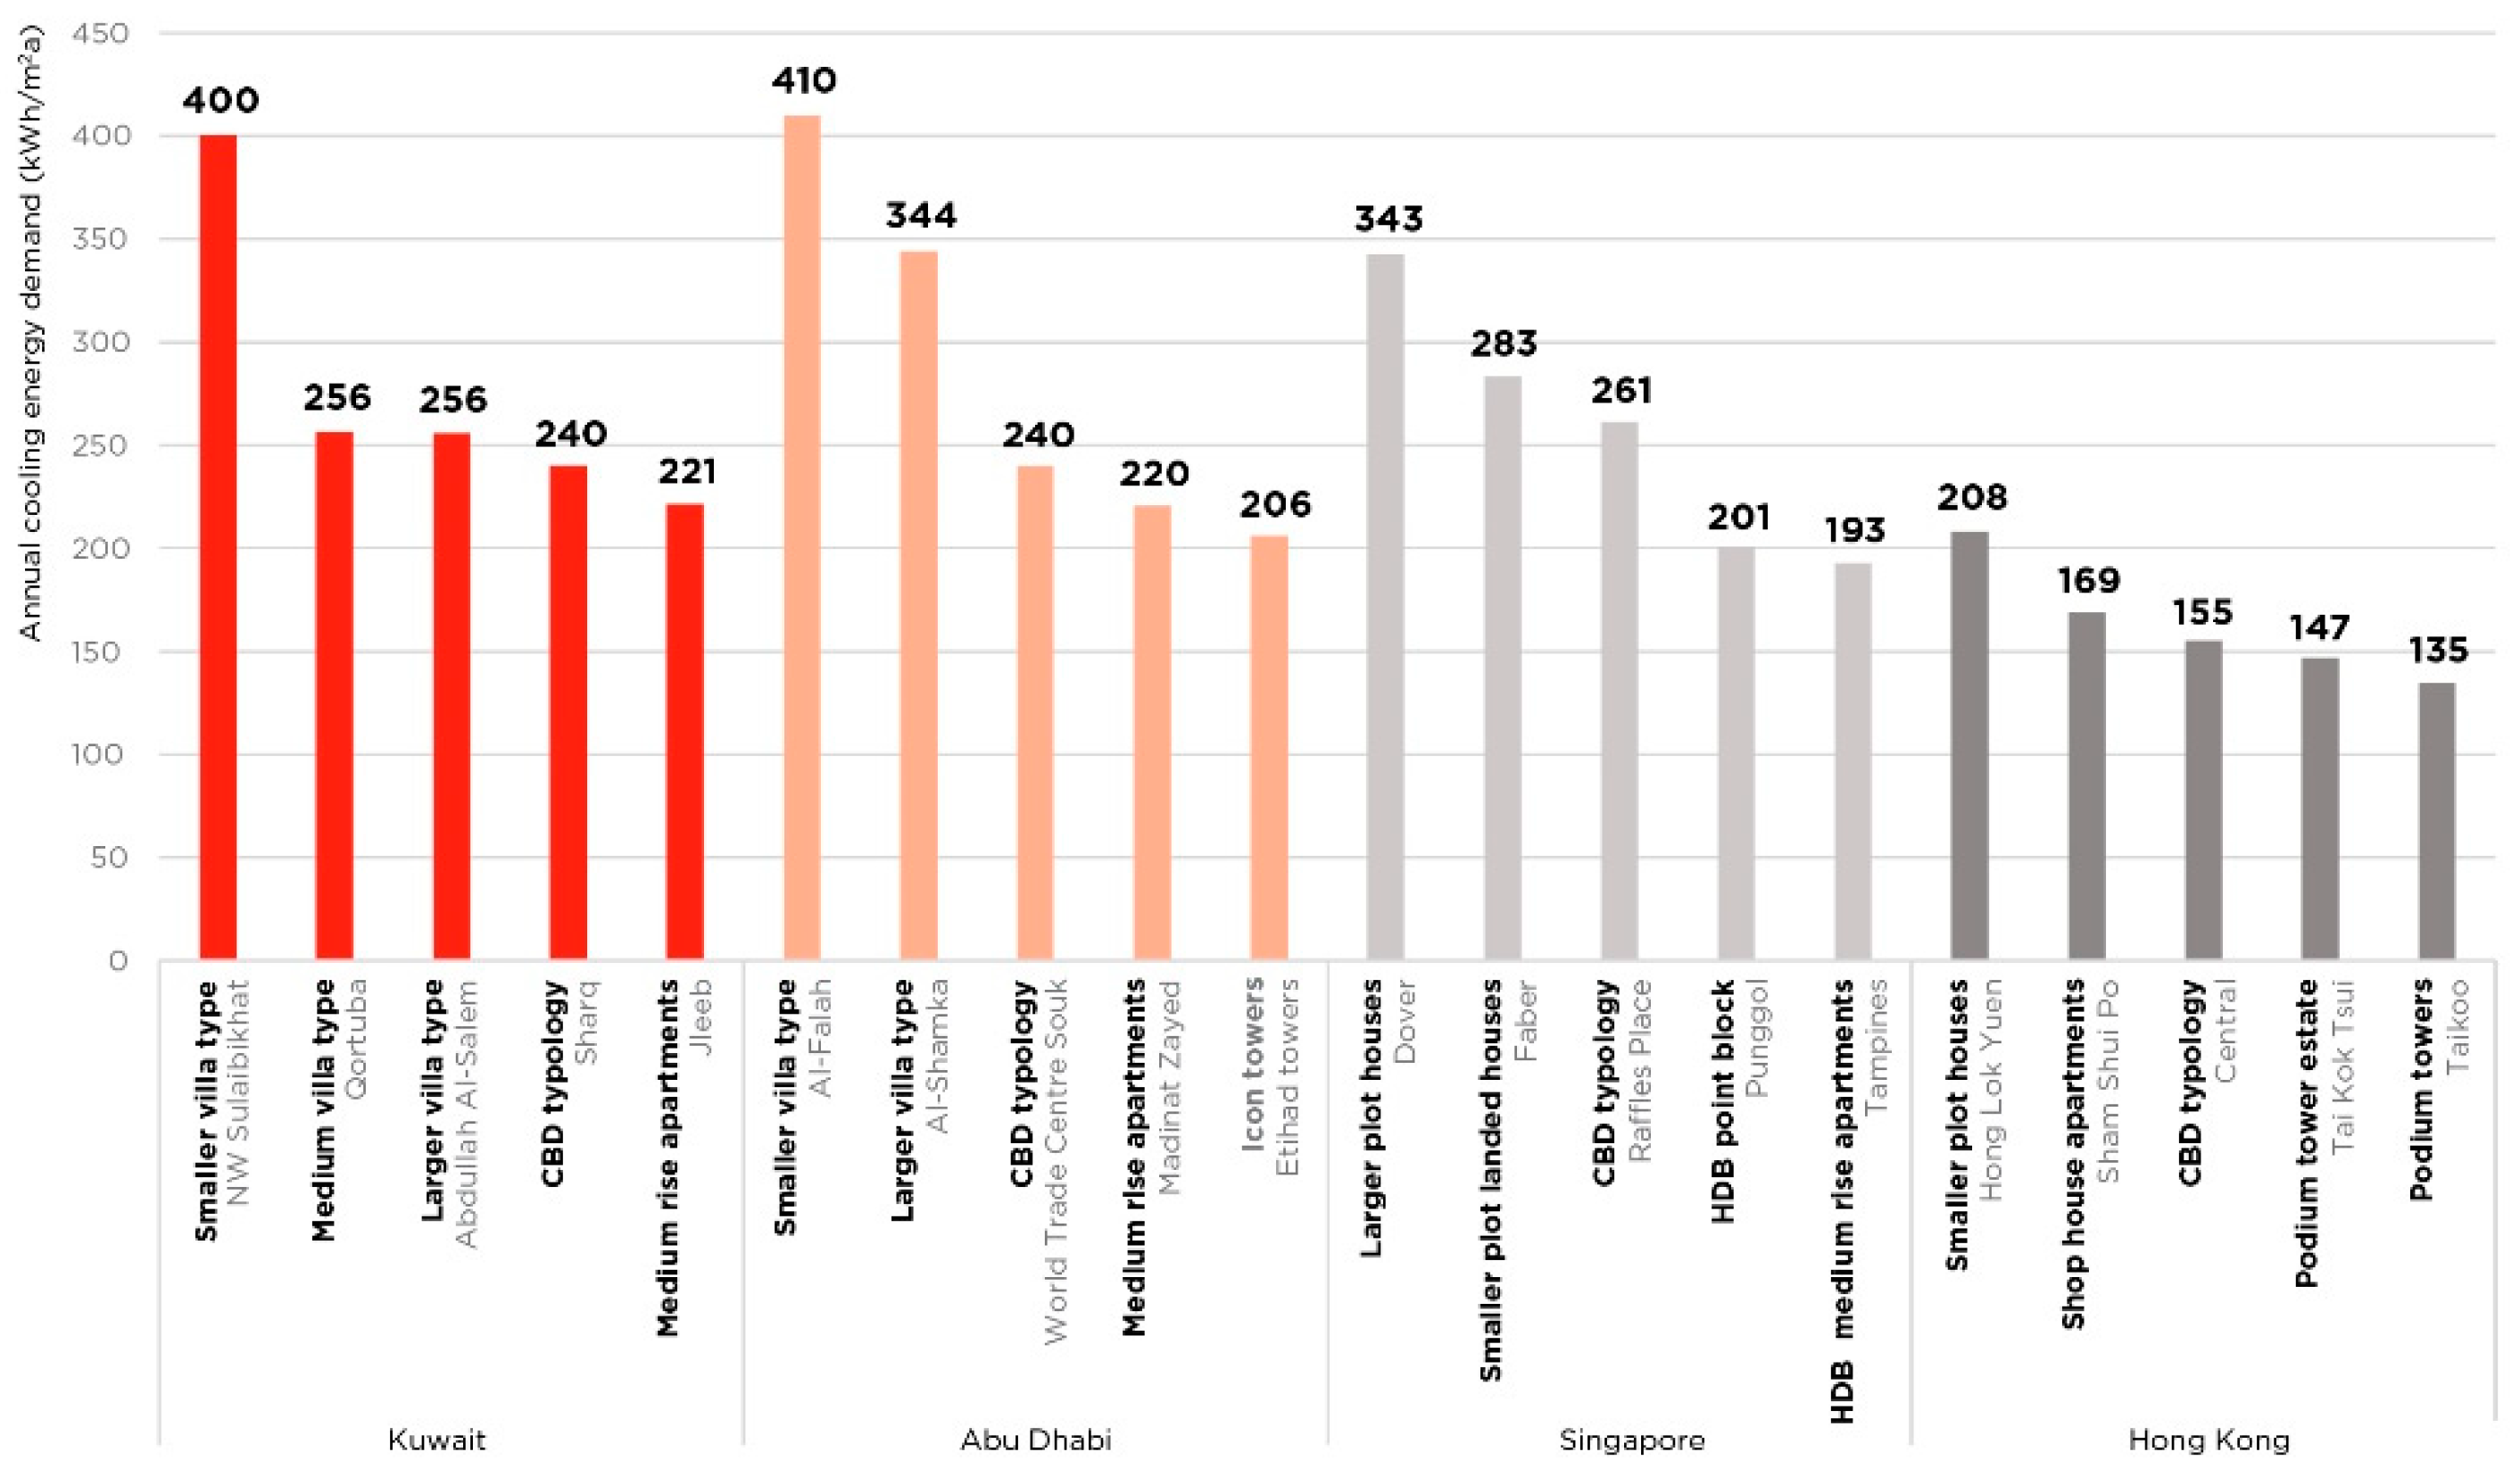
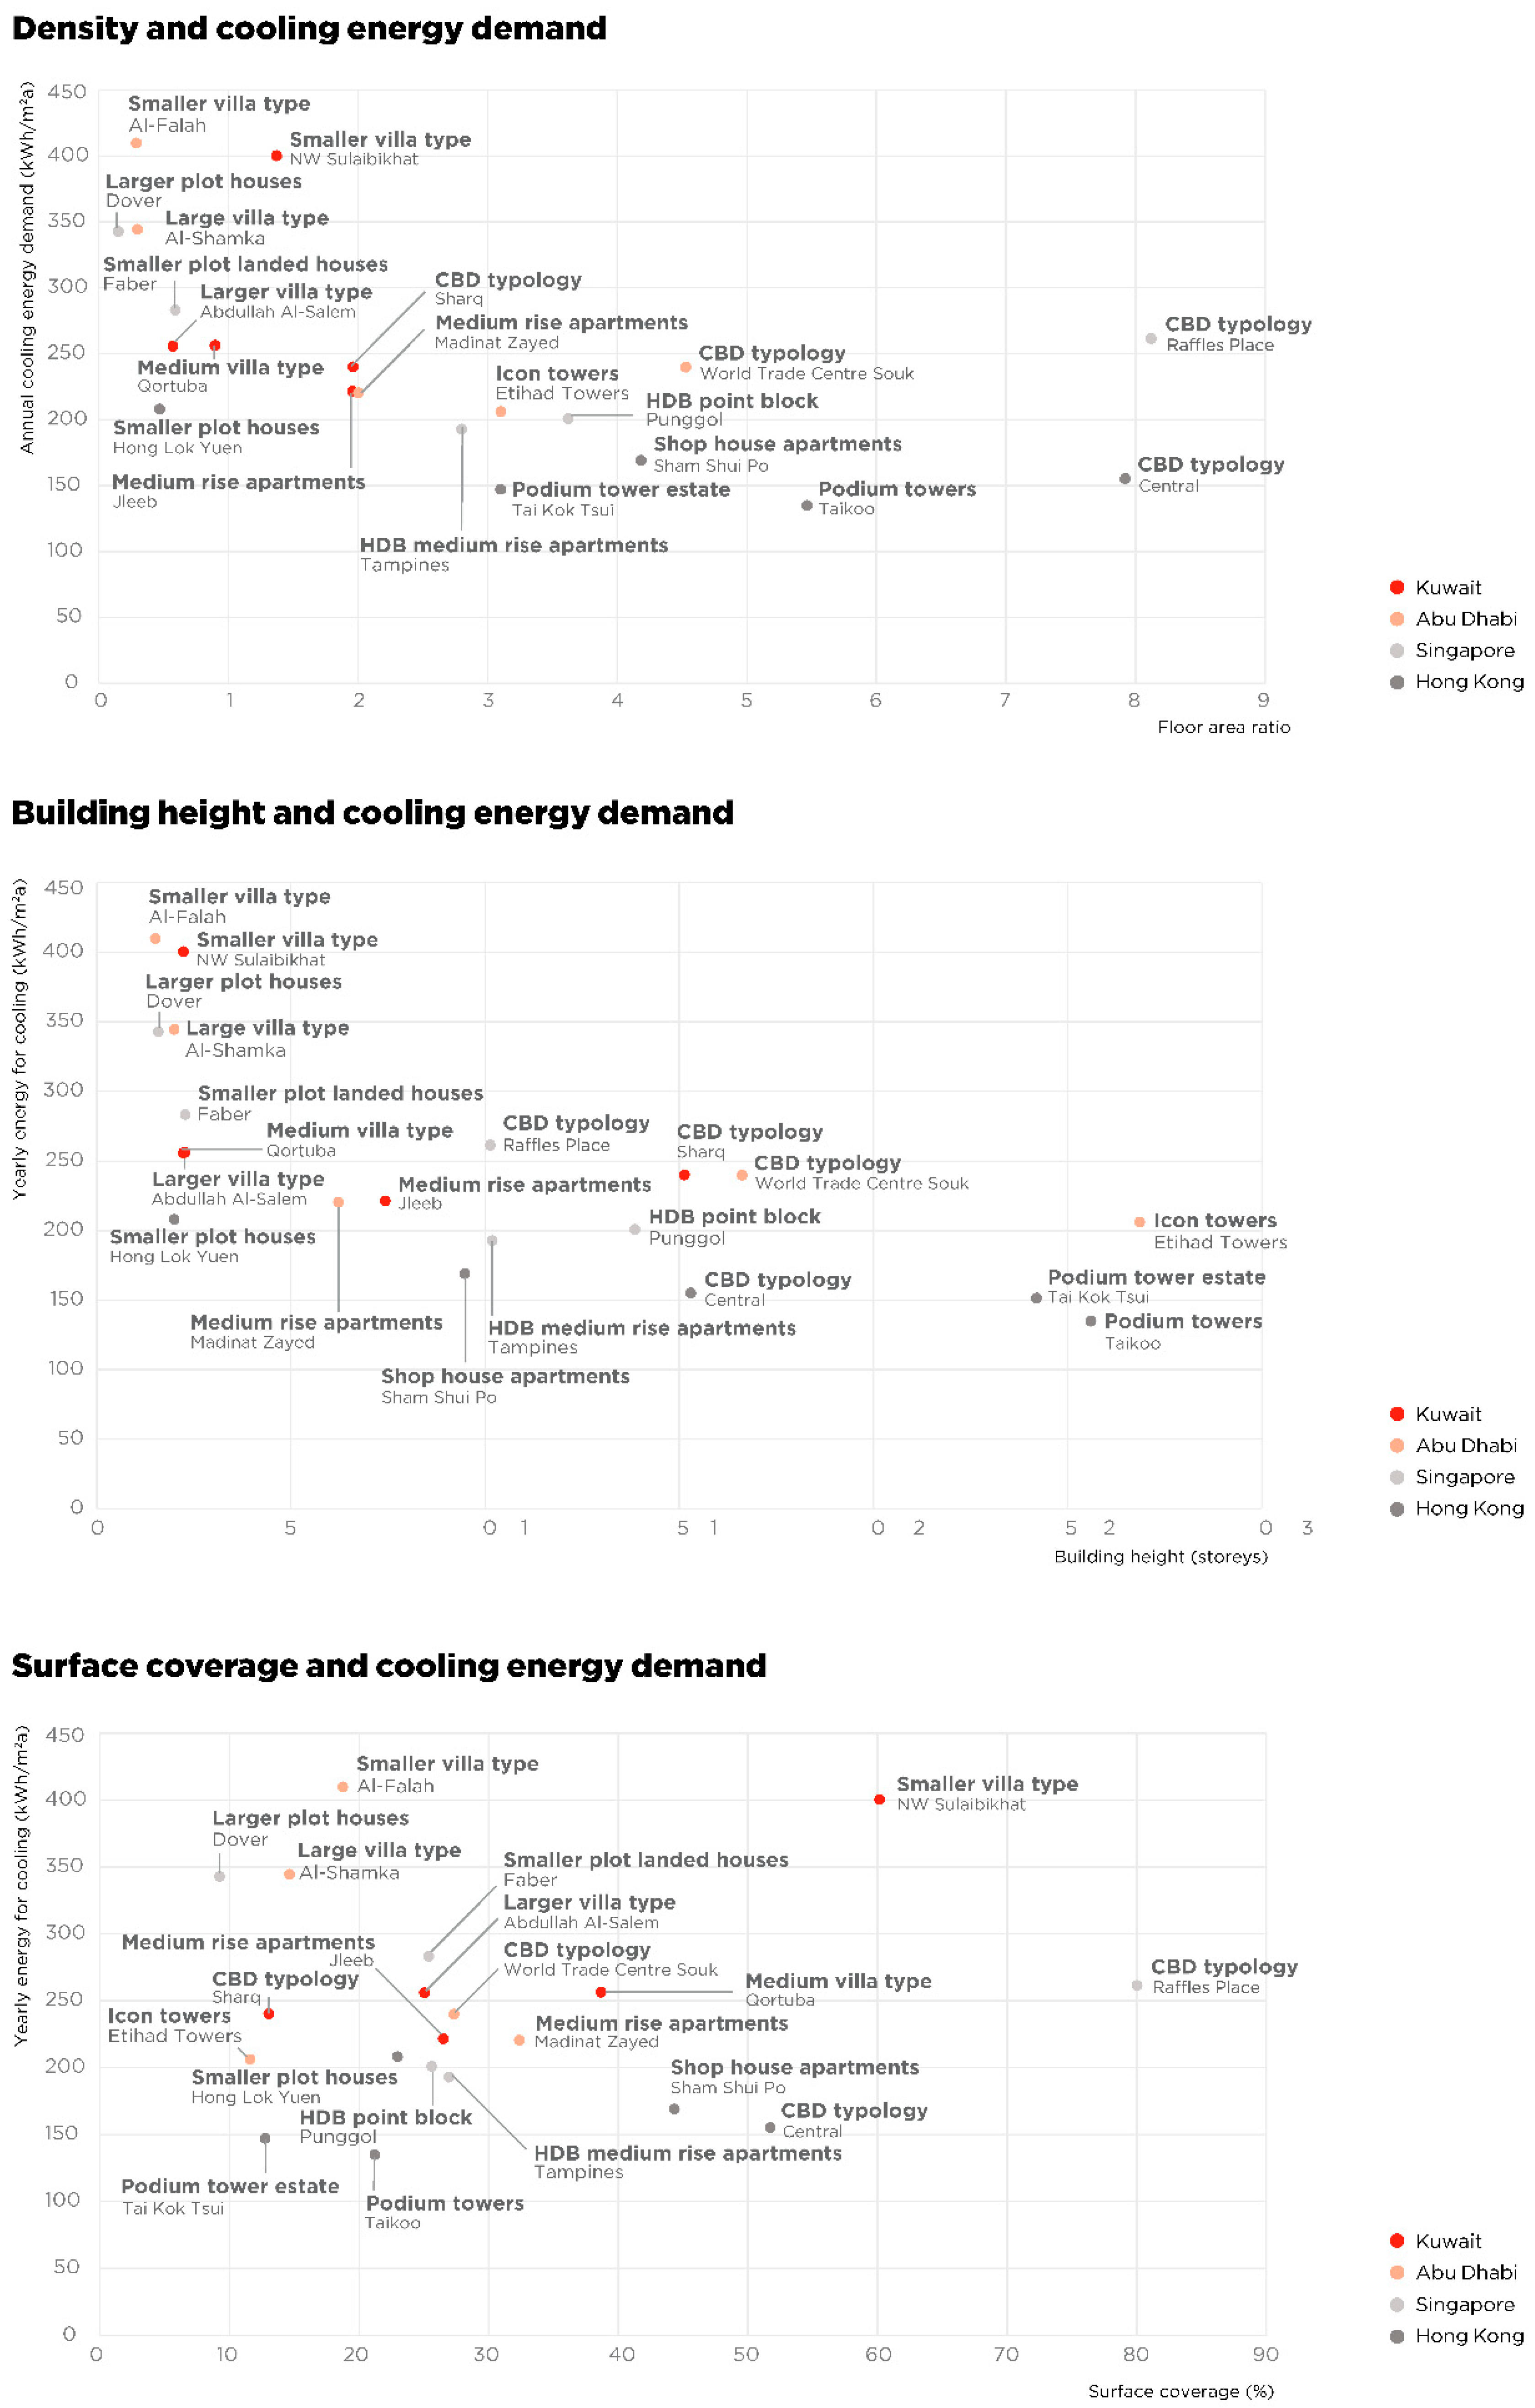
3.3.1. Cooling Energy Demand Induced by Urban Morphologies
3.3.2. Transport Energy Demand Induced by Urban Accessibility
4. Discussion
5. Conclusions
Author Contributions
Funding
Acknowledgments
Conflicts of Interest
Appendix A

| Year | Kuwait | Abu Dhabi | Singapore | Hong Kong |
|---|---|---|---|---|
| pre 1950s | 1931 | - | 1929; 1945 | 1931 |
| 1950s | 1951 | 1949 | 1954 | 1945 |
| 1960s | 1963 | 1960; 1969 | 1969 | - |
| 1970s | 1977 | - | 1978 | 1971 |
| 1980s | 1982; 1986 | 1982; 1986 | 1983 | 1981 |
| 1990s | 1990 | 1990 | 1991 | 1992 |
| 2000s | 2000; 2006 | 2000; 2006 | 2000; 2006 | 2000; 2006 |
| 2010s | 2015 | 2015 | 2015 | 2015 |
| Data type legend (colours): | Paper maps | Aerial photographs | Satellite images | N/A not available |
| Term 1 | Term 2 | Google Scholar | Web of Science | ||
|---|---|---|---|---|---|
| Upstream | |||||
| 1 | Urban form | Resource conditions | 90 | 0 | |
| 2 | Energy price | 710 | 0 | ||
| 3 | Fuel price | 1220 | 3 | ||
| 4 | Road infrastructure | 4150 | 6 | ||
| 5 | Land availability | 1920 | 4 | ||
| 6 | Petrol affordability | 1 | 0 | ||
| 7 | Land scarcity | 690 | 1 | ||
| 8 | Land constraints | 293 | 0 | ||
| 9 | Resource abundance | 80 | 0 | ||
| 10 | Oil based economy | 103 | 0 | ||
| 11 | Oil availability | 37 | 0 | ||
| 12 | Fuel affordability | 5 | 0 | ||
| 13 | Fuel costs | 1540 | 3 | ||
| 14 | Infrastructure investments | 3610 | 9 | ||
| 15 | Oil endowments | 1 | 0 | ||
| Total results | 14,450 | 26 | |||
| Downstream | |||||
| 1 | Urban form | Energy consumption | 18,800 | 282 | |
| 2 | Resource Impact | 285 | 1 | ||
| 3 | Carbon emissions | 7690 | 74 | ||
| 4 | Resource use | 4310 | 11 | ||
| 5 | Energy demand | 6100 | 60 | ||
| 6 | Environmental sustainability | 11,000 | 38 | ||
| 7 | Energy efficiency | 12,500 | 97 | ||
| 8 | Resource consumption | 3040 | 14 | ||
| 9 | Land consumption | 3110 | 16 | ||
| 10 | Oil consumption | 819 | 1 | ||
| 11 | Energy use | 13,900 | 162 | ||
| 12 | CO2 emissions | 6690 | 144 | ||
| 13 | Resource efficiency | 1930 | 5 | ||
| Total results | 90,174 | 905 |
References
- Steemers, K. Urban Form and Energy Use. In Cities for the New Millennium; Spon Press: London, UK; New York, NY, USA, 2001; pp. 115–124. ISBN 978-0-415-23183-1. [Google Scholar]
- Girardet, H. The Metabolism of Cities. In The Sustainable Urban Development Reader; Routledge: London, UK, 2004; pp. 125–132. [Google Scholar]
- Kenworthy, J.R. The eco-city: Ten key transport and planning dimensions for sustainable city development. Environ. Urban. 2006, 18, 67–85. [Google Scholar] [CrossRef]
- Newman, P. The environmental impact of cities. Environ. Urban. 2006, 18, 275–295. [Google Scholar] [CrossRef]
- Swilling, M.; Robinson, B.; Marvin, S.; Hodson, M. City-Level Decoupling: Urban Resource Flows and the Governance of Infrastructure Transitions; A Report of the Working Group on Cities of the International Resource Panel; UNEP International Resource Panel: Paris, France, 2013. [Google Scholar]
- Ahlfeldt, G.; Pietrostefani, E. Demystifying Compact Urban Growth: Evidence from 300 Studies from across the World; The New Climate Economy: London, UK; Washington, DC, USA, 2017; pp. 1–84. [Google Scholar]
- Brenner, N. Debating planetary urbanization: For an engaged pluralism. Environ. Plan. D 2018, 36, 570–590. [Google Scholar] [CrossRef] [Green Version]
- Ruddick, S.; Peake, L.; Tanyildiz, G.S.; Patrick, D. Planetary urbanization: An urban theory for our time? Environ. Plan. D 2017, 36, 387–404. [Google Scholar] [CrossRef]
- DeLaurentis, D.; Callaway, R.K. “CAB” A System-of-Systems Perspective for Public Policy Decisions. Rev. Policy Res. 2004, 21, 829–837. [Google Scholar] [CrossRef]
- Batty, M. Complexity in city systems: Understanding, evolution, and design. In A Planner’s Encounter with Complexity; Routledge: London, UK; New York, NY, USA, 2010; ISBN 978-1-4094-0265-7. [Google Scholar]
- Kasai, S.; Li, N.; Fang, D. A system-of-systems approach to understanding urbanization–state of the art and prospect. Smart Sustain. Built Environ. 2015, 4, 154–171. [Google Scholar] [CrossRef]
- Derrible, S. Urban infrastructure is not a tree: Integrating and decentralizing urban infrastructure systems. Environ. Plan. B 2017, 44, 553–569. [Google Scholar] [CrossRef]
- Breheny, M.J. (Ed.) Sustainable Development and Urban Form; London Pion Ltd.: London, UK, 1992; ISBN 978-0-85086-160-0. [Google Scholar]
- Jenks, M.; Williams, K. The Compact City: A Sustainable Urban Form? Burton, E., Ed.; Routledge: London, UK; New York, NY, USA, 1996; ISBN 978-0-419-21300-0. [Google Scholar]
- Burton, E.; Jenks, M.; Williams, K.; Jenks, M.; Williams, K. Achieving Sustainable Urban Form; E & FN Spon: London, UK, 2000; ISBN 978-0-203-82792-5. [Google Scholar]
- Sorensen, A.; Okata, J. (Eds.) Megacities: Urban Form, Governance, and Sustainability; cSUR-UT Series: Library for Sustainable Urban Regeneration; Springer: Tokyo, Japan, 2011; ISBN 978-4-431-99266-0. [Google Scholar]
- Silva, M.; Oliveira, V.; Leal, V. Urban Form and Energy Demand: A Review of Energy-relevant Urban Attributes. J. Plan. Lit. 2017, 32, 346–365. [Google Scholar] [CrossRef]
- Creutzig, F.; Lohrey, S.; Bai, X.; Baklanov, A.; Dawson, R.; Dhakal, S.; Lamb, W.F.; McPhearson, T.; Minx, J.; Munoz, E.; et al. Upscaling urban data science for global climate solutions. Glob. Sustain. 2019, 2. [Google Scholar] [CrossRef] [Green Version]
- Lobo, J.; Alberti, M.; Allen-Dumas, M.; Arcaute, E.; Barthelemy, M.; Bojorquez Tapia, L.A.; Brail, S.; Bettencourt, L.; Beukes, A.; Chen, W.-Q.; et al. Urban Science: Integrated Theory from the First Cities to Sustainable Metropolises; Social Science Research Network: Rochester, NY, USA, 2020. [Google Scholar]
- Anderson, W.P.; Kanaroglou, P.S.; Miller, E.J. Urban Form, Energy and the Environment: A Review of Issues, Evidence and Policy. Urban Stud. 1996, 33, 7–35. [Google Scholar] [CrossRef]
- Cervero, R.; Kockelman, K. Travel demand and the 3Ds: Density, diversity, and design. Transp. Res. Part D 1997, 2, 199–219. [Google Scholar] [CrossRef]
- Tsai, Y.-H. Quantifying Urban Form: Compactness versus “Sprawl”. Urban Stud. 2005, 42, 141–161. [Google Scholar] [CrossRef]
- Alberti, M. Modeling the Urban Ecosystem: A Conceptual Framework. Environ. Plan. B 1999, 26, 605–629. [Google Scholar] [CrossRef]
- Sterner, T. Fuel taxes: An important instrument for climate policy. Energy Policy 2007, 35, 3194–3202. [Google Scholar] [CrossRef]
- Davis, L.W.; Kilian, L. Estimating the effect of a gasoline tax on carbon emissions. J. Appl. Econom. 2011, 26, 1187–1214. [Google Scholar] [CrossRef] [Green Version]
- Economidou, M.; Todeschi, V.; Bertoldi, P.; D’Agostino, D.; Zangheri, P.; Castellazzi, L. Review of 50 years of EU energy efficiency policies for buildings. Energy Build. 2020, 225, 110322. [Google Scholar] [CrossRef]
- Nässén, J.; Holmberg, J. Energy efficiency–a forgotten goal in the Swedish building sector? Energy Policy 2005, 33, 1037–1051. [Google Scholar] [CrossRef]
- Carlino, G.A. Three Keys to the City: Resources, Agglomeration Economies, and Sorting. Bus. Rev. 2011, Q3, 1–13. [Google Scholar]
- Kostof, S. The City Shaped: Urban Patterns and Meanings through History; Little, Brown and Company: New York, NY, USA, 1991; ISBN 978-0-8212-1867-9. [Google Scholar]
- Rappaport, J.; Sachs, J.D. The United States as a Coastal Nation. J. Econ. Growth 2003, 8, 5–46. [Google Scholar] [CrossRef]
- Creutzig, F. How fuel prices determine public transport infrastructure, modal shares and urban form. Urban Clim. 2014, 10, 63–76. [Google Scholar] [CrossRef]
- Freeman, O.W. Natural Resources and Urban Development. Ann. Am. Acad. Political Soc. Sci. 1945, 242, 30–45. [Google Scholar] [CrossRef]
- Phang, S.Y. The Singapore Model of Housing and the Welfare State. In Housing and the New Welfare State: Perspectives from East Asia and Europe; Groves, R., Murie, A., Watson, C.J., Eds.; Ashgate: Aldershot, UK, 2007; pp. 15–44. [Google Scholar]
- Huat, C.B. Singapore as Model: Planning Innovations, Knowledge Experts. In Worlding Cities: Asian Experiments and the Art of Being Global; Roy, A., Ong, A., Eds.; Wiley-Blackwell: Oxford, UK, 2011; pp. 27–54. ISBN 978-1-4443-4680-0. [Google Scholar]
- Gollin, D.; Jedwab, R.; Vollrath, D. Urbanization with and without industrialization. J. Econ. Growth 2016, 21, 35–70. [Google Scholar] [CrossRef]
- Jedwab, R. Urbanization without Structural Transformation: Evidence from Consumption Cities in Africa; George Washington University: Washington, DC, USA, 2013. [Google Scholar]
- Acemoglu, D.; Johnson, S.; Robinson, J.A. Reversal of Fortune: Geography and Institutions in the Making of the Modern World Income Distribution. Q. J. Econ. 2002, 117, 1231–1294. [Google Scholar] [CrossRef] [Green Version]
- Davis, J.C.; Henderson, J.V. Evidence on the political economy of the urbanization process. J. Urban Econ. 2003, 53, 98–125. [Google Scholar] [CrossRef]
- Fay, M.; Opal, C. Urbanization without Growth: A Not-So-Uncommon Phenomenon; Policy Research Working Papers; The World Bank: Washington, DC, USA, 2000. [Google Scholar]
- Bertinelli, L.; Black, D. Urbanization and growth. J. Urban Econ. 2004, 56, 80–96. [Google Scholar] [CrossRef]
- Jedwab, R.; Vollrath, D. Urbanization without growth in historical perspective. Explor. Econ. Hist. 2015, 58, 1–21. [Google Scholar] [CrossRef] [Green Version]
- Glaeser, E.L. A World of Cities: The Causes and Consequences of Urbanization in Poorer Countries. J. Eur. Econ. Assoc. 2014, 12, 1154–1199. [Google Scholar] [CrossRef]
- Walton, J. Urban Sociology: The Contribution and Limits of Political Economy. Annu. Rev. Sociol. 1993, 19, 301–320. [Google Scholar] [CrossRef]
- Gilbert, A.; Healey, P. The Political Economy of Land: The State and Urban Development in Venezuela; Gower Publishing Company: Aldershot, UK, 1985. [Google Scholar]
- Henderson, J.V. Urbanization and Growth; Brown University: Providence, RI, USA, 2004. [Google Scholar]
- Pistor, K.; Schutter, O.D. (Eds.) Governing Access to Essential Resources; Columbia University Press: New York, NY, USA, 2015; ISBN 978-0-231-54076-6. [Google Scholar]
- Angel, S.; Parent, J.; Civco, D.L.; Blei, A.; Potere, D. The dimensions of global urban expansion: Estimates and projections for all countries, 2000–2050. Prog. Plan. 2011, 75, 53–107. [Google Scholar] [CrossRef]
- Seto, K.C.; Fragkias, M.; Güneralp, B.; Reilly, M.K. A Meta-Analysis of Global Urban Land Expansion. PLoS ONE 2011, 6, e23777. [Google Scholar] [CrossRef]
- Colsaet, A.; Laurans, Y.; Levrel, H. What drives land take and urban land expansion? A systematic review. Land Use Policy 2018, 79, 339–349. [Google Scholar] [CrossRef]
- Zhang, X.Q. High-Rise and High-Density Compact Urban Form: The Development of Hong Kong. In Compact Cities: Sustainable Urban Forms for Developing Countries; Jenks, M., Burgess, R., Eds.; Spon Press: London, UK; New York, NY, USA, 2000; ISBN 978-0-419-25130-9. [Google Scholar]
- Addae-Dapaah, K. Utilization of urban residential land: A case study of Singapore. Cities 1999, 16, 93–101. [Google Scholar] [CrossRef]
- Fuccaro, N. Introduction Histories of Oil and Urban Modernity in the Middle East. Comp. Stud. South Asia Afr. Middle East 2013, 33, 1–6. [Google Scholar] [CrossRef] [Green Version]
- Al-Nakib, F. Kuwait’s Modern Spectacle Oil Wealth and the Making of a New Capital City, 1950–1990. Comp. Stud. South Asia Afr. Middle East 2013, 33, 7–25. [Google Scholar] [CrossRef]
- Bet-Shlimon, A. The Politics and Ideology of Urban Development in Iraq’s Oil City Kirkuk, 1946–1958. Comp. Stud. South Asia Afr. Middle East 2013, 33, 26–40. [Google Scholar] [CrossRef]
- Alissa, R. The Oil Town of Ahmadi since 1946 From Colonial Town to Nostalgic City. Comp. Stud. South Asia Afr. Middle East 2013, 33, 41–58. [Google Scholar] [CrossRef]
- Damluji, M. The Oil City in Focus The Cinematic Spaces of Abadan in the Anglo-Iranian Oil Company’s Persian Story. Comp. Stud. South Asia Afr. Middle East 2013, 33, 75–88. [Google Scholar] [CrossRef]
- Lawless, R.I.; Seccombe, I.J. Impact of the Oil Industry on Urbanization in the Persian Gulf Region. In Urban Development in the Muslim World; Amirahmadi, H., Shakhs, S.S.E., Eds.; Routledge: Abingdon, UK; New York, NY, USA, 1993; pp. 183–212. [Google Scholar]
- Crinson, M. Abadan: Planning and architecture under the Anglo-Iranian Oil Company. Plan. Perspect. 1997, 12, 341–359. [Google Scholar] [CrossRef]
- Fuccaro, N. Histories of City and State in the Persian Gulf: Manama since 1800; Cambridge University Press: Cambridge, MA, USA, 2009. [Google Scholar]
- Al-Nakib, F. Kuwait Transformed: A History of Oil and Urban Life; Stanford University Press: Stanford, CA, USA, 2016. [Google Scholar]
- Fuccaro, N. Shaping the Urban Life of Oil in Bahrain Consumerism, Leisure, and Public Communication in Manama and in the Oil Camps, 1932–1960s. Comp. Stud. South Asia Afr. Middle East 2013, 33, 59–74. [Google Scholar] [CrossRef]
- Baum-Snow, N. Did Highways Cause Suburbanization? Q. J. Econ. 2007, 122, 775–805. [Google Scholar] [CrossRef] [Green Version]
- Henderson, J.V. Cities and Development. J. Reg. Sci. 2010, 50, 515–540. [Google Scholar] [CrossRef]
- Baum-Snow, N.; Brandt, L.; Henderson, J.V.; Turner, M.A.; Zhang, Q. Roads, Railroads, and Decentralization of Chinese Cities. Rev. Econ. Stat. 2017, 99, 435–448. [Google Scholar] [CrossRef]
- IPCC. Climate Change 2014: Mitigation of Climate Change. Contribution of Working Group III to the Fifth Assessment Report of the Intergovernmental Panel on Climate Change (IPCC); Cambridge University Press: Cambridge, UK; New York, NY, USA, 2014; p. 927. [Google Scholar]
- Ewing, R.; Cervero, R. Travel and the Built Environment. J. Am. Plan. Assoc. 2010, 76, 265–294. [Google Scholar] [CrossRef]
- Rode, P.; Keim, C.; Robazza, G.; Viejo, P.; Schofield, J. Cities and Energy: Urban Morphology and Residential Heat-Energy Demand. Environ. Plan. B 2014, 41, 138–162. [Google Scholar] [CrossRef] [Green Version]
- Rode, P. Cities and the New Climate Economy: The Role of Transport and Urban Form; Abu Dhabi Urban Planning Council Lecture: Abu Dhabi, UAE, 2014. [Google Scholar]
- GCEC. Better Growth, Better Climate: The New Climate Economy Report; The Global Commission on the Economy and Climate: Washington, DC, USA, 2014; p. 72. [Google Scholar]
- OECD. Compact City Policies: A Comparative Assessment; Organisation for Economic Co-Operation and Development (OECD): Paris, France, 2012. [Google Scholar]
- Lefèvre, B. Urban Transport Energy Consumption: Determinants and Strategies for its Reduction. An analysis of the literature. SAPI EN. S. Surv. Perspect. Integr. Environ. Soc. 2009, 2, 1–17. [Google Scholar]
- Papa, R.; Gargiulo, C.; Zucaro, F.; Angiello, G.; Carpentieri, G. Urban Energy Consumptions: Its Determinants and Future Research. WIT Trans. Ecol. Environ. 2014, 191, 561–570. [Google Scholar] [CrossRef] [Green Version]
- Steemers, K. Energy and the city: Density, buildings and transport. Energy Build. 2003, 35, 3–14. [Google Scholar] [CrossRef]
- Madlener, R.; Sunak, Y. Impacts of urbanization on urban structures and energy demand: What can we learn for urban energy planning and urbanization management? Sustain. Cities Soc. 2011, 1, 45–53. [Google Scholar] [CrossRef]
- Güneralp, B.; Zhou, Y.; Ürge-Vorsatz, D.; Gupta, M.; Yu, S.; Patel, P.L.; Fragkias, M.; Li, X.; Seto, K.C. Global scenarios of urban density and its impacts on building energy use through 2050. Proc. Natl. Acad. Sci. USA 2017, 201606035. [Google Scholar] [CrossRef] [PubMed] [Green Version]
- Kenworthy, J.R.; Newman, P.W.G. Cities and transport energy: Lessons from a global survey. Ekistics 1990, 57, 258–268. [Google Scholar]
- IEA International Energy Agency Statistics Data Browser. Available online: https://www.iea.org/statistics/?country=WORLD&year=2015&category=Energy%20consumption&indicator=TFCShareBySector&mode=table&dataTable=BALANCES (accessed on 30 April 2019).
- IEA. Key World Energy Statistics; International Energy Agency: Paris, France, 2016. [Google Scholar]
- Baker, N.; Steemers, K. Energy and Environment in Architecture: A Technical Design Guide; E & FN Spon: London, UK, 2000; ISBN 978-0-419-22770-0. [Google Scholar]
- Ratti, C.; Baker, N.; Steemers, K. Energy consumption and urban texture. Energy Build. 2005, 37, 762–776. [Google Scholar] [CrossRef]
- Yannas, S. Solar Energy and Housing Design; Architectural Association Publications: London, UK, 1993; ISBN 978-1-870890-45-8. [Google Scholar]
- Vartholomaios, A. A parametric sensitivity analysis of the influence of urban form on domestic energy consumption for heating and cooling in a Mediterranean city. Sustain. Cities Soc. 2017, 28, 135–145. [Google Scholar] [CrossRef]
- Zhang, J.; Xu, L.; Shabunko, V.; Tay, S.E.R.; Sun, H.; Lau, S.S.Y.; Reindl, T. Impact of urban block typology on building solar potential and energy use efficiency in tropical high-density city. Appl. Energy 2019, 240, 513–533. [Google Scholar] [CrossRef]
- Smith, W.S. Mass Transport for High-Rise High-Density Living. J. Transp. Eng. 1984, 110, 521–535. [Google Scholar] [CrossRef]
- Holtzclaw, J. Smart Growth—As Seen From the Air Convenient Neighborhood, Skip the Car. In Proceedings of the Air and Waste Management Association’s 93rd Annual Meeting and Exhibition, Salt Lake City, UT, USA, 23 June 2000. [Google Scholar]
- Ewing, R.; Rong, F. The impact of urban form on U.S. residential energy use. Hous. Policy Debate 2008, 19, 1–30. [Google Scholar] [CrossRef]
- Handy, S.; Cao, X.; Mokhtarian, P.L. Self-Selection in the Relationship between the Built Environment and Walking: Empirical Evidence from Northern California. J. Am. Plan. Assoc. 2006, 72, 55–74. [Google Scholar] [CrossRef]
- Zhang, M. Travel Choice with No Alternative: Can Land Use Reduce Automobile Dependence? J. Plan. Educ. Res. 2006, 25, 311–326. [Google Scholar] [CrossRef]
- Zegras, C. The Built Environment and Motor Vehicle Ownership and Use: Evidence from Santiago de Chile. Urban Stud. 2010, 47, 1793–1817. [Google Scholar] [CrossRef]
- Zhao, P. Car use, commuting and urban form in a rapidly growing city: Evidence from Beijing. Transp. Plan. Technol. 2011, 34, 509–527. [Google Scholar] [CrossRef]
- Newman, P.; Kenworthy, J.R. Evaluating the Transport Sector’s Contribution to Greenhouse Gas Emissions and Energy Consumption. In Technologies for Climate Change Mitigation: Transport Sector; Salter, R., Dhar, S., Newman, P., Eds.; TNA Guidebook Series, UNEP & DTU; Magnum Custom Publishing: New Delhi, India, 2011; p. 250. [Google Scholar]
- Banister, D.; Watson, S.; Wood, C. Sustainable Cities: Transport, Energy, and Urban Form. Environ. Plan. B 1997, 24, 125–143. [Google Scholar] [CrossRef]
- Mogridge, M.J.H. Transport, Land Use and Energy Interaction. Urban Stud. 1985, 22, 481–492. [Google Scholar] [CrossRef]
- Baum-Snow, N.; Turner, M. Transport Infrastructure and the Decentralization of Cities in the People’s Republic of China. Asian Dev. Rev. 2017, 34, 25–50. [Google Scholar] [CrossRef] [PubMed]
- Dhakal, S. Urban energy use and carbon emissions from cities in China and policy implications. Energy Policy 2009, 37, 4208–4219. [Google Scholar] [CrossRef]
- Agranoff, R.; Radin, B. The comparative case study approach in public administration. Res. Public Adm. 1991, 1, 203–231. [Google Scholar]
- Yin, R.K. Case Study Research: Design and Methods; SAGE Publications: London, UK, 2013; ISBN 978-1-4833-0200-3. [Google Scholar]
- Wendel, J.; Simons, A.; Nichersu, A.; Murshed, S.M. Rapid development of semantic 3D city models for urban energy analysis based on free and open data sources and software. In Proceedings of the ACM Urban GIS; UrbanGIS’17, Redondo Beach, CA, USA, 7–10 November 2017; p. 15. [Google Scholar]
- Angel, S.; Parent, J.; Civco, D.L.; Blei, A.M. Atlas of Urban Expansion; Lincoln Institute of Land Policy: Cambridge, MA, USA, 2012. [Google Scholar]
- ISO. Energy Performance of Buildings–Calculation of Energy Use for Space Heating and Cooling; ISO 13790:2008; ISO/TC 163/SC 2 Calculation Methods: Geneva, Switzerland, 2008; p. 162. [Google Scholar]
- Kristensen, M.H.; Petersen, S. Choosing the appropriate sensitivity analysis method for building energy model-based investigations. Energy Build. 2016, 130, 166–176. [Google Scholar] [CrossRef]
- Corrado, V.; Fabrizio, E. Assessment of building cooling energy need through a quasi-steady state model: Simplified correlation for gain-loss mismatch. Energy Build. 2007, 39, 569–579. [Google Scholar] [CrossRef]
- Gröger, G.; Kolbe, T.; Nagel, C.; Häfele, K.-H. OGC City Geography Markup Language (Citygml) Encoding Standard 2.0.0; Open Geospatial Consortium: Wayland, MA, USA, 2012; p. 344. [Google Scholar]
- Chalal, M.L.; Benachir, M.; White, M.; Shrahily, R. Energy planning and forecasting approaches for supporting physical improvement strategies in the building sector: A review. Renew. Sustain. Energy Rev. 2016, 64, 761–776. [Google Scholar] [CrossRef] [Green Version]
- Koch, E.A. Continuous Simulation for Urban Energy Planning Based on a Non-Linear Data-Driven Modelling Approach. Ph.D. Thesis, Karlsruher Instituts für Technologie, Karlsruhe, Germany, 2016. [Google Scholar] [CrossRef]
- Eicker, U.; Nouvel, R.; Schulte, C.; Schumacher, J.; Coors, V. 3D Stadtmodelle für die Wärmebedarfberechnung. In Proceedings of the Fourth German-Austrian IBPSA Conference; IBPSA: Berlin, Germany, 2012. [Google Scholar]
- Nouvel, R.; Mastrucci, A.; Leopold, U.; Baume, O.; Coors, V.; Eicker, U. Combining GIS-based statistical and engineering urban heat consumption models: Towards a new framework for multi-scale policy support. Energy Build. 2015, 107, 204–212. [Google Scholar] [CrossRef]
- Murshed, S.M.; Picard, S.; Koch, A. CityBEM: An Open Source Implementation and Validation of Monthly Heating and Cooling Energy Needs for 3D Buildings in Cities. ISPRS Ann. Photogramm. Remote Sens. Spat. Inf. Sci. 2017, IV-4/W5, 83–90. [Google Scholar] [CrossRef] [Green Version]
- Murshed, S.M.; Picard, S.; Koch, A. Modelling, Validation and Quantification of Climate and Other Sensitivities of Building Energy Model on 3D City Models. ISPRS Int. J. Geo-Inf. 2018, 7, 447. [Google Scholar] [CrossRef] [Green Version]
- Murshed, S.M.; Lindsay, A.; Picard, S.; Simons, A. PLANTING: Computing High Spatio-Temporal Resolutions of Photovoltaic Potential of 3D City Models. In Geospatial Technologies for All, Lecture Notes in Geoinformation and Cartography; Mansourian, A., Pilesjö, P., Harrie, L., van Lammere, R., Eds.; Springer International Publishing AG: Cham, Switzerland, 2018; in press. [Google Scholar]
- TUM; virtualcitySYSTEMS; M.O.S.S. 3DCityDB Database–Homepage. Available online: https://www.3dcitydb.org/3dcitydb/ (accessed on 23 October 2020).
- PyDev. Available online: https://www.pydev.org/ (accessed on 23 October 2020).
- IAI-Webmaster FZKViewer. Available online: https://www.iai.kit.edu/1302.php (accessed on 23 October 2020).
- García-Ayllón, S. Retro-diagnosis methodology for land consumption analysis towards sustainable future scenarios: Application to a mediterranean coastal area. J. Clean. Prod. 2018, 195, 1408–1421. [Google Scholar] [CrossRef]
- García-Nieto, A.P.; Geijzendorffer, I.R.; Baró, F.; Roche, P.K.; Bondeau, A.; Cramer, W. Impacts of urbanization around Mediterranean cities: Changes in ecosystem service supply. Ecol. Indic. 2018, 91, 589–606. [Google Scholar] [CrossRef] [Green Version]
- Yiran, G.A.B.; Ablo, A.D.; Asem, F.E. Urbanisation and domestic energy trends: Analysis of household energy consumption patterns in relation to land-use change in peri-urban Accra, Ghana. Land Use Policy 2020, 99, 105047. [Google Scholar] [CrossRef]
- SCAD. Abu Dhabi Statistical Yearbook; Statistics Centre: Abu Dhabi, UAE, 2016.
- CSD. Hong Kong Annual Digest of Statistics; Census and Statistics Department: Hong Kong, China, 2016; p. 514.
- DSS. Population Trends; Department of Statistics Singapore: Singapore, 2017.
- CSB. Statistical Abstract in 25 Years; Central Statistical Bureau: Kuwait City, Kuwait, 1990.
- PACI. The Public Authority for Civil Information. Available online: https://www.paci.gov.kw/Default.aspx (accessed on 1 January 2016).
- World Bank World Development Indicators (WDI)|Data Catalog. Available online: https://datacatalog.worldbank.org/dataset/world-development-indicators (accessed on 20 October 2017).
- DSS. M890151–Land Area (as at December), Annual; Department of Statistics Singapore: Singapore, 2017.
- Hong Kong Lands Department Reclamation Area (Since 1887). Available online: http://www.landsd.gov.hk/mapping/en/publications/reclamation.htm (accessed on 12 October 2016).
- Ministry of National Development. A High Quality Environment for All Singaporeans: Land Use Plan to Support Singapore’s Future Population; Ministry of National Development: Singapore, 2013.
- Rowe, P.G. East Asia Modern: Shaping the Contemporary City; Reaktion Books: London, UK, 2005; ISBN 978-1-86189-536-3. [Google Scholar]
- EMA. Singapore Energy Statistics; Energy Market Authority: Singapore, 2015. [Google Scholar]
- UN-Habitat; NYU; Lincoln Institute Atlas of Urban Expansion–Data. Available online: http://atlasofurbanexpansion.org/data (accessed on 23 October 2020).
- World Bank Energy Use (kg of Oil Equivalent Per Capita)\Textbar Data. Available online: https://data.worldbank.org/indicator/EG.USE.PCAP.KG.OE (accessed on 29 October 2017).
- Lincoln Institute of Land and Policy; NYU; UN-Habitat Atlas of Urban Expansion–Cities. Available online: http://www.atlasofurbanexpansion.org/data (accessed on 25 July 2019).
- Al-Mutairi, H.; Dewsbury, J.; Lane-Serff, G.F. Energy and the implication of residential cooling in hot climates: Case study for developing effective solution for residential cooling demand in Kuwait. In Proceedings of the WIT Transactions on Ecology and the Environment; WIT Press: Southampton, UK, 2011; Volume 150, pp. 1–12. [Google Scholar]
- IEA. Key World Energy Statistics; International Energy Agency (IEA): Paris, France, 2015. [Google Scholar]
- AboulNaga, M.M.; Elsheshtawy, Y.H. Environmental sustainability assessment of buildings in hot climates: The case of the UAE. Renew. Energy 2001, 24, 553–563. [Google Scholar] [CrossRef]
- IEA Energy Statistics. Available online: https://www.iea.org/statistics/statisticssearch/ (accessed on 9 October 2017).
- Kenworthy, J.R. Transport energy use and greenhouse gases in urban passenger transport systems: A study of 84 global cities. In Proceedings of the International Sustainability Conference, Fremantle, Australia, 17–19 September 2003; pp. 1–28. [Google Scholar]
- Kenworthy, J.R. Energy Use and CO2 Production in the Urban Passenger Transport Systems of 84 International Cities: Findings and Policy Implications. In Urban Energy Transition: From Fossil Fuels to Renewable Power; Droege, P., Ed.; Elsevier: Oxford, UK, 2008. [Google Scholar]
- OECD. Rethinking Urban Sprawl: Moving towards Sustainable Cities | en | OECD; OECD Publishing: Paris, France, 2018. [Google Scholar]
- Oueslati, W.; Alvanides, S.; Garrod, G. Determinants of urban sprawl in European cities. Urban Stud. 2015, 52, 1594–1614. [Google Scholar] [CrossRef] [PubMed] [Green Version]
- Sudhira, H.S.; Ramachandra, T.V.; Jagadish, K.S. Urban sprawl: Metrics, dynamics and modelling using GIS. Int. J. Appl. Earth Obs. Geoinf. 2004, 5, 29–39. [Google Scholar] [CrossRef]
- Gennaio, M.-P.; Hersperger, A.M.; Bürgi, M. Containing urban sprawl—Evaluating effectiveness of urban growth boundaries set by the Swiss Land Use Plan. Land Use Policy 2009, 26, 224–232. [Google Scholar] [CrossRef]
- Burgess, R.; Jenks, M. (Eds.) Compact Cities: Sustainable Urban Forms for Developing Countries; Spon Press: London, UK; New York, NY, USA, 2000; ISBN 978-1-135-80389-6. [Google Scholar]
- Fenjie, L.; Ming, G. Research on the Impact of Land Supply on Urban Growth in China. CNKI 2009, 6, 83–87. [Google Scholar]
- Capozza, D.R.; Helsley, R.W. The fundamentals of land prices and urban growth. J. Urban Econ. 1989, 26, 295–306. [Google Scholar] [CrossRef]
- Drabkin, H.D. Land Policy and Urban Growth; Urban and Regional Planning Series; Pergamon Press: Oxford, UK, 1977; Volume 16, ISBN 978-0-08-020401-7. [Google Scholar]
- Buxton, M.; Taylor, E. Urban Land Supply, Governance and the Pricing of Land. Urban Policy Res. 2010, 29, 5–22. [Google Scholar] [CrossRef]
- Rose, L.A. Urban land supply: Natural and contrived restrictions. J. Urban Econ. 1989, 25, 325–345. [Google Scholar] [CrossRef]
- El Araby, M.M. The role of the state in managing urban land supply and prices in Egypt. Habitat Int. 2003, 27, 429–458. [Google Scholar] [CrossRef]
- Haas, T.; Olsson, K. Emergent Urbanism: Urban Planning & Design in Times of Structural and Systemic Change; Routledge: London, UK; New York, NY, USA, 2016; ISBN 978-1-317-14485-4. [Google Scholar]
- Staff Report Abu Dhabi Raises Water, Electricity Tariffs. Available online: https://gulfnews.com/business/energy/abu-dhabi-raises-water-electricity-tariffs-1.1647201 (accessed on 23 October 2020).
- Krane, J. Reforming end-user energy prices could rationalize GCC energy demand. Oxf. Energy Forum 2015, 102, 38–41. [Google Scholar]
- Resch, E.; Bohne, R.A.; Kvamsdal, T.; Lohne, J. Impact of Urban Density and Building Height on Energy Use in Cities. Energy Procedia 2016, 96, 800–814. [Google Scholar] [CrossRef] [Green Version]
- Newman, P.; Kenworthy, J. Sustainability and Cities: Overcoming Automobile Dependence; Island Press: Washington, DC, USA, 1999; ISBN 978-1-55963-660-5. [Google Scholar]
- Chen, T.-L.; Chiu, H.-W.; Lin, Y.-F. How do East and Southeast Asian Cities Differ from Western Cities? A Systematic Review of the Urban Form Characteristics. Sustainability 2020, 12, 2423. [Google Scholar] [CrossRef] [Green Version]
- Nathaniel, S.; Anyanwu, O.; Shah, M. Renewable energy, urbanization, and ecological footprint in the Middle East and North Africa region. Environ. Sci. Pollut. Res. 2020, 27, 14601–14613. [Google Scholar] [CrossRef]
- Murshed, S.; Duval, A.; Koch, A.; Rode, P. Impact of Urban Morphology on Energy Consumption of Vertical Mobility in Asian Cities—A Comparative Analysis with 3D City Models. Urban Sci. 2018, 3, 4. [Google Scholar] [CrossRef] [Green Version]
- Hegger, M.; Dettmar, J. Energetische Stadtraumtypen: Strukturelle und Energetische Kennwerte von Stadträumen; Fraunhofer IRB Verlag: Stuttgart, Gremany, 2014; ISBN 978-3-8167-9292-5. [Google Scholar]
| 1 | We conducted a quantitative review of directly related terminology of academic research indexed in Web of Science and Google Scholar comparing combinations of “urban form” with terms either associated with resource conditions as determinants of urban form or resource implications as dependent variables of urban form (see Appendix A, Table A2). |
| 2 | ULA is a new metric developed to represent more accurately the land where urban living takes place. It includes all built-up areas or “urban footprint”, as well as small enclosed open spaces. However, it excludes large, unoccupied spaces, “dead” built-up spaces, such as isolated roadways, and areas occupied by large storage structures, such as shipping containers or oil storage tanks that are included in traditional measures of built-up areas. For discussion on urban footprints, see Angel et al. [99]. |
| 3 | A detailed explanation on the implementation, equation and validation of the method is provided in [109]. The tool mainly requires four categories of input data: building geometry, building typology, outdoor temperature and solar radiation on each building surface. |
| 4 | The percentage of the population living in low-density housing also includes domestic staff. In some instances, the number of people living in low-density housing may have been overestimated as the methodology used associated each block in the metropolitan area with its dominant typology, and was limited in its ability to disaggregate further. |
| 5 | |
| 6 | Singapore’s 2013 Land Use Plan states: “In Singapore, travel needs must be met largely by public transport as it is the most space-efficient way of transporting large numbers of people. Our limited land supply also does not allow us to build ever more roads and other facilities for private transport in an unrestrained way. We aim to achieve a public transport mode share of 70% of journeys during the morning peak hours by 2020, and 75% by 2030”, (p. 41). |
| 7 | According to Rowe [126], developers compete with each other to construct taller buildings, particularly when rents are high and property values are rising. |
| 8 | |
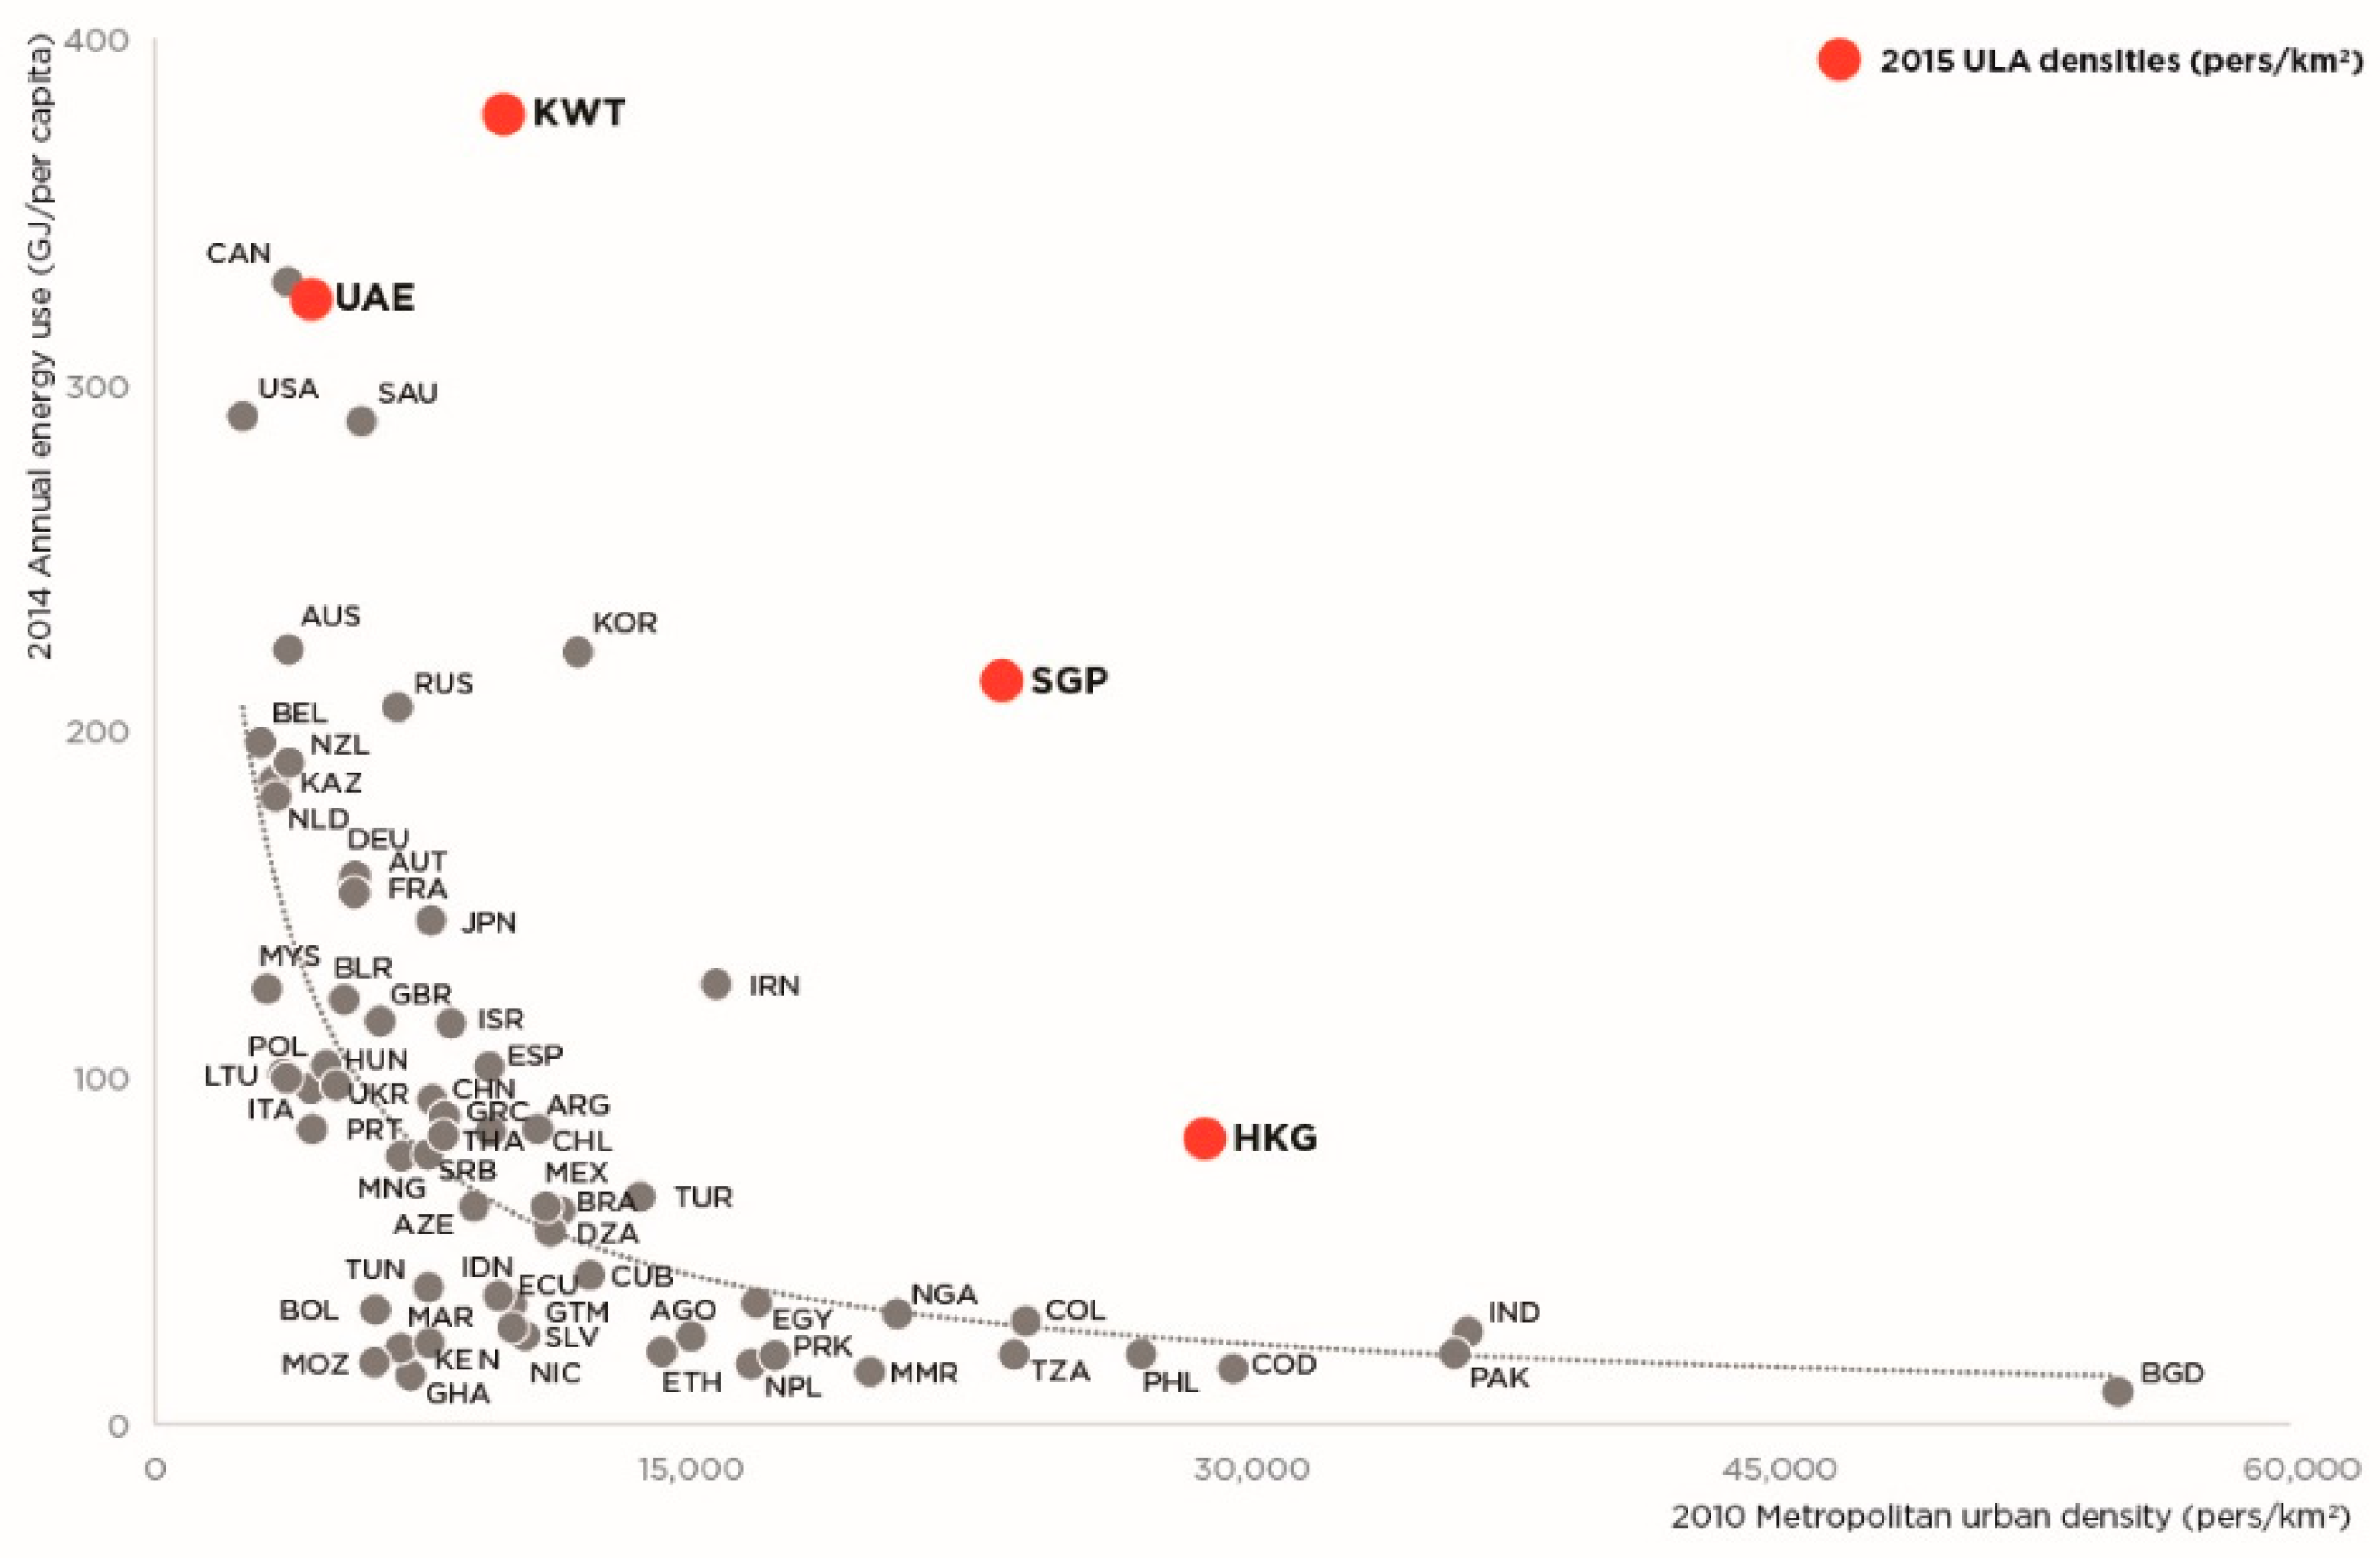
| 9 | The metropolitan density value was determined by identifying the 2010 metropolitan-wide population density of one city per country (selecting the metropolitan region with the highest average density). This data was derived from the built-up area density of the Atlas of Urban Expansion [128]. For the four case study cities, the metropolitan density was calculated based on by the Urban Living Area 2015 (ULA) measure developed by LSE Cities. |
| 10 | |
| 11 | According to Al-Mutairi et al. [131], “residential air conditioners consume 58.4% of the total electricity delivered by power plants at peak usage time on a hot summer day in Kuwait”. |
| 12 | Residential contribution to total electricity consumption from IEA 2015 Stats [132]. |
| 13 | By assigning all the dominantly residential typologies to one of the five urban morphology samples we were assuming the areas to be purely residential. However, these areas include mix use building. Adding this extra population (corresponding to a jobs ratio) allows a compensation for the final calculation for a total residential energy per capita. |
| 14 | Source: authors and data from IEA [132]. |


| Mode | Formula | |
|---|---|---|
| Cooling mode: | (1) | |
| Heating mode: | (2) | |
| With | ||
| (3) | ||
| (4) |
| Kuwait | Abu Dhabi | Singapore | Hong Kong | |||||||||||||
|---|---|---|---|---|---|---|---|---|---|---|---|---|---|---|---|---|
| Decade | Pop | ULA [sqkm] | GDPpc [USD] | Fuel af [%] | Pop | ULA [sqkm] | GDPpc [USD] | Fuel af [%] | Pop | ULA [sqkm] | GDPpc [USD] | Fuel af [%] | Pop | ULA [sqkm] | GDPpc [USD] | Fuel af [%] |
| 1930s | - | 2.5 (1930) | - | - | - | - | - | - | - | 23.5 (1930) | - | - | - | - | - | - |
| 1940s | 70,000 (1947) | - | - | - | - | - | - | - | - | 50.1 (1945) | 1,800,000 (1947) | 22.0 (1945) | - | - | ||
| 1950s | 206,473 (1957) | 4.9 (1951) | - | - | - | 7.5 (1949) | - | - | 1,445,929 (1957) | 75.5 (1954) | - | - | 2,060,000 (1950) | - | - | - |
| 1960s | 321,621 (1961) | 45.6 (1963) | 4350 (1965) | - | - | 8.6 (1960) | - | - | 1,646,400 (1960) | 101.4 (1969) | 449 (1961) | - | 3,128,200 (1960) | - | 437 (1961) | - |
| 1970s | 738,662 (1970) | 143.8 (1977) | 3831 (1970) | - | - | 27.7 (1969) | 27,709 (1975) | - | 2,074,507 (1970) | 132.8 (1983) | 925 (1970) | - | 3,959,000 (1970) | 67.8 (1971) | 960 (1970) | - |
| 1980s | 1,357,952 (1980) | 195.2 (1982) | 20,687 (1980) | 0.76 (1984) | - | 48.0 (1978) | 42,879 (1980) | - | 2,413,945 (1980) | 150.4 (1987) | 4927 (1980) | - | 5,038,500 (1980) | 114.0 (1981) | 5700 (1980) | - |
| 1990s | 1,936,656 (1990) | 281.7 (1990) | 8951 (1990) | 1.12 (1990) | - | 93.7 (1990) | 27,989 (1990) | 0.72 (1998) | 3,047,132 (1990) | 184.5 (1991) | 11,864 (1990) | 4.1 (1991) | 5,704,500 (1990) | 192.2 (1992) | 13,486 (1990) | 3.9 (1991) |
| 2000s | 2,088,745 (2000) | 330.0 (2000) | 19,545 (2000) | 1.02 (2000) | 809,000 (2005) | 154.4 (2000) | 34,208 (2000) | 0.88 (2000) | 4,027,887 (2000) | 218.0 (2000) | 23,793 (2000) | 3.4 (2000) | 6,665,000 (2000) | 223.9 (2000) | 25,757 (2000) | 3.1 (2000) |
| 2010s | 3,576,674 (2010) | 380.9 (2006) | 37,725 (2010) | 0.53 (2010) | 1,266,125 (2010) | 317.0 (2006) | 34,342 (2010) | 1.46 (2010) | 5,076,732 (2010) | 224.6 (2007) | 46,570 (2010) | 3.0 (2010) | 7,024,200 (2010) | 32,550 (2010) | 4.0 (2010) | |
| 2015 | 4,178,572 (2015) | 424.3 (2015) | 29,301 (2015) | 0.68 (2015) | 1,720,211 (2010) | 388.5 (2015) | 40,439 (2015) | 1.24 (2015) | 5,535,002 (2015) | 232.4 (2015) | 52,889 (2015) | 3.0 (2015) | 7,305,700 (2015) | 247.2 (2015) | 42,328 (2015) | 3.8 (2015) |
| Kuwait | Abu Dhabi | Singapore | Hong Kong | |||||||||
|---|---|---|---|---|---|---|---|---|---|---|---|---|
| Decade | UEC | FPSD | GDPpc | UEC | FPSD | GDPpc | UEC | FPSD | GDPpc | UEC | FPSD | GDPpc |
| 1930–1939 | 3.8 | - | - | - | - | - | 2.7 | - | - | - | - | - |
| 1940–1949 | 0.7 | - | - | - | - | - | 1.9 | - | - | - | - | - |
| 1950–1959 | 2.6 | - | - | 0.2 | - | - | 0.5 | - | - | 1.1 | - | - |
| 1960–1969 | 1.4 | - | - | 1.2 | - | - | 0.8 | - | - | 1.8 | - | - |
| 1970–1979 | 1.3 | - | 3831 | 0.2 | - | - | 1.3 | - | 925 | 2.6 | - | 960 |
| 1980–1989 | 1.7 | 0.1 | 20,687 | 1.4 | - | 42,879 | 1.6 | - | 4927 | 3.9 | - | 5700 |
| 1990–1999 | 2.9 | 0.1 | 8951 | 1.4 | 0.2 | 27,989 | 0.7 | 0.6 | 11,864 | 1.6 | 0.6 | 13,486 |
| 2000–2009 | 0.3 | 0.2 | 19,545 | 1.5 | 0.3 | 34,208 | 0.2 | 0.8 | 23,793 | 1.4 | 0.8 | 25,757 |
| 2010–2015 | 0.4 | 0.2 | 37,725 | 0.4 | 0.5 | 34,342 | 0.3 | 1.4 | 46,570 | 0.8 | 1.3 | 32,550 |
| Total Population Included (pop + jobs) | Total Area Included (km2) | Total Floor Space (km2) | Total Residential Energy (kWh/a) | Total Residential Energy per Capita (kWh/a/pc) | IEA Total Residential Energy per Capita (kWh/a/pc) | |
|---|---|---|---|---|---|---|
| Kuwait | 4,434,990 | 297 | 367 | 116,386,228,075 | 26,243 | 7490 |
| Abu Dhabi | 1,586,812 | 254 | 156 | 44,093,145,882 | 27,787 | 24,576 |
| Singapore | 6,485,792 | 145 | 300 | 63,002,229,372 | 9714 | 1477 |
| Hong Kong | 8,792,955 | 205 | 711 | 101,986,297,713 | 11,599 | 2218 |
| Jobs | Population | Area [sqkm] | One-Way Commuting Distance [km] | |
|---|---|---|---|---|
| Kuwait | 1,703,145 | 4,178,572 | 852 | 17.8 |
| Hong Kong | 2,543,460 | 7,305,700 | 1109 | 12.6 |
| Mode Share (per cent) | Standardised Energy Consumption (MJ/passenger km) | ||||
|---|---|---|---|---|---|
| Mode | Kuwait | Hong Kong | Kuwait | Hong Kong | Source |
| Private car | 55 | 8 | 2.6 | 2.3 | Kenworthy & Townsend (2011) |
| Buses | 39 | 45 | 0.7 | 0.5 | Kenworthy (2003) |
| Rail | 0 | 36 | N/A | 0.2 | Kenworthy (2008) |
| Weighted average | - | - | 1.8 | 0.5 | LSE Cities |
Publisher’s Note: MDPI stays neutral with regard to jurisdictional claims in published maps and institutional affiliations. |
© 2020 by the authors. Licensee MDPI, Basel, Switzerland. This article is an open access article distributed under the terms and conditions of the Creative Commons Attribution (CC BY) license (http://creativecommons.org/licenses/by/4.0/).
Share and Cite
Rode, P.; Gomes, A.; Adeel, M.; Sajjad, F.; Koch, A.; Murshed, S.M. Between Abundance and Constraints: The Natural Resource Equation of Asia’s Diverging, Higher-Income City Models. Land 2020, 9, 426. https://doi.org/10.3390/land9110426
Rode P, Gomes A, Adeel M, Sajjad F, Koch A, Murshed SM. Between Abundance and Constraints: The Natural Resource Equation of Asia’s Diverging, Higher-Income City Models. Land. 2020; 9(11):426. https://doi.org/10.3390/land9110426
Chicago/Turabian StyleRode, Philipp, Alexandra Gomes, Muhammad Adeel, Fizzah Sajjad, Andreas Koch, and Syed Monjur Murshed. 2020. "Between Abundance and Constraints: The Natural Resource Equation of Asia’s Diverging, Higher-Income City Models" Land 9, no. 11: 426. https://doi.org/10.3390/land9110426