Evaluation of Resource and Environmental Carrying Capacity of China’s Rapid-Urbanization Areas—A Case Study of Xinbei District, Changzhou


Abstract
:1. Introduction
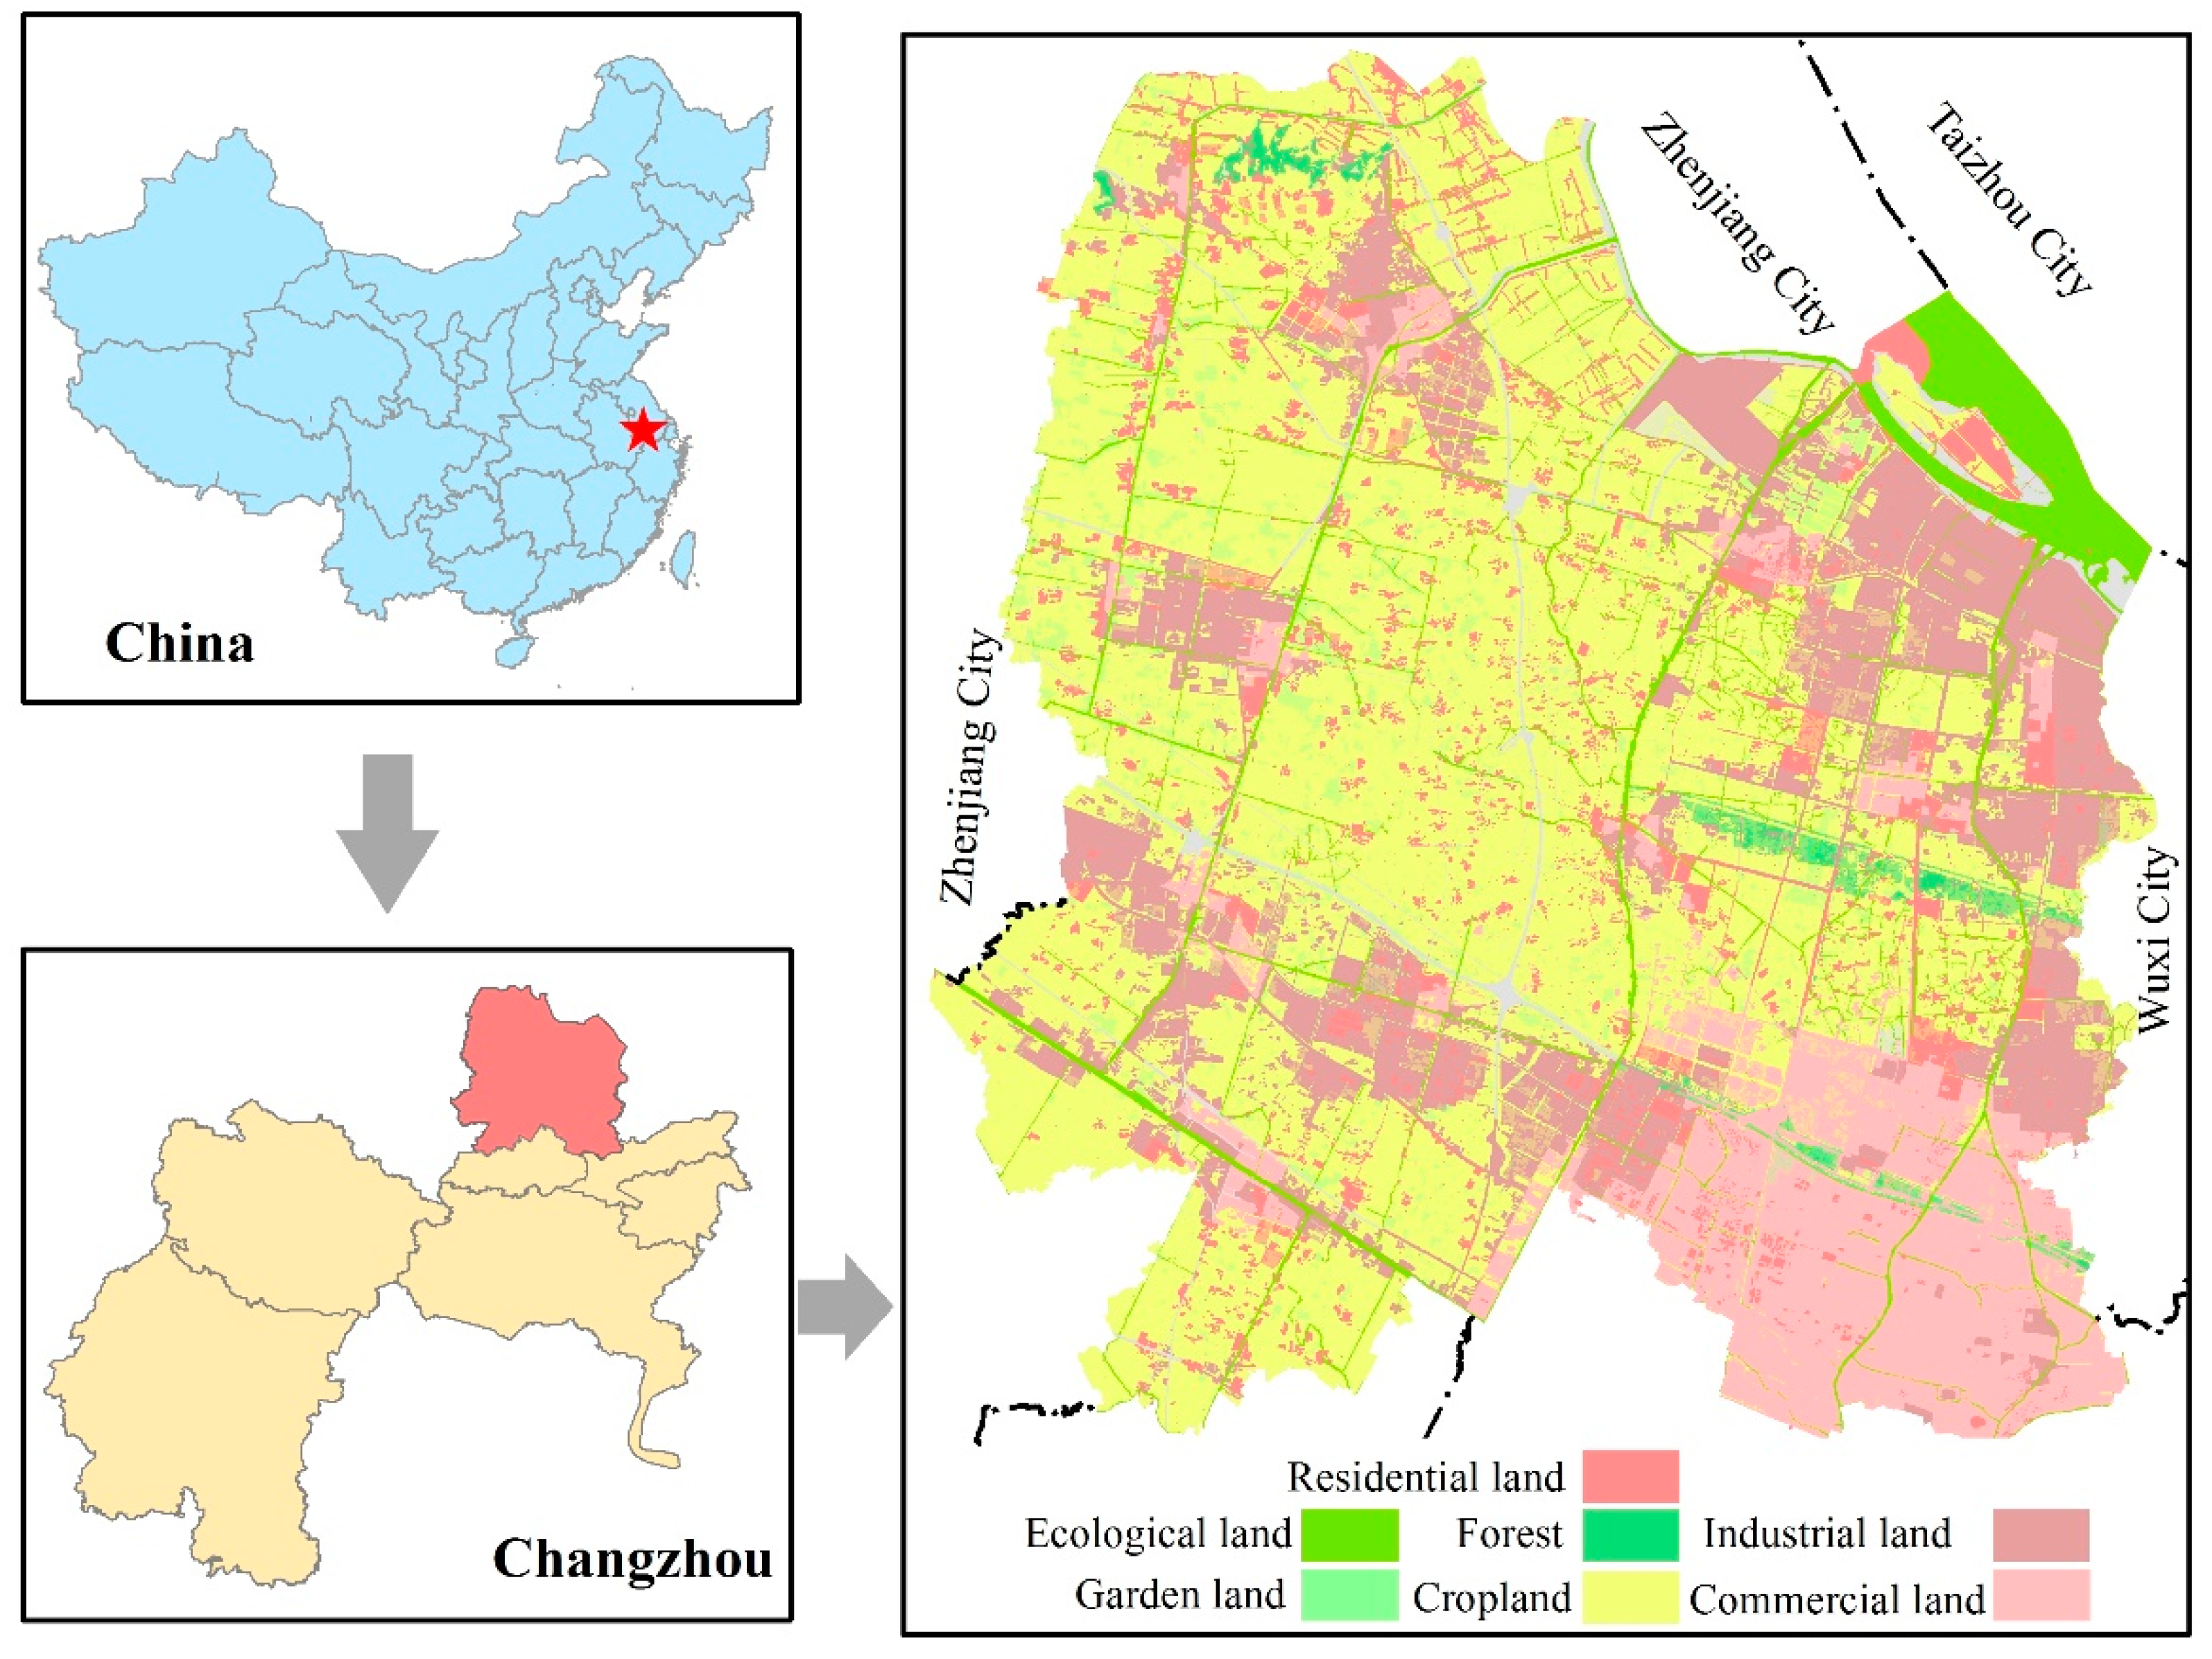
2. Study Area
3. Data Sources and Study Methods
3.1. Data Sources
3.2. Study Methods
3.2.1. Construction of an Evaluation Index System
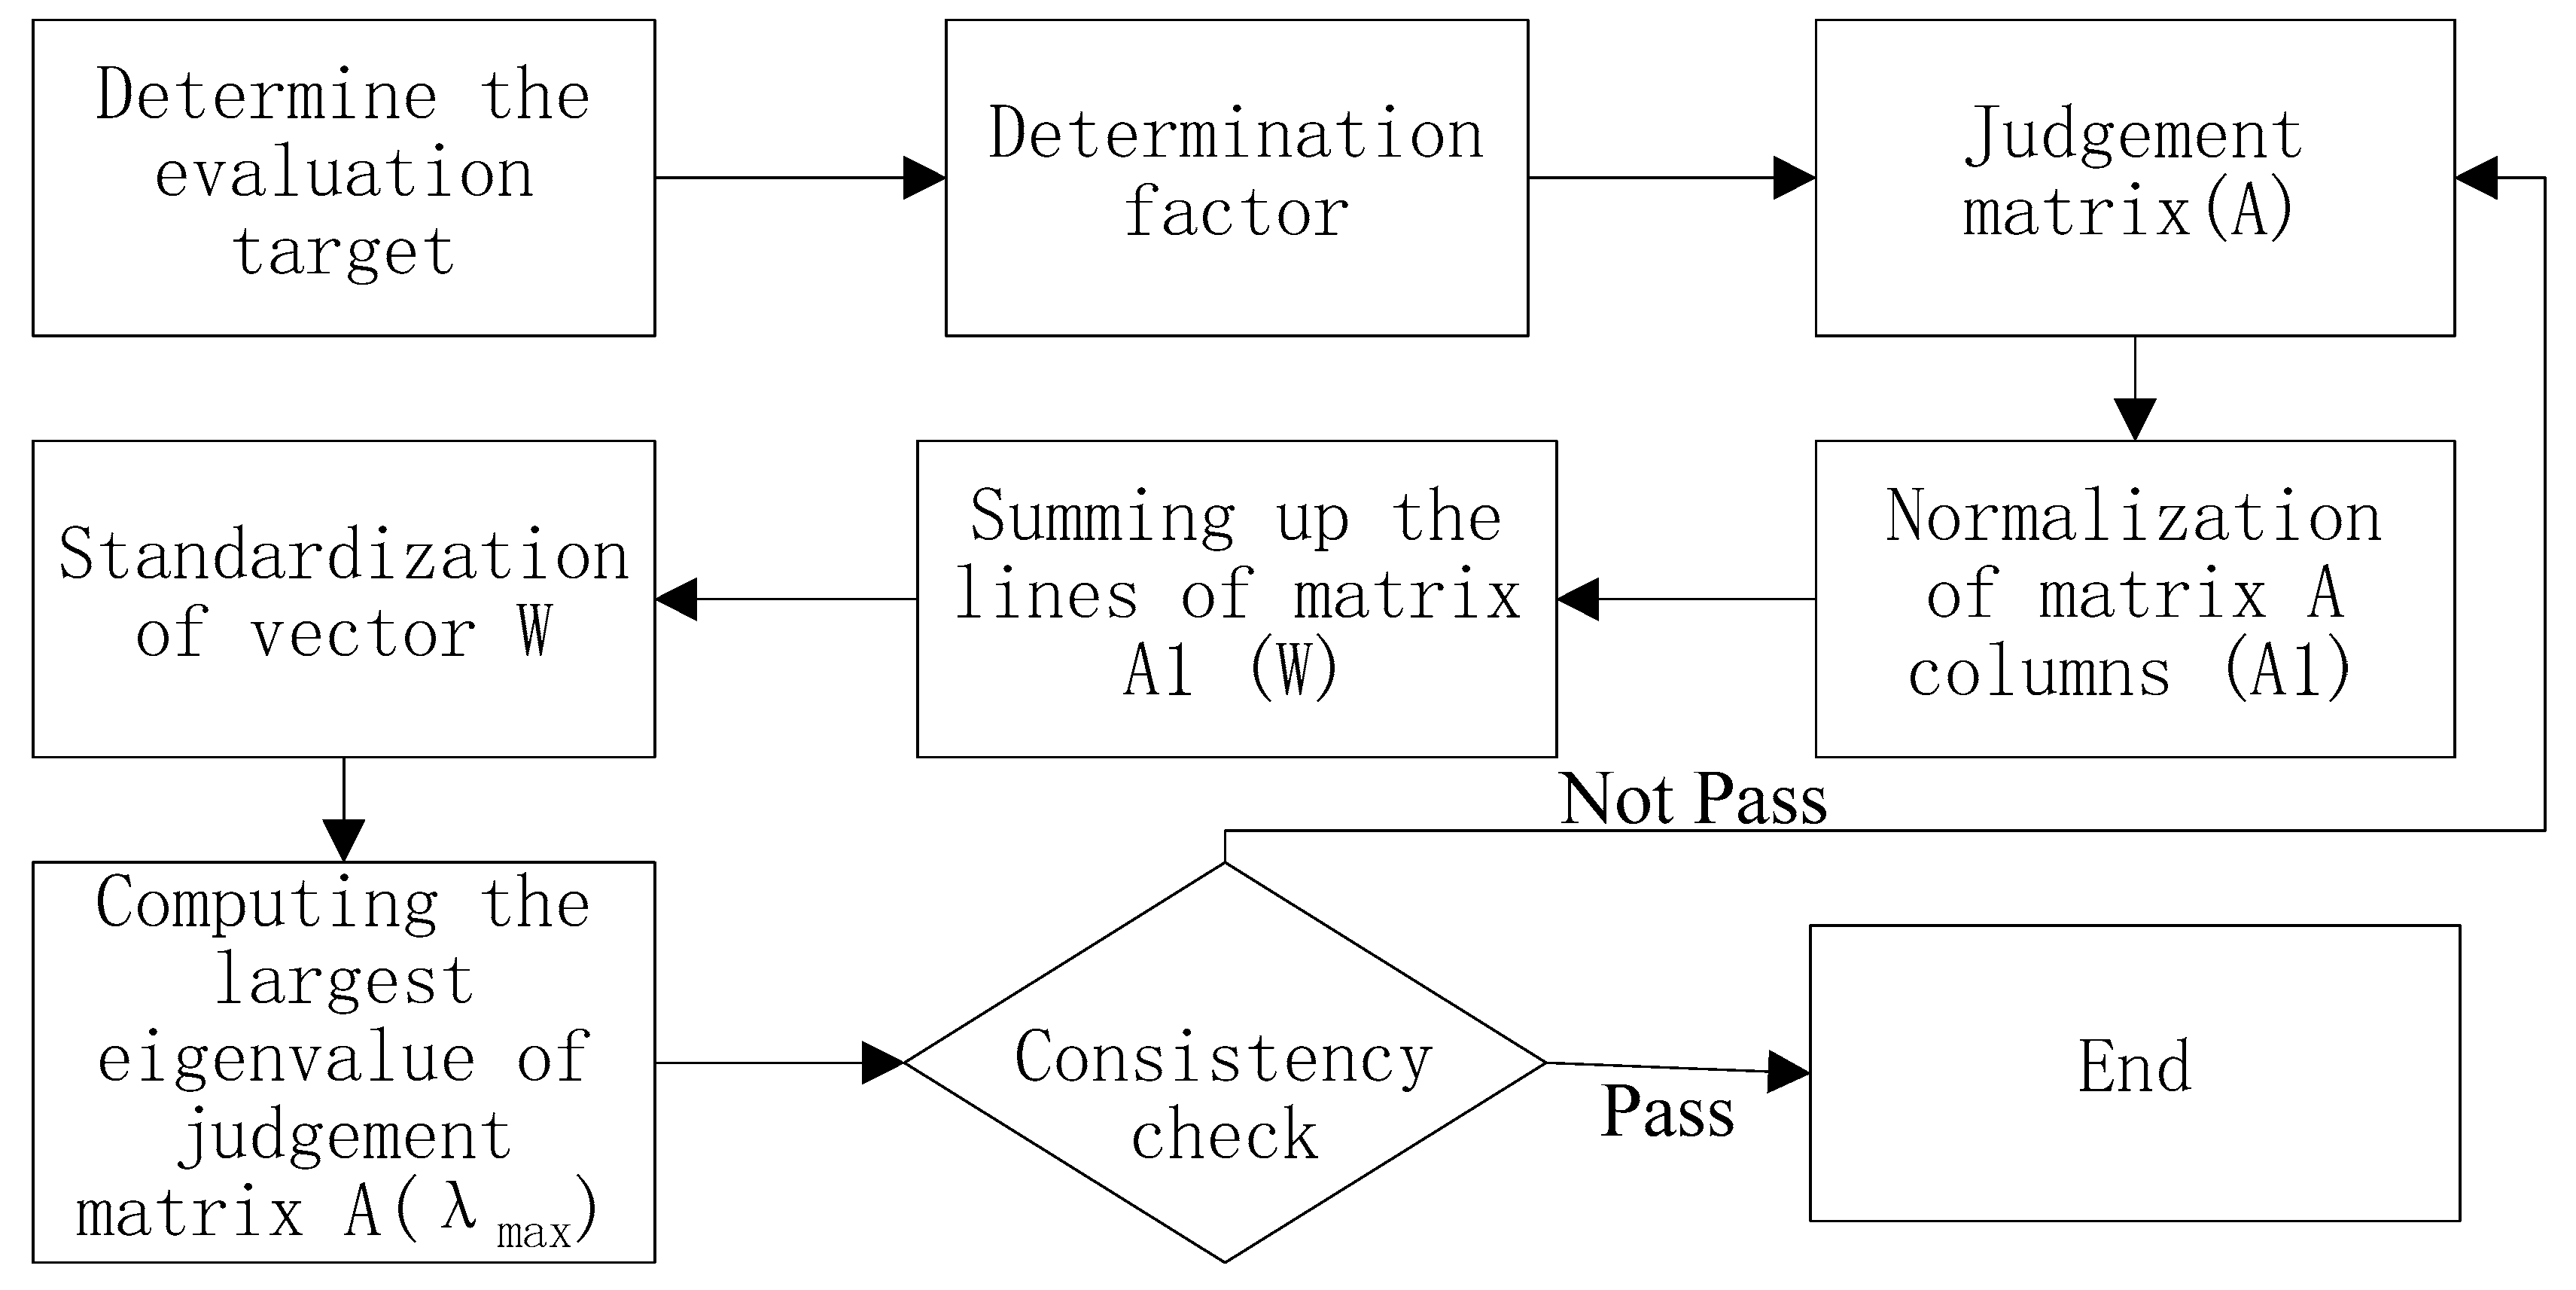
3.2.2. Determination of the Weights of Indices
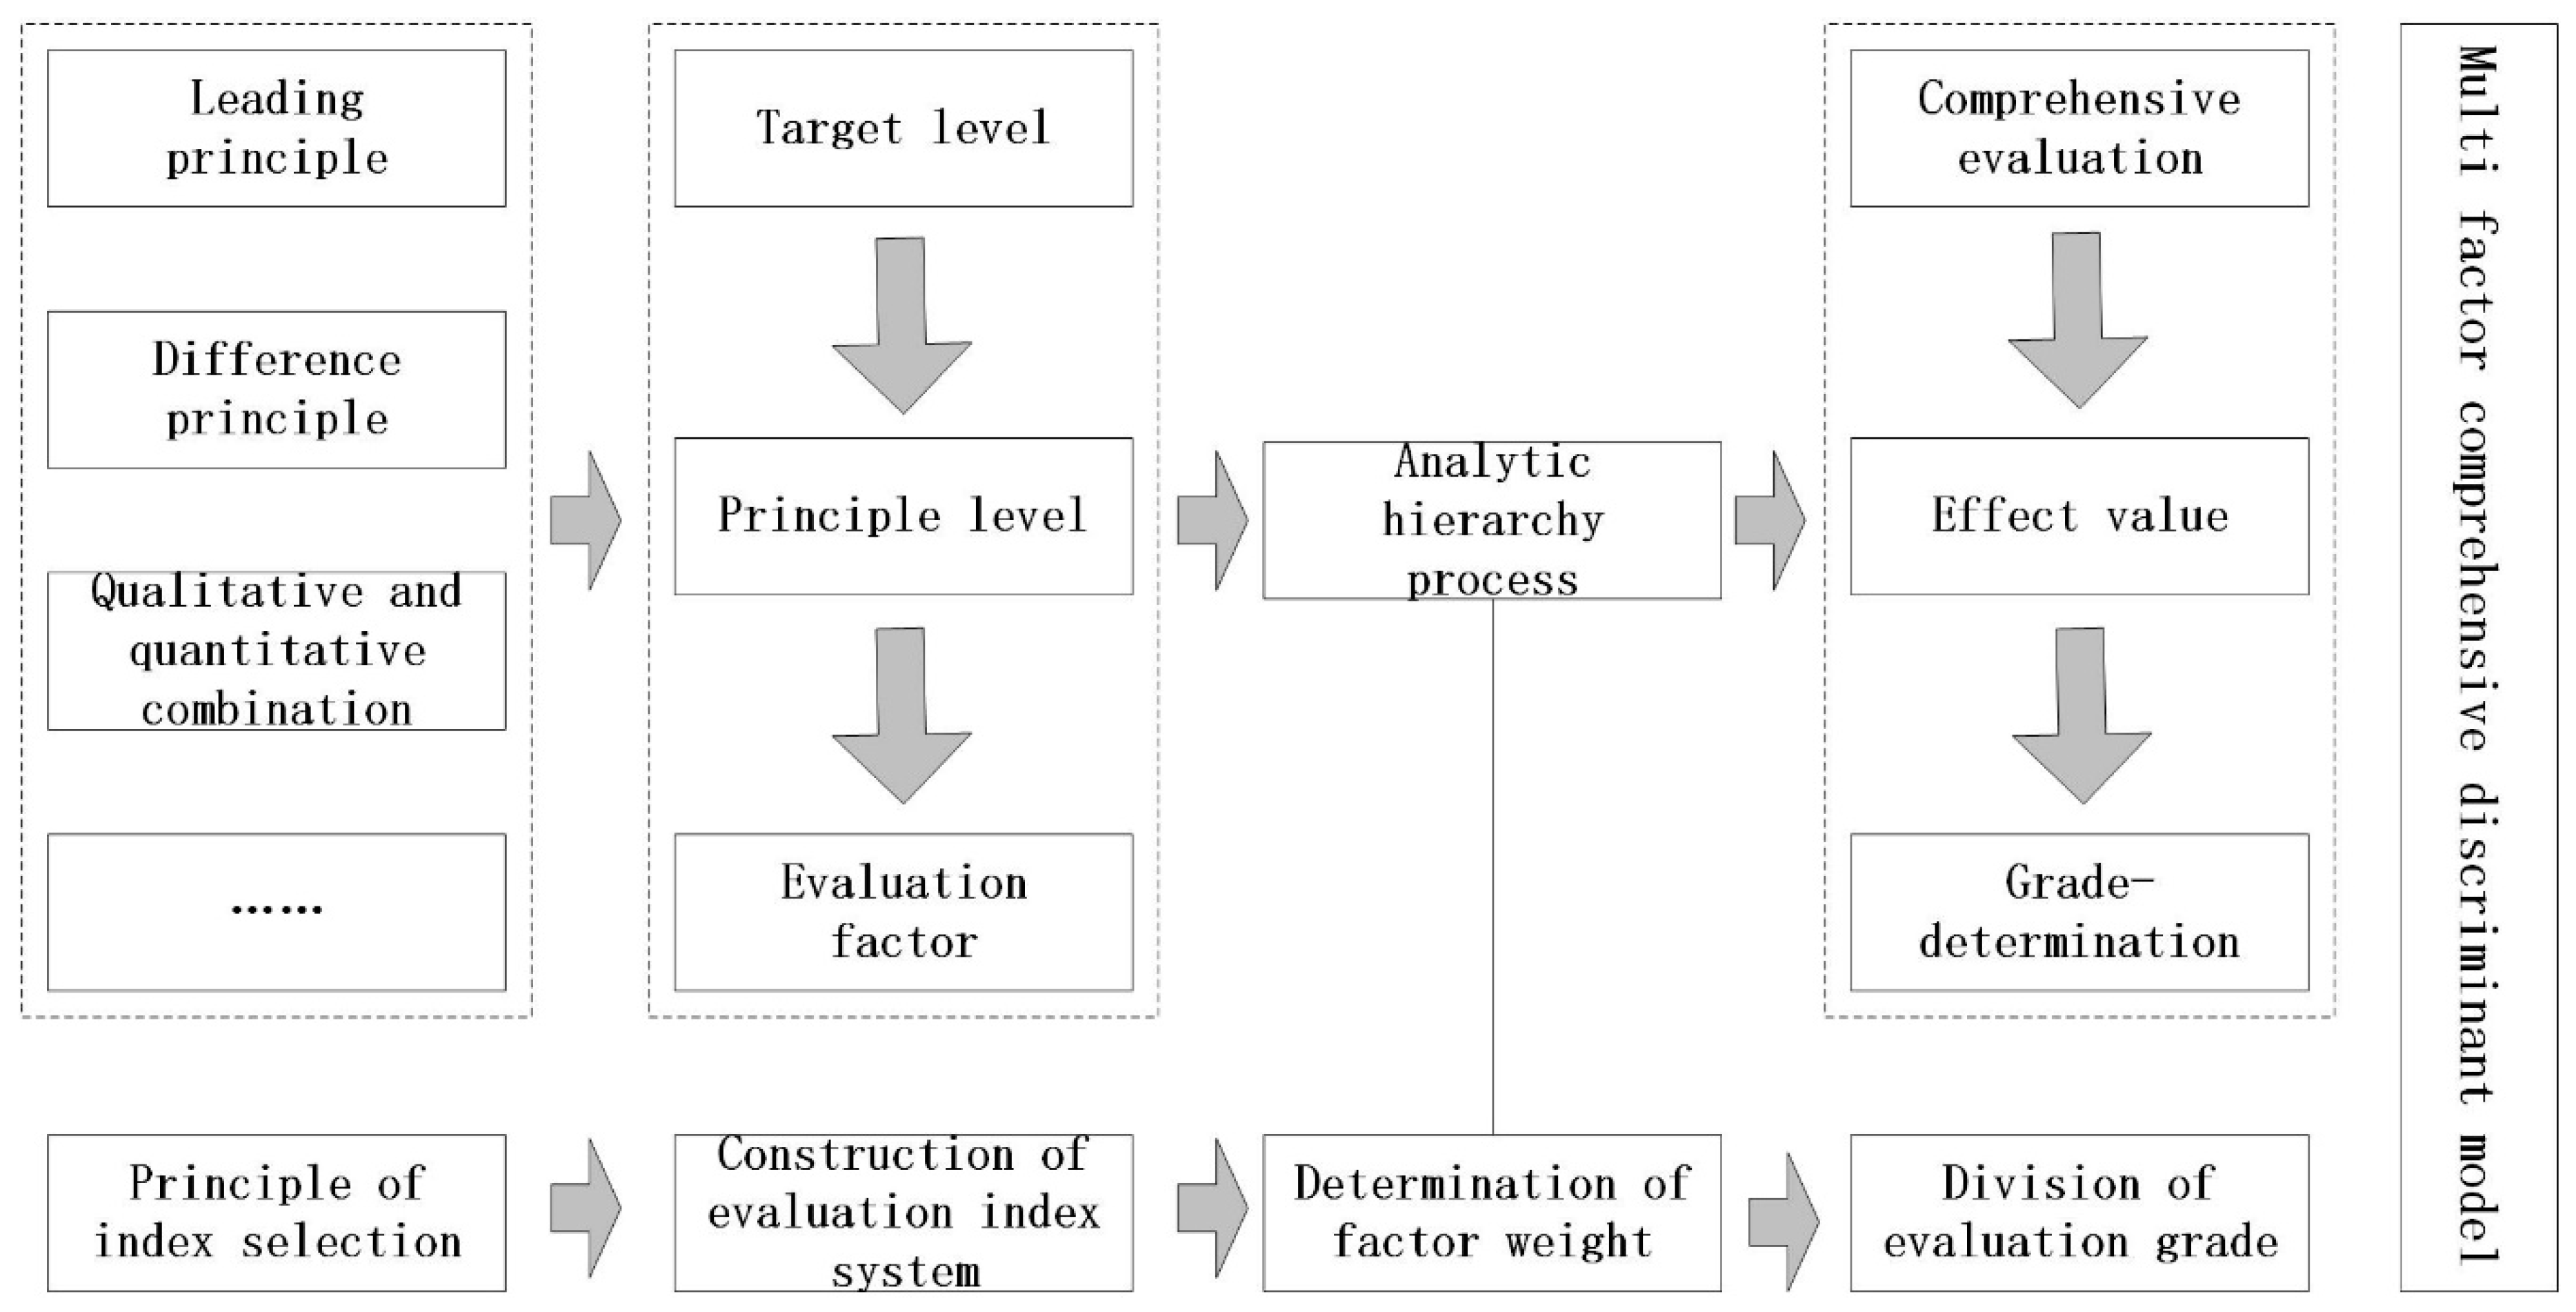
3.2.3. Establishment of an Integrated Multi-Factor Assessment Model
3.2.4. Estimation Model of PCC Based on Land Resources
LCCI = P/LCC
4. Result Analysis
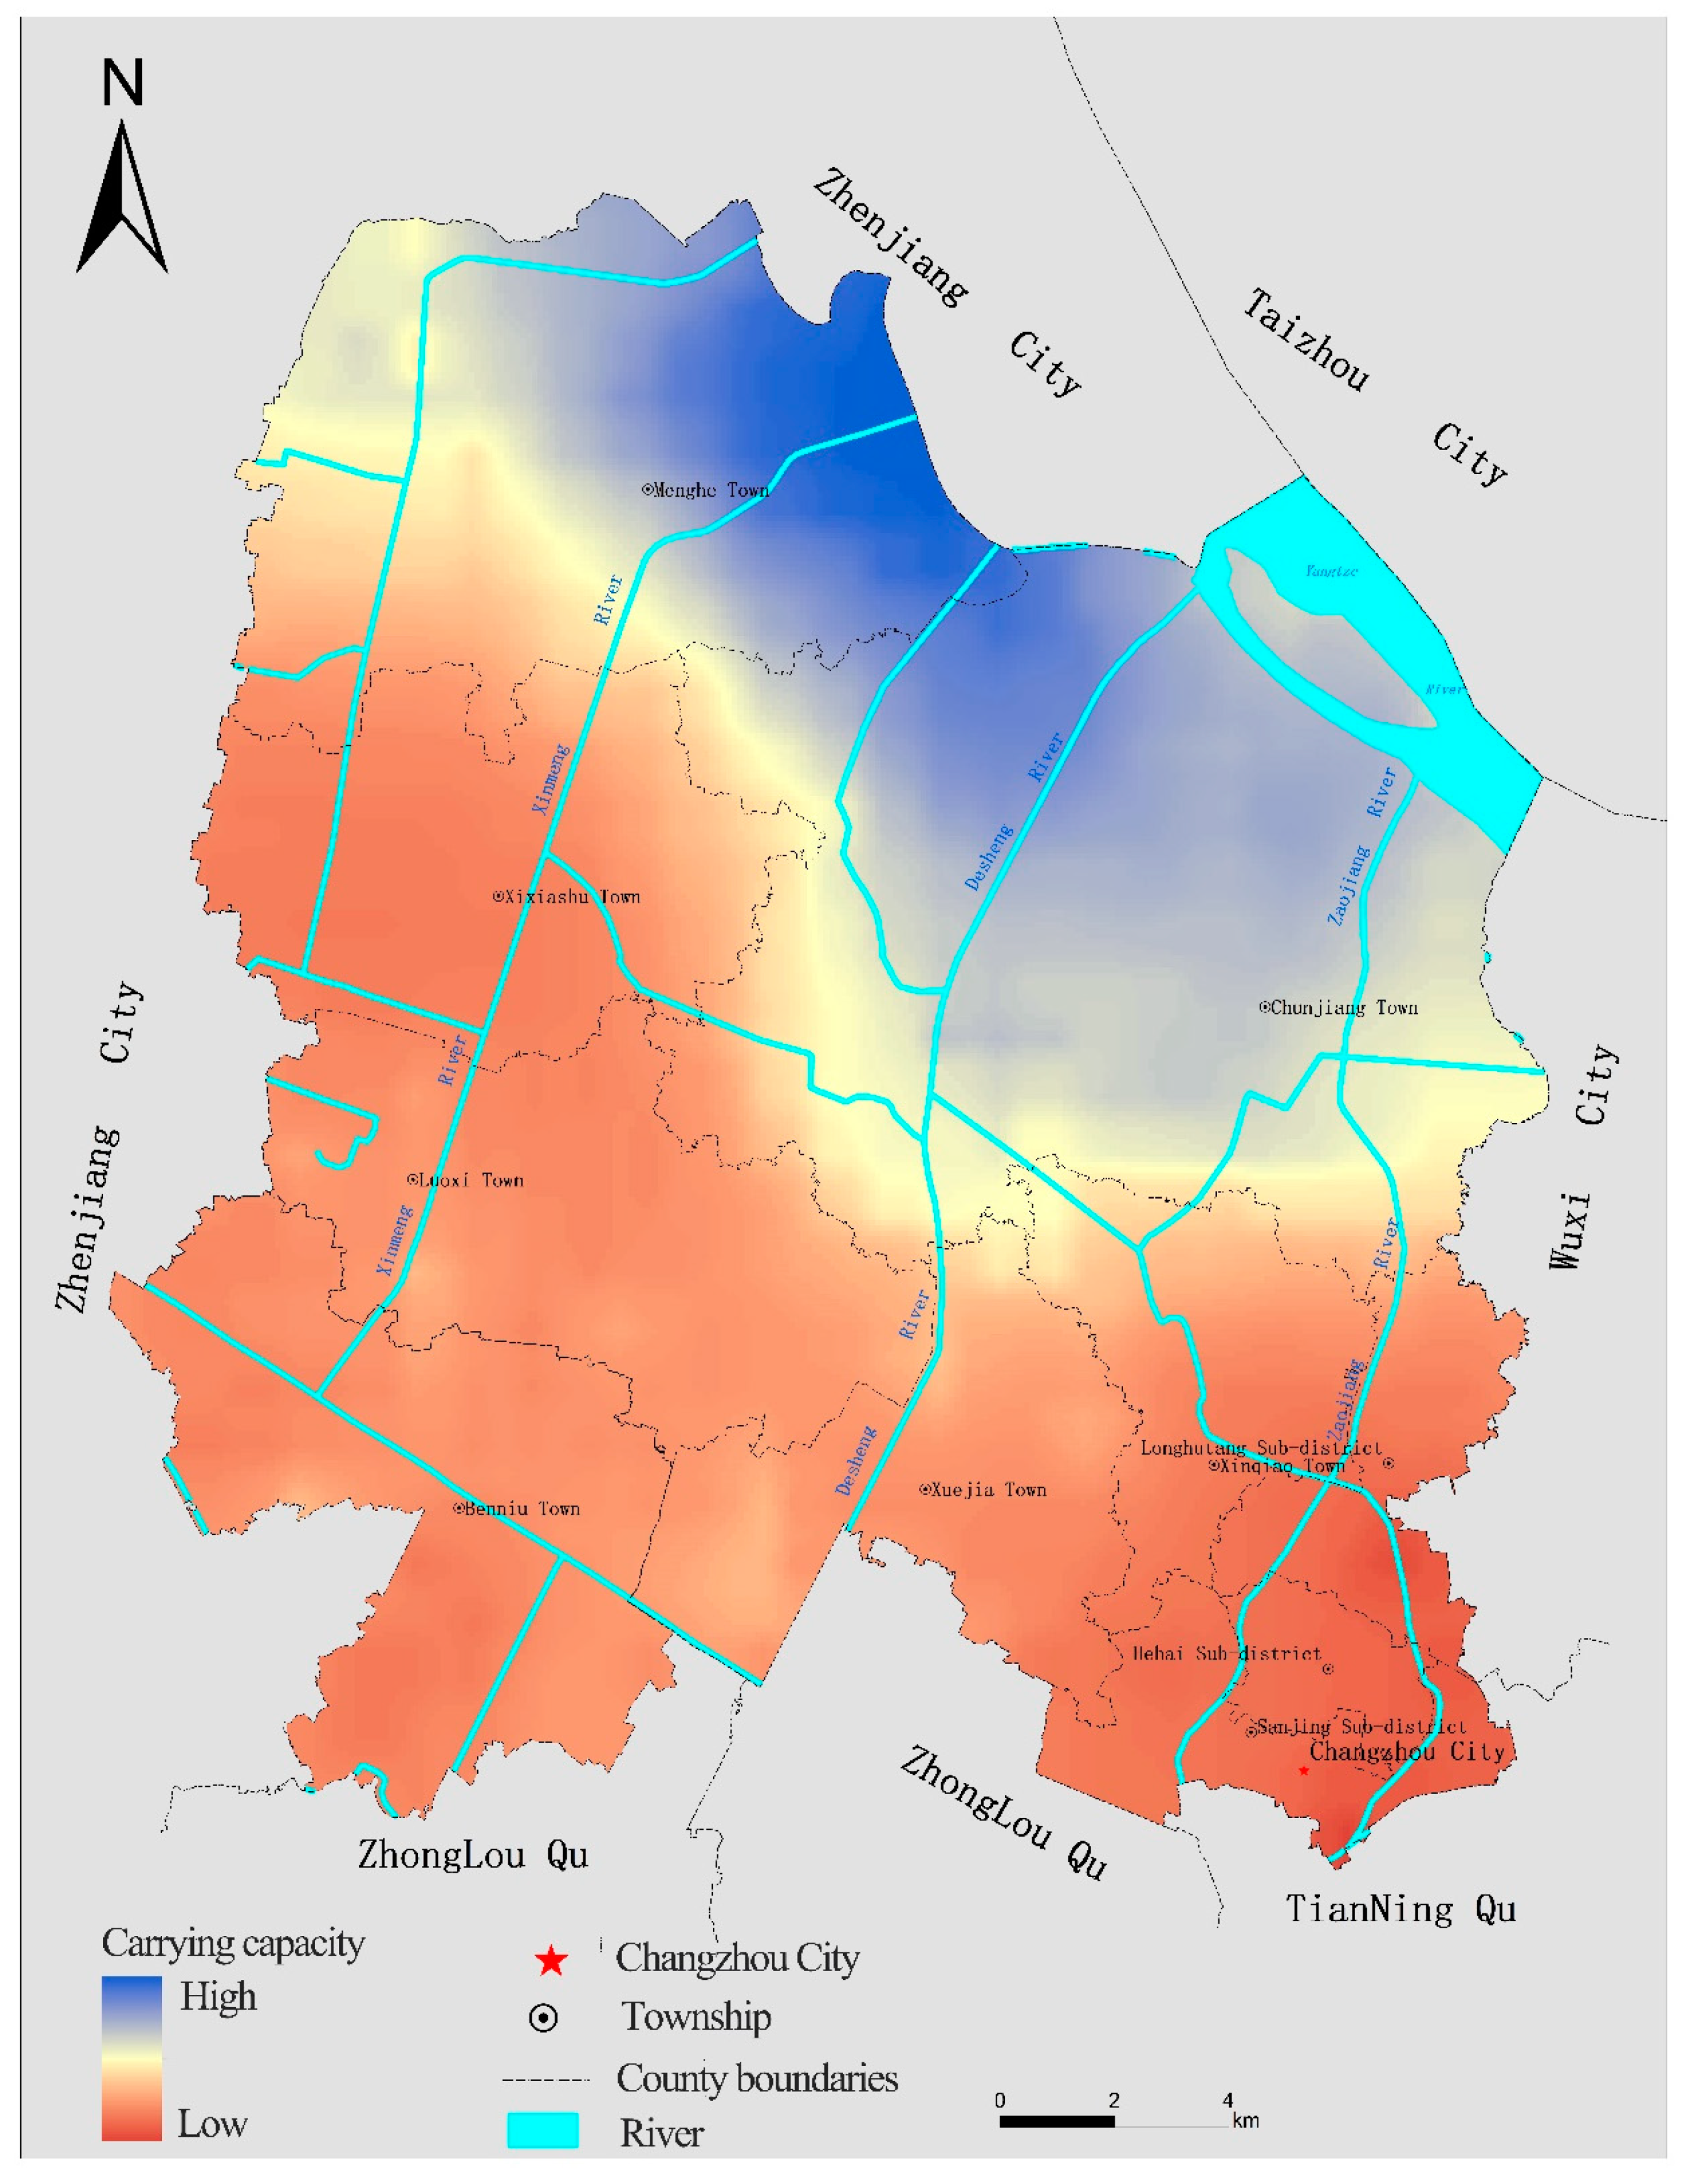
4.1. Evaluation of the Comprehensive RECC of Xinbei District
4.2. Estimation of the PCC of Xinbei District Based on Land Resources
4.2.1. Total Supply for Domestic Food Consumption
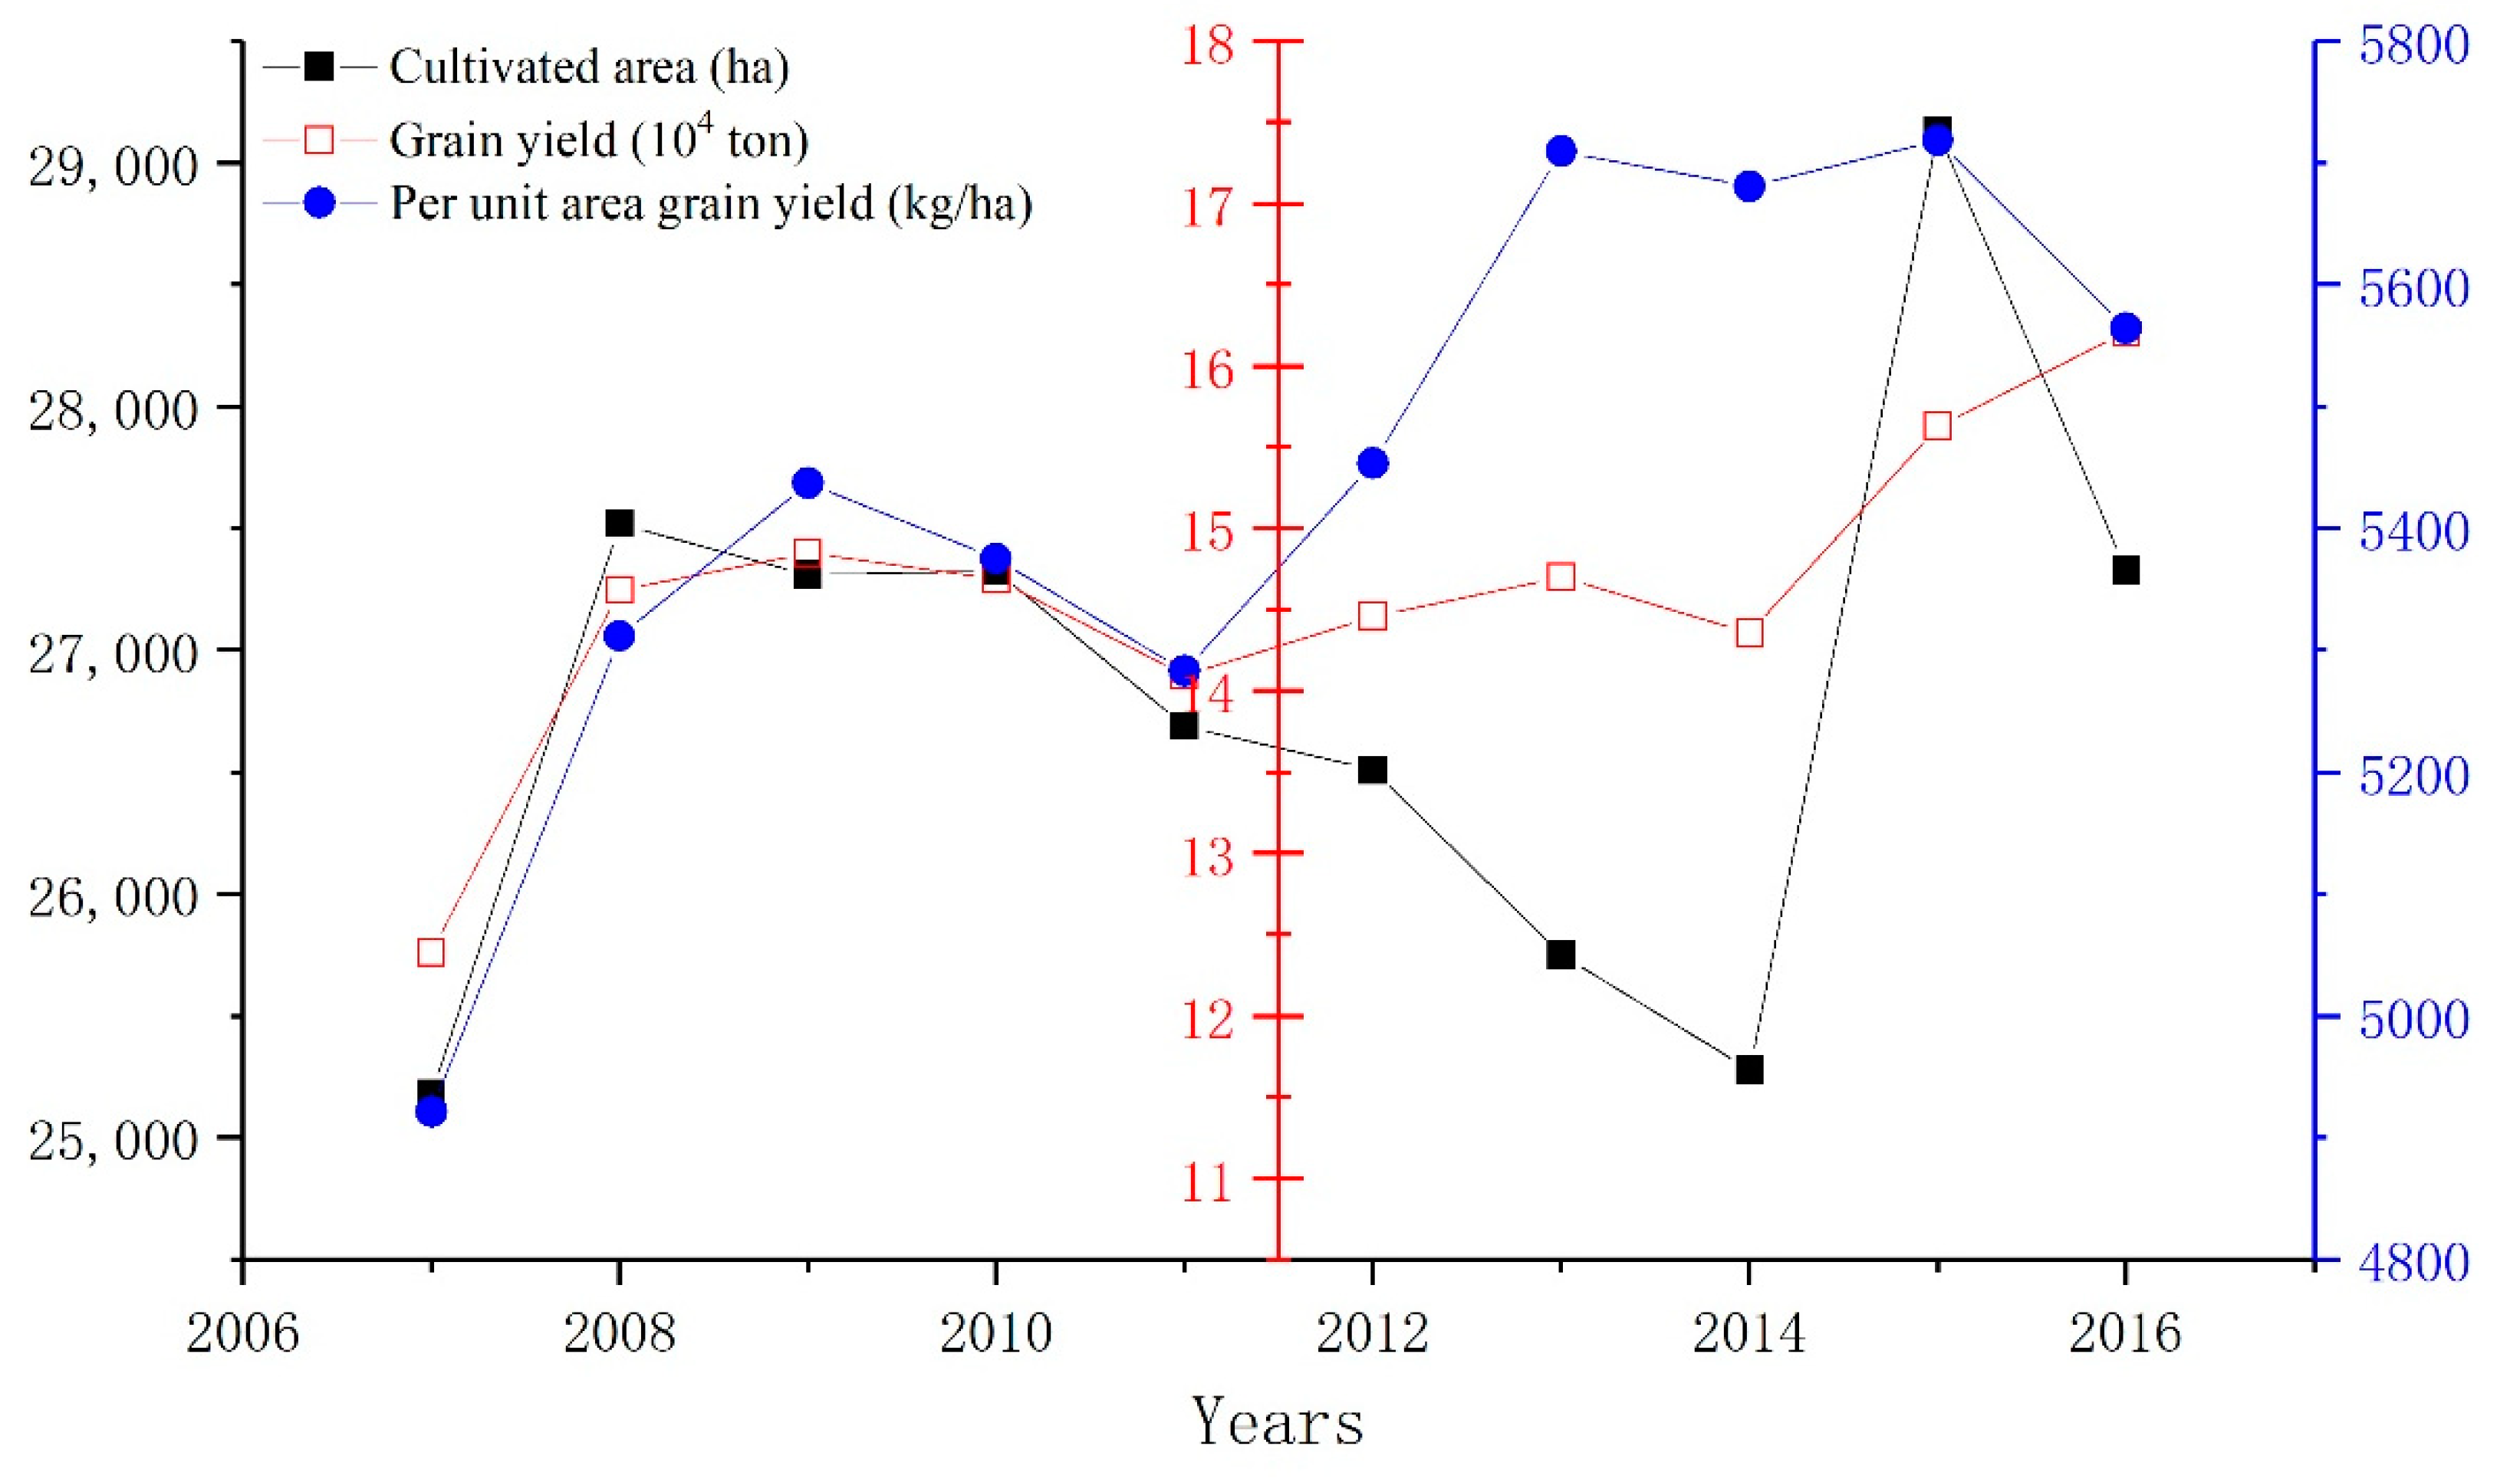
- Food cultivation area estimation. By calculating the average farmland areas of Xinbei District from the data collected between 2007 and 2016, the farmland areas in 2035 and 2050 are estimated, which are 26,699 hectares and 26,592 hectares, respectively.
- Food yield per unit area estimation. Based on the total food production output and the farmland area of Xinbei District reported in the 2007–2016 Statistical Yearbook (Figure 5), the food yield per unit area is calculated. Since 2007, the food yield per unit area has been growing steadily (Figure 5). However, presently, the food yield per unit area of Xinbei District is already high. Under the currently predictable food production conditions, it is expected that future yield per unit area is not likely to increase significantly. Therefore, the food yield per unit area in 2035 is estimated by calculating the average yield per unit area of the recent 10 years, which is 5445.72 kg/ha; the food yield per unit area in 2050 is estimated by calculating the average yield per unit area of the recent 5 years, which is 5625.57 kg/ha.
- Total food production estimation. According to the above estimation of farmland area and food yield per unit area, the total food production of Xinbei District in 2035 and 2050 is estimated, as shown in Table 4.
- Seed food consumption estimation. The seed food consumption depends mainly on the farmland area and the number of seeds used per unit area. Since the number of seeds used per unit area barely changes between years, a value of 113 kg/ha based on existing research results is used to calculate the seed food consumption. Then, the seed food consumption of Xinbei District in 2035 and 2050 is estimated according to the farmland area estimated above, as shown in Table 4.
- Industrial food consumption estimation. Here the industrial food consumption mainly refers to food used for brewing, seasoning production, and feed production, while excluding processed food products and cakes. Based on the industrial product manufacturing statistics from the Statistical Yearbook (2010–2016) of Xinbei District, along with the published conversion ratio of the production volume of various industrial products to the amount of food consumed, the industrial food consumption between 2010 and 2016 is calculated, with a conversion ratio of 1:2.3 for liquor, 1:0.172 for beer, 1:24 for MSG, and 1:0.7 for forage.SPSS is then used to perform curve estimation on the converted industrial food consumption data of Xinbei District between 2010 and 2016. The calculated R2 indicates that linear regression is the most fitting, with an R2 value of 0.758. The industrial food consumption of Xinbei District in 2035 and 2050 is then estimated based on the following prediction formula:y = 12731x + 54348Here, x refers to the 2010–2016 time period, and y refers to the industrial food consumption of the corresponding year. The industrial food consumption of Xinbei District in 2035 and 2050 is then estimated based on the above prediction model, as shown in Table 4.
- Domestic food consumption estimation. According to the above estimation results, the domestic food consumption for the regional population of each county and town is calculated by subtracting the seed and industrial food consumptions from the total food supply. The results are listed in Table 4.
4.2.2. Per Capita Food Consumption
4.2.3. Estimation of the PCC of Xinbei District
5. Recommendations Based on the Evaluation of RECC
5.1. Land Rearrangement and Spatial Planning Strategies
5.1.1. Establishing a Dynamic Monitoring and Early Warning Mechanism for the RECC
5.1.2. Define Territorial Control Space Based on the RECC
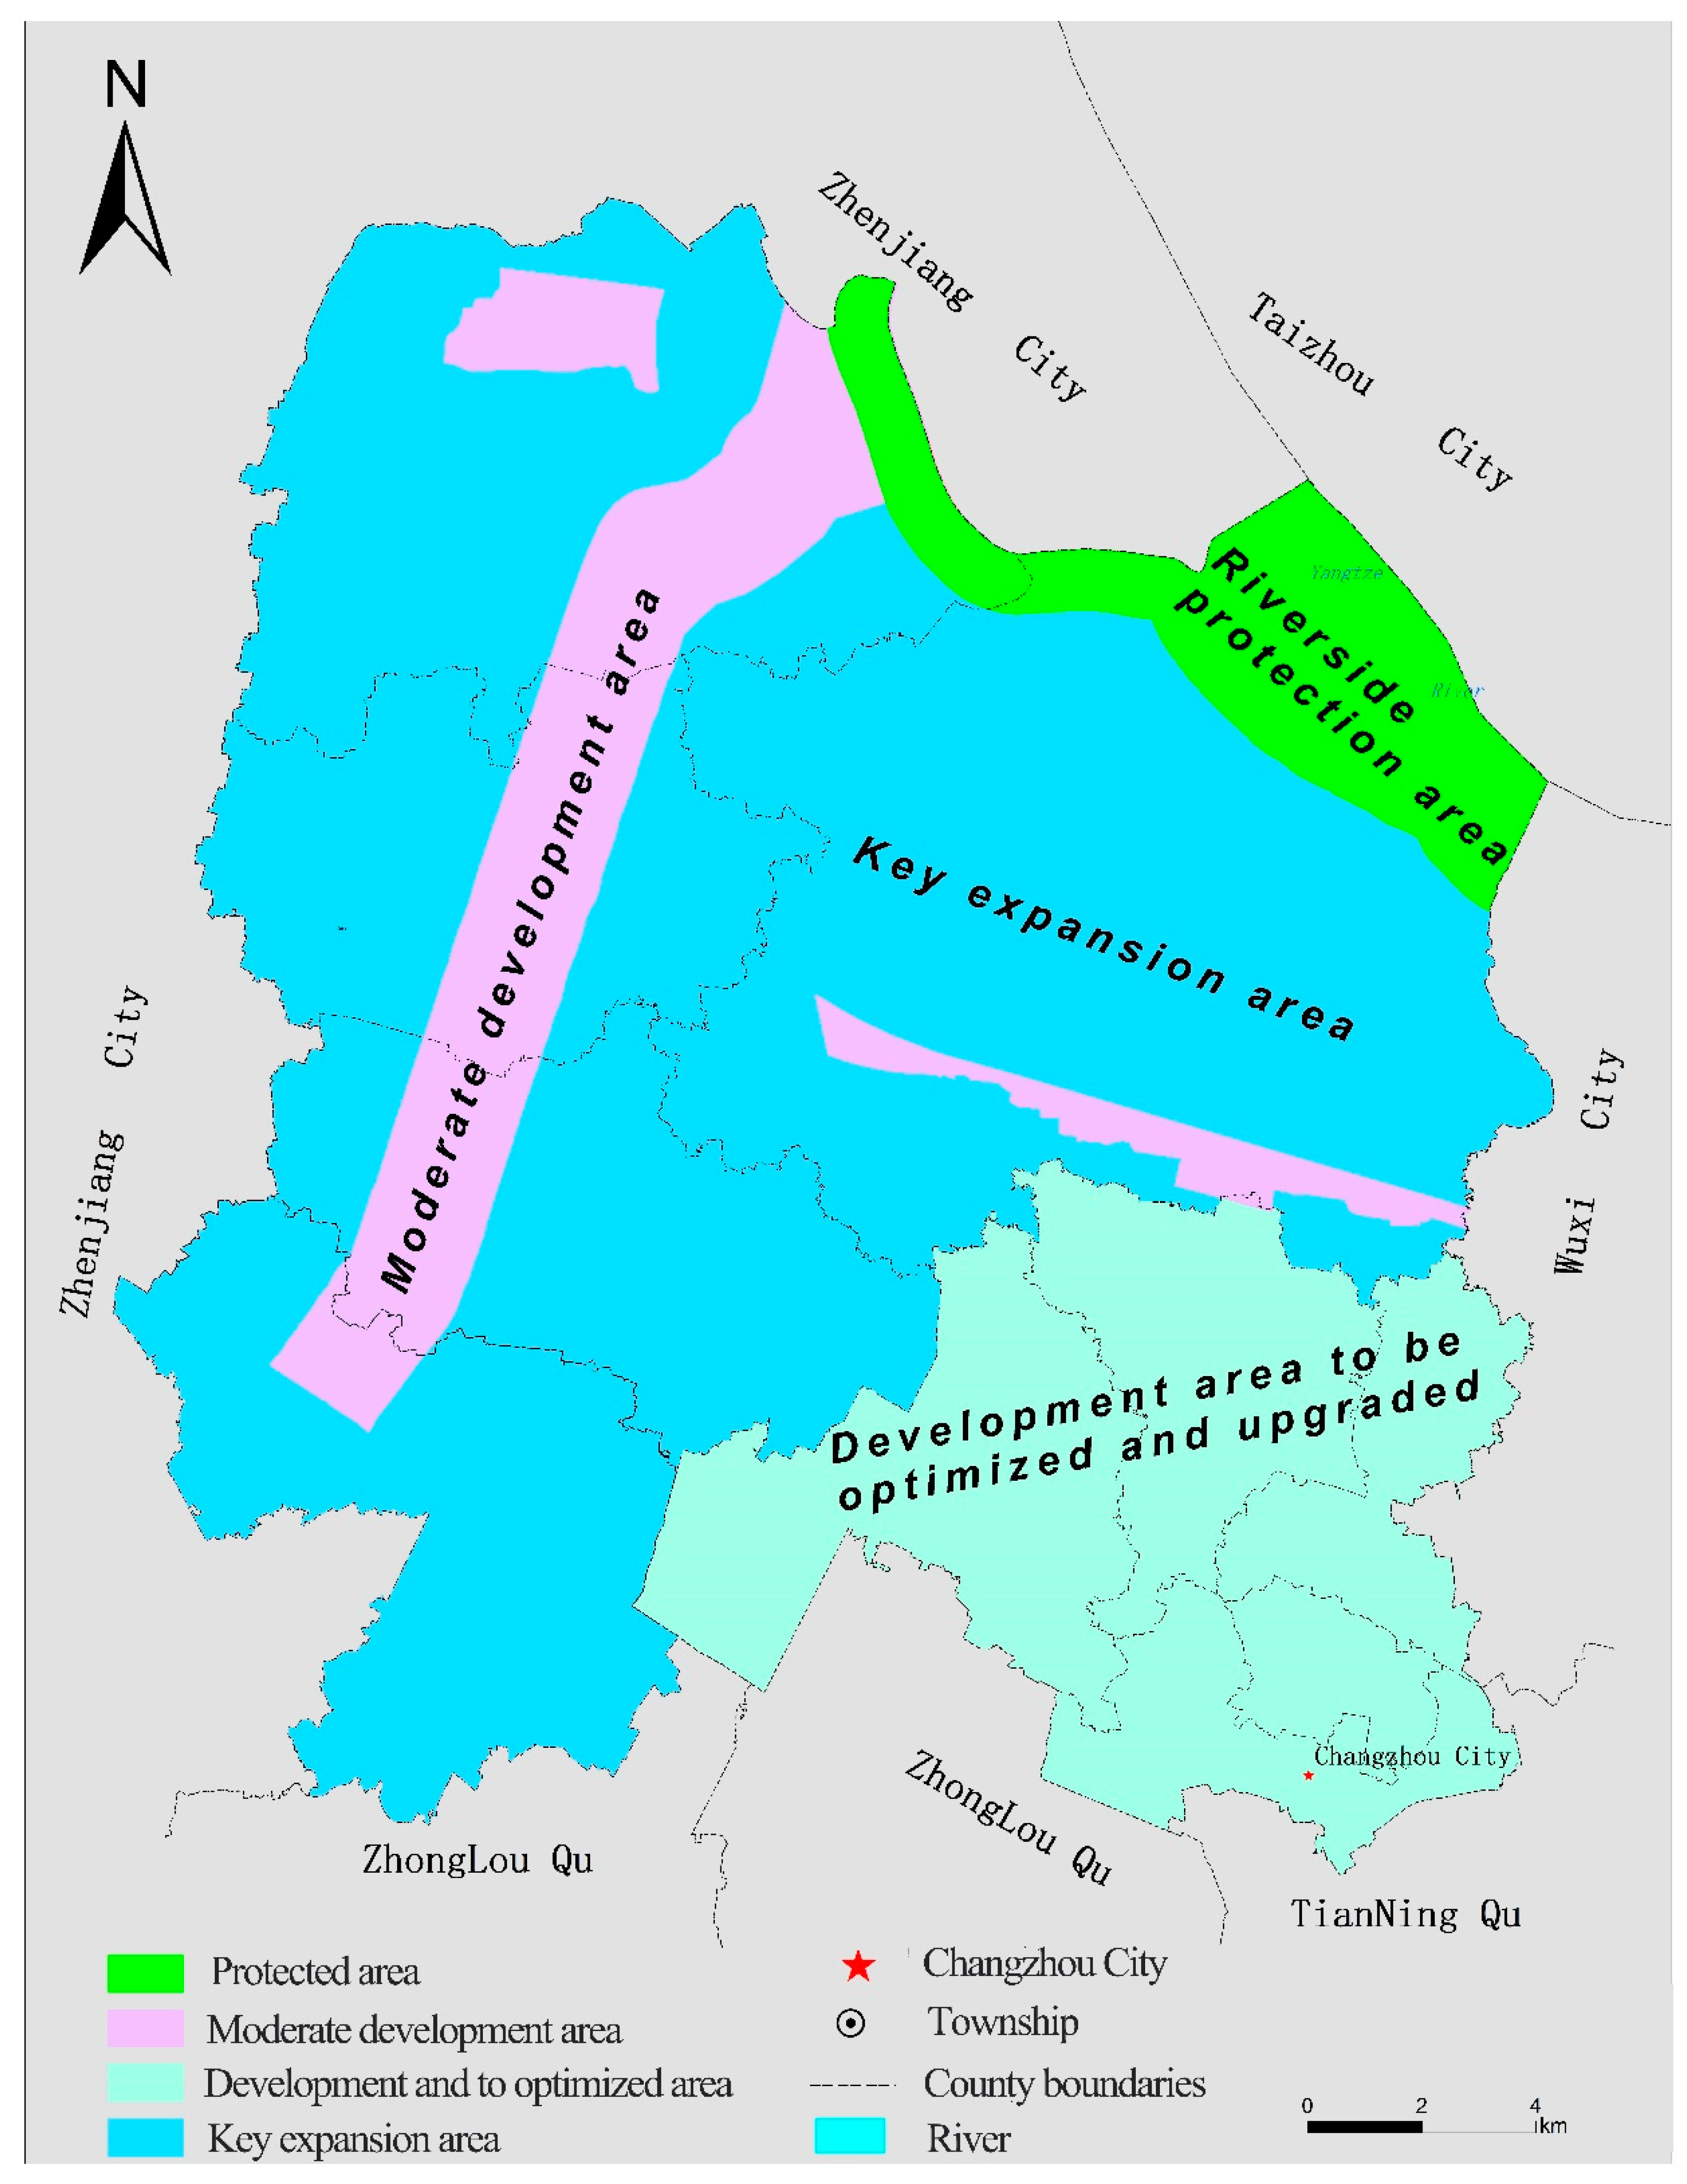
5.2. Layout of Land Use
5.2.1. The Development Area to Be Optimized and Upgraded
5.2.2. The Moderate Development Area
5.2.3. The Key Expansion Area
5.2.4. The Riverside Protection Area
6. Discussion and Conclusions
Author Contributions
Funding
Acknowledgments
Conflicts of Interest
References
- Lu, D.D.; Fan, J.; Liu, W.D.; Ji, X.C.; Mu, X.W. Regional Space, Function and Development of China; China Land Press: Beijing, China, 2011. (In Chinese) [Google Scholar]
- Zhang, B.C.; Guo, F. Studies on the carrying capacity of natural resources. Econ. Surv. 2006, 6, 22–25. (In Chinese) [Google Scholar]
- Tang, B.J.; Hu, Y.; Li, H.N.; Yang, D.W.; Liu, J.P. Research on comprehensive carrying capacity of Beijing–Tianjin–Hebei region based on state-space method. Nat. Hazards 2016, 84, 113–128. [Google Scholar] [CrossRef]
- Saveriades, A. Establishing the social tourism carrying capacity for the tourist resorts of the east coast of the Republic of Cyprus. Tour. Manag. 2000, 21, 147–156. [Google Scholar] [CrossRef]
- Santoso, E.B.; Erli, H.K.D.M.; Aulia, B.U.; Ghozali, A. Concept of Carrying Capacity: Challenges in Spatial Planning. Procedia Soc. Behav. Sci. 2014, 135, 130–135. [Google Scholar] [CrossRef]
- Godschalk, D.R.; Parker, F.H. Carrying capacity: A key to environmental planning? J. Soil Water Conserv. 1975, 235, 23–28. [Google Scholar]
- Baldwin, J.H. Assessment of Environment Carrying capacity in Berkeley. J. Environ. Plan. Manag. 1985, 76, 234–239. [Google Scholar]
- Kang, P.; Xu, L. Water environmental carrying capacity assessment of an industrial park. Procedia Environ. Sci. 2012, 13, 879–890. [Google Scholar] [CrossRef]
- Świąder, M.; Szewrański, S.; Kazak, J. Foodshed as an example of preliminary research for conducting environmental carrying capacity analysis. Sustainability 2018, 10, 882. [Google Scholar] [CrossRef]
- Liu, R.Z.; Borthwick, A.G.L. Measurement and assessment of carrying capacity of the environment in Ningbo, China. J. Environ. Manag. 2011, 92, 2047–2053. [Google Scholar] [CrossRef]
- Zeng, W.H.; Wang, H.D.; Xue, J.Y.; Ye, W.H.; Guan, B.R. Theory of environment carrying capacity and it’s application of environmental planning on Meizhou Bay. China Environ. Sci. 1998, S1, 71–74. [Google Scholar]
- Daily, G.C.; Ehrlich, P.R. Socioeconomic Equity, Sustainability, and Earth’s Carrying Capacity. Ecol. Appl. 1996, 6, 991–1001. [Google Scholar] [CrossRef]
- Yu, D.-L.; Mao, H.-Y. Regional carrying capacity: Case studies of Bohai Rim area. J. Geogr. Sci. 2002, 12, 177–185. [Google Scholar]
- Oh, K.; Jeong, Y.; Lee, D.; Lee, W.; Choi, J. Determining development density using the Urban Carrying Capacity Assessment System. Landsc. Urban Plan. 2005, 73, 1–15. [Google Scholar] [CrossRef]
- Deng, W. Discussion on mountain area resource and environment carrying capacity. Geogr. Res. 2010, 28, 952–961. [Google Scholar]
- Feng, Z.; Sun, T.; Yang, Y.; Yan, H. The Progress of Resources and Environment Carrying Capacity: From Single-factor Carrying Capacity Research to Comprehensive Research. J. Res. Ecol. 2018, 9, 125–134. [Google Scholar]
- Wang, S.; Yang, F.L.; Xu, L.; Du, J. Multi-scale analysis of the water resources carrying capacity of the Liaohe Basin based on ecological footprints. J. Clean. Prod. 2013, 53, 158–166. [Google Scholar] [CrossRef]
- Yang, J.; Lei, K.; Khu, S.; Meng, W. Assessment of Water Resources Carrying Capacity for Sustainable Development Based on a System Dynamics Model: A Case Study of Tieling City, China. Water Resour. Manag. 2015, 29, 885–899. [Google Scholar] [CrossRef]
- Specht, P.H. Munificence and Carrying Capacity of the Environment and Organization Formation. Entrep. Theory Pract. 1993, 17, 77. [Google Scholar] [CrossRef]
- Arrow, K.; Bolin, B.; Costanza, R.; Dasgupta, P.; Folke, C.; Holling, C.S.; Jansson, B.O.; Levin, S.; Mäler, K.G.; Perrings, C.; et al. Economic Growth, Carrying Capacity, and the Environment. Science 1995, 268, 520–521. [Google Scholar] [CrossRef]
- Trakolis, D. Carrying capacity—An old concept: Significance for the management of urban forest resources. New Medit 2003, 3, 58–64. [Google Scholar]
- Martire, S.; Castellani, V.; Sala, S. Carrying capacity assessment of forest resources: Enhancing environmental sustainability in energy production at local scale. Resour. Conserv. Recycl. 2015, 94, 11–20. [Google Scholar] [CrossRef]
- Ng, K.L.; Obbard, J.P. Strategic environmental assessment in Hong Kong. Environ. Int. 2005, 31, 483–492. [Google Scholar] [CrossRef] [PubMed]
- Liu, H. Comprehensive carrying capacity of the urban agglomeration in the Yangtze River Delta, China. Habitat Int. 2012, 36, 462–470. [Google Scholar] [CrossRef]
- Zheng, D.; Zhang, Y.; Zang, Z.; Sun, C. Empirical research on carrying capacity of human settlement system in Dalian City, Liaoning Province, China. Chin. Geogr. Sci. 2015, 25, 237–249. [Google Scholar] [CrossRef]
- Cheng, J.Y.; Zhou, K.; Chen, D.; Fan, J. Evaluation and Analysis of Provincial Differences in Resources and Environment Carrying Capacity in China. Chin. Geogr. Sci. 2016, 26, 539–549. [Google Scholar] [CrossRef]
- Dong, C.; Li, M.; Chen, Z.; Jiang, X.; Chen, Y. Land use scenario simulation based on multi-agent system. In Proceedings of the International Conference on Geoinformatics, Shanghai, China, 24–26 June 2011. [Google Scholar]
- Cheng, Q.; Jiang, P.; Cai, L.; Shan, J.; Zhang, Y.; Wang, L.; Li, M.; Li, F.; Zhu, A.; Chen, D. Delineation of a permanent basic farmland protection area around a city centre: Case study of Changzhou City, China. Land Use Policy 2017, 60, 73–89. [Google Scholar]
- Gao, Y.; Ma, L.; Liu, J.; Zhuang, Z.; Hang, Q.; Li, M. Constructing Ecological Networks Based on Habitat Quality Assessment: A Case Study of Changzhou, China. Sci. Rep. 2017, 7, 46073. [Google Scholar] [CrossRef] [Green Version]
- Cheng, L.; Jiang, P.H.; Li, M.C.; Wang, L.; Gong, Y.; Pian, Y.; Xia, N.; Duan, Y.; Huang, Q. Farmland protection policies and rapid urbanization in China: A case study for Changzhou City. Land Use Policy 2015, 48, 552–566. [Google Scholar]
- Furuya, K. Environmental carrying capacity in an aquaculture ground of seaweeds and shellfish in Sanriku coast. Bull. Fish. Res. Agency 2004, 1, 65–69. [Google Scholar]
- Thompson, S.; Treweek, J.R.; Thurling, D.J. The Potential Application of Strategic Environmental Assessment (SEA) to the Farming of Atlantic Salmon (Salmo salar L.) in Mainland Scotland. J. Environ. Manag. 1995, 45, 219–229. [Google Scholar] [CrossRef]
- Xu, X.Y.; Huang, X. The Study on Population Carrying Capacity of Yangtze River Economic Belt Based on Carbon’s Peak Values. Modern Urban Res. 2016, 65, 21–30. (In Chinese) [Google Scholar]
- Clarke, A.L. Assessing the Carrying Capacity of the Florida Keys. Popul. Environ. 2002, 23, 405–418. [Google Scholar] [CrossRef]
- Wang, J.J.; Yao, X.H.; Li, J.R.; Chang, H.; Wang, Y.G. Assessment for Ecological Carrying Capacity of Heihe River Basin. Res. Environ. Sci. 2000, 13, 44–48. (In Chinese) [Google Scholar]
- Prato, T. Fuzzy adaptive management of social and ecological carrying capacities for protected areas. J. Environ. Manag. 2009, 90, 2551–2557. [Google Scholar] [CrossRef] [PubMed]
- Hardin, G. Cultural carrying capacity: A biological approach to human problems. BioScience 1986, 36, 599–604. [Google Scholar] [CrossRef]


| Category | Factors | Value |
|---|---|---|
| Gross Domestic Product | Primary industry | 2 billion yuan (1.49%) |
| Secondary industry | 69.42 billion yuan (51.79%) | |
| Tertiary industry | 62.61 billion yuan (46.72%) | |
| Fiscal revenue | Total fiscal revenue | 29.4 billion yuan |
| Fixed assets investment | 87.28 billion yuan | |
| Per capita disposable income | Urban residents | 52,407 yuan |
| Rural residents | 26,753 yuan |
| Data Type | Data Name | Data Attribute | Data Source | Data Usage |
|---|---|---|---|---|
| Land use data | Land use change data between 2009 and 2016 | Vector data | Changzhou Municipal Bureau of Land and Resources (http://www.jsmlr.gov.cn/cz/) | Analysing land use change between 2009 and 2016 |
| Per capita land area data | Statistical data | Changzhou Statistical Yearbook (http://tjj.changzhou.gov.cn/) | Resource carrying capacity evaluation | |
| Land use intensity data | Statistical data | Resource carrying capacity evaluation | ||
| Land output benefit data | Statistical data | Resource carrying capacity evaluation | ||
| Farmland quality grade data | Farmland natural grade data | Vector data | Changzhou Municipal Bureau of Land and Resources (http://www.jsmlr.gov.cn/cz/) | Resource carrying capacity evaluation |
| Farmland use grade data | Vector data | Resource carrying capacity evaluation | ||
| Farmland economic grade data | Vector data | Resource carrying capacity evaluation | ||
| Heavy metal content in soil data | Cadmium content in soil data | Vector data | Harmonized China Soil Database (http://vdb3.soil.csdb.cn/) | Environmental carrying capacity evaluation |
| Chromium content in soil data | Vector data | Environmental carrying capacity evaluation | ||
| Mercury content in soil data | Vector data | Environmental carrying capacity evaluation | ||
| Lead content in soil data | Vector data | Environmental carrying capacity evaluation | ||
| Arsenic content in soil data | Vector data | Environmental carrying capacity evaluation | ||
| Copper content in soil data | Vector data | Environmental carrying capacity evaluation | ||
| Zinc content in soil data | Vector data | Environmental carrying capacity evaluation | ||
| Economic development over the years data | GDP data of primary industry | Statistical data | Changzhou Statistical Yearbook (http://tjj.changzhou.gov.cn/) | Population carrying capacity estimation |
| GDP data of secondary industry | Statistical data | Population carrying capacity estimation | ||
| GDP data of tertiary industry | Statistical data | Population carrying capacity estimation | ||
| Per capita GDP data | Statistical data | Population carrying capacity estimation | ||
| GDP data | Statistical data | Population carrying capacity estimation | ||
| Population size data | Statistical data | Population carrying capacity estimation | ||
| Water resources data | Water function data | Vector data | Changzhou Municipal Bureau of Land and Resources (http://www.jsmlr.gov.cn/cz/) | Resource carrying capacity evaluation |
| Ecological environment data | Ecological red line definition data | Vector data | Environmental carrying capacity evaluation | |
| Geological condition data | Land subsidence data | Vector data | Environmental carrying capacity evaluation | |
| Remote sensing image data | High-resolution aerial images | Raster data | Changzhou Municipal Bureau of Land and Resources (http://www.jsmlr.gov.cn/cz/) | Resource status analysis |
| Land use plan data | Basic farmland protected area data | Vector data | Changzhou Land Use Overall Planning and Adjustment Complete database (http://www.jsmlr.gov.cn/cz/) | Identifying Land use type |
| Grain data | Per capita food consumption | Statistical data | World Bank Open Data (https://data.worldbank.org.cn/) | Population carrying capacity estimation |
| Goal Layer | Criterion Layer | Weight | Factor Layer | Weights |
|---|---|---|---|---|
| Evaluation of the comprehensive resource and environmental carrying capacity of Xinbei District | A: Socioeconomic | 0.0577 | A1: GDP per capita | 0.0078 |
| A2: Population size | 0.0160 | |||
| A3: Primary industry GDP | 0.0117 | |||
| A4: Secondary industry GDP | 0.0121 | |||
| A5: Tertiary industry GDP | 0.0101 | |||
| B: Ecological environment | 0.2178 | B1: Ecological red line | 0.2178 | |
| C: Water environment | 0.2975 | C1: Water function partition | 0.2975 | |
| D: Geological environment | 0.1888 | D1: Land subsidence | 0.1888 | |
| E: Soil environment | 0.0823 | E1: Cadmium pollution grade | 0.0098 | |
| E2: Zinc pollution grade | 0.0067 | |||
| E3: Chromium pollution grade | 0.0094 | |||
| E4: Copper pollution grade | 0.0093 | |||
| E5: Lead pollution grade | 0.0086 | |||
| E6: Arsenic pollution grade | 0.0092 | |||
| E7: Mercury pollution grade | 0.0047 | |||
| F: Soil quality | 0.0523 | F1: Farmland use grade | 0.0127 | |
| F2: Farmland economic grade | 0.0204 | |||
| F3: Farmland natural grade | 0.0192 | |||
| G: Land resources | 0.1036 | G1: Land use intensity | 0.0092 | |
| G2: Land output benefits | 0.0973 | |||
| G3: Per capita land area | 0.0271 |
| Man-Food Relationship | Land Resource Carrying Capacity Index (LCCI) | |
|---|---|---|
| Food surplus | Major surplus | LCCI ≤ 0.5 |
| Moderate surplus | 0.5 < LCCI ≤ 0.75 | |
| Minor surplus | 0.75 < LCCI ≤ 0.875 | |
| Balanced | Balanced, with slight surplus | 0.875 < LCCI ≤ 1 |
| Balanced, towards overload threshold | 1 < LCCI ≤ 1.125 | |
| Population overload | Minor overload | 1.125 < LCCI ≤ 1.25 |
| Moderate overload | 1.25 < LCCI ≤ 1.5 | |
| Major overload | LCCI > 1.5 | |
| Type | Calculation Index/Formula | 2035 | 2050 | Capacity Estimation | 2035 | 2050 |
|---|---|---|---|---|---|---|
| Total food supply estimation (G) | Food cultivation area (Hectare) | 26,699 | 26,592 | Total food supply (Ten thousand ton) | 14.5395 | 14.9595 |
| Food yield per unit area (kg/ha) | 5445.72 | 5625.57 | ||||
| Seed food consumption estimation (S) | Food cultivation area (Hectare) | 26,699 | 26,592 | Seed food consumption (Ton) | 3016.98 | 3004.89 |
| Industrial food consumption estimation (F) | Liquor | 1:2.3 | Industrial food consumption (Ton) | 67,079 | 79,810 | |
| Beer | 1:0.172 | |||||
| Feed production | 1:0.7 | |||||
| MSG | 1:24 | |||||
| Domestic food consumption estimation (L) | L = G-S-F | Domestic food consumption (Ton) | 75,299 | 66,780 | ||
| Per capita food consumption estimation | Wealthy living standard (kg/person*year) | 461 | 460 | Per capita food consumption (kg/person*year) | 470 | 482 |
| World Bank prediction (kg/person*year) | 479 | 497 | ||||
| Type | 2035 | 2050 | Type | 2035 | 2050 |
|---|---|---|---|---|---|
| Population based on food supply | 66.7544 | 76.9711 | Population carrying capacity index | 1.25 | 1.22 |
| Predicted population | 83.9634 | 94.3234 |
© 2019 by the authors. Licensee MDPI, Basel, Switzerland. This article is an open access article distributed under the terms and conditions of the Creative Commons Attribution (CC BY) license (http://creativecommons.org/licenses/by/4.0/).
Share and Cite
Li, K.; Jin, X.; Ma, D.; Jiang, P. Evaluation of Resource and Environmental Carrying Capacity of China’s Rapid-Urbanization Areas—A Case Study of Xinbei District, Changzhou. Land 2019, 8, 69. https://doi.org/10.3390/land8040069
Li K, Jin X, Ma D, Jiang P. Evaluation of Resource and Environmental Carrying Capacity of China’s Rapid-Urbanization Areas—A Case Study of Xinbei District, Changzhou. Land. 2019; 8(4):69. https://doi.org/10.3390/land8040069
Chicago/Turabian StyleLi, Kaiyuan, Xiaolong Jin, Danxun Ma, and Penghui Jiang. 2019. "Evaluation of Resource and Environmental Carrying Capacity of China’s Rapid-Urbanization Areas—A Case Study of Xinbei District, Changzhou" Land 8, no. 4: 69. https://doi.org/10.3390/land8040069