Article

A Citizen-Contributed GIS Approach for Evaluating the Impacts of Land Use on Hurricane-Harvey-Induced Flooding in Houston Area

1
Department of Geography, University of Florida, Gainesville, FL 32611, USA
2
Land Use and Environmental Change Institute, University of Florida, Gainesville, FL 32611, USA
3
Department of Civil and Environmental Engineering, Michigan State University, East Lansing, MI 48824, USA
4
School of Public Administration, National Center for Integrated Coastal Research, University of Central Florida, Orlando, FL 32816, USA
5
Beijing Key Laboratory of Precision Forestry, Beijing Forestry University, Beijing100083, China
6
The Weather Company, IBM, Atlanta, GA 30319, USA
*
Author to whom correspondence should be addressed.
Submission received: 21 November 2018 / Revised: 19 January 2019 / Accepted: 22 January 2019 / Published: 28 January 2019

Abstract

:
Hurricane Harvey (2017) caused widespread flash flooding by extremely heavy rainfall and resulted in tremendous damage, including 82 fatalities and huge economic loss in the Houston, Texas area. To reduce hazards, loss, and to improve urban resilience, it is important to understand the factors that influence the occurrence of flooding events. People rely on natural resources and different land uses to reduce the severity of flood impacts and mitigate the risk. In this study, we focused the impacts of land use on Hurricane-Harvey-induced flooding inside and outside the Houston city center. With the recent trend that more citizen scientists serve in delivering information about natural disaster response, local residents in Houston areas participated in delineating the flooded areas in Hurricane Harvey. The flooding information used here generated a published map with citizen-contributed flooding data. A regional model framework with spatial autocovariates was employed to understand those interactions. Different land use patterns and types affected the potential of flooding events differently inside and outside Houston’s city center. Explicitly, we found agricultural and open space were associated with high risk of flooding outside the city center, industrial lands increased the high risk of flooding in city center, and residential areas reduced the potential of flooding both inside and outside the city center. The results can assist with future land use strategy in Houston and other areas, and mitigate potential flash flooding. This study also highlighted the contribution of citizen science to responses to natural hazards.

1. Introduction

Natural disasters and their attendant infrastructure damage, economic losses, and effects on human population increasingly arouse public concern [1]. Among different types of natural disasters, tropical cyclones (TCs) are one of the most severe and costly disasters in the United States, often impacting highly populated areas and threatening coastal communities [2]. Significant loss of life and properties directly result from heavy rainfalls, strong winds, and storm surges [3]. In particular, intense flooding events and storm surge from tropical cyclones have been reported to be responsible for over 80% of hurricane-caused mortality [4]. Additionally, recovery from direct flood damage to residential property, public infrastructure, and utilities requires large financial expenditures. In 2005, flood damage in New Orleans after Hurricane Katrina was estimated at 23 billion USD, and the flood damage of Hurricane Sandy in 2012 in New Jersey includes 12,900 housing and 6,500 business units [5].
The probability of a TC-induced flash flooding event is determined by the intensity and duration of rainfall, as well as the topographical characteristics such as slope and elevation [6,7]. It is also common that vulnerable people depend on natural resources to mitigate the severity of hurricane-induced flood impacts and the potential risk [8,9]. Various land use types could have different influences on physical mitigation services [10]. One of the primary factors that affect flooding magnitude and impact is increasing surface imperviousness and urbanization [11]. Open space with fewer impervious surfaces than other developed land use types has been used explicitly for flood mitigation purposes since the early 1990s in the United States [12,13]. Developed open spaces, including stadiums, recreational areas, and airports, are usually equipped with well-maintained drainage systems and thus have lower flooding risk [13,14]. Some types of open spaces, like wetlands in riparian areas and city parks, are designed to maximize the water storage capacity and to minimize the flooding potential in other protected places [15,16]. Undeveloped lands with trees and vegetation cover also play a role in preventing flooding, since the woody plants can absorb and trap surface runoff [14]. Numerous researchers have examined the impact of urban development on surface runoff and hydrological function [17,18] or the effects of one type of land use on flooding [19,20], or have reviewed the relationships between land management and flooding in other places [21,22]. However, little has been focused on analyzing and quantifying (1), the effects of different land uses on the occurrence of TC-induced flooding, and (2), which land use types have the most significant impact, especially at parcel levels. Here, we address this question by exploring the impacts of land use on Hurricane Harvey induced flooding event in Houston areas, Texas.
Hurricane Harvey stalled over Texas from 25 to 30 in August 2017. Hurricane Harvey first made landfall over the Texas coast on 25 August, and remained nearly stationary inland before returning to the Gulf of Mexico [23]. Its second landfall was on 30 August in the nearby state of Louisiana. Harvey’s stationary position near the coast caused it to produce the largest rainfall of any US landfalling hurricane [23,24]. The significant moisture picked up by the rotation of the eye in the Gulf was released as extreme precipitation. Intense rainfall in metropolitan Houston and the surrounding area was recorded from 25 August to 1 September, with most areas receiving over 36 inches and some areas receiving up to 49 inches [24]. The more than 19 trillion gallons of rainwater dumped onto southeastern Texas caused extensive flooding, especially across the Houston area, which resulted in over 80 deaths and more than 100,000 homes damaged (Federal Emergency Management Agency [25]). The floodwater of approximately 80,000 homes reached over 18 inches, and 23,000 homes had more than 5 feet of floodwater [25].
Citizens scientists play a key role in delivering information during responses to natural disasters [26]. Crowdsourced mapping, data curation, and social media communication provide the citizens another way to contribute and make efforts. Online crowdsource-based platforms (e.g., Humanitarian OpenStreetMap, Zooniverse) offer the citizen scientists a way to help with disaster response efforts globally by providing the emergency locations, producing the best hotspot map of urgent priorities for response teams on the ground [27,28]. Geographic information created and disseminated by amateur citizens and residents via the web-based mapping interface, termed volunteer geographic information (VGI), has been widely used in disaster management, since it helps to enhance, update, and complete existing datasets (e.g., the base map) [1,29].
The contribution of VGI mappers is often based on perceptions rather than scientific measurements, which leads to complexity in measuring the VGI mapping quality and positional accuracy. However, an increasing number of citizen science programs have achieved examinations of the quality of spatial big data [26,29,30]. Firstly, there always exist ‘superusers’ in such VGI mapping projects. Those ‘superusers’ make tremendous contributions by providing a large amount of near-real-time accurate information [31]. In addition, the quality control of VGI itself is also a multi-user environmental validation process. Based on its ‘wiki’ principle, the community of VGI mappers can act as quality filters, which means the dataset is self-validated by other contributors numerous times. Finally, because of the vast amount of VGI data, mapping effects are mostly aggregated based on the ground truth data provided by VGI mappers [32].
In this study, we integrated the Hurricane Harvey induced flooding information adapted from a published map with citizen-contributed flooding data, and analyzed the impact of land use on flooding events in the Houston area during Hurricane Harvey. We expected that land use could significantly influence the occurrence of TC-induced flooding events. Specifically, we hypothesized that the places with agricultural, commercial, residential, and industrial land types would increase the probability of flooding events, while open space would prohibit flooding events. To test these hypotheses, three different logistic regression models with or without autocovariate terms were developed to identify the drivers that affect hurricane-induced flooding inside and outside the city center of the Houston metropolitan region.

2. Materials and Methods
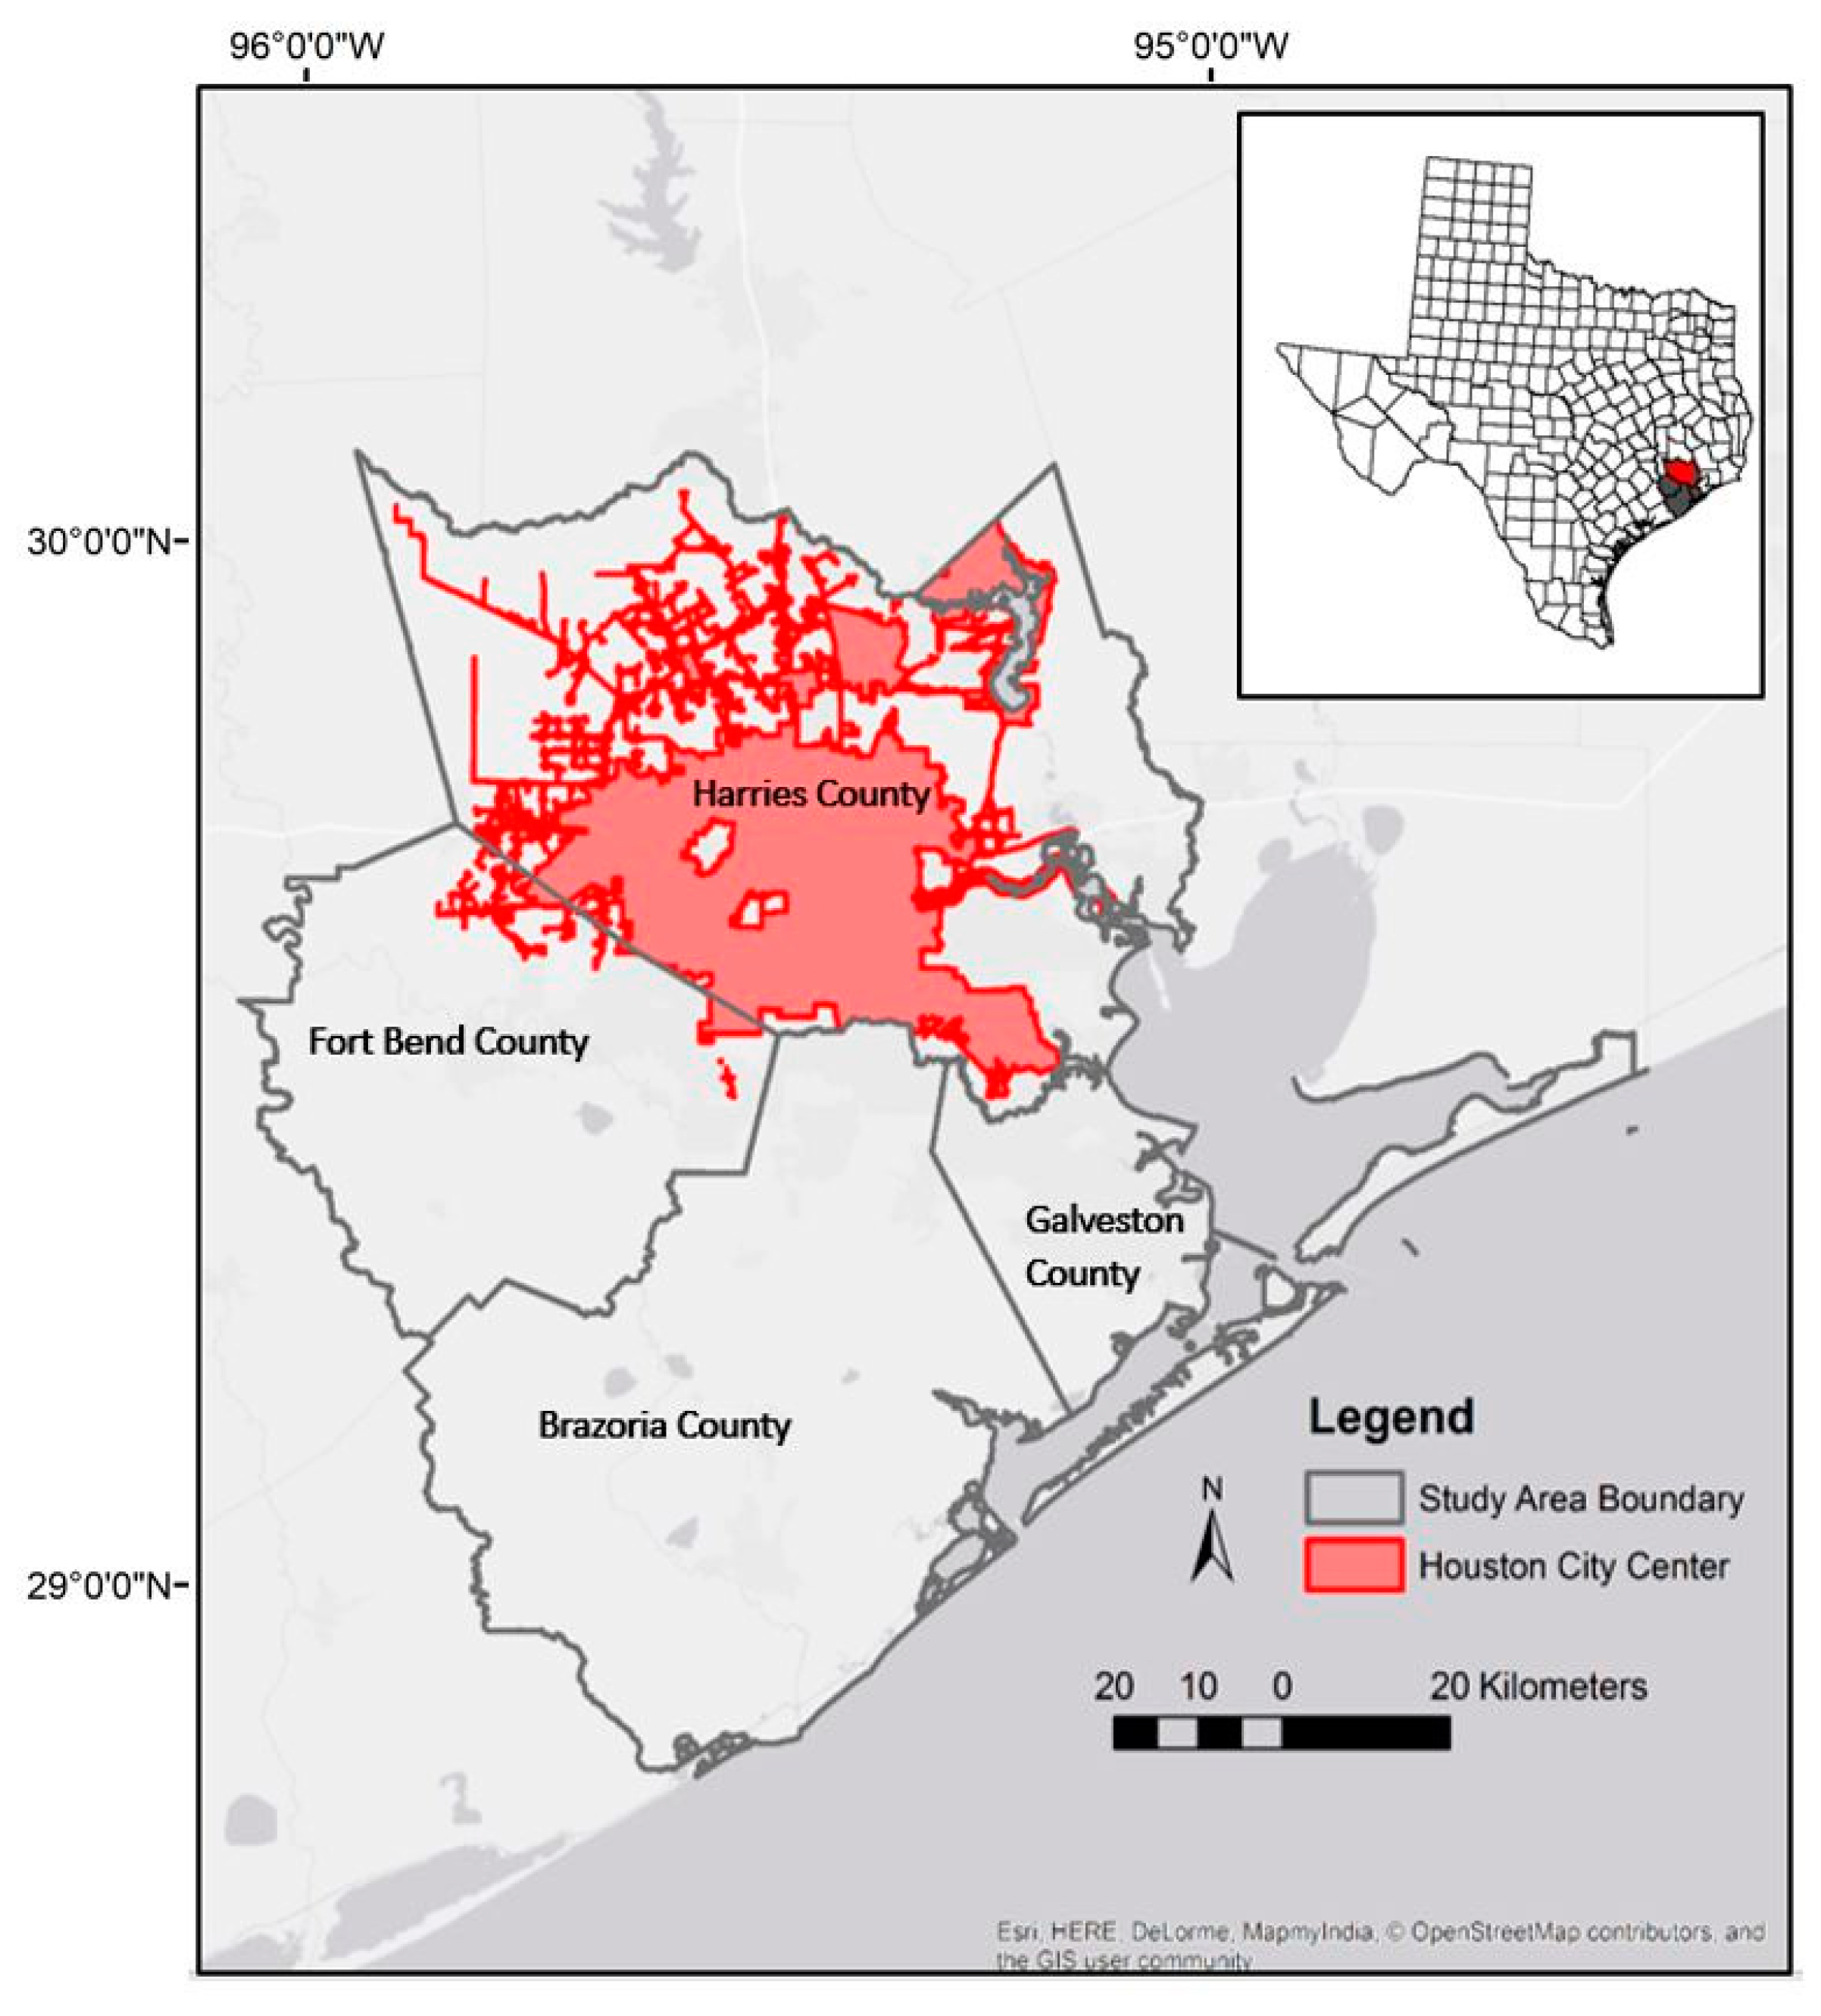
2.1. Study Area

The study area consisted of four counties in the Greater Houston area: Harries, Fort Bend, Brazoria, and Galveston County (Figure 1). Houston is located on the Gulf Coastal Plain at an average elevation of 27 m, with an annual rainfall of 140 cm [33]. The Houston metropolitan region is one of the most sprawling urban landscapes, and is also the only major metropolitan area without zoning laws in the United States [30,34]. With a population of 2.30 million (reported in 2016), Houston is the leading oil refining, economic, and space technology center in Texas. In 2017, the study area was affected by Hurricane Harvey, which caused catastrophic rainfall-induced flooding. Since the land use inside and outside of Houston’s city center is different, the study area was separated into the city center and outside of the city center, based on the city center extent acquired from TIGER [35].

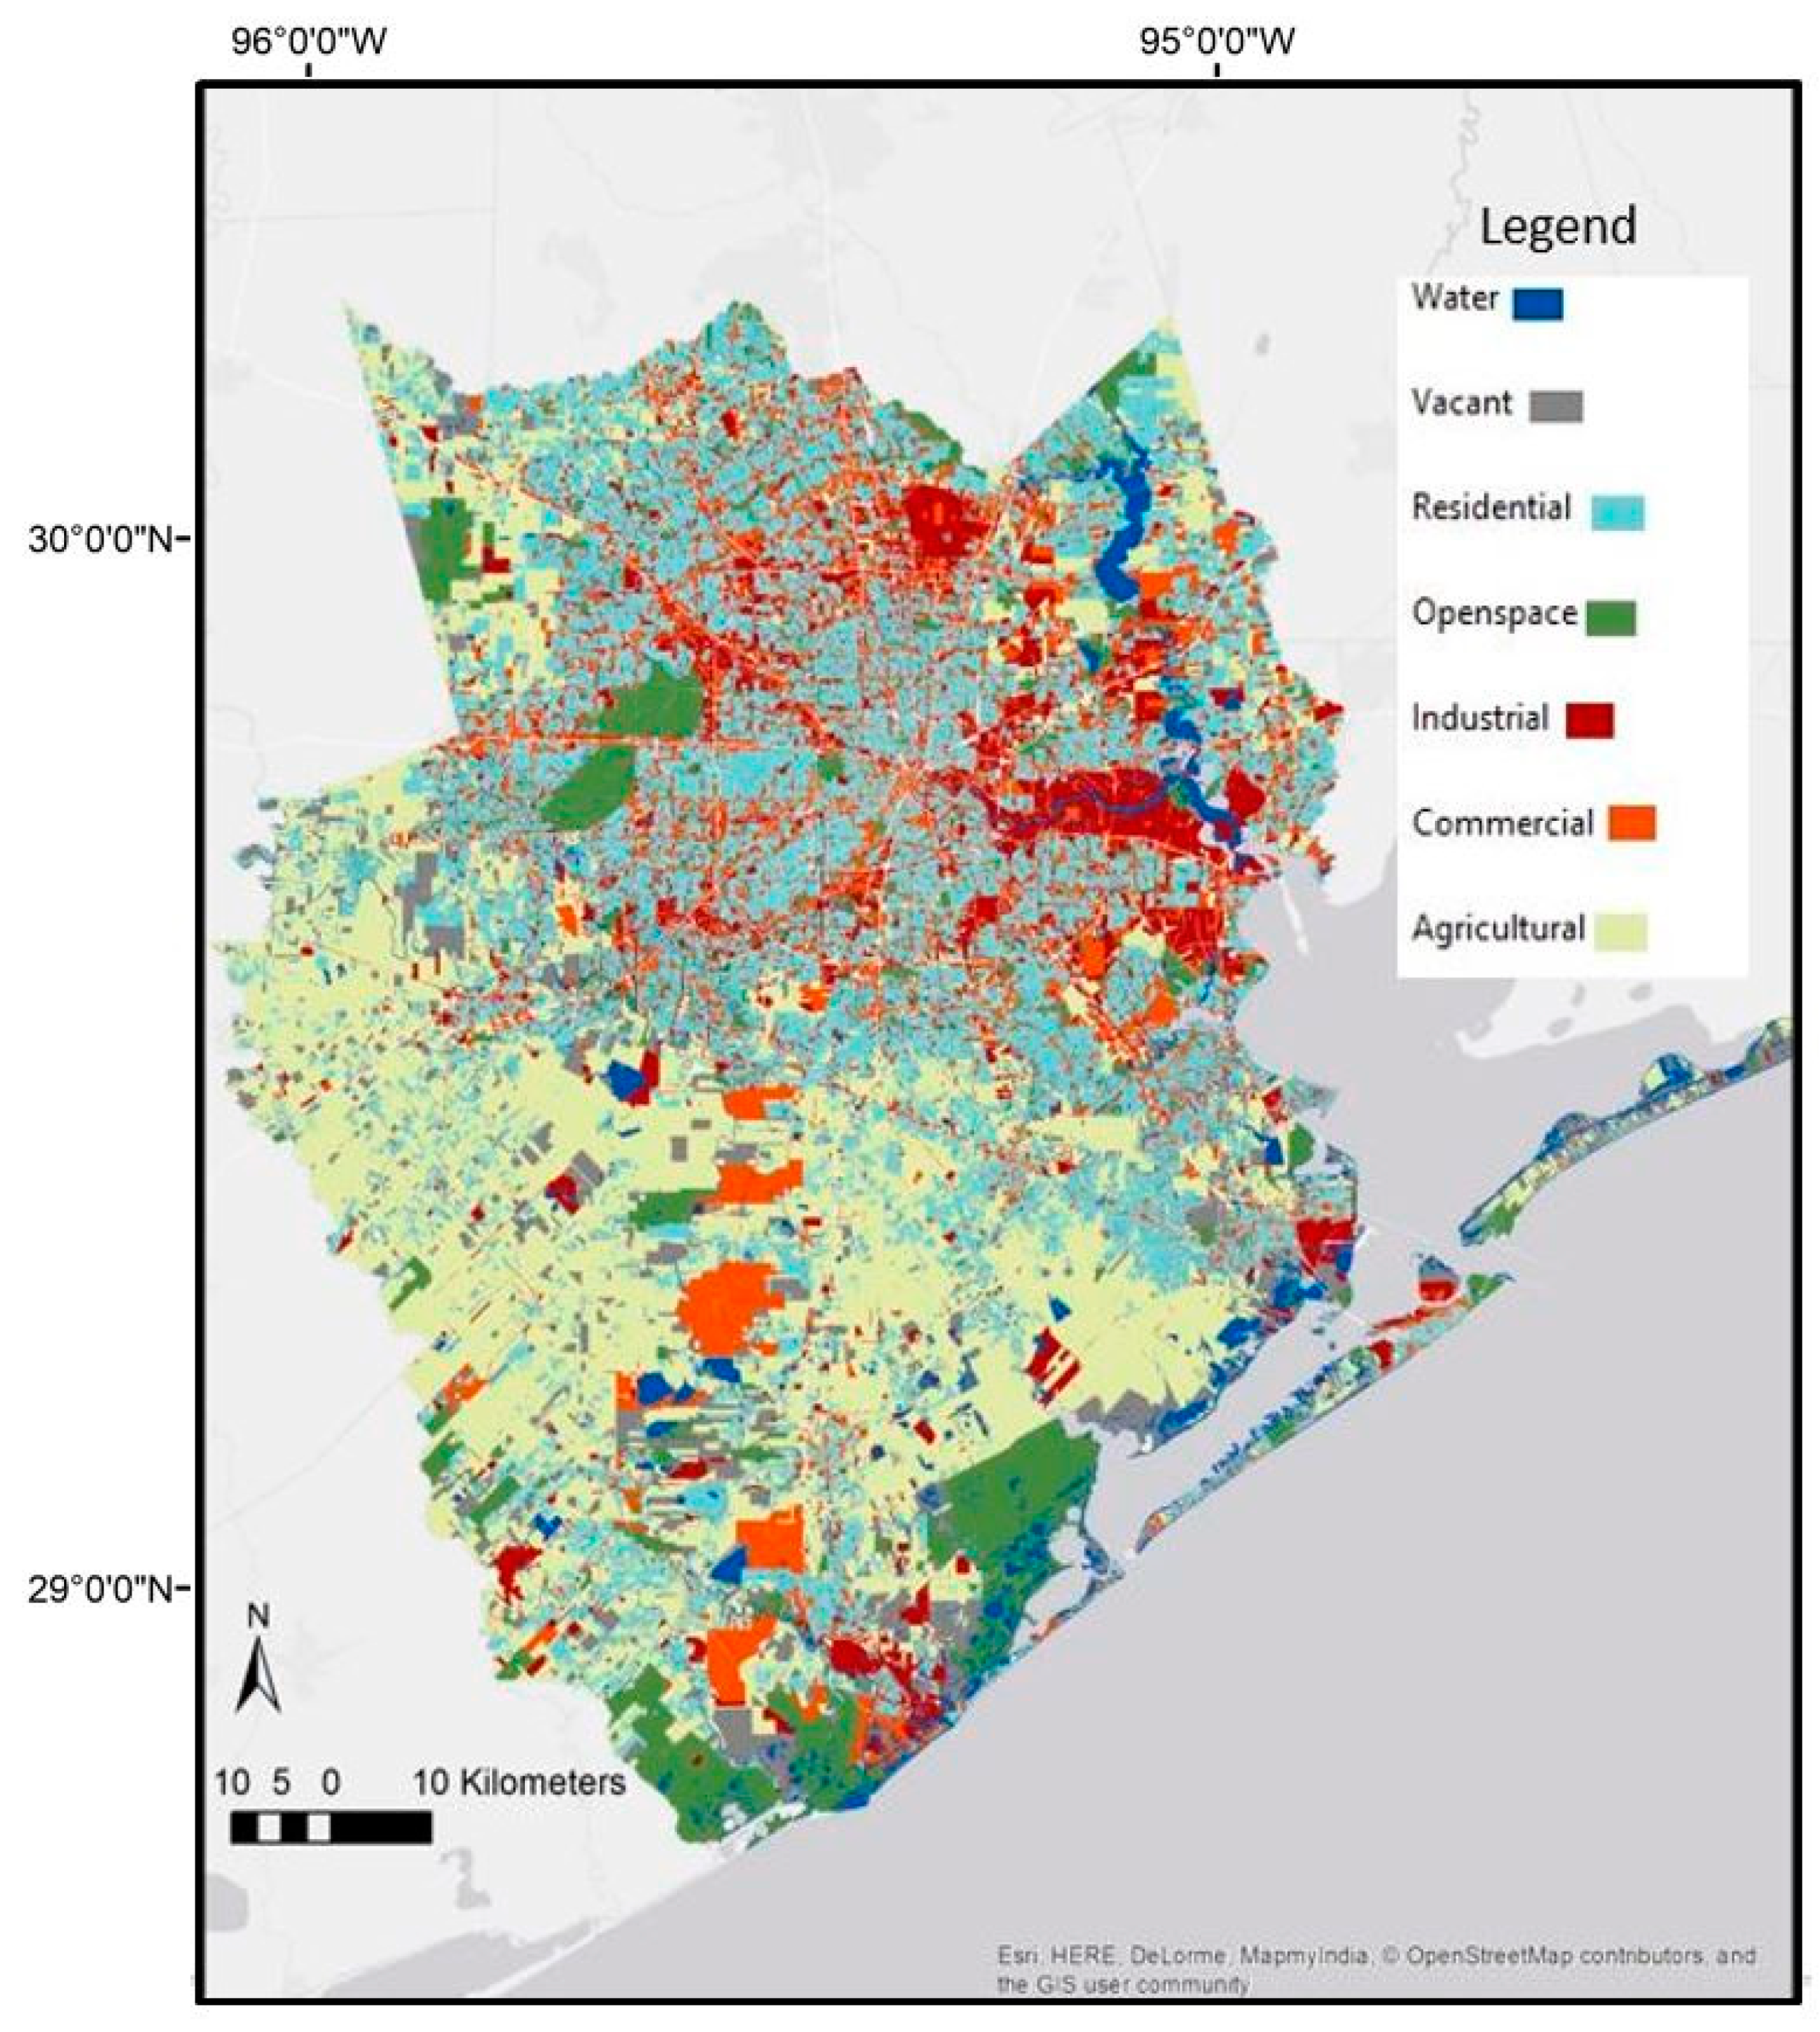
2.2. Land Use Data and Class Regroup

2.2.1. Land Use Database

In this study, the parcel level land use data was acquired from the Houston-Galveston Area Council (H-GAC), which is a regional planning organization that provides leadership and guidance in managing change throughout the Houston–Galveston region. The spatial resolution of H-GAC land use data is 30 m, which was retrieved in 2010. Based on the major research objective of this study, the classification mapping strategy of the H-GAC map was reframed and reclassified it into seven main land use classes: residential, open spaces, industrial, commercial, agricultural, undeveloped land, and water body.

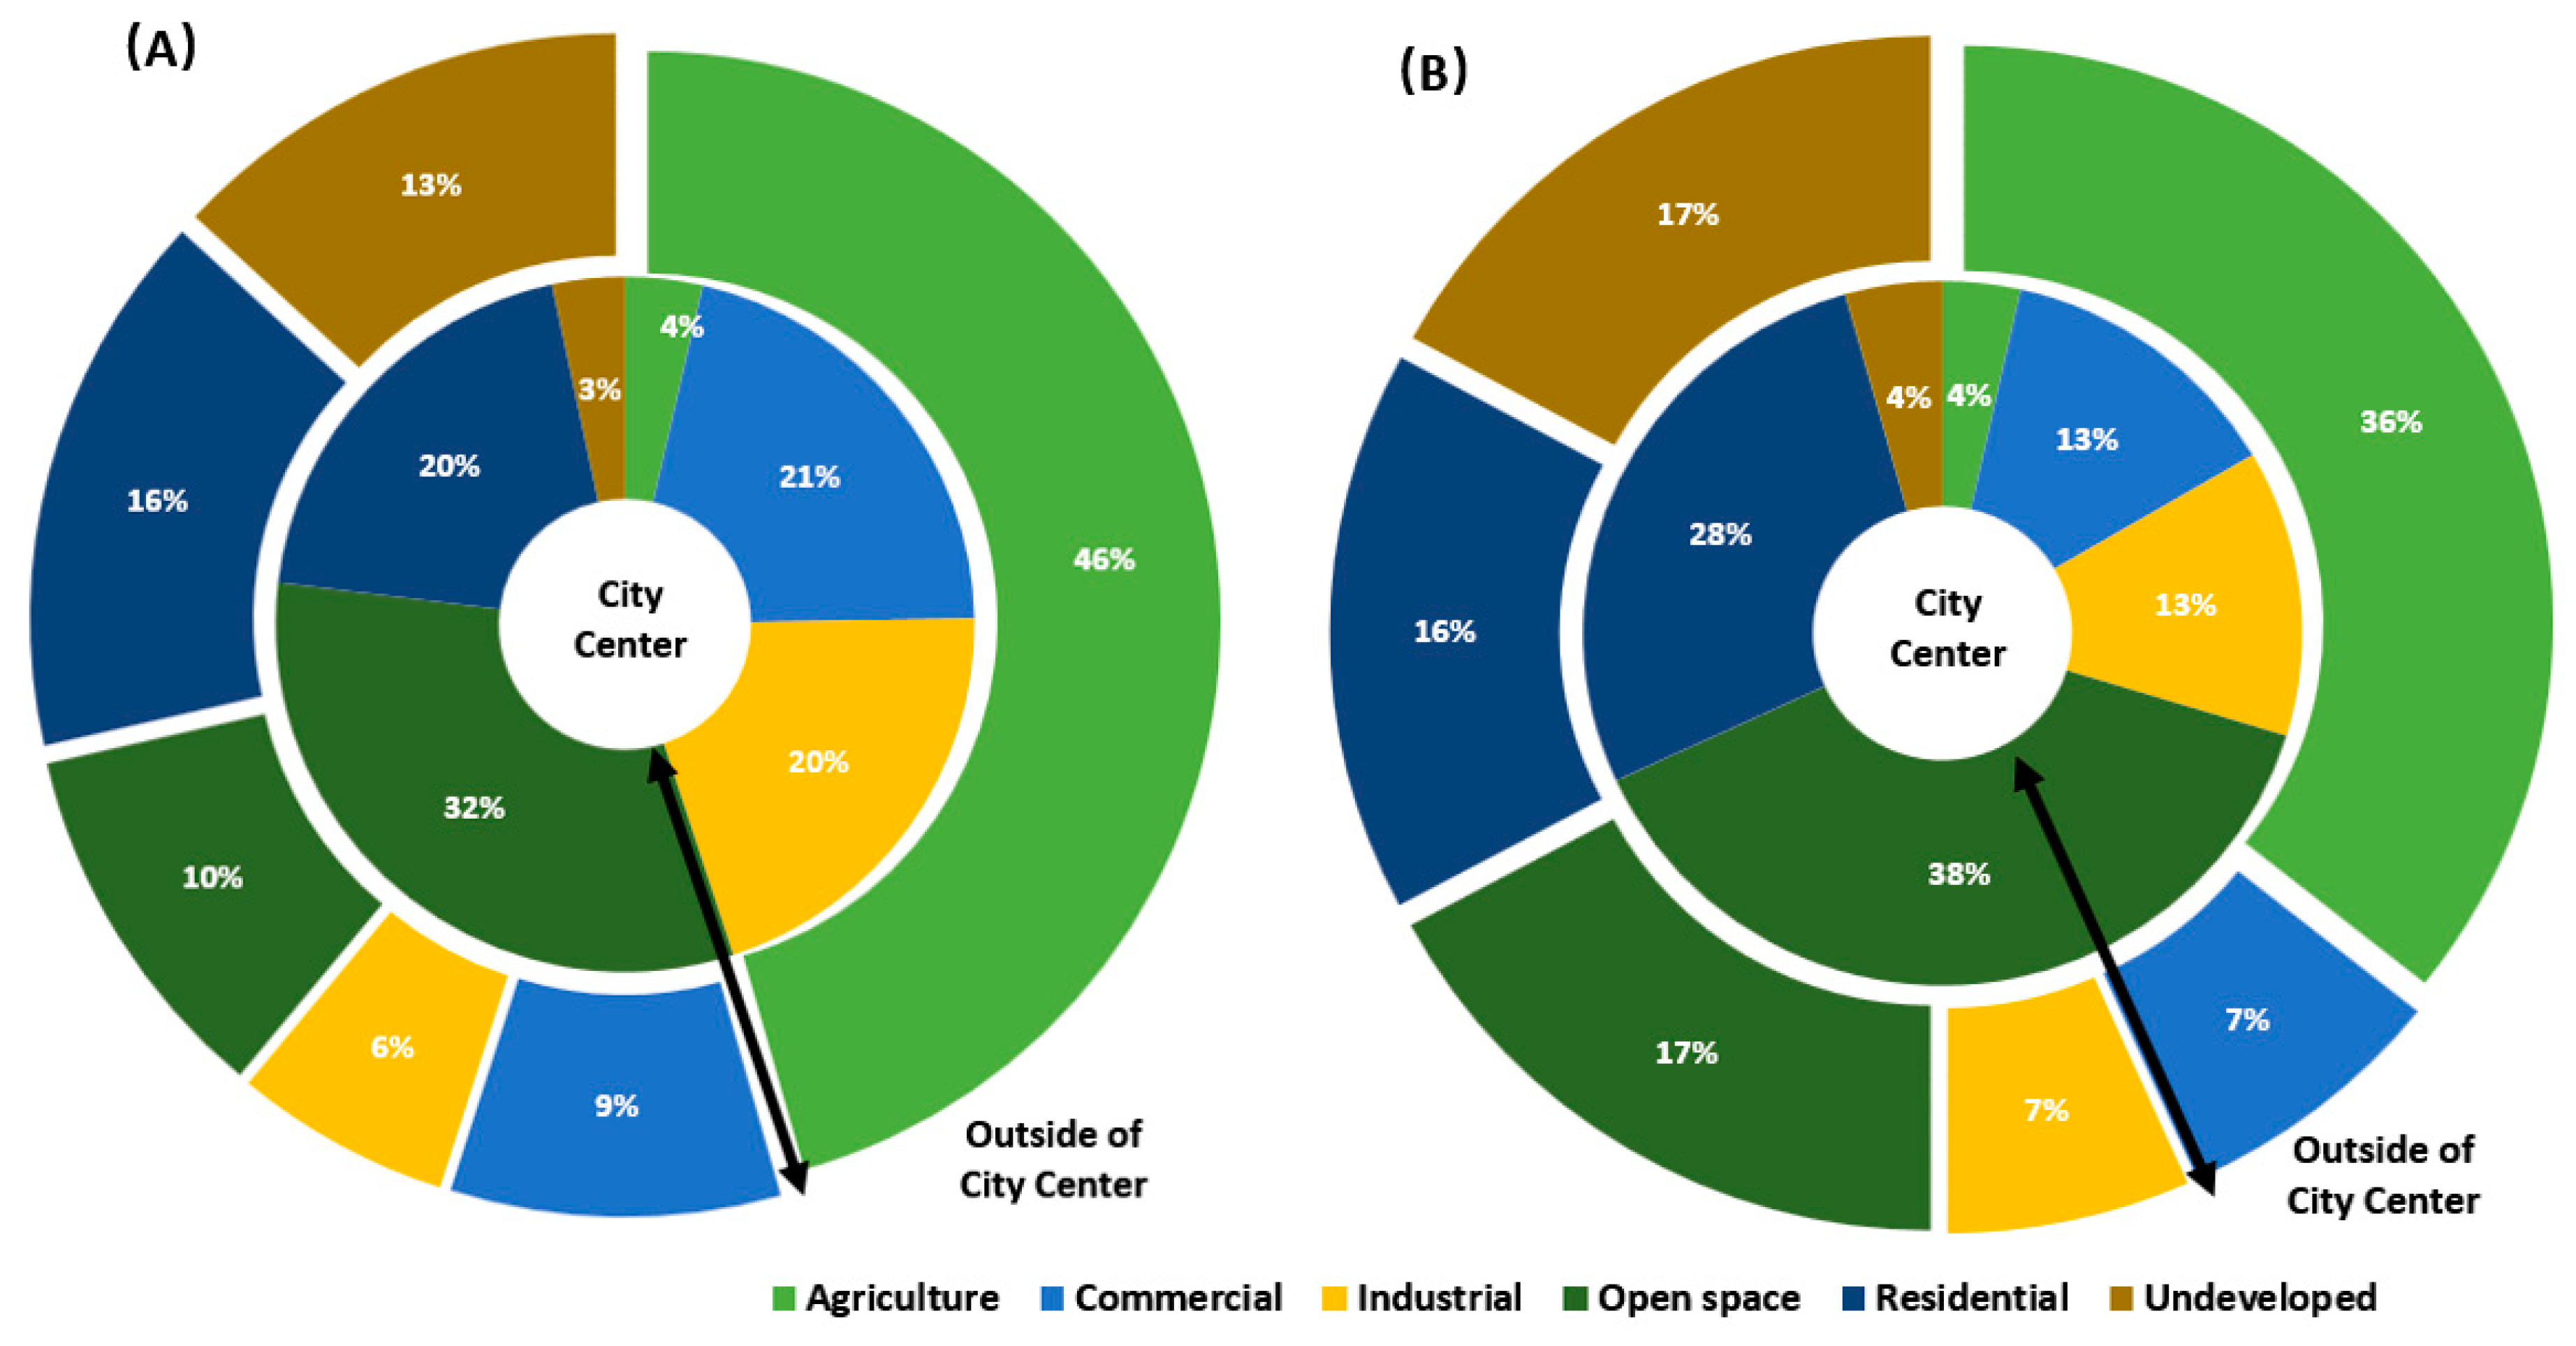
2.2.2. Land use Class Regroup

Land use type designations for each parcel in the study area were originally assigned by H-GAC and listed as ‘commercial’, ‘gov/med/edu’, ‘industrial’, ‘multiple’, ‘other’, ‘parks and open spaces’, ‘residential’, ‘undevelopable’, ‘unknown’, and ‘vacant developable (includes farming)’. In the original land use map of the Houston metropolitan area, the lands with the ‘multiple’ tag refer to parcels with more than one land use type, and the lands designated ‘others’ include the following specific land use types: religious (with building), cemeteries, parking garage, parking lot, and truck and trailer parking/storage.
We reframed the classification strategy and reclassified the database based on detailed description of the parcels. The database’s parcels were regrouped into one of the following semantic groups: residential, open spaces, industrial, commercial, agricultural, undeveloped land, and water body. To clarify the difference between ‘undeveloped’ and ‘open spaces,’ an undeveloped state is defined in this study as some type of open space without developing plans, or a natural state. The lands with the tag of ‘open space’ refer to places like parks and preserved lands with specific management plans. Open space may provide various ecological benefits, such as maintaining the urban wildlife habitat and improving water storage capacity [36]. For parcels tagged ‘multiple,’ we reclassified them based on the principal use of the land, as detailed in the attributes provided by H-GAC. The aforementioned re-definition and reclassification of land use types applied both inside the city center and outside of it. To better understand the relationship between land use and flooded areas or floodplains in the city center and outside the city center, geospatial zonal statistics were applied to analyze the distribution of different land uses in Harvey-induced flooded regions and floodplains. Additionally, to prepare the data for the later spatial statistical analysis, we converted each land use type into a binary raster layer with a resolution of 90 m, to match the resolution of the composite flooding data.

2.3. Hurricane Harvey Flooding Data

2.3.1. Dartmouth Flood Observatory Flooding Data

The flooding map comes from a combination of Dartmouth Flood Observatory data (DFO; published on 8 September 2018) and a volunteered flooding geodatabase, which was contributed to by citizens during Hurricane Harvey. The database of DFO is currently the only comprehensive public dataset of flood observation that could meet the objectives in this study. The DFO database is produced based on a serious of earth observation satellite images (e.g., Moderate Resolution Imaging Spectroradiometer–MODIS, Sentinel 1, Cosmo SkyMed, and Radarsat 2) and weather conditions. The DFO Hurricane-Harvey-induced map was resampled to be consistent with NASA Shuttle Water Boundary Data (SWBD) surface water extent at a spatial resolution of 90 m. The Maximum Observed Flooding map was extracted from DFO products and clipped to the Houston metropolitan area; this map presents the current flooding situation by 8 September, with a spatial resolution of 90 m [37].

2.3.2. Citizen Science Contributed Flooding Data

Citizen science enables participants to make direct contributions to science and research, increasing their scientific understanding and immersing themselves deeply in learning and understanding the surrounding environments from different scales. Hurricane Harvey brought Houston citizens together and significantly influenced the research direction. During Hurricane Harvey, local citizens marked the flooded streets and areas, reported to the map organizer, and got the data published in a Google Map format (accessed from shorturl.at/kBCHO) immediately. There are 711 polylines and 53 polygons marked as flooded areas in this citizen-contributed map. Google Maps allows users to create VGI in all forms of mapping projects based on different objectives. VGI is widely used in responding to natural disasters, and also helped the local residents navigate around flooded streets and told the government in real-time where the flooded areas were. During the week of Hurricane Harvey, the map project got more than 1.3 million views, and peaked at 3.7 million during the following month. The vector features extracted from the citizen flood map were rasterized with a spatial resolution of 90 m to match up with the resolution of DFO map, and buffered with a 1 pixel radius. This rasterization allows us to compare and summarize the descriptive analysis for the patterns of the two datasets.

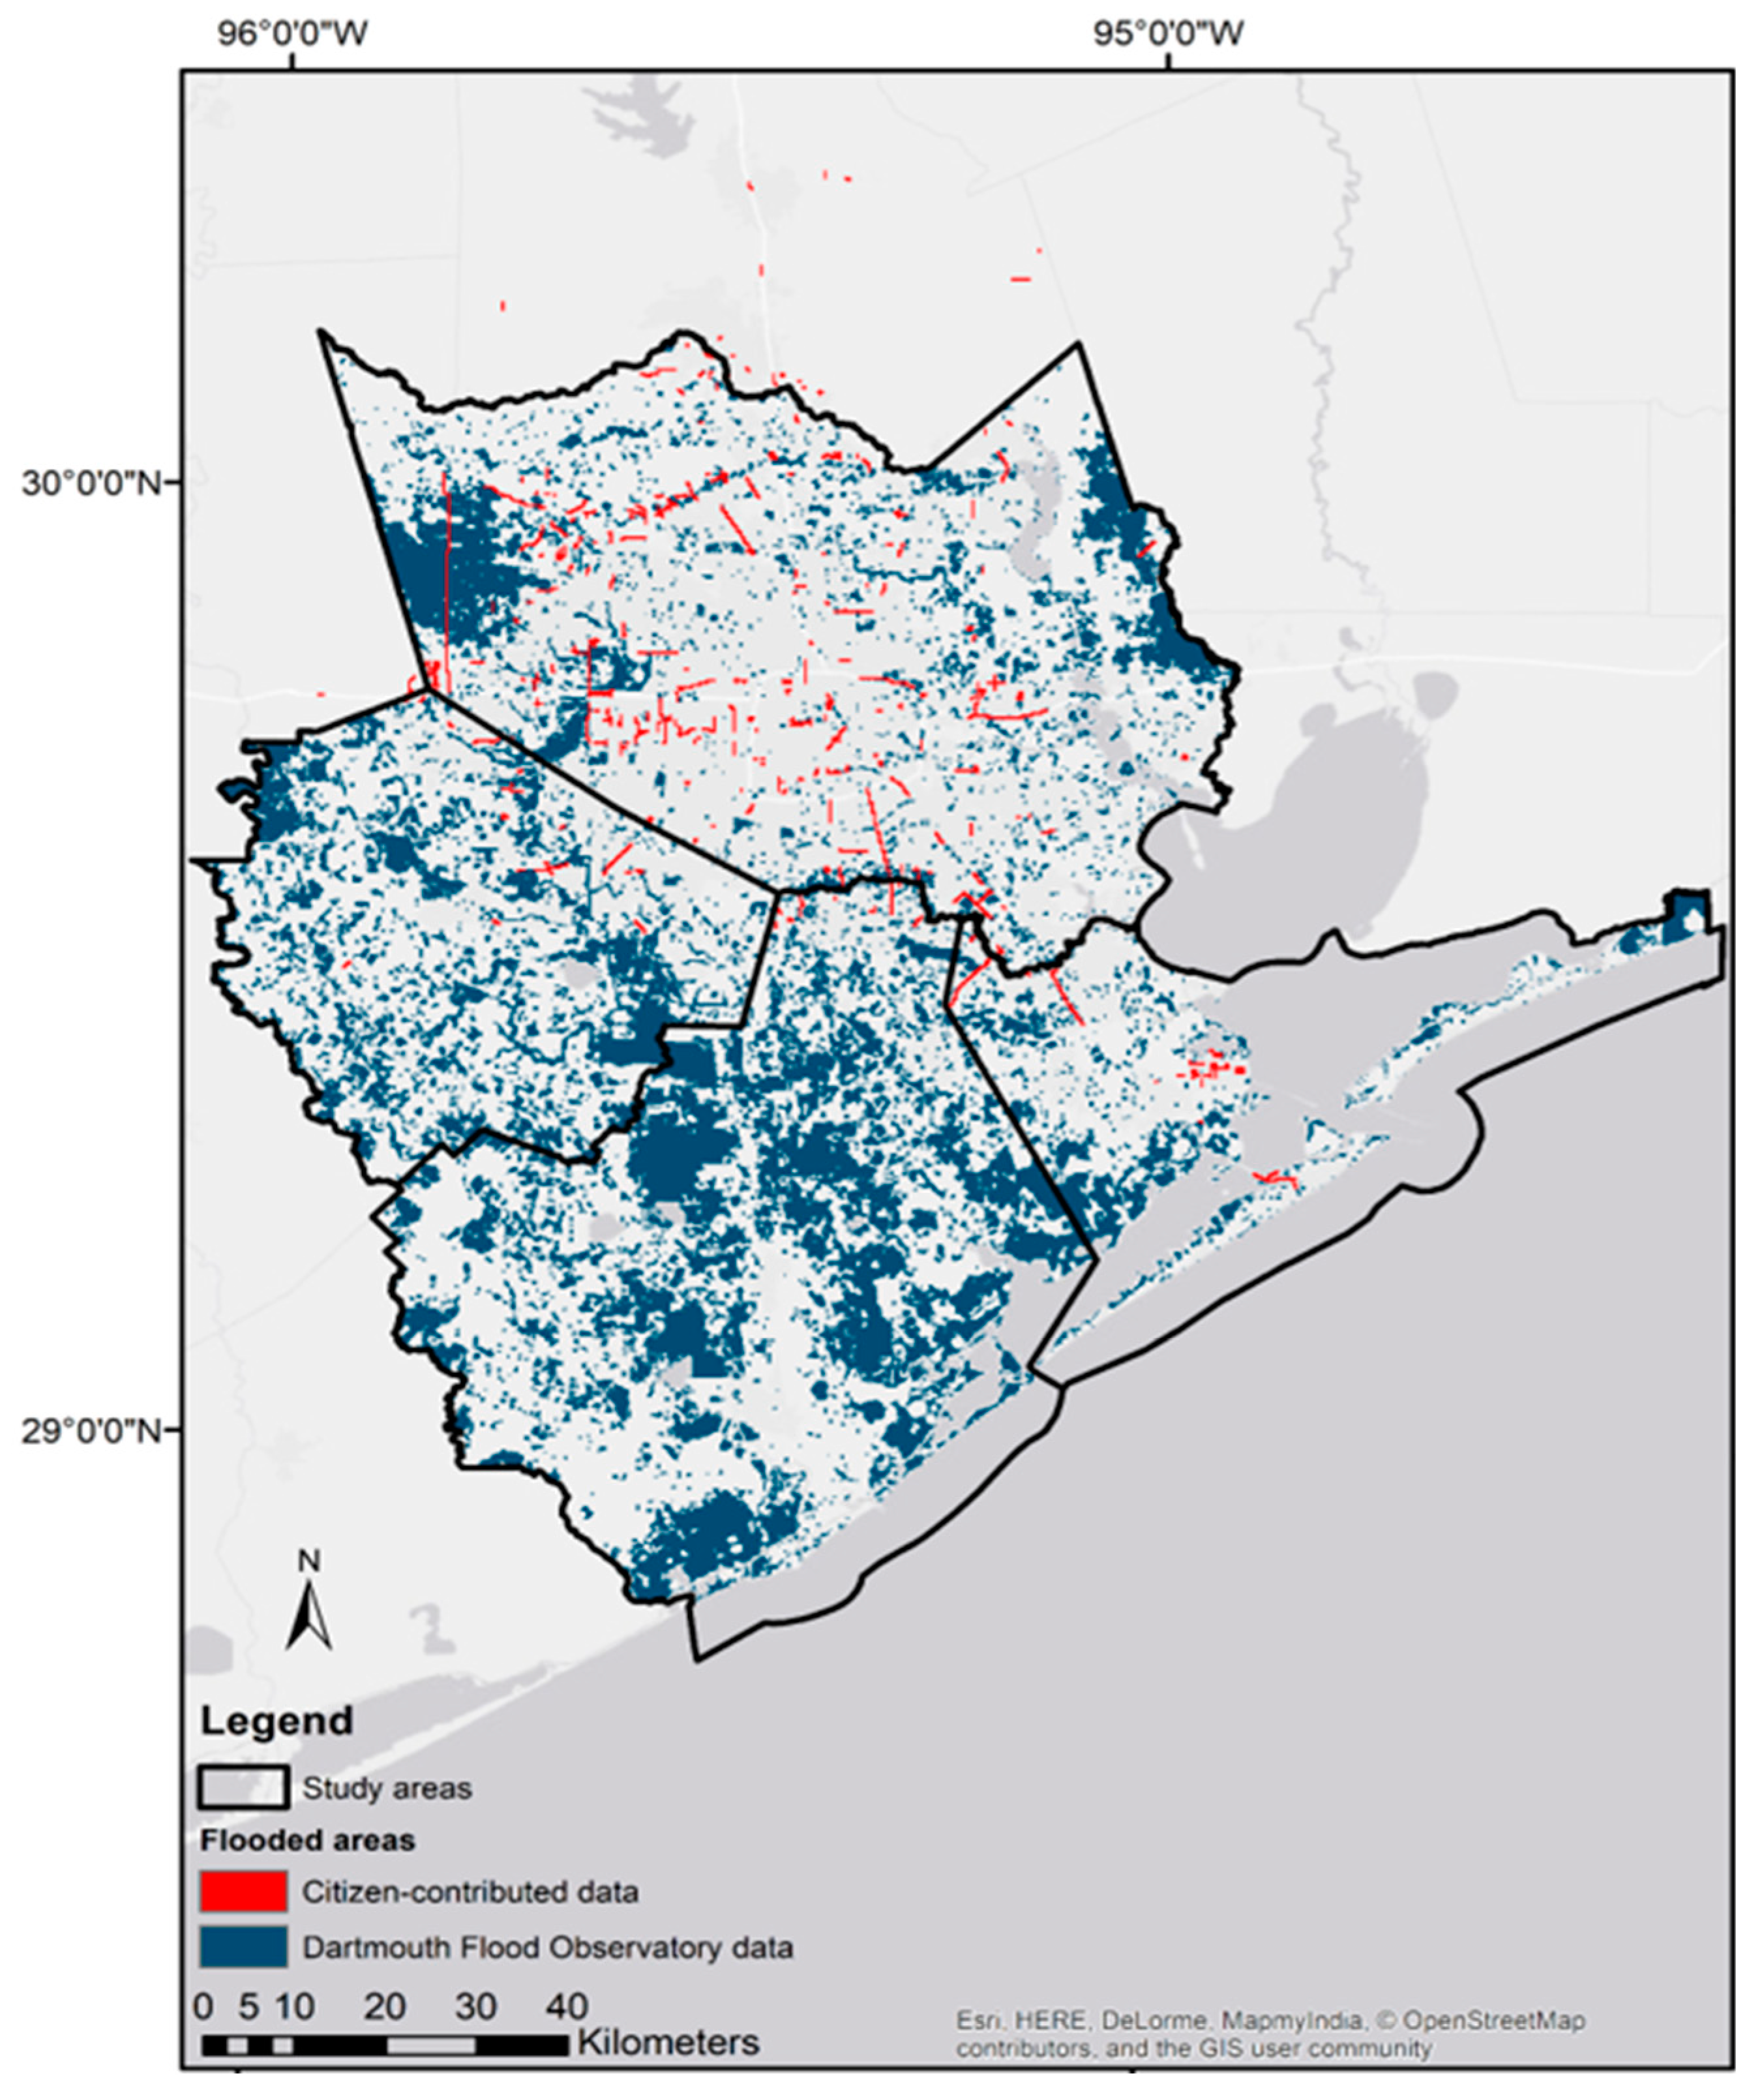
2.3.3. Assessing the Patterns of Flooding Data Sources and Combining Them

Given there were two different data sources for flooding areas, we assessed the spatial patterns and contributions of the two flooding data sources based on descriptive analyses and summaries. The spatial patterns of differences between those two datasets inside Houston city and outside the city were compared based on the summaries of the areas of flooding captured by two datasets and the overlaps between the two datasets. Additionally, the flooded areas identified by the two datasets under different groups of land use types were summarized and compared for both inside and outside the Houston city center.
Figure 2 shows the flooded areas caused by Hurricane Harvey in Houston areas identified in the DFO data and the citizen map. The flooded areas extracted from DFO data include a total area of 2,896,703 ha, with 183,737 ha in the Houston city center and 2,712,966 ha outside the city center. The citizen-contributed data includes 14,667.5 ha of flooded areas, with 6,021.5 ha in the city center and 8646 ha outside the city center. By overlapping the citizen contributed flood data with the DFO map, there are 1676.7 Ha of areas outside the city center and 933.1 Ha inside city center that were identified by both data sources. This indicates that most data provided by the local citizens were not captured by the DFO map. The flooded areas under different land use types captured separately by DFO maps and citizen science inside and outside the city center are summarized in Figure 3. Most areas contributed by citizens were the residential lands and commercial lands.
Given the above analyses, we found citizen science data could provide information that was not identified by remotely sensed data, especially in residential and commercial lands, and inside the city center. These contributions indicate that citizen science data could help to increase data integrity. Therefore, we combined the two datasets to serve as the final flooded region map for the rest of the analyses.

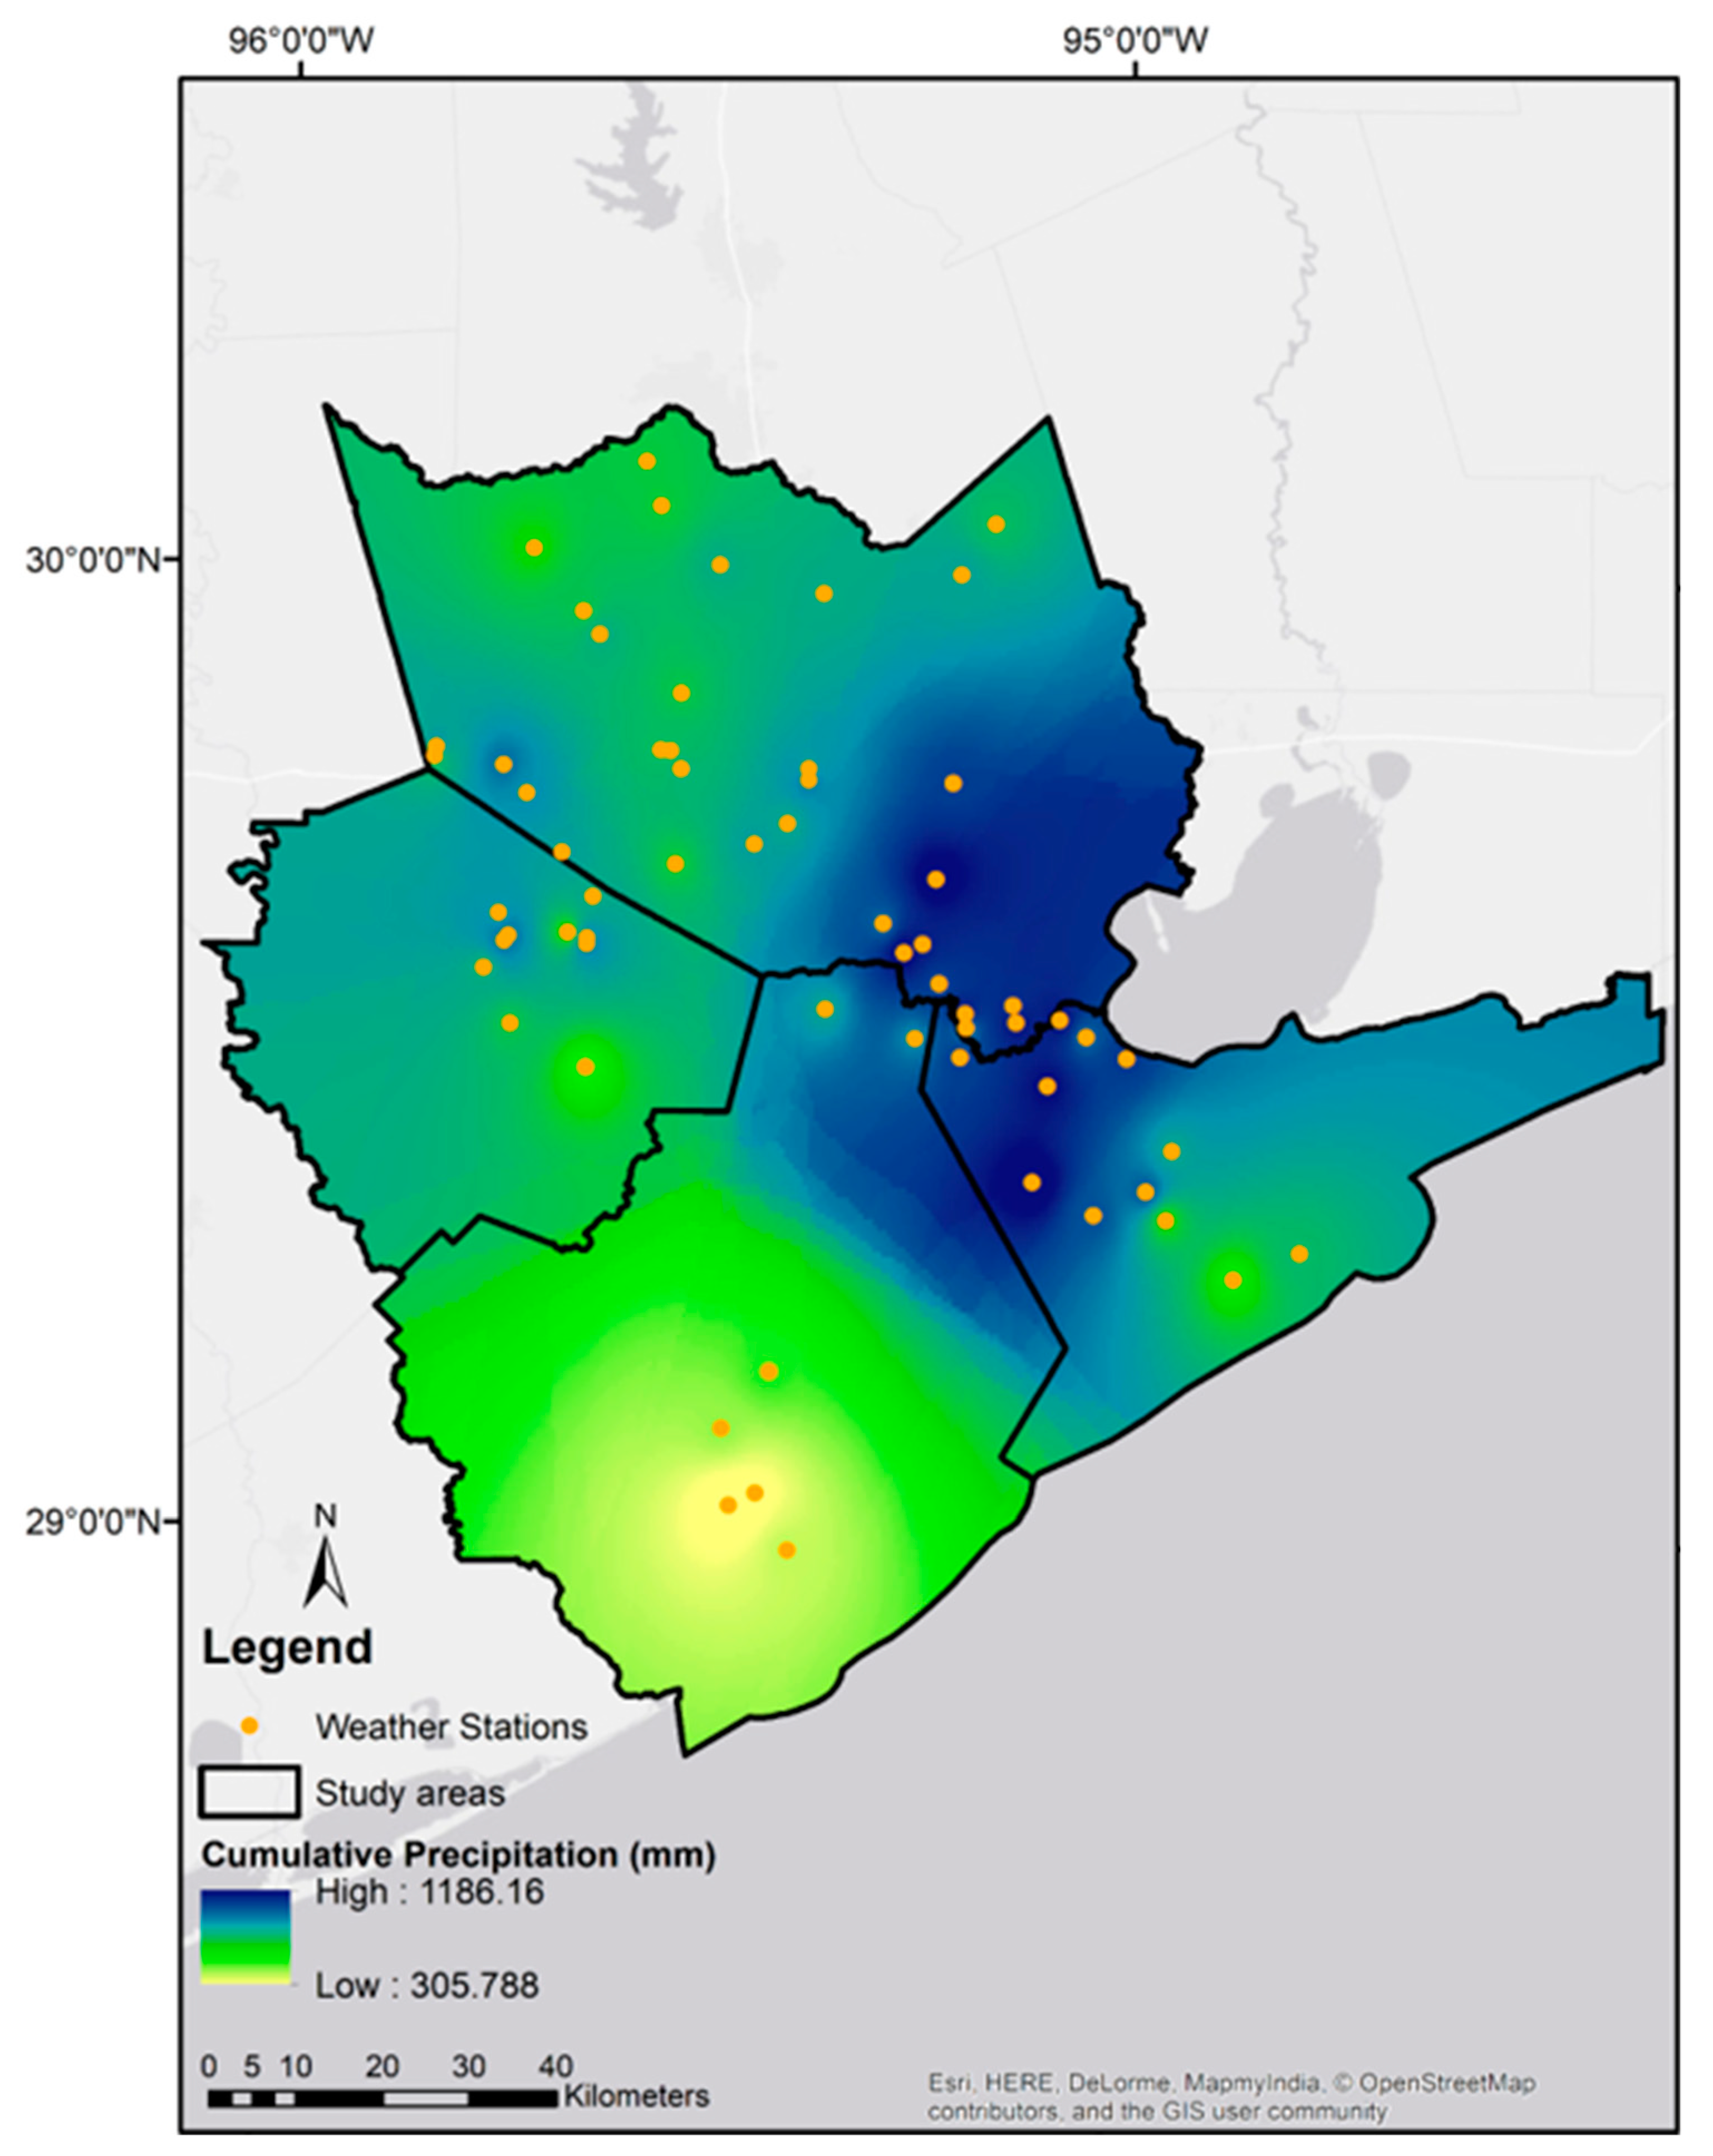
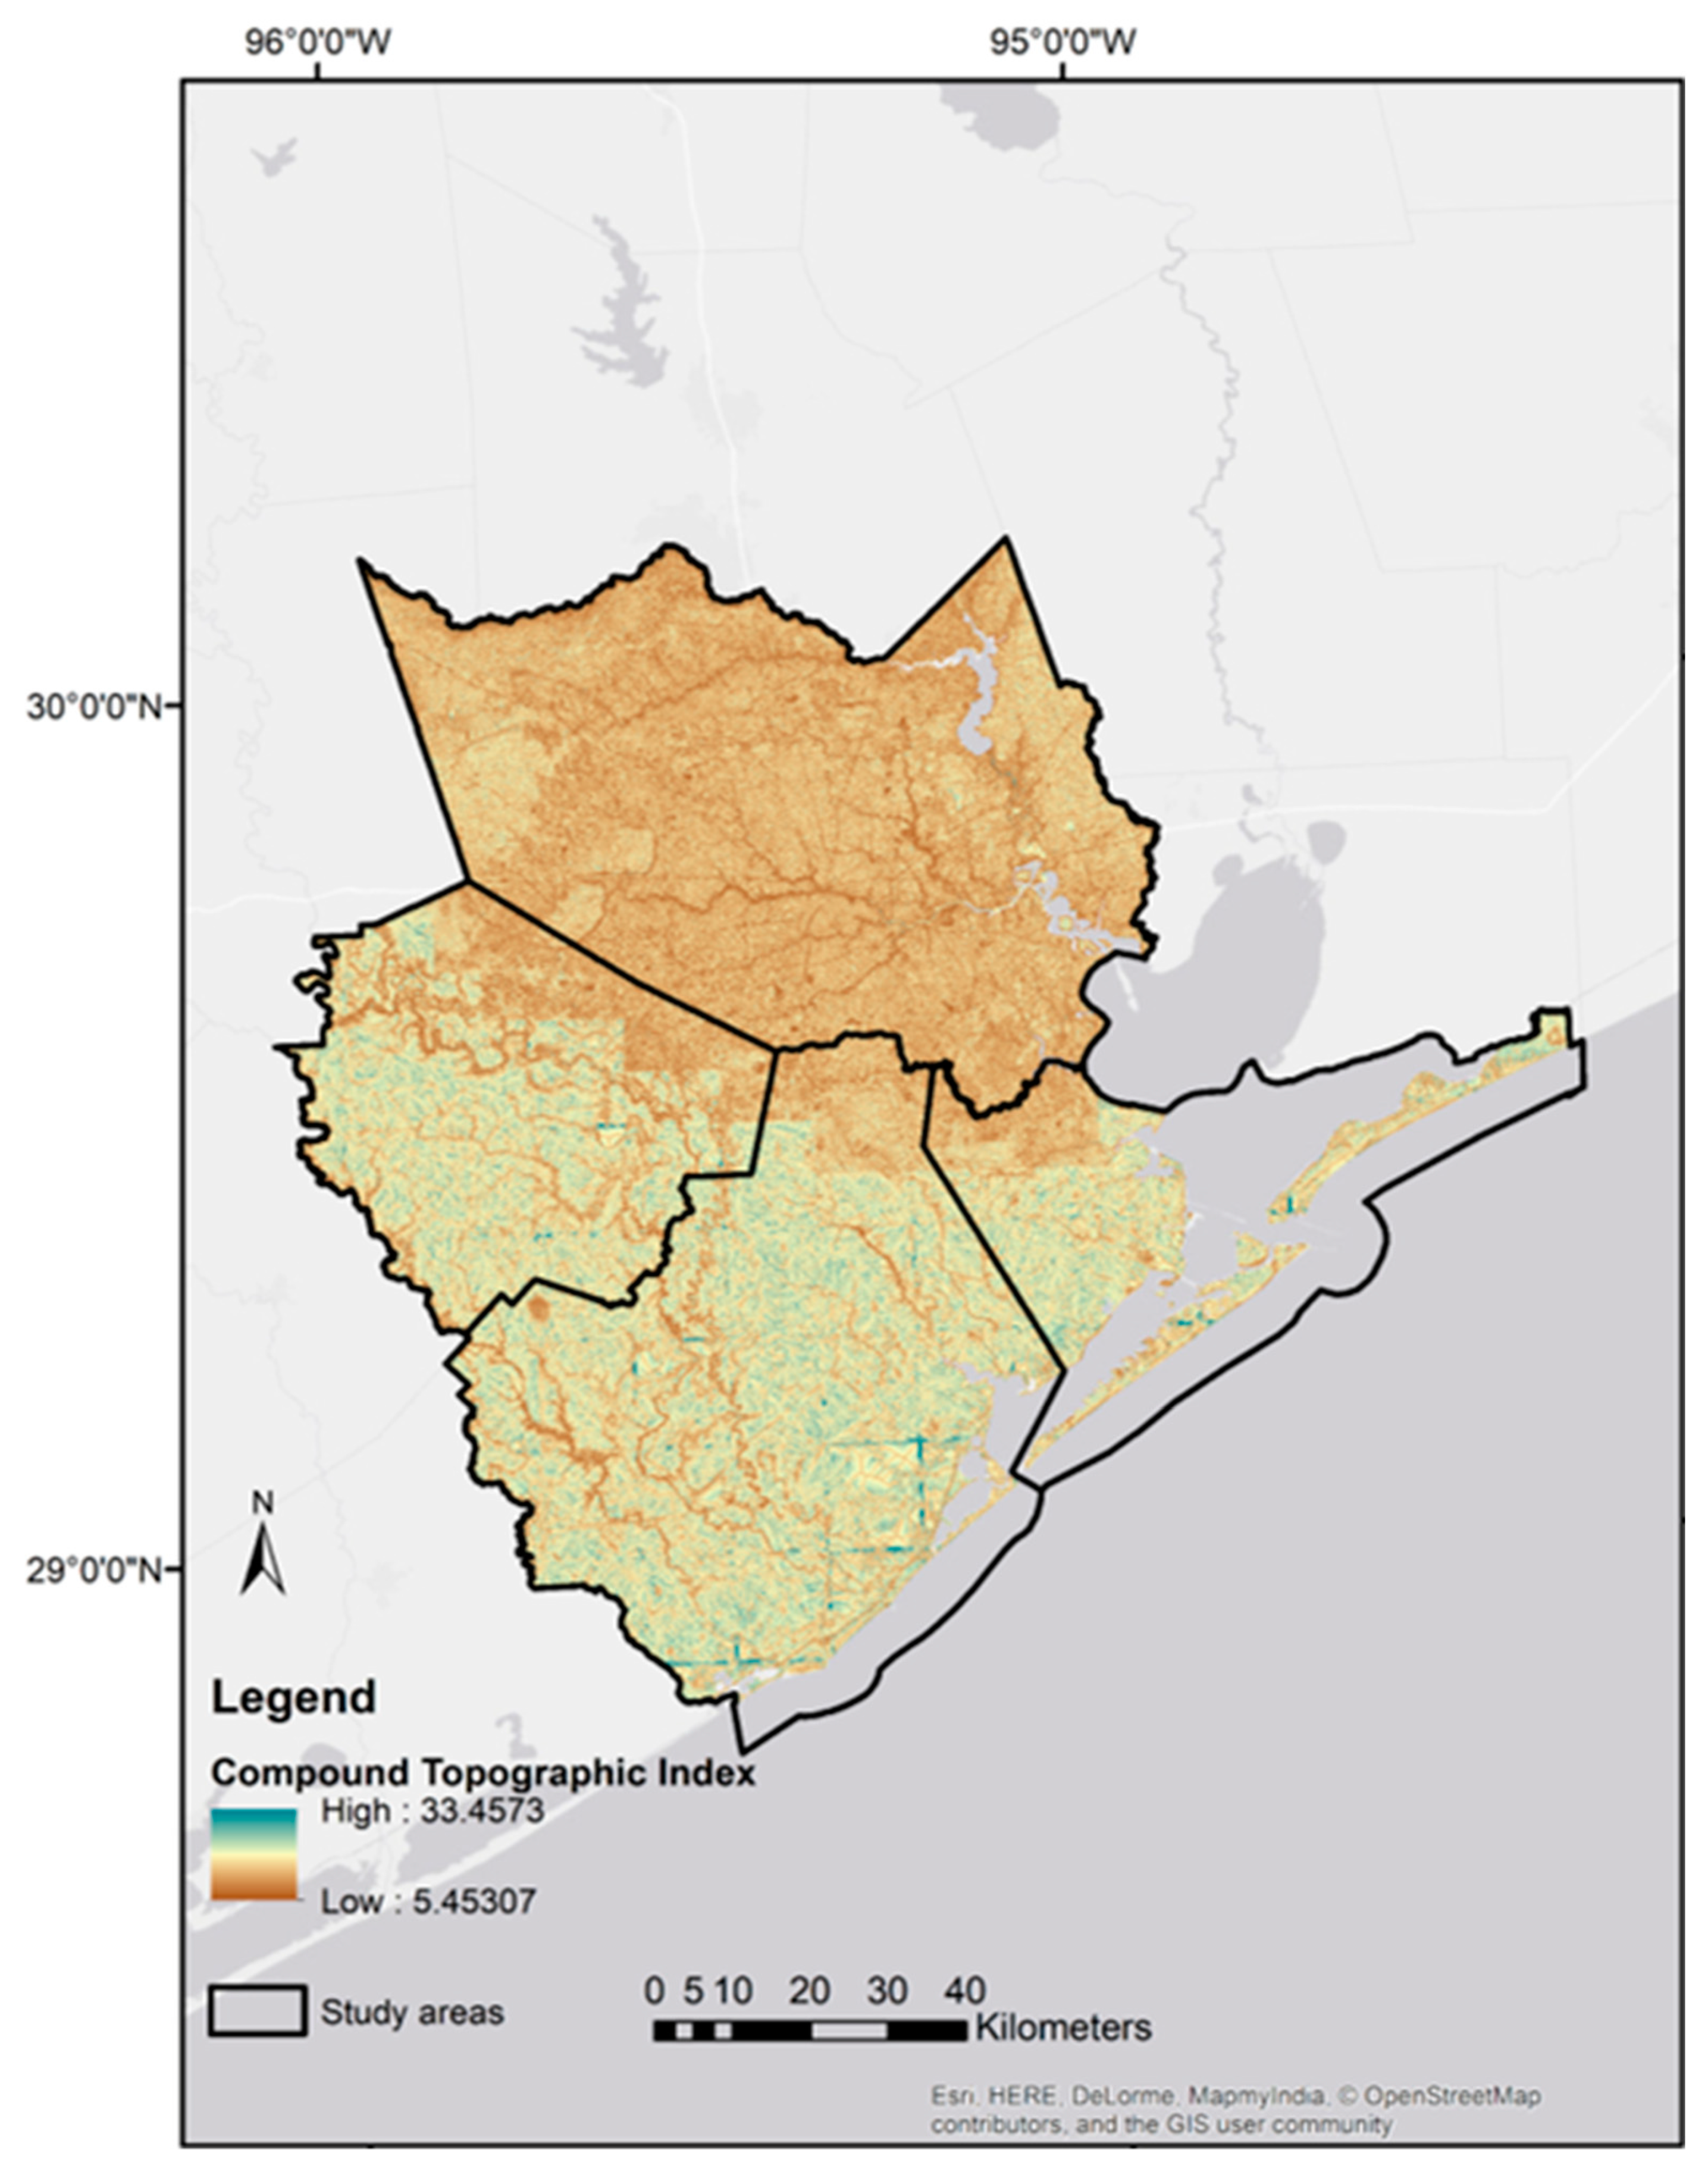
2.4. Precipitation Interpolation Map and Topographic Wetness Index

For estimation of the rainfall intensity, the land-based station data was accessed from National Oceanic and Atmospheric Administration (NOAA) National Climatic Data Center (https://www.ncdc.noaa.gov/). The total precipitation from 25 August to 1 September 2017 for each of the 62 station sites was calculated. We then interpolated the distribution of the total precipitation of Hurricane Harvey using Inverse Distance Weighting (IDW) in ‘gstat’ R-Package via R version 3.4.0, with a spatial resolution of 90 meters [38,39,40]. The interpolated distribution of total precipitation of Hurricane Harvey is shown in Figure A1.
Land surface characteristics, like topography, are another factor that affects the water balance in a catchment, influencing the chance of flooding [41]. The Compound Topographic Index (CTI), also known as Topographic Wetness Index, is a steady-state product of upslope areas, the flow slope, and a couple of geometric functions [42]. The CTI has been widely used to predict solum depth [43], characterize soil moisture wetness patterns [44], evaluate water balance variabilities of watersheds [45], and to indicate the potential of surface runoff production [46]. Recently, CTI was employed to inform decisions vis-à-vis urban flooding in the state of Illinois [47].
The spatial distributed CTI values were calculated following [48]:
CTI = ln (AS/tanβ)
where AS is the specific catchment area (m2) per unit width orthogonal to the flow direction, and β is the slope angle in radians. The spatial distribution of CTI of the study is shown in Figure A2.

2.5. Modeling Framework

Before modelling the effects of different land use types on the likelihood of flash flooding, we employed some descriptive analyses to explore the proportions of flooded areas under different land use categories for the city center and outside the city center. Additionally, the proportions of floodplains areas under different land use categories were summarized.
Three different models using logistic regression, some with and some without autocovariate terms, were designed to identify drivers, including precipitation, floodplains, CTI, and different land use types, that influenced Harvey-induced flooding events both inside and outside of the city center of the Houston metropolitan region. The models were developed based on the pixel levels (i.e., 90 m resolution grids) with information extracted for potential predictors (i.e., precipitation, floodplains, CTI, and land use types) and the occurrence of flooding. The variables were screened prior to inclusion in model development based on tests of multicollinearity among variables (Pearson’s correlation coefficient |r| ≥ 0.7). The continuous variables (i.e., precipitation and CTI) were standardized to allow for a direct comparison among model coefficients. The logistic regression models were developed using the ‘glm’ function with the distribution family as ‘Bernoulli’ distribution in R v3.4.2 (Equation (2)) [49].
w ( f l o o d i n g ) = e β 0 + β 1 x 1 + β 2 x 2 + + β n x n
where w(x) is the relative probability of a pixel being flooded, β0 is the intercept, and βi is the estimated coefficient of the aforementioned potential factors (xi) that influence flooding events. The values of these covariates (xi) were extracted to each pixel centroid. If βi > 1, the factor is indicated to increase the probability of flooding, and a βi <  1 indicates a decreased chance of flooding due to this factor.
For the baseline models, we assumed that the flooding events are only associated with precipitation and CTI. Specifically, flooding is more likely to occur at places with more rainfall and drainage depressions. For the second group of models, we added the floodplains predictor and an additional autocovariate term into the baseline model. Here, it was assumed that there is a higher chance of flooding at places located within floodplains with more drainage depressions and increased rainfall. The autocovariate is a weight matrix that accounts for local effects: locations adjacent or closer to where flooding events occur are more likely to be affected. To adjust for autocorrelation in the model residuals, an autocovariate component was incorporated as spatial lags to remove spatial autocorrelation [50]. The autocovariate component was calculated as the inverse-distance weighted average of the outcome variable within a predefined distance around a given location (Equation (3)).
A i = j k w i j y j
where k is the set of neighboring pixels included in a user-defined distance, yj is the outcome variables at each location j, and wij the inversed-distance weights given the influence of site j on site i. A set of permutation-based Moran’s I values were calculated for the model residuals without the autocovariate component based on different spatial neighbor matrices for different distance classes (i.e., 1 km increasing interval). Given those Moran’s I values, we used 25 km and 10 km as the predefined distances to calculate the autocovariate component for both the model outside city limits and the model within city limits.
For the third group of models, to estimate the role each land use type plays on flooding, we incorporated different land use types, including residential, industrial, commercial, open spaces, undeveloped land, and agricultural land (compared to undeveloped land), as additional predictors based on the second type of models. The autocovariate component was also included in this model, with 25 km and 10 km as the predefined searching distances for the city center areas and outside city center areas. Finally, the significance of the three different models was assessed by comparing model likelihood estimates to the likelihood of the baseline model, with only precipitation and CTI as covariates [51].

3. Results

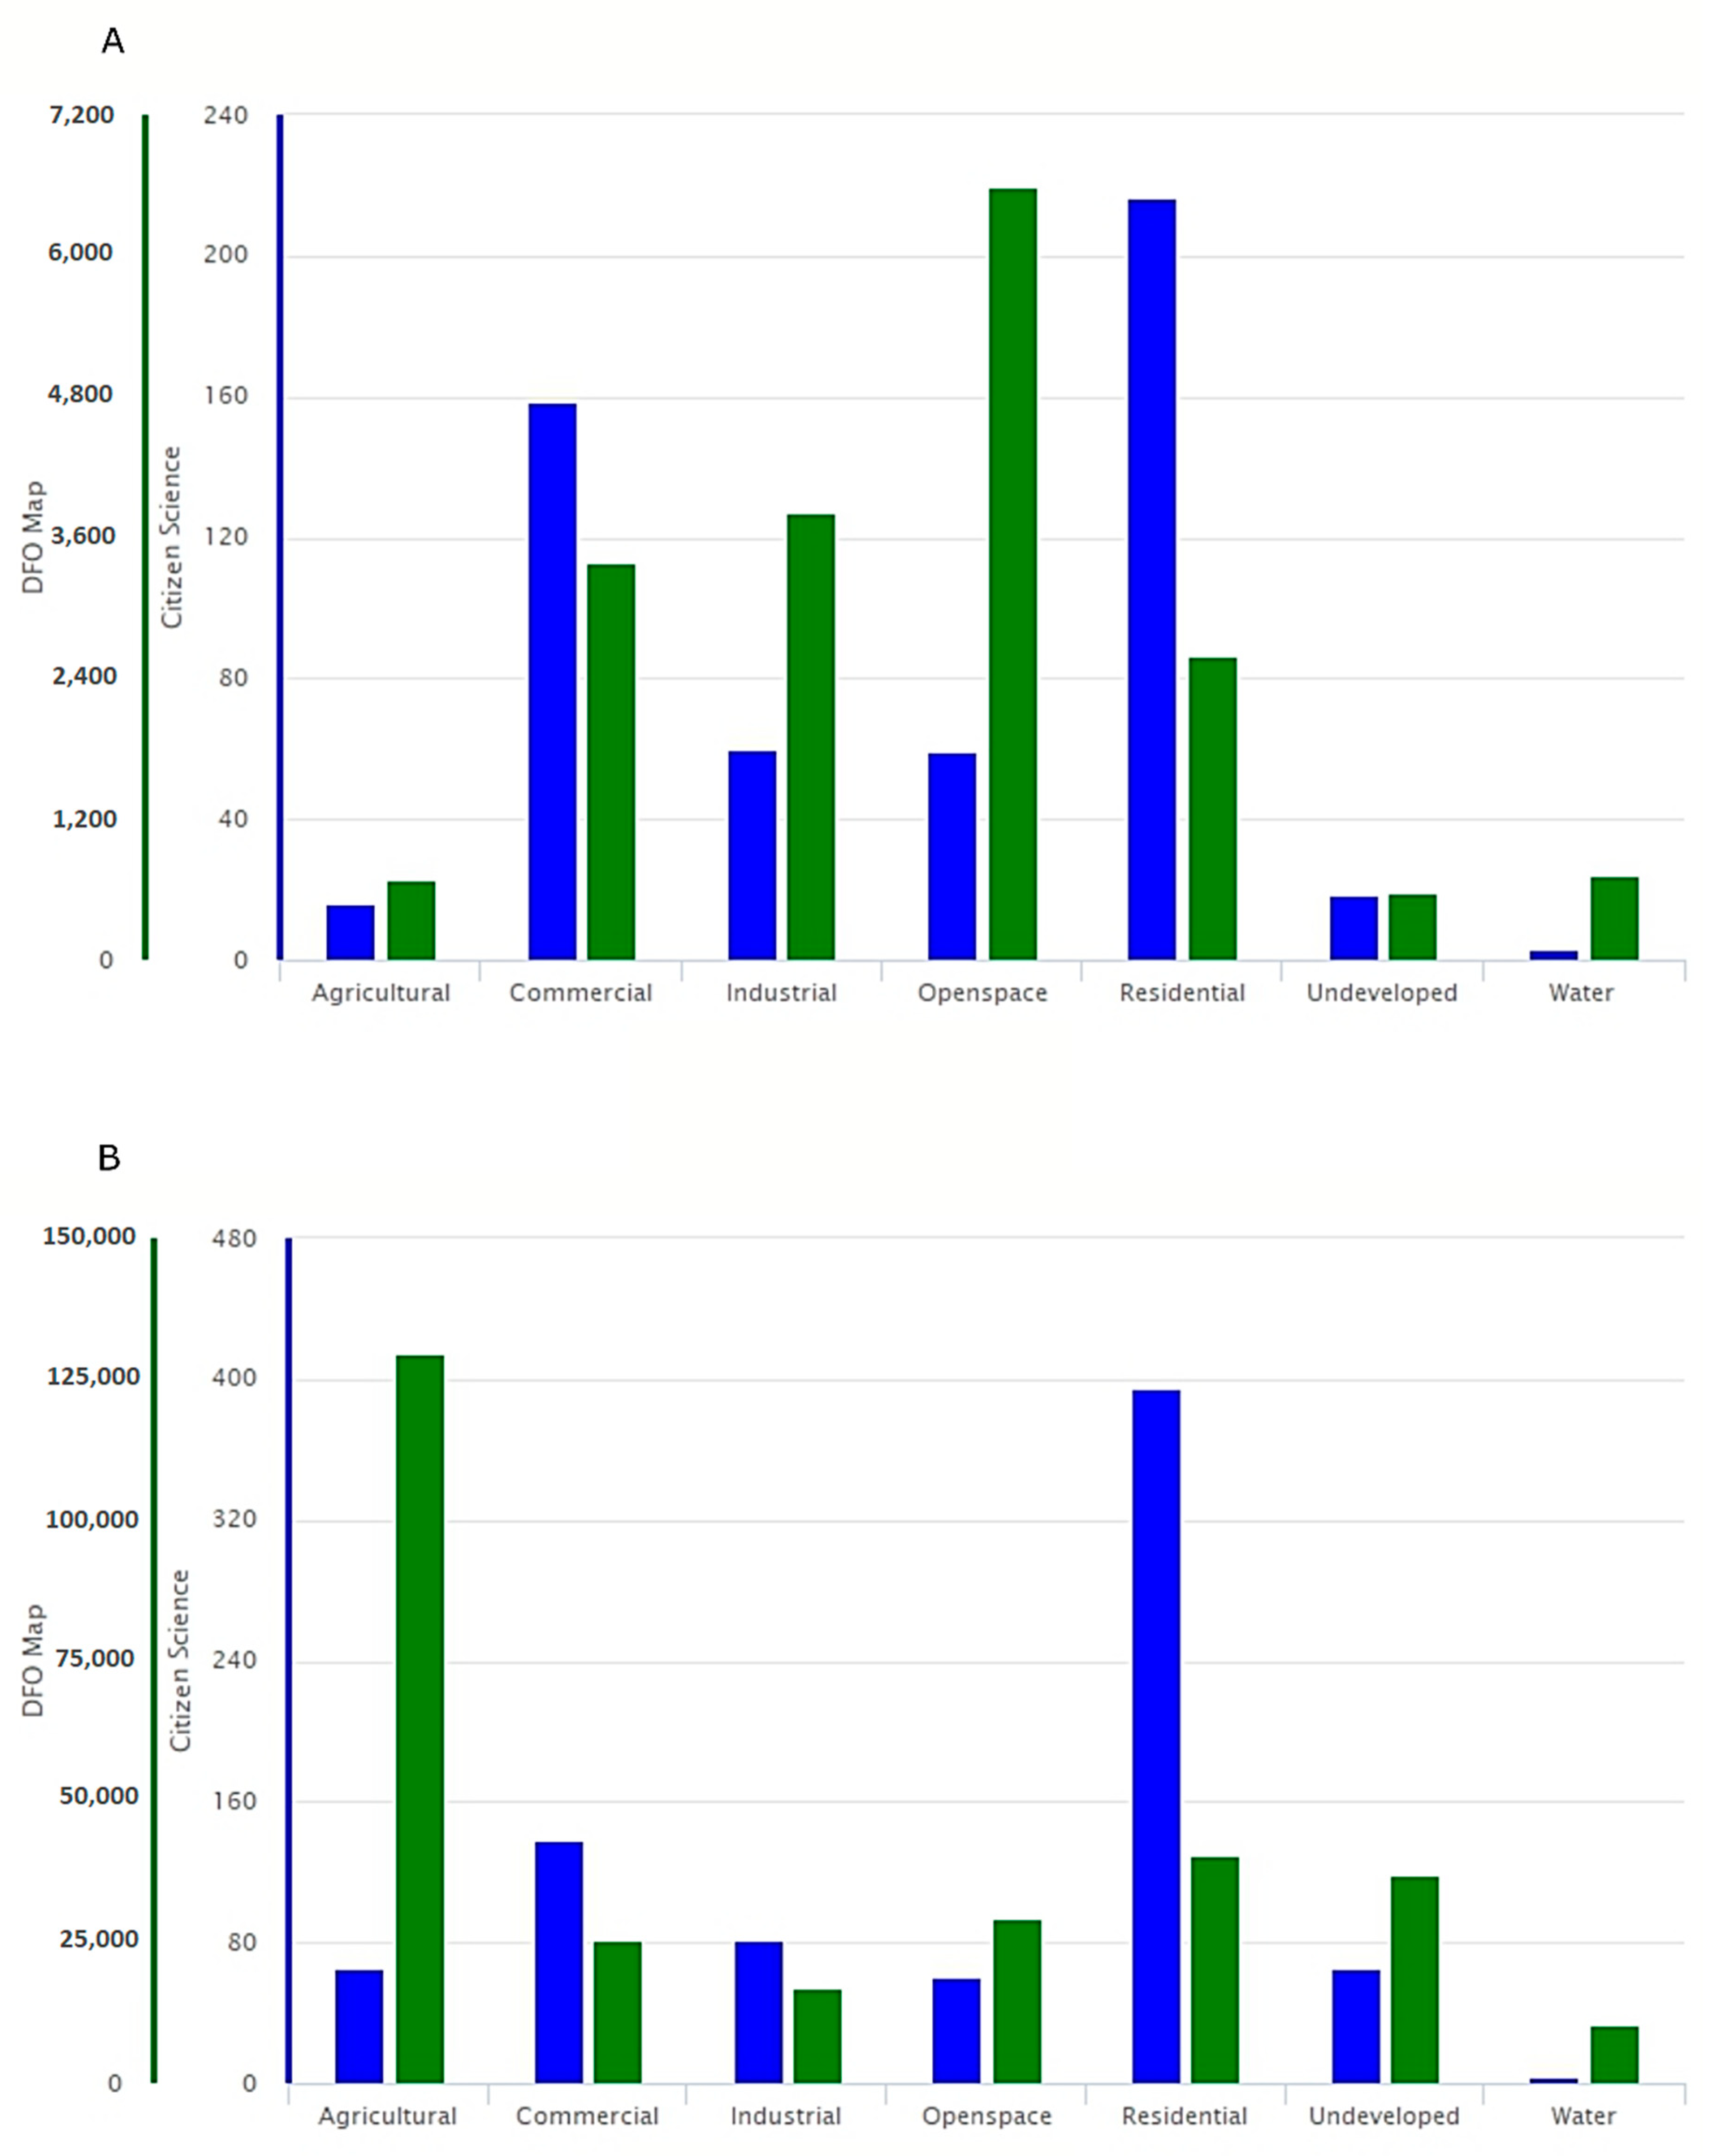
3.1. Hurricane-Harvey-Induced Flooded Regions and Floodplains under Different Land Uses

Figure 4 shows the reclassification of the H-GAC’s land use parcel data. Figure 5A presents a summary of the different land use types in the Harvey-induced flooded regions inside and outside the city center. In the Houston metropolitan city center, the largest flooded area was open space, followed by commercial, industrial, residential, agriculture, and undeveloped lands. For the flooded area outside the city center, the largest flooded area was agriculture, followed by residential, undeveloped, open space, commercial, and industrial lands. Only 4% of the total flooded region in the Houston city center was agricultural lands, compared with 46% of the total flooded region outside the city center. The proportion of residential area flooded inside and outside of the city center was 20% and 16%, respectively. For undeveloped land, 13% was flooded outside of the city center and 3% was flooded inside the city center.
Figure 5B summarizes different land use types in the Federal Emergency Management Agency (FEMA) 100-year floodplain in and outside the city center. In the floodplain of the city center, open space lands consume the largest area, followed by residential, industrial, commercial, undeveloped, and agriculture lands. For the floodplain outside of the city center, agricultural lands cover the largest flooded area, followed by open space, undeveloped, residential, commercial, and industrial lands. A similar pattern of the proportion of the 100-year floodplain in different land use types is suggested, compared to the proportion of flooded areas in different land use types. About 4% of total floodplain in the Houston city center are agricultural lands, but 36% outside the city center. Another 4% of floodplain in the city center is undeveloped lands. Undeveloped lands outside of the city center cover 17% of the total floodplain. Commercial and industrial lands both take 13% of floodplain in the city center, but only occupy 7% outside the city center. About 38% and 28% of floodplain in the Houston city center are open space and residential areas, respectively. There are 17% and 16% of floodplain outside of the city center identified as open space and residential areas.

3.2. Factors Influencing Harvey-Induced Flooding

There was no multicollinearity in the datasets, since there were no variables with a Pearson’s correlation coefficient |r|  ≥  0.7. Table 1 gives the model constructions of the three types of models, and the model comparison results based on log-likelihood ratio tests. As compared to other models based on the log-likelihood ratio test, we selected the model with structure ‘CTI + precipitation + floodplain + agricultural + industrial + commercial + open space + residential + autocovariate’ as the final model for both the city center and outside of the city center areas. This indicated that land use in both areas significantly affected the probability of rainfall-induced flooding. Places with more rainfall, more drainage depressions, located within 100-year floodplains (Figure A3), and classified as agricultural, commercial, and open spaces land use types (compared to undeveloped areas) were all significantly associated with higher risks of flooding outside the city center areas, while residential areas (compared to undeveloped areas) were associated with lower probability of flooding (Table 2). For the city center areas, the places with more rainfall, more drainage depressions, located within 100-year floodplains, and classified as agricultural and commercial land use types (compared to undeveloped areas) significantly increased the probability of flooding, while residential areas decreased the probability of flooding (Table 2).

4. Discussion

Hurricane Harvey’s preliminary damage assessment reached $12.5 billion [52], which makes it one of the costliest natural disasters in United States history, second only to Hurricane Katrina in 2005. This study combined both public remotely sensed data and citizen-contributed data to quantitatively estimate the effects of different land use types on Hurricane-Harvey-induced flooding. Overall, the results suggested that land uses significantly affected the occurrence of flooding events, and that the effects varied inside and outside of the city center of the Houston metropolitan area. The results suggested that agricultural and open space were associated with high risk of flooding outside the city center, and industrial lands increased the high risk of flooding in the city center. Residential areas reduced the potential of flooding both inside and outside the city center, while commercial areas increased the risk of flooding events.
Regarding the concept of crowdsourcing, VGI provides different data collection mechanisms from the traditional authoritative geographic information obtained from official or governmental institutions, agencies, or earth observations. During Hurricane Harvey in 2017, volunteer citizens and residents in disastrous areas become the producers of geographical and spatial information [1,53]. While often being ignored by traditional data collection methods, some detailed, specific information, such as local knowledge and conditions, can be collected by local people who can move freely and are aware of the surrounding situations [54,55,56]. Given the limited access to the flooded areas and the difficulties in commuting, local residents supported the rescue organizations to understand the scale of crisis, to guide the helpers to deliver aid to those worst affected areas efficiently by reporting the location, emergency descriptions, and real-time flooded areas [25].
To ensure the integrity of information for natural disaster management, it is crucial to integrate data from multiple sources. In particular, we highlight the incorporation of citizen-contributed data. For the earth observation datasets, there exist various uncertainties, such as noisy sensor measurements with limited accuracy, obstacles of targeted objects by other objects, aerosol effects, and coarse resolutions [57]. However, those uncertainties might be minimized by incorporating citizen-contributed information. Humans could serve as moving sensors on the landscape, and provide the filtered and contextual information based on their knowledge and sense. Citizen science participatory mapping can be important in the face of disaster management in a timely manner, especially where the disastrous areas are not accessible. Here, residents in the study areas provided 14,667.5 Ha of flooded area, which was not identified by the DFO map (5088.4 Ha inside of Houston city center; 6969.3 Ha outside of Houston city center (Figure 2; Figure 3). Those citizen science-contributed data were primarily found in highly populated areas, such as commercial and residential land.
The descriptive analysis found that about half of the flooded area did not show up on the floodplain. The FEMA floodplain map was generated based on the risk of flooding in 100 years, and the estimation of topography, drainage pressure, and landscape changes. However, in the face of flash flooding events, like Hurricane-Harvey-induced flooding, the floodplain is not the only factor that determines the occurrence of flooding events. A zoning strategy that considers human development factors, such as land use patterns, is therefore strongly needed in Houston metropolitan areas to estimate the potential of flooding events. Based on the summary of land use on the floodplain and in the flooded areas in the Houston, Texas, flooding caused significant damage to all land use types. Lands used by commercial and industrial enterprises are clustered (Figure 3) and cover over 14% of the floodplain. Despite the residential coverage of ~16%, the study area is still an industrialized landscape marked by an array of energy facilities, which suffered a huge economic loss during Hurricane Harvey. It is therefore critical to reassess and decrease the vulnerability of commercial and industrial infrastructure. To avoid future TC-induced flooding risk, in April 2018, Houston city councilors voted to mandate that all new homes must be built 2 feet above the water level of a 500-year storm, instead of a 100 year floodplain [58].
The effects of some land use types on flash flooding supported the results from some previous research [7,13,14,59], but varied inside and outside the city center. This study found that agricultural areas and open space outside the city center were associated with the high risk of flooding, but had no significant effects in the city center areas. Extensive agricultural lands with compact soil due to ploughs and little vegetation cover were found to reduce the functionality of the natural hydrological system and cause flooding, as suggested by O’Connell et al. [22] and Wheater et al. [21]. In Houston areas, agricultural lands and residential lands account for the majority of land (39.11% and 27.19%, respectively) outside the city center. Most extensive agricultural lands are located outside the city center in the southern part, with undeveloped lands sparsely distributed among those areas. However, in the city center, there were only a few areas identified for agricultural use along the city boundaries; few areas have not been developed. The study found TC-flooding occurred more in open space, which actually confirmed the role that open space plays in preventing flooding effects on the adjacent protected parcels, as suggested by Morris [60] and Bullock et al [16]. Generally, open space serves as an ‘avoidance’ strategy in flood mitigation [61]. Besides some recreational areas, open spaces are often designed to protect people and structures in flood-prone areas [13]. Of the open space areas in the study, there are two major parks in the western part of the city center, George Bush Park and Bear Creek Pioneers Park, and several small city parks and cemeteries sparsely located within the city. Most open spaces outside the city center are wildlife refuge protection areas, wetlands, and state parks. There are three large conservation areas, Brazoria National Wildlife Refuge, Justin Hurst Wildlife Management Area, and San Bernard National Wildlife Refuge, located to the south along the coastal areas. These open spaces along the coast leave space for the hydrological and riverine system, and reduce the potential impacts to structures. In particular, wetlands have the ability to store floodwater, minimizing flooding to adjacent structures like residential areas [59]. Industrial lands in the city center are associated with high chances of flooding, but show no significant influence outside the city center. Only 7% of the lands out of the city center were industrially used. Most of these lands are surrounded by undeveloped areas or open space, which help to prevent flooding. Insignificant effects of industrial lands on the flooding events were thus identified outside the city center.
It is interesting that the results suggested the residential areas in Houston city and outside city were associated with low risk of flooding. This result was different than some previous research, which suggests that residential areas are often highly compacted and impervious and should result in high risk of flooding [17,18,62]. One possible reason for the differences is that only 15% and 20% of the area located within the FEMA floodplain was residential inside and outside the city, respectively. This indicates that most residential areas are built outside the risky zones and away from watersheds. Another possible reason is that residential housing and green infrastructures in Houston, the modern metropolitan city, are equipped with well-maintained drainage systems and thus have lower flooding risk [14,63].
The catastrophic flooding caused by Hurricane Harvey in the Houston area was the product of multiple geophysical factors and neighborhood effects, as suggested in some other studies [6,43,46,64]. The total precipitation map shows a large amount of rainfall in the east close to Trinity Bay, which also includes the southwest part of the city center. However, extensive areas were flooded outside the city center and in the south of the study area. The CTI surface, a flow accumulation raster layer, shows the north part of the study area has low saturation potential, while most southern parts are under high drainage depressions. The relatively high coefficient values of the spatial autocovariate term in Table 2 and high deviance explained by this spatial lag (Table 2) indicate the major factor that influenced the risk of hurricane-induced flooding to be the neighborhood effects. The flooding condition of neighbors could significantly affect the potential of flooding at the location; in other words, a location is more likely to be flooded if its neighbor(s) is flooded [59,63,65]. The different land use types also accumulatively explained large deviances in the models for both inside and outside of the city center (Table 2), which indicates the significant role different land uses play on flooding events.

5. Conclusions

This study analyzed the relationship between different land use types and the occurrence of Hurricane-Harvey-induced flooding events in Houston metropolitan areas. The results suggested that land use patterns and types significantly affect flooding in Houston areas. Overall, we found agricultural and open space were associated with high risk of flooding outside the city center, industrial lands increased high risk of flooding in the city center, and residential areas reduced the potential of flooding both inside and outside the city center. The neighborhood-flooding condition was also detected as the major factor that affects the flooding risk. These results underscored the consideration of different land use types in the mitigation of TC-induced flooding events, which could assist with future land use strategies in the Houston metropolitan areas and prevent potential flash flooding risk. Given the significant contribution from citizen science data to the estimation of flooding information, this study also highlighted the application of citizen science data in natural disaster management and prevention. Nowadays, citizen science applications have been found in pre, during, post stages of natural disaster management, and will show more potential contributions in the near future.

Author Contributions

Conceptualization, D.Y. and A.Y.; methodology, D.Y.; A.Y and H.Q.; software, D.Y.; A.Y. and H.Q.; validation, C.-S.F.; Q.Y. and H.H.; formal analysis, D.Y. and A.Y.; investigation, C.-S.F.; resources, D.Y.; A.Y and H.Q.; data curation, D.Y.; A.Y. and H.Q.; writing—original draft preparation, D.Y.; A.Y. and H.Q.; writing—review and editing, D.Y.; A.Y and H.H.; visualization, D.Y. and A.Y.; supervision, Z.Y. and J.T.; project administration, D.Y.

Funding

This research received no external funding.

Acknowledgments

We appreciate the Houston-Galveston Area Council (H-GAC) for sharing the parcel level land use dataset for this study. We thank Michael Binford for reviewing the introduction section and provides critical feedback. We thank the Google Earth Engine Development Team for input and assistance with the API platform. More importantly, we appreciate the all the citizens’ contributions to flooding data collection.

Conflicts of Interest

The authors declare no conflict of interest.

Appendix A

Figure A1. Cumulative rainfall pattern map during hurricane Harvey, 2017.
Land 08 00025 g0a1
Figure A2. The distribution of Compound Topographic Index (CTI) across the study area.
Land 08 00025 g0a2
Figure A3. FEMA floodplain map showing areas has the potential of 100-year floods.
Land 08 00025 g0a3

References

  1. Goodchild, M.F.; Glennon, J.A. Crowdsourcing geographic information for disaster response: A research frontier. Int. J. Digit. Earth 2010, 3, 231–241. [Google Scholar] [CrossRef]
  2. Frey, A.E.; Olivera, F.; Irish, J.L.; Dunkin, L.M.; Kaihatu, J.M.; Ferreira, C.M.; Edge, B.L. Potential impact of climate change on hurricane flooding inundation, population affected and property damages in Corpus Christi. J. Am. Water Resour. Assoc. 2010, 46, 1049–1059. [Google Scholar] [CrossRef]
  3. Mousavi, M.E.; Irish, J.L.; Frey, A.E.; Olivera, F.; Edge, B.L. Global warming and hurricanes: The potential impact of hurricane intensification and sea level rise on coastal flooding. Clim. Chang. 2011, 104, 575–597. [Google Scholar] [CrossRef]
  4. Negri, A.J.; Burkardt, N.; Golden, J.H.; Halverson, J.B.; Huffman, G.J.; Larsen, M.C.; McGinley, J.A.; Updike, R.G.; Verdin, J.P.; Wieczorek, G.F. The hurricane–flood–landslide continuum. Bull. Am. Meteorol. Soc. 2005, 86, 1241–1247. [Google Scholar] [CrossRef]
  5. Barr, J.; Cohen, J.P.; Kim, E. Storm Surges, Informational Shocks, and the Price of Urban Real Estate: An Application to the Case of Hurricane Sandy; Department of Economics, Rutgers University: Newark, NJ, USA, 2017. [Google Scholar]
  6. Larsen, M.C.; Simon, A. A rainfall intensity-duration threshold for landslides in a humid-tropical environment, Puerto Rico. Geogr. Ann. Ser. Phys. Geogr. 1993, 75, 13–23. [Google Scholar] [CrossRef]
  7. Philpott, S.M.; Lin, B.B.; Jha, S.; Brines, S.J. A multi-scale assessment of hurricane impacts on agricultural landscapes based on land use and topographic features. Agric. Ecosyst. Environ. 2008, 128, 12–20. [Google Scholar] [CrossRef]
  8. Foley, J.A.; DeFries, R.; Asner, G.P.; Barford, C.; Bonan, G.; Carpenter, S.R.; Chapin, F.S.; Coe, M.T.; Daily, G.C.; Gibbs, H.K. Global consequences of land use. Science 2005, 309, 570–574. [Google Scholar] [CrossRef] [PubMed]
  9. Giupponi, C.; Mojtahed, V.; Gain, A.K.; Balbi, S.; Biscaro, C. An Integrated Approach for Including Social Capacities, and Economic Valuation in Risk Assessment of Water Related Hazards in Uncertain Scenarios. In Proceedings of the 2014 7th International Congress on Environmental Modelling and Software, San Diego, CA, USA, 15–19 June 2014. [Google Scholar]
  10. 1Dalu, M.T.B.; Shackleton, C.M.; Dalu, T. Influence of land cover, proximity to streams and household topographical location on flooding impact in informal settlements in the Eastern Cape, South Africa. Int. J. Disaster Risk Reduct. 2018, 28, 481–490. [Google Scholar]
  11. 1Brody, S.D.; Gunn, J.; Peacock, W.; Highfield, W.E. Examining the influence of development patterns on flood damages along the Gulf of mexico. J. Plan. Educ. Res. 2011, 31, 438–448. [Google Scholar]
  12. Randolph, J. Environmental Land Use Planning and Management; Island Press: Washington, DC, USA, 2004; ISBN 1-55963-948-2. [Google Scholar]
  13. Brody, S.D.; Highfield, W.E. Open space protection and flood mitigation: A national study. Land Use Policy 2013, 32, 89–95. [Google Scholar] [CrossRef]
  14. Brody, S.; Blessing, R.; Sebastian, A.; Bedient, P. Examining the impact of land use/land cover characteristics on flood losses. J. Environ. Plan. Manag. 2014, 57, 1252–1265. [Google Scholar] [CrossRef]
  15. Mitch, W.; Gosselink, J. Wetlands; John Wiley and & Sons: New York, NY, USA, 2000; 920p. [Google Scholar]
  16. Bullock, A.; Acreman, M. The role of wetlands in the hydrological cycle. Hydrol. Earth Syst. Sci. Discuss. 2003, 7, 358–389. [Google Scholar] [CrossRef] [Green Version]
  17. Schmitt, T.G.; Thomas, M.; Ettrich, N. Analysis and modeling of flooding in urban drainage systems. J. Hydrol. 2004, 299, 300–311. [Google Scholar] [CrossRef]
  18. Schubert, J.E.; Sanders, B.F.; Smith, M.J.; Wright, N.G. Unstructured mesh generation and landcover-based resistance for hydrodynamic modeling of urban flooding. Adv. Water Resour. 2008, 31, 1603–1621. [Google Scholar] [CrossRef]
  19. Casanova, M.T.; Brock, M.A. How do depth, duration and frequency of flooding influence the establishment of wetland plant communities? Plant Ecol. 2000, 147, 237–250. [Google Scholar] [CrossRef]
  20. Zope, P.; Eldho, T.; Jothiprakash, V. Impacts of land use–land cover change and urbanization on flooding: A case study of Oshiwara River Basin in Mumbai, India. Catena 2016, 145, 142–154. [Google Scholar] [CrossRef]
  21. Wheater, H.; Evans, E. Land use, water management and future flood risk. Land Use Policy 2009, 26, 251–264. [Google Scholar] [CrossRef]
  22. O’Connell, P.; Ewen, J.; O’Donnell, G.; Quinn, P. Is there a link between agricultural land-use management and flooding? Hydrol. Earth Syst. Sci. 2007, 11, 96–107. [Google Scholar] [CrossRef]
  23. van Oldenborgh, G.J.; van der Wiel, K.; Sebastian, A.; Singh, R.; Arrighi, J.; Otto, F.; Haustein, K.; Li, S.; Vecchi, G.; Cullen, H. Attribution of extreme rainfall from Hurricane Harvey, August 2017. Environ. Res. Lett. 2017, 12, 124009. [Google Scholar] [CrossRef] [Green Version]
  24. Bedient, P.; Blackburn, J.; Gori, A.; Juan, A. Tropical Storm Harvey Summary Report; SSPEED Center, Rice University: Houston, TX, USA, 2017; p. 14. [Google Scholar]
  25. FEMA. Historic Disaster Response to Hurricane Harvey in Texas; FEMA: Austin, TX, USA, 2017.
  26. Ngamassi, L.; Malik, A.; Zhang, J.; Ebert, D. Social Media Visual Analytic Toolkits for Disaster Management: A Review of the Literature. 2017. Available online: http://idl.iscram.org/files/louisngamassi/2017/1511_LouisNgamassi_etal2017.pdf (accessed on 28 January 2019).
  27. Simpson, R.; Page, K.R.; De Roure, D. Zooniverse: Observing the world’s largest citizen science platform. In Proceedings of the 23rd International Conference on World Wide Web, Seoul, Korea, 7–11 April 2014; pp. 1049–1054. [Google Scholar]
  28. Humanitarian OpenStreetMap Team. Humanitarian OpenStreetMap. Retrieved Febr. 2018, 13. Available online: https://www.hotosm.org/tools-and-data (accessed on 29 January 2019).
  29. Goodchild, M.F. Citizens as sensors: The world of volunteered geography. GeoJournal 2007, 69, 211–221. [Google Scholar] [CrossRef]
  30. Longueville, B.D.; Luraschi, G.; Smits, P.; Peedell, S.; Groeve, T.D. Citizens as sensors for natural hazards: A VGI integration workflow. Geomatica 2010, 64, 41–59. [Google Scholar]
  31. Hochmair, H.H.; Juhász, L.; Cvetojevic, S. Data Quality of Points of Interest in Selected Mapping and Social Media Platforms; Springer: Berlin/Heidelberg, Germany, 2018; pp. 293–313. [Google Scholar]
  32. Li, S.; Dragicevic, S.; Castro, F.A.; Sester, M.; Winter, S.; Coltekin, A.; Pettit, C.; Jiang, B.; Haworth, J.; Stein, A. Geospatial big data handling theory and methods: A review and research challenges. ISPRS J. Photogramm. Remote Sens. 2016, 115, 119–133. [Google Scholar] [CrossRef] [Green Version]
  33. Lyons, S.W. Spatial and temporal variability of monthly precipitation in Texas. Mon. Weather Rev. 1990, 118, 2634–2648. [Google Scholar] [CrossRef]
  34. Qian, Z. Without zoning: Urban development and land use controls in Houston. Cities 2010, 27, 31–41. [Google Scholar] [CrossRef]
  35. US Census Bureau. TIGER/Line Tracts and Blocks; US Census Bureau: Suitland, MD, USA, 2017.
  36. Bengston, D.N.; Fletcher, J.O.; Nelson, K.C. Public policies for managing urban growth and protecting open space: Policy instruments and lessons learned in the United States. Landsc. Urban Plan. 2004, 69, 271–286. [Google Scholar] [CrossRef]
  37. Brakenridge, G.R.; Kettner, A.J. DFO Flood Event #4510; University of Colorado: Boulder, CO, USA, 2017. [Google Scholar]
  38. Bartier, P.M.; Keller, C.P. Multivariate interpolation to incorporate thematic surface data using inverse distance weighting (IDW). Comput. Geosci. 1996, 22, 795–799. [Google Scholar] [CrossRef]
  39. Pebesma, E.J. Multivariable geostatistics in S: The gstat package. Comput. Geosci. 2004, 30, 683–691. [Google Scholar] [CrossRef]
  40. R Core Team. R: A Language and Environment for Statistical Computing [Internet]; R Core Team: Vienna, Austria, 2014. [Google Scholar]
  41. Vaze, J.; Teng, J.; Spencer, G. Impact of DEM accuracy and resolution on topographic indices. Environ. Model. Softw. 2010, 25, 1086–1098. [Google Scholar] [CrossRef]
  42. Beven, K.J.; Kirkby, M.J. A physically based, variable contributing area model of basin hydrology/Un modèle à base physique de zone d’appel variable de l’hydrologie du bassin versant. Hydrol. Sci. J. 1979, 24, 43–69. [Google Scholar] [CrossRef]
  43. Gessler, P.E.; Moore, I.; McKenzie, N.; Ryan, P. Soil-landscape modelling and spatial prediction of soil attributes. Int. J. Geogr. Inf. Syst. 1995, 9, 421–432. [Google Scholar] [CrossRef] [Green Version]
  44. Ågren, A.; Lidberg, W.; Strömgren, M.; Ogilvie, J.; Arp, P. Evaluating digital terrain indices for soil wetness mapping—A Swedish case study. Hydrol. Earth Syst. Sci. 2014, 18, 3623–3634. [Google Scholar] [CrossRef]
  45. Xu, X.; Liu, W.; Scanlon, B.R.; Zhang, L.; Pan, M. Local and global factors controlling water-energy balances within the Budyko framework. Geophys. Res. Lett. 2013, 40, 6123–6129. [Google Scholar] [CrossRef] [Green Version]
  46. Hjerdt, K.; McDonnell, J.; Seibert, J.; Rodhe, A. A new topographic index to quantify downslope controls on local drainage. Water Resour. Res. 2004, 40. [Google Scholar] [CrossRef] [Green Version]
  47. Ballerine, C. Topographic Wetness Index Urban Flooding Awareness Act Action Support; Prairie Research Institute, University of Illinois at Urbana-Champaign: Will County/DuPage County, IL, USA, 2017. [Google Scholar]
  48. Sörensen, R.; Zinko, U.; Seibert, J. On the calculation of the topographic wetness index: Evaluation of different methods based on field observations. Hydrol. Earth Syst. Sci. Discuss. 2006, 10, 101–112. [Google Scholar] [CrossRef]
  49. R Core Team. R: A Language and Environment for Statistical Computing [Internet]; R Core Team: Vienna, Austria, 2017. [Google Scholar]
  50. Dormann, C.F.; McPherson, J.M.; Araújo, M.B.; Bivand, R.; Bolliger, J.; Carl, G.; Davies, R.G.; Hirzel, A.; Jetz, W.; Daniel Kissling, W. Methods to account for spatial autocorrelation in the analysis of species distributional data: A review. Ecography 2007, 30, 609–628. [Google Scholar] [CrossRef]
  51. Taper, M.L.; Ponciano, J.M. Evidential statistics as a statistical modern synthesis to support 21st century science. Popul. Ecol. 2016, 58, 9–29. [Google Scholar] [CrossRef]
  52. National Hurricane Center. Costliest U.S. Tropical Cyclones Tables Updated; NOAA: Miami, FL, USA, 2018.
  53. Elwood, S.; Goodchild, M.F.; Sui, D.Z. Researching volunteered geographic information: Spatial data, geographic research, and new social practice. Ann. Assoc. Am. Geogr. 2012, 102, 571–590. [Google Scholar] [CrossRef]
  54. Tulloch, D.L. Is VGI participation? From vernal pools to video games. GeoJournal 2008, 72, 161–171. [Google Scholar] [CrossRef]
  55. Johnson, P.A.; Sieber, R.E. Situating the adoption of VGI by government. In Crowdsourcing Geographic Knowledge; Springer: Berlin/Heidelberg, Germany, 2013; pp. 65–81. [Google Scholar]
  56. Poser, K.; Dransch, D. Volunteered geographic information for disaster management with application to rapid flood damage estimation. Geomatica 2010, 64, 89–98. [Google Scholar]
  57. Congalton, R.G.; Green, K. Assessing the Accuracy of Remotely Sensed Data: Principles and Practices; CRC Press: Boca Raton, FL, USA, 2008. [Google Scholar]
  58. Dovey, R. Next City. 2018. Available online: https://nextcity.org/daily/author/rachel-dovey (accessed on 28 January 2019).
  59. Brody, S.D.; Highfield, W.E.; Ryu, H.-C.; Spanel-Weber, L. Examining the relationship between wetland alteration and watershed flooding in Texas and Florida. Nat. Hazards 2007, 40, 413–428. [Google Scholar] [CrossRef]
  60. Morris, N. Health, Well-Being and Open Space; Edinburgh College of Art and Heriot-Watt University: Edinburgh, UK, 2003. [Google Scholar]
  61. Beatley, T. Planning for Coastal Resilience: Best practices for Calamitous Times; Island Press: Washington, DC, USA, 2012; ISBN 1-61091-142-3. [Google Scholar]
  62. Cammerer, H.; Thieken, A.H.; Lammel, J. Adaptability and transferability of flood loss functions in residential areas. Nat. Hazards Earth Syst. Sci. 2013, 13, 3063–3081. [Google Scholar] [CrossRef] [Green Version]
  63. Zellner, M.; Massey, D.; Minor, E.; Gonzalez-Meler, M. Exploring the effects of green infrastructure placement on neighborhood-level flooding via spatially explicit simulations. Comput. Environ. Urban Syst. 2016, 59, 116–128. [Google Scholar] [CrossRef] [Green Version]
  64. Seiler, R.; Hayes, M.; Bressan, L. Using the standardized precipitation index for flood risk monitoring. Int. J. Climatol. 2002, 22, 1365–1376. [Google Scholar] [CrossRef] [Green Version]
  65. Montz, B.E.; Tobin, G.A. The spatial and temporal variability of residential real estate values in response to flooding. Disasters 1988, 12, 345–355. [Google Scholar] [CrossRef]
Figure 1. Study area with red polygon representing the city center extent.
Land 08 00025 g001
Figure 2. Hurricane-Harvey-induced flooding map areas.
Land 08 00025 g002
Figure 3. The flooded areas (in ha) under different land use types captured separately by Dartmouth Flooding Observation (DFO) maps and citizen science. (A) Land use compositions in flooded areas inside the city center; (B) land use compositions in flooded areas outside the city center.
Land 08 00025 g003
Figure 4. Houston-Galveston Area Council (H-GAC) Regrouped land use patterns.
Land 08 00025 g004
Figure 5. Summary of different land use types in Harvey-induced flooded regions and Federal Emergency Management Agency (FEMA) 100-year floodplains inside and outside of Houston city center areas. (A) Land use composition in composite flooding regions, and (B) land use composition in FEMA 100-year floodplain.
Land 08 00025 g005
Table 1. Model comparisons for tests of the driving factors influencing the occurrences of flooding events in Hurricane Harvey.
ModelsLog-Likelihoodχ2p-Value
Outside city center
flood ~ CTI + precipitation−20,661--
flood ~ CTI + precipitation + floodplain + autocovariate term−16,1858951.492.2e–16
flood ~ CTI + precipitation + floodplain + agricultural + industrial + commercial + open space + residential + autocovariate term−15,952465.942.2e–16
Inside city center
flood ~ CTI + precipitation−9308.2
flood ~ CTI + precipitation + floodplain + autocovariate term−7671.23274.032.2e–16
flood ~ CTI + precipitation + floodplain + agricultural + industrial + commercial + open space + residential + spa autocovariate term−7534.5273.412.2e–16
Table 2. Standardized coefficient estimates and Wald’s type 95% confidence intervals for covariates included in the final logistic regression models for the estimation of influence on flooding events in Hurricane Harvey.
Outside of City CenterCity Center
VariablesCoefficientVariablesCoefficient
intercept a−3.85 (−3.89, −3.81)intercept a−3.35 (−3.29, −3.41)
CTI b−0.04 (−0.06, −0.02)CTI a−0.16 (−0.14, −0.18)
precipitation a0.28 (0.26, 0.30)precipitation a0.20 (0.18, 0.22)
floodplain a1.44 (1.41, 1.47)floodplain a1.02 (0.96, 1.08)
agricultural a0.33 (0.29, 0.37)agricultural c0.16 (0.04, 0.28)
industrial c0.01 (−0.07, 0.09)industrial a0.23 (0.16, 0.30)
commercial a0.77 (0.71,0.83)commercial b0.16 (0.10, 0.22)
open space a0.25 (0.20, 0.30)open space c−0.08 (−0.16, 0.00)
residential a−0.44 (−0.49, −0.39)residential a−0.76 (−0.69, −0.83)
spatial lags a18.27 (17.99, 18.55)spatial lags a13.06 (12.68, 13.44)
a: indicates significance with 99% confidence. b: indicates significance with 95% confidence. c: indicates insignificance.

