Article

Correction Factor for Mitigating the ‘One-Size-Fits-All’ Phenomenon in Assessing Low-Carbon City Performance

1
Research Institute for Urban Planning and Development, Hangzhou City University, Hangzhou 310015, China
2
School of Spatial Planning and Design, Hangzhou City University, Hangzhou 310015, China
3
School of Public Affairs, Zhejiang University, Hangzhou 310030, China
4
School of Management Science and Real Estate, Chongqing University, Chongqing 400044, China
5
School of Social Development and Public Policy, Fudan University, Shanghai 200433, China
*
Author to whom correspondence should be addressed.
Land 2024, 13(4), 433; https://doi.org/10.3390/land13040433
Submission received: 19 February 2024 / Revised: 23 March 2024 / Accepted: 26 March 2024 / Published: 28 March 2024
(This article belongs to the Topic Low Carbon Economy and Sustainable Development)

Abstract

:
Performance assessment of low carbon cities (LCCs) attracts great interest and attention from academia, industry, and government as an effective measure to promote urban low-carbon development. However, the efforts of LCCs could be misinterpreted without consideration of the fact that cities with different endowments face different challenges and assume different responsibilities, thus it is important that this fact is considered in assessing LCCs’ performance. This study develops the previous study by the research team, “dual perspective diagnosis method for assessing LCC performance”, by introducing a correction factor to take into account the impacts of local endowments and mitigate the ‘one-size-fits-all’ phenomenon when comparing LCC assessments between cities. The empirical case study presented in the paper indicates that the adoption of a correction factor has improved the accuracy of the assessment results by demonstrating actual management efforts in developing LCC performance. It is proposed that applying the correction factor can help to achieve more accurate assessments of the status of low-carbon city practice, based on which more effective low-carbon policies can be designed and implemented towards achieving carbon peaking and carbon neutrality goals.

1. Introduction

Global warming, driven by escalating carbon emissions, has shown a substantial surge over the last decade, further exerting profound adverse effects on vital sectors such as agriculture, human well-being, and ecosystems [1,2]. In line with this, as the major strategy for tackling climate change, reducing carbon emissions has been promoted and implemented internationally. The Paris Agreement, as an emblematic manifestation of international consensus, delineates precise emission-reduction targets for nations, seeking to temper the trajectory of global temperature elevation [3]. In the context of this background, as one of the largest carbon emitting countries, China has specified the targets of reaching peak carbon dioxide emissions by 2030 and achieving carbon neutrality before 2060 [4]. To achieve these dual carbon goals, over 80 cities in China have been designated as pilot cities for implementing low-carbon measures, and their low-carbon city (LCC) performance has been accessed by the Ministry of Ecology and Environment [5].
One important principle promoted internationally in committing to LCCs is “common but differentiated responsibilities”, by which countries are requested to make efforts at varying degrees in emission reduction [6,7]. This differentiation principle is also applicable between cities. Cities have different socioeconomic and natural endowments, and they face different difficulties in improving LCC performance, thus they are expected to assume different and tailor made responsibilities. For example, a fossil-fuel reliant city with scant vegetation coverage might be incapable of attaining the level of carbon emission reductions as a forest city. Therefore, the effort of improving LCC performance could vary significantly between different cities in order for them to reach similar levels of emission reductions.
So how can we achieve an adequate insight into a city’s endeavors and performance in promoting low-carbon city policies? Previous studies have introduced various evaluation systems and investigated different factors that affect LCC performance. For example, Du et al. [8] proposed five dimensions in developing an LCC evaluation system, namely optimizing industrial structure, adjusting energy structure, improving energy efficiency, enhancing carbon sink level, and improving low-carbon management mechanisms. Tan et al. [9] constructed an LCC indicator framework composed of 20 quantitative indicators under seven categories, including city economic development, en Please clarify if ergy pattern, social and living, carbon and environmental, urban mobility, waste, and water. Wang et al. [10] proposed an evaluation index system with 25 specific indexes in five dimensions, including low-carbon economy, low-carbon society, urban planning, energy utilization, and low-carbon environment. Chen et al. [11] developed a comprehensive evaluation system for assessing low-carbon city performance, incorporating 15 specific indicators across six dimensions: macro-level green and low-carbon development, low-carbon energy utilization, low-carbon industrial practices, low-carbon lifestyle adoption, resources and environmental management, and low-carbon policy and innovation initiatives. Zhang et al. [12] adopted a data-driven methodology to determine the low-carbon development status of cities, selecting 14 indicators aligned with eight critical criteria: energy efficiency, transportation systems, economic activities, atmospheric conditions, water and land resource management, pollution control measures, ecological conservation efforts, and urban infrastructure development.
The influence of socioeconomic and natural factors on the development of LCCs has been well appreciated. Ye et al. [13] pointed out that the level of education has a promoting effect on individual low-carbon behavior. Taking Beijing as a research case, Wu et al. [14] found that economic output and energy structure are the key variables determining the scale of carbon emissions. Price et al. [15] applied a weather-adjusted factor for evaluating the low-carbon performance of the building sector, considering that climate has a direct effect on residential energy intensity. Luo et al. [16] examined the overall and heterogeneous impacts of urban spatial structure on carbon emissions by using a two-way fixed-effects model and a geographically and temporally weighted regression model, and found that urban expansion and the increased complexity of land patches promote carbon emissions. Jiang et al. [17] measured the industrial carbon emission efficiency (ICEE) of 48 cities and explored the influencing factors of ICEE. The results showed that ICEE has great spatial dependence. Other socioeconomic and natural endowment factors, however, can also affect LCC performance. It is thought that the disparities between cities should be taken into account, and the measure of LCC performance should mainly reflect the effective endeavors and contributions that a city’s administration has invested. Therefore, the influence of those endowment factors on LCC assessment should be filtered to avoid the ’one-size-fit-all’ phenomenon. It is otherwise unfair for cities with different endowment conditions to be assessed by applying the same LCC evaluation method, from which the evaluation outcomes cannot show the genuine endeavor contributed by cities in implementing emission reduction policies. The endeavors of cities can be underestimated or overstated, and urban managers could misjudge their LCC’s performance. In turn, improper LCC policy measures will then be designated. Furthermore, if the assessment of LCC performance is conducted indiscriminately, the assessment results may not effectively encourage, but rather discourage, cities’ efforts. Therefore, in order to reflect accurately a city’s LCC performance, LCC evaluation results need to be corrected by considering the variation in these endowment factors between cities.
In line with the above discussion, a correction factor is considered necessary for the assessment of LCC performance. As for those cities with poor socioeconomic and natural endowments, their LCC program starts from a lower base, so they need more time and effort to achieve the aim of emission reduction in comparison with cities with a higher starting base. In order not to underestimate the management efforts contributed by cities in disadvantageous positions, a correction factor should be introduced to supplement the effect of the endowment disadvantage on LCC practice. On the other hand, for those cities with advantageous socioeconomic and natural endowment conditions, a correction factor is applied to modify the evaluation results by eliminating the benefits of the innate advantages, thus the real level of efforts made in promoting a low-carbon city can be presented.
There are two objectives in this study: (1) to identify the variables which reveal the differences in local endowment factors when comparing LCC performance between cities; and (2) to establish the method for calculating the value of the correction factor. Following this introduction section, Section 2 presents the literature review. Section 3 displays the research framework and methods. Section 4 and Section 5 present empirical analysis and discussion, followed by the conclusion in Section 6.

2. Literature Review

Our previous work [18] presented a dual perspective framework for evaluating low-carbon city performance (LCCP), which incorporates carbon source and carbon sink indicators across five management processes (Plan, Do, Check, Outcome, and Act) into an integrative indicator system. According to this dual perspective framework, we presented an LCCP calculation model and conducted the pilot application in Beijing, Shanghai, Tianjin, and Chongqing. However, the LCCP model introduced by Shen et al. [18] is limited to the assumption that all the cities participating in the assessment have similar socioeconomic and natural conditions. Thus, the assessment using the LCCP model presents a ’one-size-fits-all’ phenomenon. Nevertheless, as discussed in the introduction section, the LCC performance between cities differs not only because of their different management efforts but also their different natural and anthropogenic circumstances, which is also echoed in the study by Zhou et al. [19]. Therefore, this study intends to extend our previous study to the introduction of a correction factor in order to establish a fairer basis for assessing LCC performance.
Many previous studies have pointed out that the natural resources and socioeconomic endowments of a city have a great impact on the level of LCCP. For instance, Wang et al. [20] opined that different cities have significant differences in terms of economic development, population scale, geographical features, energy endowment, and their volumes of carbon dioxide (CO2) emission, therefore it is essential to take into account the characteristics of urban CO2 emissions in different cities and propose differentiated CO2 emission reduction measures. Zhang et al. [21] pointed out that the natural conditions, resource endowment, energy structure, industrial structure, and social and economic development level of different cities in China have great regional differences, so it is inappropriate to adopt the same set of indexes when evaluating the level of LCCP. Du et al. [22] indicated that southern cities in China have better LCC performance than northern cities largely because of the superior natural and socioeconomic endowments in southern China, characterized by warmer weather in winter, which leads to less demand for heating and consequently less demand for coal consumption. Furthermore, southern cities in China are economically better developed, thus they can afford to invest more on carbon emission reduction.
However, whilst many existing studies have recognized the fact that the endowment conditions of cities have a great impact on their LCCP, few studies have actually considered how to mitigate this endowment influence and avoid the ‘one-size-fits-all’ phenomenon in the evaluation. Some studies have attempted to mitigate the phenomenon by classifying cities into several categories according to natural and socioeconomic factors. For example, Zhou et al. [19] opined that subcategorizing cities based on their climate zone, water availability, and economic structure is necessary for conducting LCCP assessments, so that cities with similar exogenous characteristics can be fairly compared in peer groups. Zhuang [23] classified cities into four categories, according to their industrial structure, urbanization level, and ecological endowment, when evaluating the LCCP between 70 pilot cities in China, and set different benchmark values for different categories in order to mitigate the ‘one-size-fits-all’ phenomenon. Azizalrahman and Hasyimi [24] and Du et al. [22] emphasized the importance of classifying cities into various categories; thus, different assessment methods can be applied for cities in different categories.
The above discussion demonstrates that previous studies have not offered effective methods to mitigate the ‘one-size-fits-all’ phenomenon in conducting LCCP assessments of different cities. The lack of such methods leads to the inappropriate practice of assessing the LCC performances of different cities indiscriminately. The LCC evaluation framework proposed in our previous work [18] helps to demonstrate the status quo of the LCC practice between different cities, but not reflect adequately the capacity and efforts of local governments to develop of low-carbon cities. Thus, the application of the assessment framework is virtually a ‘one-size-fits-all’ approach, which undermines the efforts invested by those cities with inferior endowments in promoting low-carbon cities. In the context of the above literature review, this paper attempts to improve the assessment accuracy by applying a correction factor in the evaluation of LCCP.

3. Materials and Methods

As argued in the introduction section, the purpose of applying a correction factor is to mitigate the ‘one-size-fits-all’ phenomenon in assessing low-carbon city performance. The development of this correction factor will be based on our previous work [18], which introduces an indicator system from a dimension–process dual perspective. From a dimensional perspective, there are eight dimensions for investigating a city’s LCCP; namely, Energy structure (En), Economic development (Ec), Production efficiency (Ef), Urban population (Po), Water (Wa), Forest (Fo), Green Space (GS), and Low-carbon technology (Te). From the process perspective, the process management principle is employed for examining a city’s LCCP, by which a five-process framework is built, including Plan, Do, Check, Outcome, Act (PDCOA). The five processes exhibit how a certain level of LCCP is achieved through a chain of management processes. Accordingly, a dual perspective assessment matrix including eight dimensions and five processes is formulated, as shown in Table 1. Each matrix cell includes several assessment indicators and executive indicators. The hierarchical structure of the index system can be seen in Figure 1. The details of the LCCP calculation model and its application can be found in our previous published work [18].

3.1. Correction Factors

Considering that cities have different endowment conditions in the social, economic, and natural resources dimensions, the results of assessments of LCCP across the eight dimensions should be modified by applying different correction factors according to the specific endowment characteristics of individual LCCP dimensions. These endowment characteristics are discussed as follows:
“The proportion of fossil energy in primary energy consumption” (KEn): As the goal of low-carbon development in the En dimension is to transform traditional energy into clean energy by adjusting the energy consumption structure, effective reduction of greenhouse gas emissions is a key measure. The proportion of non-fossil energy in primary energy consumption is a binding development indicator adopted in the 13th and 14th Five-Year plans by most provinces and cities in China. However, the complexity of the energy structure transition is mainly due to the current dependence of cities on traditional energy sources. KEn is confirmed as the endowment characteristic index.
“Carbon emission per unit of GDP” (KEc): The goal of low-carbon development in the Ec dimension is to decouple economic growth from carbon emissions so as to achieve a slow or even zero growth of carbon emissions whilst continuing economic growth [25]. The dependence of urban economic growth and industrial structure on high-carbon industries (carbon intensity) makes it difficult for cities to carry out low-carbon development in the Ec dimension on the current basis. Therefore, KEc is selected as the urban characteristic index of the Ec dimension.
“Total factor productivity” (KEf) is selected as the urban characteristic index of the production efficiency dimension. The objective conditions of a city in terms of production efficiency are mainly reflected in the technical conditions and levels of production under various factor combinations.
“Average schooling years” (KPo): The goal of low-carbon development in the Po dimension is to make more people switch to a low-carbon lifestyle. The willingness for a low-carbon lifestyle is influenced by various factors, of which education level is most significant. A study by Jing [26] showed that the higher a person’s education level, the more willing they are to choose a low-carbon lifestyle. Therefore, KPo is adopted as the characteristic index of this dimension.
“Annual rainfall” (KFo) is chosen as the endowment characteristic index of the forest carbon sink dimension. Forest can enhance carbon sequestration capacity. However, forest development is related to natural climate conditions such as temperature, atmosphere, and rainfall. The “Indicator for National Forest City”, the PRC national standard proposed by the National Forestry and Grassland Administration, sets different benchmark requirements of forest coverage rate for cities in China under different annual precipitation conditions, which indicates the importance of annual precipitation to forest development [27].
Similar to the forest carbon sink dimension, green space is vital to protecting and improving the growth and survival of vegetation, thus enhancing carbon sequestration. and the urban objective conditions affecting them are similar. “Annual rainfall” is also the characteristic index of the green space dimension, denoted as KGS.
“The number of invention patents per 10,000 people” (KTe) is adopted as the characteristic index for the Te dimension. This index indicates the capacity of cities to develop and apply low-carbon technologies, thus representing the endowment characteristic of cities in the Te dimension.
Based on the above discussion, Table 2 summarizes the endowment characteristics and the corresponding index (K) under each dimension of LCCP. The value of the correction factor (α) in each dimension should be based on the value of K. The value of α can be negative or positive, where a positive factor means that the larger the K value, the larger the α value should be, and a negative factor, in contrast, means that the larger the K value, the smaller the α value should be. For example, a higher KEn value (proportion of fossil energy consumption in primary energy consumption) indicates significant challenges for a city in transitioning from traditional to clean energy sources. This greater reliance on fossil fuels necessitates additional time and effort from both municipal authorities and residents to shift towards a more sustainable energy structure, compared to cities with a more advantageous energy mix. Consequently, such cities receive a higher correction factor ( α E n ) in the assessment of their low-carbon performance. Accordingly, the  α E n  is considered as a positive index, and the factor type is denoted by a symbol of “+” in Table 2.
Furthermore, it is considered that only the process variables P and O will be affected by urban endowment characteristics. Therefore, correction factors are only applied to the two process variables. In considering P, as LCC strategies are planned in line with the urban characteristic conditions of a city, thus the assessment results on P should be corrected. Gaps exist between cities in terms of low-carbon plan contents and their current development status, as well as the historical foundation of the cities. These gaps will in turn affect the LCCP of individual cities. On the other hand, these planning gaps cannot be bridged by efforts from local governments. So, it is important to introduce a mechanism to mitigate the influences of the gaps on the assessment of LCCP. For the process variable “O”, the effect of urban characteristic conditions on the value of LCCP outcome is obvious. For example, resource-based cities have relatively higher dependence on coal and other fossil fuels in comparison to other types of cities such as tourist-based cities. The resource-based cities are in a more difficult position for achieving an optimal low-carbon energy structure even though they can produce effective energy transformation plans. Therefore, when evaluating LCC performance by governments between cities, it is necessary to adopt a correction coefficient to mitigate the influence of the characteristic conditions on the calculated value of the process variables P and O. For the process variables of D, C, and A, management activities in these processes mainly carried out according to the specifications formulated in the plan strategies, and the endowment conditions of the cities, have little influence on these process variables. Therefore, the correction coefficient is not applicable to the process variables D, C, and A.

3.2. Calculation Model for Correction Factors

According to the rationale discussed in Section 1, those cities in the position of having favorable characteristic conditions should be assigned with a correction coefficient with a value of less than 1, and those cities with unfavorable characteristic conditions should be assigned a correction coefficient with a value of greater than 1. The value calculation of the correction coefficient for a specific city j in LCC dimension Di can be conducted with the following Formulas (1) and (2):
α D i · j = l n K D i · j M e d i a n ( l n K D i )     ( for positive factor )
α D i · j = M e d i a n ( l n K D i ) l n K D i · j     ( for negative factor )
where  α D i · j  denotes the correction coefficient applicable for city j in LCC dimension Di, and  K D i · j  denotes the value of endowment characteristic K of the city j in LCC dimension Di. The  M e d i a n ( l n K D i )  denotes the median value of  l n K D i · j  among all sample cities in LCC dimension Di. It is worth noting that the value of  K D i · j  in some dimensions may be less than the natural logarithm (e), in which case the logarithm result will be negative. Therefore, for such dimensions, before logarithmic processing, we will multiply  K D i · j  of all cities by an integer (10, 100, or 1000) to ensure the result of  l n K D i · j  is positive.
Based on the calculation results in Formulas (1) and (2), the corrected value for both the overall LCCP and dimensional LCCP can be further obtained by using the following formula:
V D i = V D i j 5 = α D i V D i P + V D i D + V D i C + α D i V D i O + V D i A 5
V = V D i 8 = V E n + V E c + V E f + V P o + V W a + V F o + V G S + V T e 8
where  V  denotes the pre-corrected value of the overall LCCP performance and  V D i  denotes the pre-corrected value of dimensional LCCP. The pre-corrected LCCP can be calculated according to the index system and calculation model developed by Shen et al. [18].  V  denotes the corrected value of the overall LCCP performance, and  V D i  denotes the corrected value of dimensional LCCP.

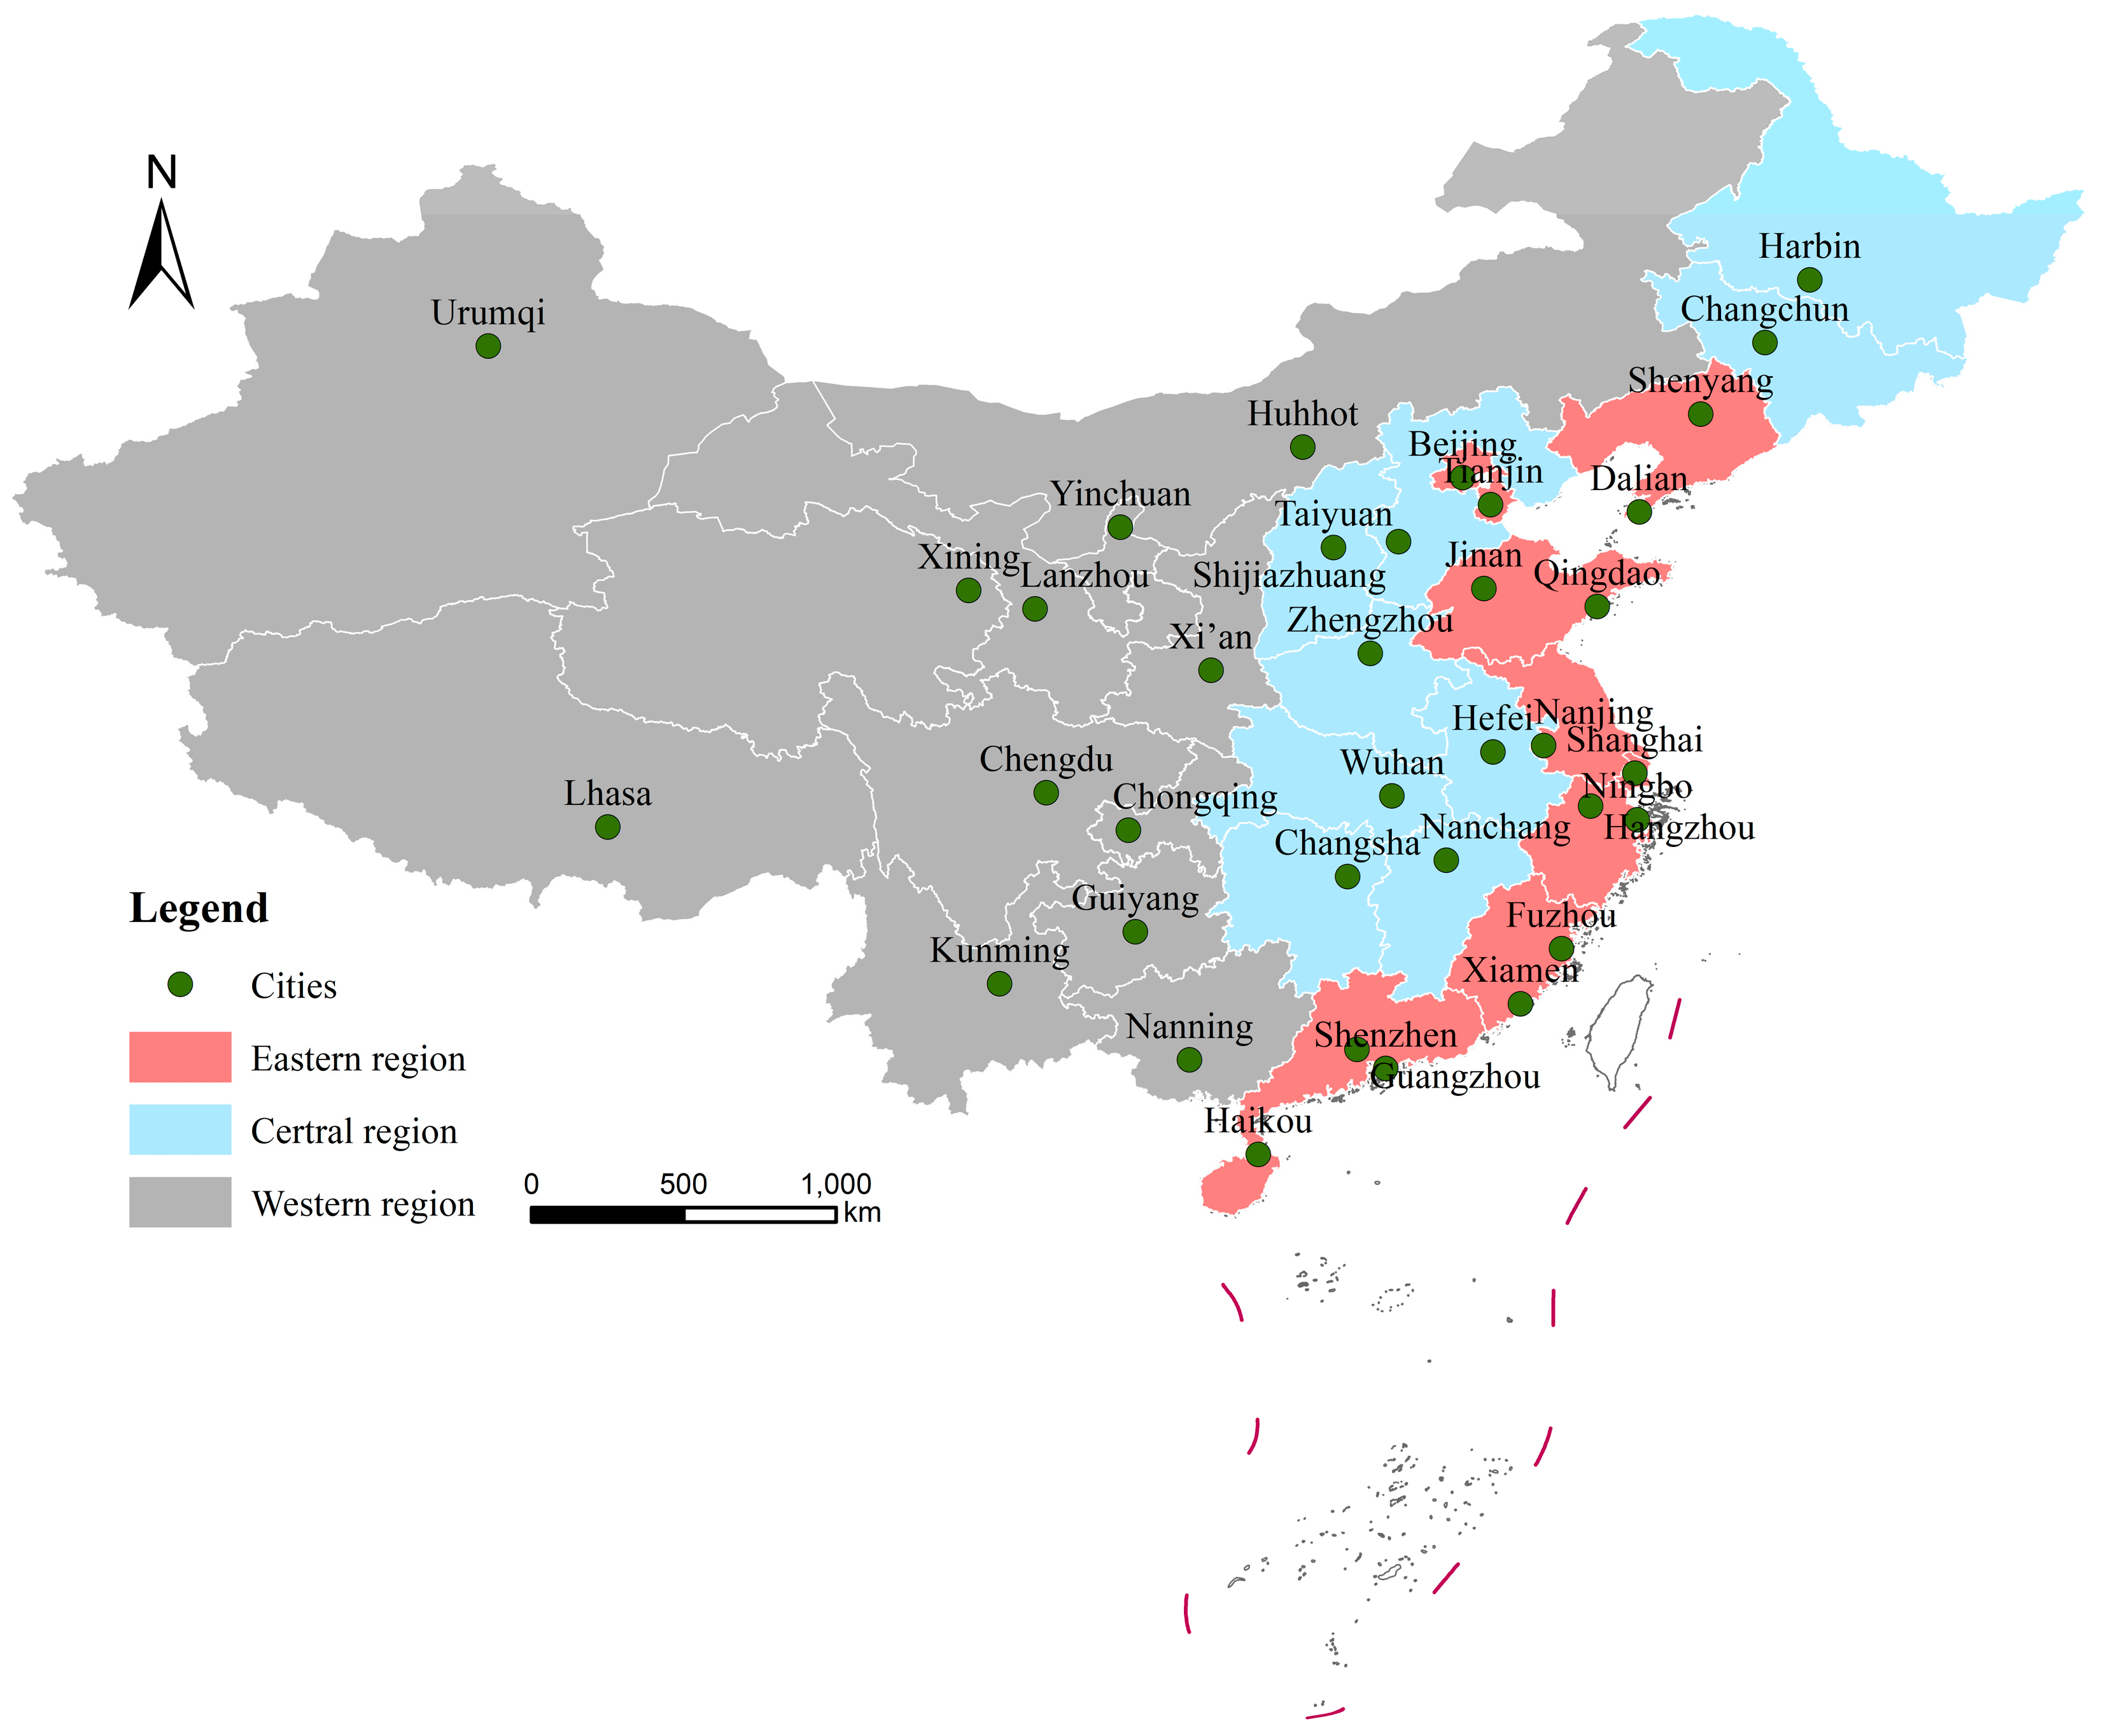
4. Empirical Studies

This section will demonstrate the application of the methodologies established in the previous section by referring to 36 major cities in China. These cities are all provincial capital cities or sub-provincial cities in China, which are the political, economic, and cultural centers at the provincial level [28]. The location details of these sample cities can be seen in Figure 2.

4.1. Executive Indicators

In referring to the dimension–process dual perspective indicator system (Table 1), eight dimensions and five processes make up the evaluation matrix covering 40 assessment cells. Each evaluation cell includes several assessment indicators, and each assessment indicator includes several executive indicators, forming the indicator system hierarchy, as shown in Figure 1. Considering the limitations of page space, only the assessment indicators under the energy structure dimension are presented, as shown in Table 3. Finally, each executive indicator will be specified, with scoring criteria and scoring rules for enabling the calculation of LCCP value. Table 4 shows a sample of the scoring criteria and scoring rules for qualitative and quantitative executive indicators. The assessment indicators, executive indicators, scoring criteria and scoring rules are determined through literature and policy review. Detailed information can be found in our previous study [18] and the published book on low-carbon city performance in China written by the research team [29].

4.2. Assessment Results

Table 5 shows the data sources for the characteristic index (K) variables (see Table 1). Table 6 shows the original data for K for the sample city. By applying the data to Formulas (1) and (2), the values of the correction factors (α) are calculated, as shown in Table 7.
As observed in Table 7, from the dimension perspective, the correction coefficient for the energy structure dimension (αEn) exhibits the widest value spread, extending from 0.81 to 1.33. Conversely, the coefficient for population (αPo) demonstrates the narrowest range, varying only from 0.98 to 1.03. This indicates that the endowment of “Proportion of fossil energy consumption in primary energy consumption” in the 36 cities differ greatly, but there is only a small difference in the index of “Average schooling years”.

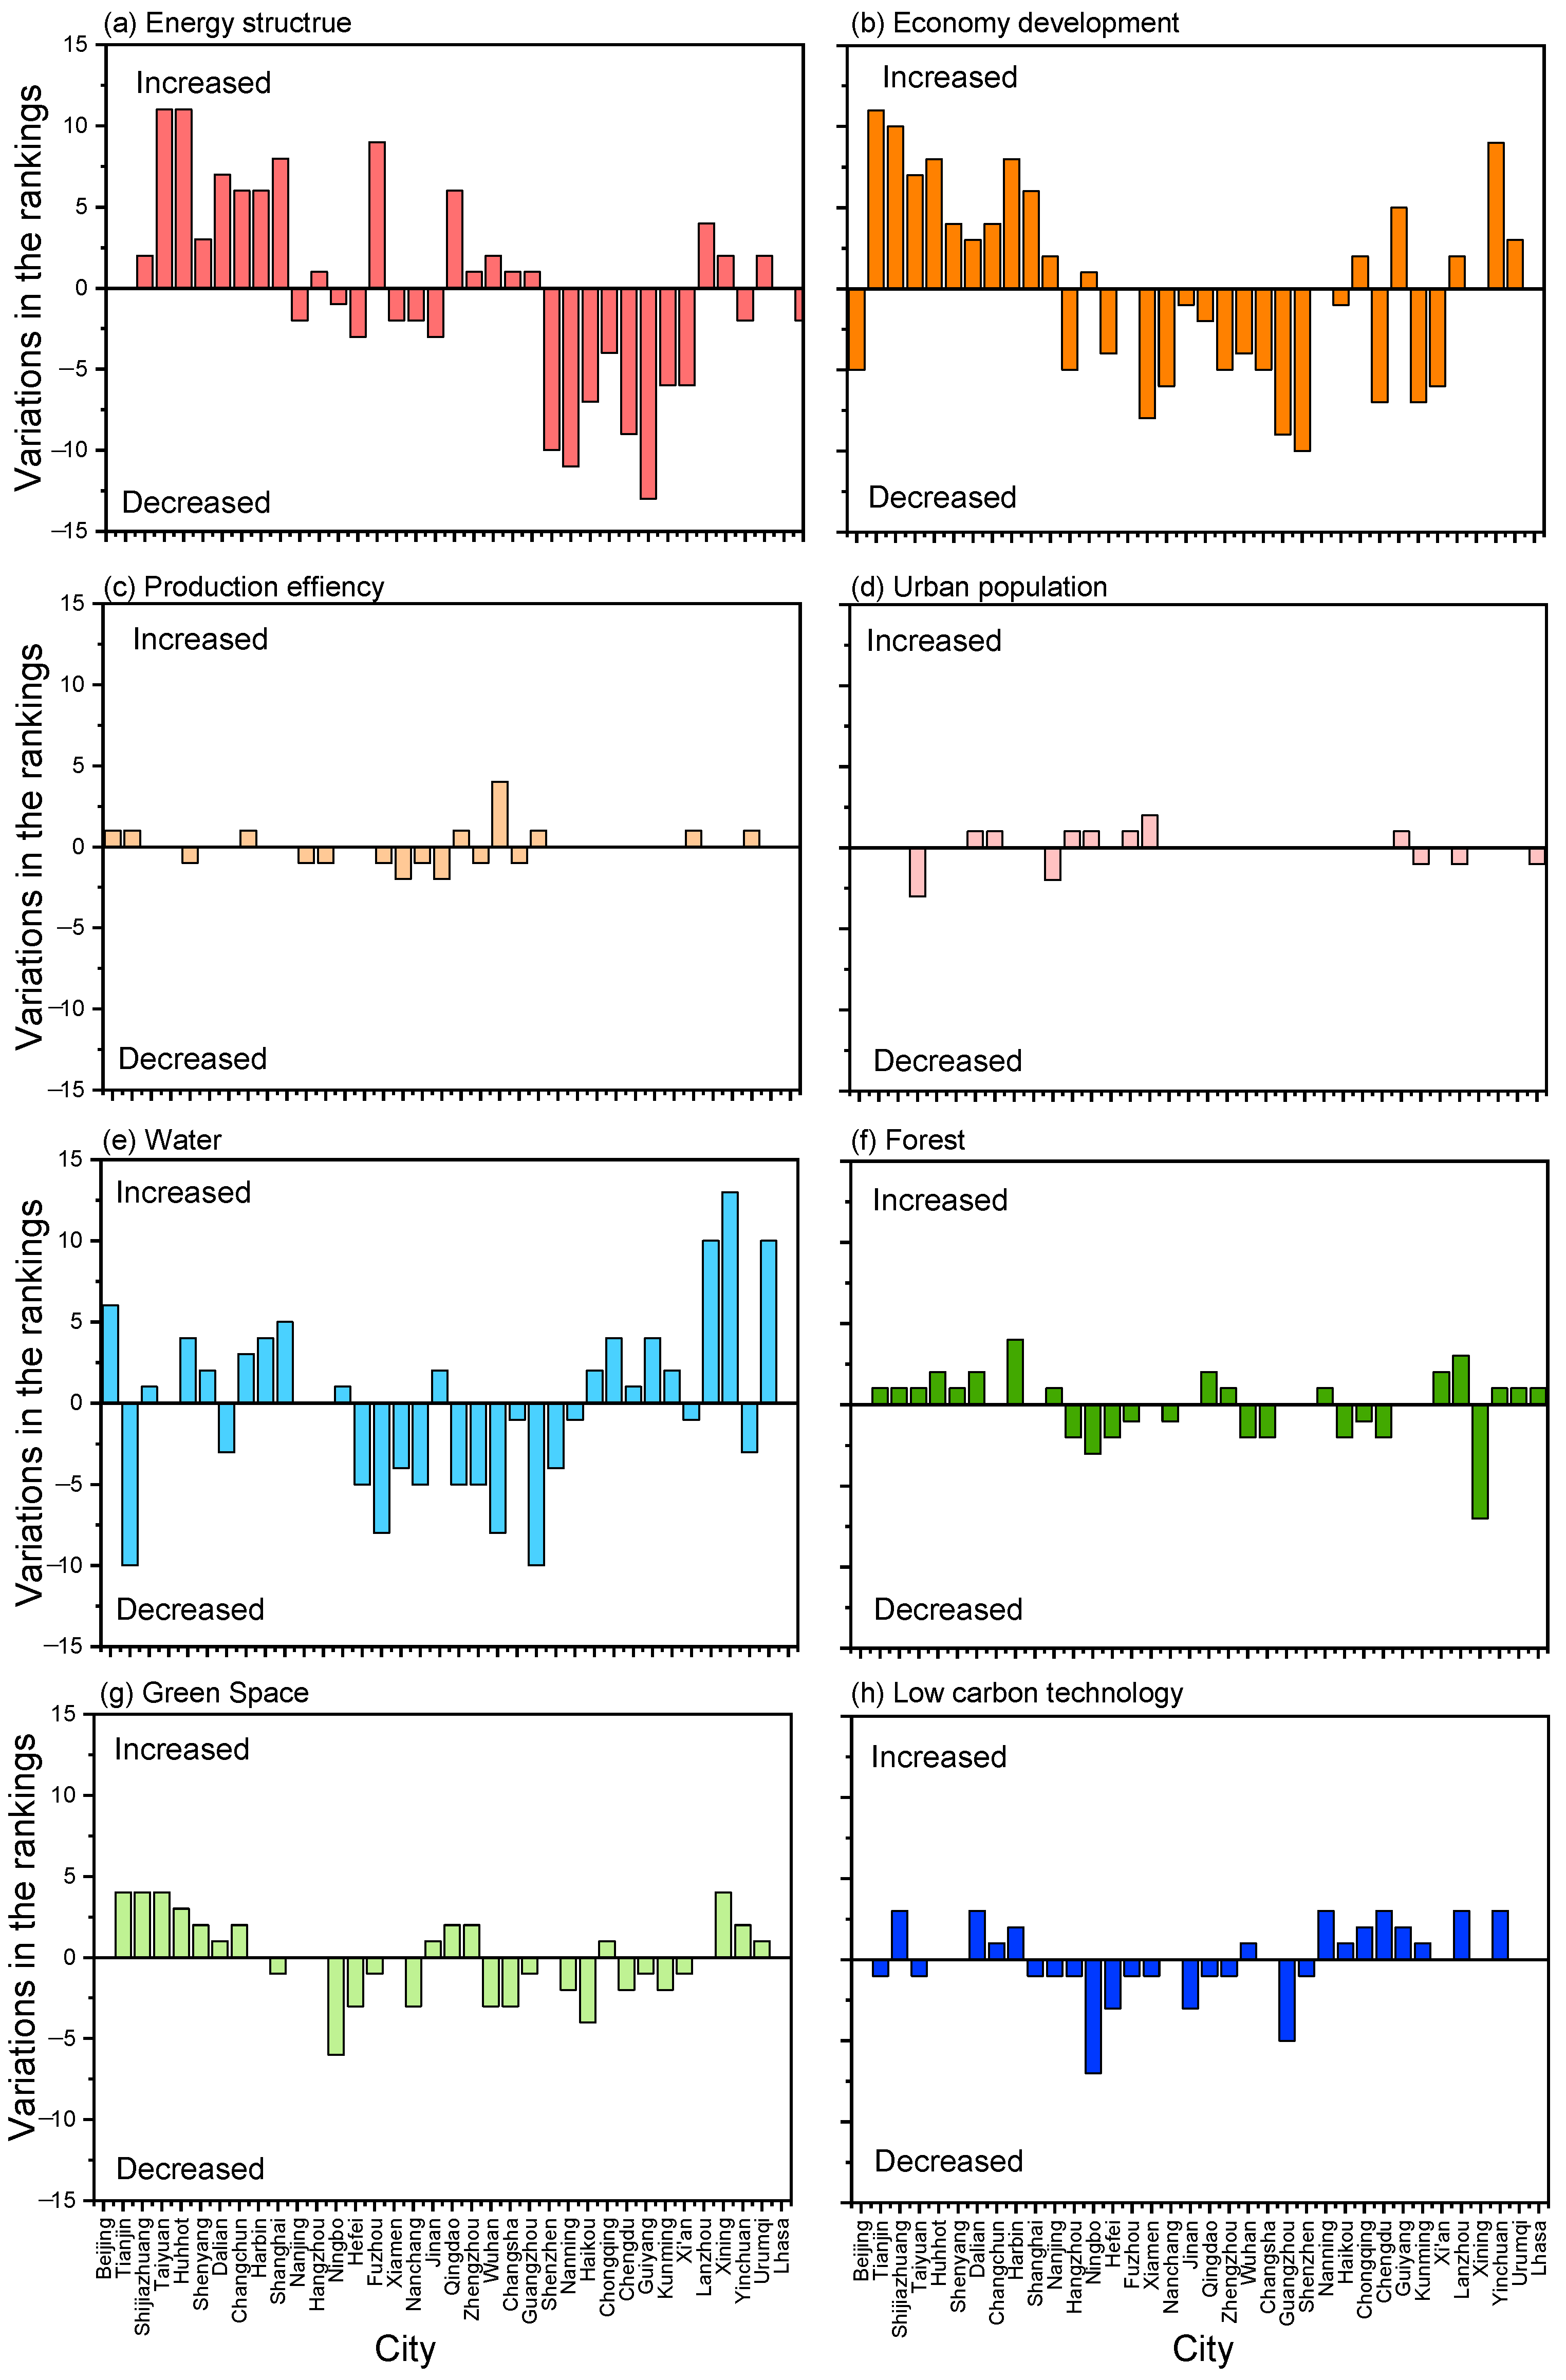
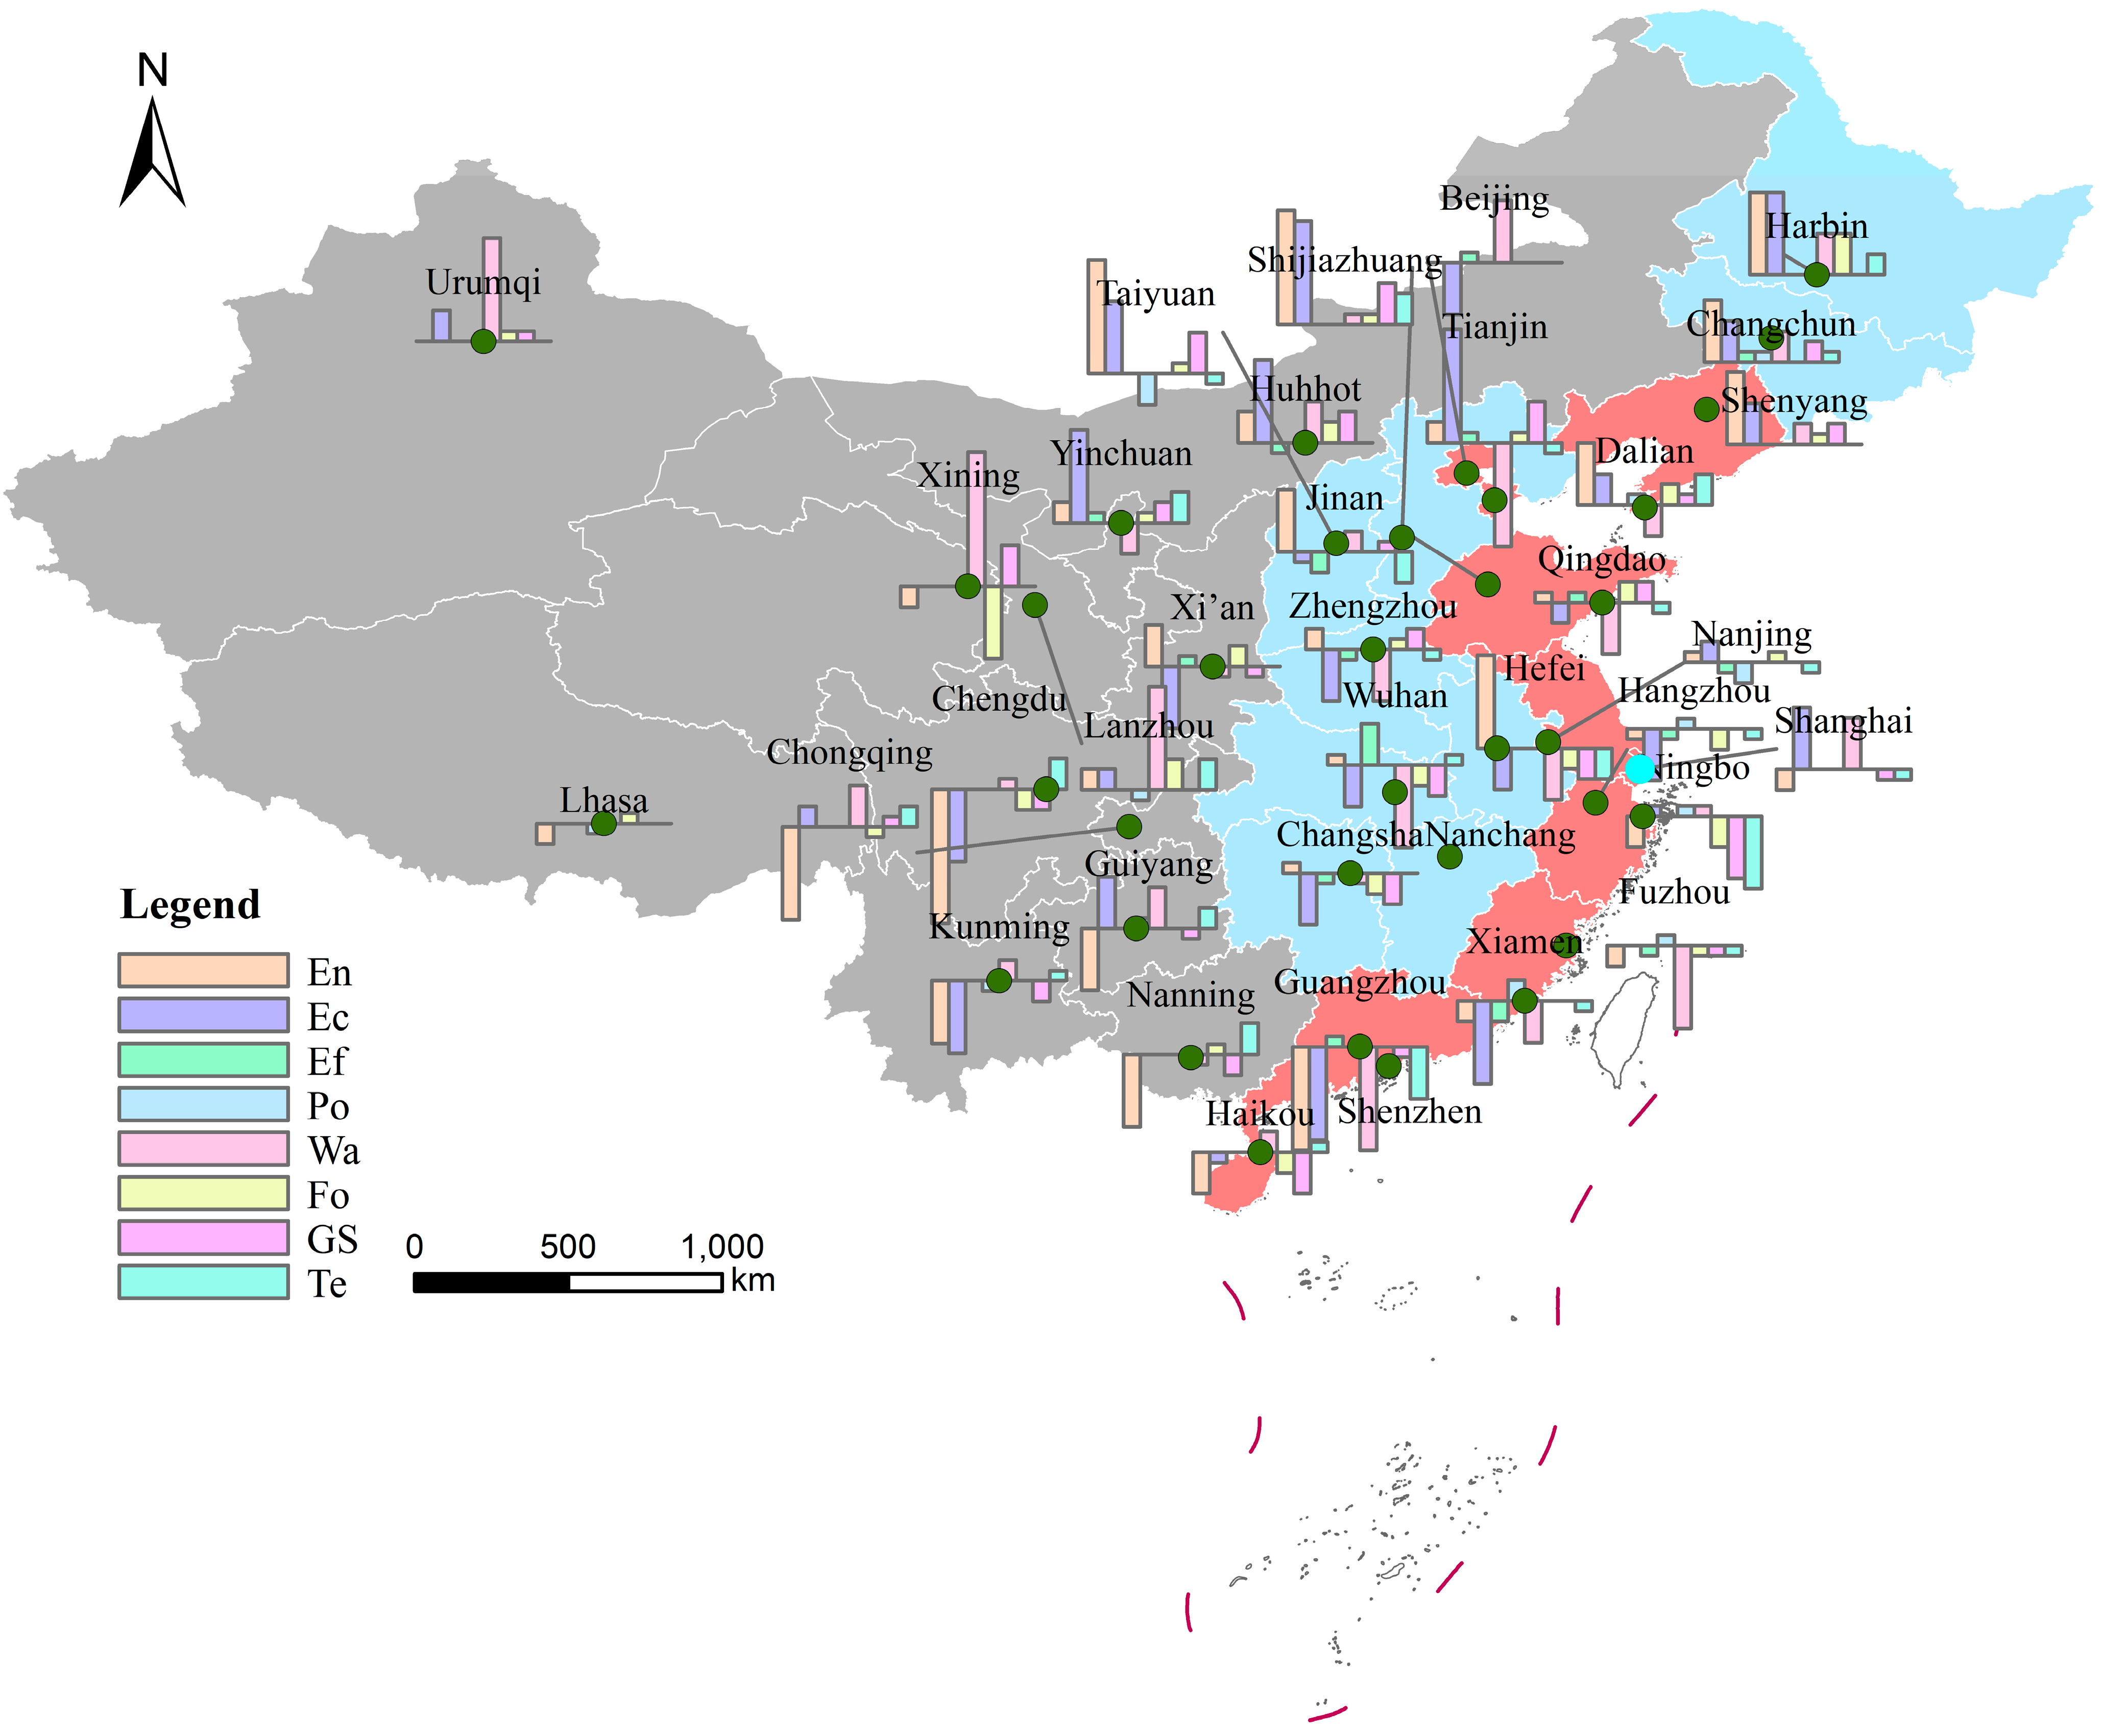
4.2.1. Dimensional Differences between the Pre- and Post-Corrected LCCPVs

Data for the executive indicators in Table 3 and Table 4 were further collected. The methodology used for processing the data and assessing LCCPVs before correction is the same as the methodology we introduced in our previous work [18]. Then, the corrected LCC performance values (LCCPV′s) were calculated by adopting Formula (3) based on the original LCCPVs and the established α values in Table 7. The results for the eight dimensions before and after correction are shown in Table 8, and the variations in the LCCPV rankings under the eight dimensions of the 36 cities are further highlighted in Figure 3.
It can be seen in Table 8, from the dimensional perspective, that the correction coefficient has little effect on the mean change, and the largest change in the mean value is in the dimension of energy structure, with the average score changing from 49.54 to 50.28. Table 7 also shows that applying the correction coefficient reduces the value of the coefficient of variation (CV) in the dimensions of Ec, Wa, and Te, but increases the value of CV in the En dimension. Furthermore, the four dimensions (Ef, Po, Fo, and GS) have no significant change in the value of CV.
Table 8 and Figure 3 further show that the ranking variations are significantly different among the eight dimensions. The most significant improvement in the LCCPV rankings was observed in Xining under the Wa dimension, with an improvement from ranking 32 to 19, whereas the biggest decline was for Chengdu under the En dimension, with the ranking decreasing from 9 to 22.
It is interesting to note under the En, Wa, and Fo dimensions, many sample cities obtained higher LCCPV rankings after being corrected. Meanwhile, under the Ef and Po dimensions, 52.8% and 66.7% of sample cities had consistent LCCPV rankings, which were unchanged after correction. However, for the Ec, GS and Te dimensions, the number of cities which obtained higher (16, 14, and 13) and lower (16, 14, and 14) LCCPV rankings were similar. This indicates that there were no obvious trends in the LCCPV ranking variations for these three dimensions.
From the perspective of cities, Guangzhou and Lhasa had the biggest and smallest adjustment variations of their LCCPV rankings for the eight dimensions. The ranking variations of Guangzhou under the eight dimensions were −10, −9, 1, 0, −10, 0, −1, and −5, respectively, and those for Lhasa were −2, 0, 0, −1, 0, 1, 0 and 0, respectively.

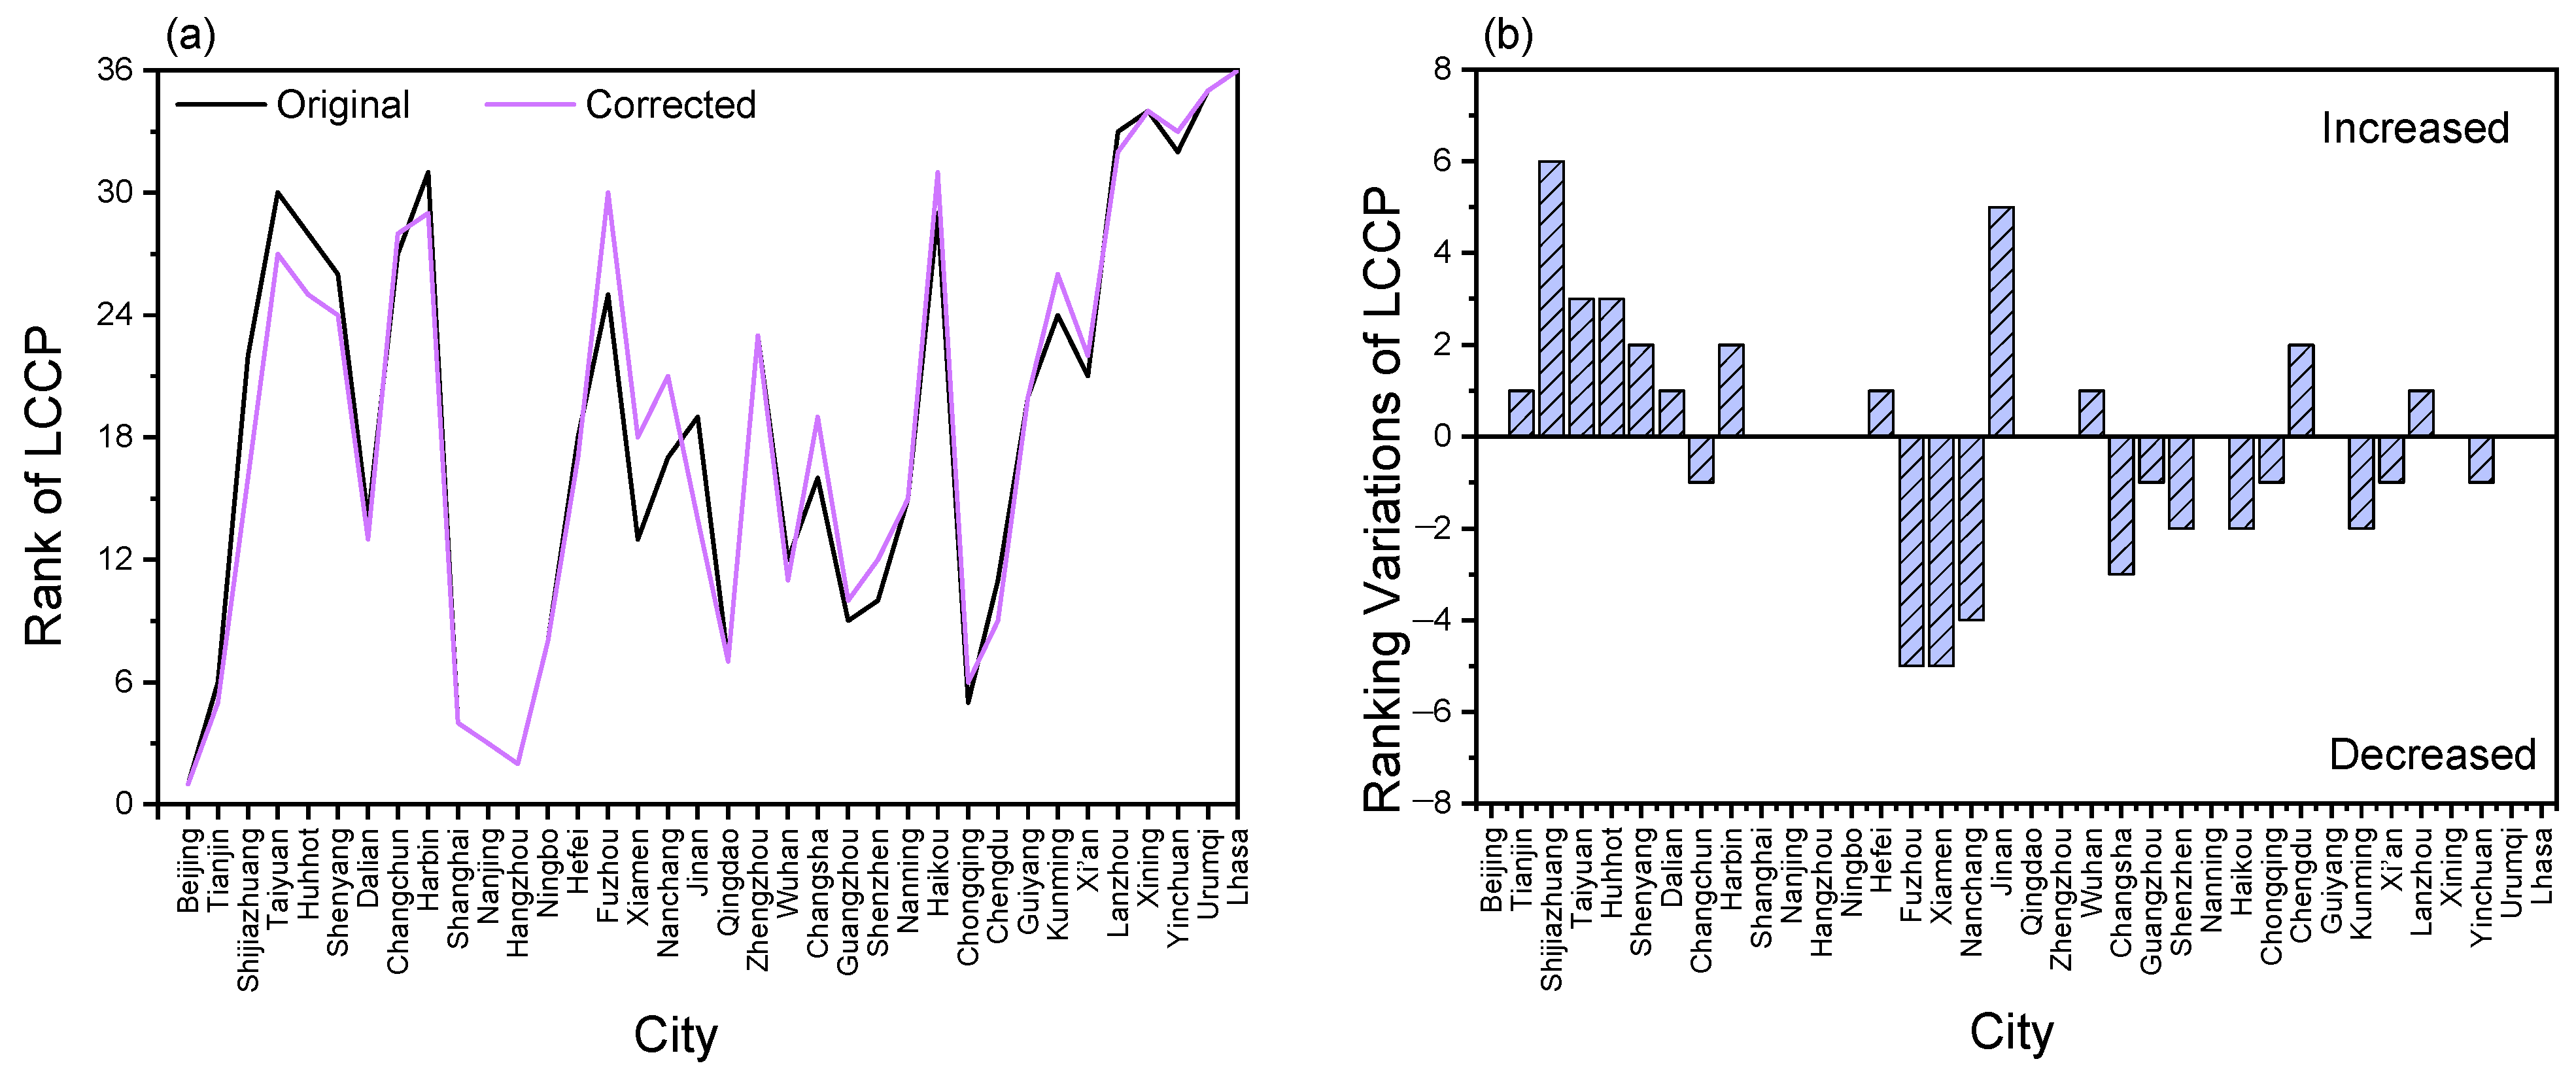
4.2.2. Overall Differences between the Original and Corrected LCCPVs

Based on the pre- and post-corrected results for the eight dimensions in Table 8 the overall rankings of the 36 cities before and after correction were calculated by adopting Formulas (4) and (5), respectively. The results are displayed in Table 9, which are also presented graphically in Figure 4.
It can be seen in Table 9 and Figure 4 that the most significant variation in the overall LCCPV rankings was observed in Shijiazhuang, which improved from 22 to 16. The largest declines in rankings occurred for Fuzhou and Xiamen, which changed from positions 25 to 30, and 13 to 18, respectively. It is worth noting that Beijing, Shanghai, Hangzhou, Nanjing, Ningbo, and other cities did not change positions; these cities have always maintained a relatively good ranking. This shows that our correction factor will not make a huge difference to the results, but it can make the results more objective and fairer to some extent.

5. Discussion

5.1. Application of Correction Factors in the Assessment of Low-Carbon City Performance (LCCP)

In this study, a correction factor is employed to the process variables P (Plan) and O (Outcome) to the assessment of urban low-carbon city performance, so as to obtain a more just assessment ranking between cities. The planning for low-carbon development is affected by many attributes, such as economy, population, climate, industrial structure, etc. [33,34]. As cities are different in these attributes, the contents and quality of their plans will be different. For example, Hu and Fan [35] pointed out that China’s urban expansion has a positive impact on energy consumption, so urban energy planning was often positively correlated with city size, so it is unfair to ignore objective factors and adopt the same assessment criteria for energy planning with all cities. Similarly, as the main source of CO2 absorption in the field of carbon sinks, the scale of forests in cities needs to be considered in light of the limitations of natural factors, such as precipitation and temperature [36]. So, the assessment of the low-carbon performance levels of cities in the forest dimension needs to consider the climate conditions.
For example, on the original LCCP value in this study, Jinan was ranked 19th among the 36 cities. After introducing the correction factor, the corrected LCCP value of Jinan is ranked 14th. In contrast, Jinan received a relatively low ranking in other low-carbon city evaluations. In the evaluation of the development of low-carbon cities in China which was carried out by Zhuang [23], Jinan ranked 50th among 70 pilot cities. In the evaluation study by Zhang et al. [21], Jinan ranked 52nd among 110 cities, even ranking behind many third- and fourth-tier cities. However, Jinan’s performance in the development of low-carbon cities was reported to be very good. Gao et al. [37] indicated that Jinan is one of the 15 cities which have implemented special LCC programming integrating low-carbon concepts into the whole process of urban planning, construction and management. In the technology promotion mechanism of low-carbon cities, Jinan encourages enterprises to apply for national key low-carbon technologies and products to improve their industrialization capabilities. On the other hand, emission reduction technologies are supported by all stakeholders, with wide application. It was reported that Jinan has broken down its carbon emission intensity reduction target into discrete levels. A series of low-carbon initiatives have been made in Jinan City, contributing to the receipt of the highest grade of “excellent” in the national low-carbon city pilot evaluation [38]. This is echoed by our corrected value for Jinan, which more accurately reflects the real LCCP contributed by the efforts of Jinan city’s government and citizens.
As another example, the LCCP value of Shijiazhuang in the En dimension was originally ranked 21st. After the application of the correction factor, the LCCP rank of this city in the En dimension increased to 10th. Shijiazhuang is an energy production city. Its energy structure cannot be adjusted by the local government. In fact, this city has devoted considerable efforts to promoting LCCP by issuing a series of planning documents such as the “carbon peaking implementation plan” and the “scientific and technological support carbon peaking and carbon neutral implementation plan”. Shijiazhuang even issued the “Shijiazhuang Low-carbon Development Promotion Regulations” in 2023, to ensure the implementation of low-carbon measures by making them regulatory requirements. These measures have enabled Shijiazhuang to successfully meet its provincial assessment targets in the context of a large energy consumer. The corrected ranking value for this city more fairly reflects the efforts of its government.
This study also adjusted the O process variables. The outcomes of urban low-carbon development are often limited to various objective factors. Cities or countries with better endowments of natural resources are in a better position to achieve good low-carbon performance. Conversely, cities with higher industrial dependence or greater energy consumption face greater challenges in pursuing low-carbon development paths [39]. According to Lou et al. [40], the trajectory of urban low-carbon and sustainable development was susceptible to influences from factors such as the industrial sectors and energy consumption. Bridge et al. [41] also revealed that during the implementation of urban low-carbon transformation, incorporating considerations of regional specificity, spatial disparities, and scale can enhance the credibility of the assessment results. The findings of this study indicated that without correction factors, cities with higher industrial reliance, such as Shijiazhuang and Jinan, would exhibit relatively low levels of low-carbon development. Therefore, while the outcomes demonstrated the effectiveness of urban low-carbon development, they were impacted by multiple objective factors; thus, correction factors must be applied to ensure fairness and objectivity in conducting urban low-carbon assessments.
The performance of urban low-carbon development is influenced by both carbon sources and sinks, and these two primary fields encompass diverse dimensions. Therefore, it is essential to adopt correction factors for different dimensions. By introducing these correction factors, we can tailor the adjustments according to the specific characteristics of each city; thus, better reflecting their low-carbon transformation potential. The assessment method based on correction factors assists decision-makers in understanding the low-carbon performance of each individual city and identify existing issues and challenges.
However, when using correction factors for assessing low-carbon city development, several potential limitations and challenges need to be considered. Firstly, determining the appropriate correction factor relies on sufficient data support and adequate analytical methods. Secondly, the selection and weighting of correction coefficients involve subjectivity, and incorporation of expert opinions and relevant research are necessary to ensure objectivity and fairness. Thirdly, the application of correction coefficients may require continuous updates and adjustments to adapt to the dynamic changes and emerging challenges in low-carbon urban development in different cities.

5.2. The Effect and Significance of Correction Factor

Our study integrates correction factors into the evaluation process of low-carbon performance across various cities, offering a nuanced assessment beyond conventional methodologies. This approach not only refines the public’s understanding of each city’s low-carbon efforts but also aids policymakers in crafting more targeted, effective strategies for improving their LCC performance.
The dimensional results of empirical case studies, as shown in Table 8 and Figure 3, present the scores and ranks between the pre- and post-corrected LCCPVs. In order to explore whether these results reveal patterns of change, we plotted the change in ranks before and after correction for the eight dimensions on the map of China, as shown in Figure 5.
Figure 5 presents several compelling findings in highlighting the sensitivity of the dimensions of energy structure (En), economic development (Ec), and water carbon sink (Wa) in relation to the ranking changes in cities’ LCC performance between pre- and post-correction.
Firstly, Figure 5 presents the findings graphically indicating that in the energy structure (En) dimension, the application of correction coefficients leads to significant ranking changes for different types of cities. Cities in the southeast coastal area (such as Shanghai, Hangzhou, and Xiamen) with geographical advantages have more diversified energy structure and higher usage of quality energy carriers like electricity and oils [42]. And cities in the northwest region (such as Urumqi, Xining, and Lhasa) have rich, renewable energy resources such as hydroelectric, wind, and solar energy [43], which have benefited from the geographical advantages as they located in vast plateau areas. It is relatively easy for those cities with advantageous energy endowment to transform energy structure in promoting low-carbon city performance. Therefore, those cities have been adjusted to a lower ranking in terms of LCCP in this study by adopting a correction factor. For instance, the performance ranking in the En dimension for the cities of Shanghai and Xining have been changed from Nos. 3 and 34 to Nos. 5 and 36 (see Table 8), respectively. In contrast, the rankings of LCCP in the En dimension for those cities which are characterized with rich fossil energy resources have been adjusted to higher grades, as they require more investment and time to improve their urban energy system and infrastructure. Those cities are typically located in the central–north region of China. For example, the cities of Taiyuan and Shijiazhuang, which are typical coal cities [42,44], were ranked 19th and 21st, respectively, before the application of the correction factor, but were adjusted to the rankings of 8th and 10th after the correction. The above discussions show that the consideration of different types of energy endowment by applying the correction factor can properly reflect the performance ranking when evaluating a city’s LCC performance.
Secondly, it can be seen in Figure 5 that the LCC performance rankings of the cities which have different socioeconomic contexts have been adjusted after applying the correction factor. The cities located in north China are traditionally either heavy industry-based (such as Harbin, Changchun, and Shenyang) [45,46] or coal industry-based (such as Taiyuan, Yinchuan, Huhhot, and Urumqi) [47]. They will naturally generate more carbon emissions when conducting their economy-driving activities, and their ranking performance will be lower with traditional assessment methods. In fact, the local governments in these cities have been contributing considerable efforts to promoting low-carbon economic activities, and their efforts will not be recognized without applying the correction factor. For example, the government of the Harbin city is endeavoring to establish a contemporary industrial system by prioritizing economic sectors such as green agricultural product processing, advanced equipment manufacturing, modern biomedicine, and cultural and tourism industries with distinctive characteristics [48,49]. These initiatives are producing good results, evidenced by the burgeoning ice and snow tourism industry in Harbin last winter [50]. Taiyuan is diversifying its economic landscape by promoting industries beyond coal, while Huhhot is investing in the development of high-tech sectors, such as the cloud computing industry, to facilitate economic transformation and industrial advancement [51]. By applying the correction factor in this study, the LCC performance rankings in the Ec dimension for the three cities (Harbin, Taiyuan, and Huhhot) have been adjusted from 20th, 25th, and 30th, to 14th, 18th, and 22nd, respectively. This shows that the consideration of different economic contexts by adopting the correction factor has provided a more accurate profile of cities’ LCC performance in the dimension of economic development.
Thirdly, in referring to the dimension of water carbon sink (Wa), the LCC performance rankings of different cities characterized by different water resource endowments showed notable changes before and after the application of the correction factor. For example, the cities located in northwest China, such as Urumqi, Lanzhou, and Xining, traditionally lack water resources [52]. Their ranking performance in this dimension (Wa) was evaluated with low grades without the application of correction factor. In fact, the governments in those cities have been investing management efforts in developing water carbon sink ability by creating an artificial desert oasis [53], artificial wetland [54], etc. A study conducted by Bu et al. [55] highlights the positive impacts of creating artificial wetland areas on enhancing carbon sequestration capabilities. These management efforts by government would not be apparent without applying correction factor. In line with this consideration, the LCCP performance rankings in the Wa dimension in these cities (Urumqi, Lanzhou, and Xining) have been improved by using the correction factor from numbers 31, 32, and 34 to numbers 21, 19, and 24, respectively. Again, the above discussions show that the consideration of the endowment of different water resources by applying the correction factor can produce more appropriate evaluation of a city’s LCC performance in the dimension of the water carbon sink.

6. Conclusions

The evaluation of low-carbon cities (LCC) has emerged as a pivotal aspect of sustainable urban development, eliciting substantial interest and attention across academia, industry, and government sectors. However, existing studies on low-carbon city performance (LCCP) evaluation ignore the effects of socioeconomic and natural endowments on the LCC evaluation, resulting in an inaccurate reflection of LCCP contributed by local governments and citizens. This study extends the research teams’ previous study on developing a dual perspective diagnosis method for evaluating LCCP to introducing a correction factor in order to mitigate the ‘one-size-fits-all’ phenomenon in comparing the results of LCCP assessments between cities. Our comprehensive analysis of 36 Chinese cities demonstrates the practical application and effectiveness of correction factors, showcasing how they contribute to a more nuanced understanding of LCC achievements in different cities.
The correction factor emerges as pivotal tool in ensuring the proper evaluation of the LCC performance achieved in cities which have distinct characteristics. This methodological advancement facilitates a more inclusive approach to evaluating and recognizing the diverse paths cities undertake towards low-carbon practice.
However, the application of correction factors has several limitations and challenges. Firstly, determining the appropriate correction factor is contingent upon the availability of comprehensive data and the application of robust analytical methods. Secondly, the process of selecting indexes for calculating correction coefficients inherently involves subjective judgment. To mitigate this, the integration of expert opinions and a thorough review of relevant research are important for upholding the principles of objectivity and fairness. Thirdly, the dynamic nature of urban development and environmental challenges necessitates the continuous refinement and adjustment of correction coefficients for ensuring that these coefficients remain relevant and effective in capturing the evolving contexts of low-carbon urban development across different cities.
Our findings advocate for tailored assessments that can recognize and reward genuine efforts by local government towards low-carbon city performance. This research lays a foundation for further exploration into the application of correction factors in different contexts of research. Moving forward, this study invites a deeper investigation of correction factors in order to enrich our understanding of low-carbon city strategies and policies and consequently contribute to a more sustainable and equitable future.

Author Contributions

Conceptualization, L.S. and H.B.; methodology, S.L. and X.C.; supervision, L.S. and H.B.; validation, X.X., Q.W. and Z.C.; visualization, S.L. and Q.W.; writing—original draft preparation, S.L., X.C. and X.X.; writing—review and editing, X.C. and Z.C. All authors have read and agreed to the published version of the manuscript.

Funding

This research was funded by the Open Fund 2023 (214000-581827/008) of the Research Institute for Urban Planning and Development, Hangzhou City University.

Data Availability Statement

The original contributions presented in the study are included in the article, further inquiries can be directed to the corresponding author.

Conflicts of Interest

The funders had no role in the design of the study; in the collection, analyses, or interpretation of data; in the writing of the manuscript; or in the decision to publish the results.

References

  1. Diffenbaugh, N.S.; Burke, M. Global warming has increased global economic inequality. Proc. Natl. Acad. Sci. USA 2019, 116, 9808–9813. [Google Scholar] [CrossRef] [PubMed]
  2. Mora, C.; Dousset, B.; Caldwell, I.R.; Powell, F.E.; Geronimo, R.C.; Bielecki, C.R.; Counsell, C.W.; Dietrich, B.S.; Johnston, E.T.; Louis, L.V.; et al. Global risk of deadly heat. Nat. Clim. Chang. 2017, 7, 501. [Google Scholar] [CrossRef]
  3. Agreement, P. Paris agreement. In Proceedings of the Report of the Conference of the Parties to the United Nations Framework Convention on Climate Change (21st Session), Paris, France, 30 November–13 December 2015; p. 2017. [Google Scholar]
  4. Meng, Q.; Li, B.; Zheng, Y.; Zhu, H.; Xiong, Z.; Li, Y.; Li, Q. Multi-Scenario prediction analysis of carbon peak based on STIRPAT Model-Take South-to-North water diversion central route provinces and cities as an example. Land 2023, 12, 2035. [Google Scholar] [CrossRef]
  5. Yu, Y.T.; Zhang, N. Low-carbon city pilot and carbon emission efficiency: Quasi-experimental evidence from China. Energy Econ. 2021, 96, 105125. [Google Scholar] [CrossRef]
  6. Chakravarty, S.; Chikkatur, A.; de Coninck, H.; Pacala, S.; Socolow, R.; Tavoni, M. Sharing global CO2 emission reductions among one billion high emitters. Proc. Natl. Acad. Sci. USA 2009, 106, 11884–11888. [Google Scholar] [CrossRef]
  7. Schreyer, F.; Luderer, G.; Rodrigues, R.; Pietzcker, R.C.; Baumstark, L.; Sugiyama, M.; Brecha, R.J.; Ueckerdt, F. Common but differentiated leadership: Strategies and challenges for carbon neutrality by 2050 across industrialized economies. Environ. Res. Lett. 2020, 15, 114016. [Google Scholar] [CrossRef]
  8. Du, X.Y.; Shen, L.Y.; Ren, Y.T.; Meng, C.H. A dimensional perspective-based analysis on the practice of low carbon city in China. Environ. Impact Assess. Rev. 2022, 95, 106768. [Google Scholar] [CrossRef]
  9. Tan, S.; Yang, J.; Yan, J.Y.; Lee, C.; Hashim, H.; Chen, B. A holistic low carbon city indicator framework for sustainable development. Appl. Energ. 2017, 185, 1919–1930. [Google Scholar] [CrossRef]
  10. Wang, Y.A.; Fang, X.L.; Yin, S.W.; Chen, W. Low-carbon development quality of cities in China: Evaluation and obstacle analysis. Sustain. Cities Soc. 2021, 64, 102553. [Google Scholar] [CrossRef]
  11. Chen, N.; Zhuang, G.Y.; Zhu, S.X.; Wang, D.; Li, J. Evaluation of Low-Carbon Development of Chinese Cities in 2018. Chin. J. Urban Environ. Stud. 2021, 9, 2150003. [Google Scholar] [CrossRef]
  12. Zhang, L.; Wu, J.M.; Xu, Y.; Yeh, C.H.; Zhou, P.; Fang, J.X. A data-driven approach to objective evaluation of urban low carbon development performance. J. Clean. Prod. 2022, 368, 133238. [Google Scholar] [CrossRef]
  13. Ye, H.; Ren, Q.; Hu, X.Y.; Lin, T.; Xu, L.L.; Li, X.H.; Zhang, G.Q.; Shi, L.Y.; Pan, B. Low-carbon behavior approaches for reducing direct carbon emissions: Household energy use in a coastal city. J. Clean. Prod. 2017, 141, 128–136. [Google Scholar] [CrossRef]
  14. Wu, Y.; Shen, L.Y.; Shuai, C.Y.; Jiao, L.D.; Liao, S.J.; Guo, Z.H. Key driving forces on the development of low carbon city (LCC) in China. Ecol. Indic. 2021, 124, 107379. [Google Scholar] [CrossRef]
  15. Price, L.; Zhou, N.; Fridley, D.; Ohshita, S.; Lu, H.Y.; Zheng, N.N.; Fino-Chen, C. Development of a low-carbon indicator system for China. Habitat Int. 2013, 37, 4–21. [Google Scholar] [CrossRef]
  16. Luo, K.; Chen, S.; Cui, S.X.; Liao, Y.T.; He, Y.; Zhou, C.S.; Wang, S.J. Examining the overall and heterogeneous impacts of urban spatial structure on carbon emissions: A case study of guangdong province, china. Land 2023, 12, 1806. [Google Scholar] [CrossRef]
  17. Jiang, H.T.; Yin, J.; Qiu, Y.H.; Zhang, B.; Ding, Y.; Xia, R.C. Industrial carbon emission efficiency of cities in the pearl river basin: Spatiotemporal dynamics and driving forces. Land 2022, 11, 1129. [Google Scholar] [CrossRef]
  18. Shen, L.Y.; Bao, H.J.; Yang, Y.; Yang, Z.C.; Xu, X.R.; Zhang, L.Y.; Liao, S.J.; Chen, Z.W. Dual perspective diagnosis on low carbon city performance. J. Green Build. 2023, 18, 167–184. [Google Scholar] [CrossRef]
  19. Zhou, N.; He, G.; Williams, C.; Fridley, D. ELITE cities: A low-carbon eco-city evaluation tool for China. Ecol. Indic. 2015, 48, 448–456. [Google Scholar] [CrossRef]
  20. Wang, M.Z.; Li, T.F.; Yuan, C.Y.; Tian, H.; Tian, S.M. Research on vehicle renewable energy use in cities with different carbon emission characteristics. Energy Rep. 2022, 8, 343–352. [Google Scholar] [CrossRef]
  21. Zhang, W.; Zhou, Y.Y.; Zou, Y. Regional difference in low carbon development level of city and its influencing factor: Empirical study based on top 110 cities in GDP of china. Technol. Econ. 2014, 33, 68–74. [Google Scholar]
  22. Du, X.Y.; Shen, L.Y.; Wong, S.W.; Meng, C.H.; Cheng, G.Y.; Yao, F.Y. MBO based indicator-setting method for promoting low carbon city practice. Ecol. Indic. 2021, 128, 107828. [Google Scholar] [CrossRef]
  23. Zhuang, G.Y. Evaluation of the Development of Low-Carbon Cities in China; China Social Sciences Press: Beijing, China, 2020. [Google Scholar]
  24. Azizalrahman, H.; Hasyimi, V. Towards a generic multi-criteria evaluation model for low carbon cities. Sustain. Cities Soc. 2018, 39, 275–282. [Google Scholar] [CrossRef]
  25. Wu, Y.; Tam, V.; Shuai, C.Y.; Shen, L.Y.; Zhang, Y.; Liao, S.J. Decoupling China’s economic growth from carbon emissions: Empirical studies from 30 Chinese provinces (2001–2015). Sci. Total Environ. 2019, 656, 576–588. [Google Scholar] [CrossRef]
  26. Jing, S. Research on the Evolution of Civil Consumption Style and the Choice of Low Carbon Behavior; Yunnan University: Kunming, China, 2011. [Google Scholar]
  27. China National Standardization Management Committee. Indicators for National Forest city. 2019. Available online: https://www.gbbz.net/text/Interpret/4676cc3e93864588.html (accessed on 13 October 2023).
  28. Wang, J.H.; Ren, Y.T.; Shu, T.H.; Shen, L.Y.; Liao, X.; Yang, N.; He, H.M. Economic perspective-based analysis on urban infrastructures carrying capacity—A China study. Environ. Impact Assess. Rev. 2020, 83, 106381. [Google Scholar] [CrossRef]
  29. Shen, L.; Bao, H. Low Carbon City Performance in China (2022); Science Press: Beijing, China, 2023. [Google Scholar]
  30. Cheng, Z.; Kong, S. The effect of environmental regulation on green total-factor productivity in China’s industry. Environ. Impact Assess. Rev. 2022, 94, 106757. [Google Scholar] [CrossRef]
  31. Huang, X.; Feng, C.; Qin, J.; Wang, X.; Zhang, T. Measuring China’s agricultural green total factor productivity and its drivers during 1998–2019. Sci. Total Environ. 2022, 829, 154477. [Google Scholar] [CrossRef] [PubMed]
  32. Department of Urban Surveys, China’s National Bureau of Statistics. China City Statistical Yearbook (2021); China Statistic Press: Beijing, China, 2021. [Google Scholar]
  33. Agudelo-Vera, C.M.; Mels, A.R.; Keesman, K.J.; Rijnaarts, H. Resource management as a key factor for sustainable urban planning. J. Environ. Manag. 2011, 92, 2295–2303. [Google Scholar] [CrossRef]
  34. Long, Y.; Gu, Y.Z.; Han, H.Y. Spatiotemporal heterogeneity of urban planning implementation effectiveness: Evidence from five urban master plans of Beijing. Landsc. Urban Plan. 2012, 108, 103–111. [Google Scholar] [CrossRef]
  35. Hu, W.; Fan, Y.M. City size and energy conservation: Do large cities in China consume more energy? Energy Econ. 2020, 92, 104943. [Google Scholar] [CrossRef]
  36. Li, F.; Wang, R.S.; Liu, X.S.; Zhang, X.L. Urban forest in China: Development patterns, influencing factors and research prospects. Int. J. Sustain. Dev. World 2005, 12, 197–204. [Google Scholar] [CrossRef]
  37. Gao, L.; Zhao, Z.Y.; Li, C.; Wang, C. Factors facilitating the development of low-carbon cities: Evidence from China’s pilot cities. Heliyon 2022, 8, e11445. [Google Scholar] [CrossRef] [PubMed]
  38. Ministry of Ecology and Environment. Assessment Report on the Progress of National Low-Carbon City Pilot Work. 2023. Available online: https://www.mee.gov.cn/ywgz/ydqhbh/wsqtkz/202307/W020230713602785966247.pdf (accessed on 16 October 2023).
  39. Liu, L.Q.; Liu, C.X.; Sun, Z.Y. A survey of China’s low-carbon application practice-Opportunity goes with challenge. Renew. Sustain. Energy Rev. 2011, 15, 2895–2903. [Google Scholar] [CrossRef]
  40. Lou, Y.; Shen, L.; Huang, Z.; Wu, Y.; Li, H.; Li, G. Does the effort meet the challenge in promoting low-carbon city?—A perspective of global practice. Int. J. Environ. Res. Public Health 2018, 15, 1334. [Google Scholar] [CrossRef] [PubMed]
  41. Bridge, G.; Bouzarovski, S.; Bradshaw, M.; Eyre, N. Geographies of energy transition: Space, place and the low-carbon economy. Energ. Policy 2013, 53, 331–340. [Google Scholar] [CrossRef]
  42. Zhang, L.; Yang, Z.; Liang, J.; Cai, Y. Spatial variation and distribution of urban energy consumptions from cities in China. Energies 2010, 4, 26–38. [Google Scholar] [CrossRef]
  43. Zhou, X.; Wang, F.; Fan, J.; Ochieng, R.M. Performance of solar chimney power plant in Qinghai-Tibet Plateau. Renew. Sustain. Energy Rev. 2010, 14, 2249–2255. [Google Scholar] [CrossRef]
  44. Li, Y.; Lin, T.; Chiu, Y.; Chen, H.; Cen, H. The impact of media reports on energy and environmental efficiency in China: Evidence from modified dynamic DEA with undesirable outputs. Cost Eff. Resour. Alloc. 2021, 19, 51. [Google Scholar] [CrossRef] [PubMed]
  45. Mei, L.; Xu, X.; Chen, M. Regional evolution features and coordinated development strategies for Northeast China. Chin. Geogr. Sci. 2006, 16, 378–382. [Google Scholar] [CrossRef]
  46. Hou, G.; Zou, Z.; Zhang, T.; Meng, Y. Analysis of the effect of industrial transformation of resource-based cities in Northeast China. Economies 2019, 7, 40. [Google Scholar] [CrossRef]
  47. Chen, H.; Liu, K.; Shi, T.; Wang, L. Coal consumption and economic growth: A Chinese city-level study. Energy Econ. 2022, 109, 105940. [Google Scholar] [CrossRef]
  48. General Office of Harbin Municipal People’s Government. Opinions of Harbin Municipal Party Committee and Harbin Municipal People’s Government on Accelerating the Construction of a Modern Industrial System. Available online: https://www.harbin.gov.cn/haerbin/c104546/202110/c01_87092.shtml (accessed on 21 March 2024).
  49. Ma, Z.; Li, C.; Zhang, J. Understanding urban shrinkage from a regional perspective: Case study of Northeast China. J. Urban Plan. Dev. 2020, 146, 5020025. [Google Scholar] [CrossRef]
  50. Xinhua Daily Telegraph. After the “Herbin” Phenomenon, How to “Start Again” in Northeast China. Available online: http://www.xinhuanet.com/mrdx/2024-03/09/c_1310767052.htm (accessed on 21 March 2024).
  51. Fan, Y.; Fang, C.; Zhang, Q. Coupling coordinated development between social economy and ecological environment in Chinese provincial capital cities-assessment and policy implications. J. Clean. Prod. 2019, 229, 289–298. [Google Scholar] [CrossRef]
  52. Ding, J.; Bai, Y.; Yang, X.; Gao, Z. Spatiotemporal evolution of water resource utilization and economic development in the arid region of china: A “Matching-Constraint” perspective. Sustainability 2022, 14, 8724. [Google Scholar] [CrossRef]
  53. Liang, Y.; Liu, L. An integrated ecosystem service assessment in an artificial desert oasis of northwestern China. J. Land Use Sci. 2017, 12, 154–167. [Google Scholar] [CrossRef]
  54. Liu, J.; Xiao, B.; Jiao, J.; Li, Y.; Wang, X. Modeling the response of ecological service value to land use change through deep learning simulation in Lanzhou, China. Sci. Total Environ. 2021, 796, 148981. [Google Scholar] [CrossRef] [PubMed]
  55. Bu, X.; Dong, S.; Mi, W.; Li, F. Spatial-temporal change of carbon storage and sink of wetland ecosystem in arid regions, Ningxia Plain. Atmos. Environ. 2019, 204, 89–101. [Google Scholar]
Figure 1. Indicator system for evaluating low-carbon city performance proposed by this research team’s previous work.
Land 13 00433 g001
Figure 2. Location distribution of the sample cities.
Land 13 00433 g002
Figure 3. Variations in the low-carbon city performance value rankings under the eight dimensions of the 36 cities.
Land 13 00433 g003
Figure 4. The (a) ranking and (b) ranking variations of low-carbon city construction performances for the 36 cities.
Land 13 00433 g004
Figure 5. Geographical distribution of variations in the low-carbon city performance value rankings of the 36 cities.
Land 13 00433 g005
Table 1. The dimension–process dual perspective diagnosis matrix for evaluating low-carbon city performance [18].
DimensionCarbon SourcesCarbon SinksLow-Carbon Technology (Te)
Process Energy Structure (En)Economic Development (Ec)Production Efficiency
(Ef)
Urban Population (Po)Water (Wa)Forest (Fo)Green Space (GS)
Plan (P)En-PEc-PEf-PPo-PWa-PFo-PGS-PTe-P
Do (D)En-DEc-DEf-DPo-DWa-DFo-DGS-DTe-D
Check (C)En-CEc-CEf-CPo-CWa-CFo-CGS-CTe-C
Outcome (O)En-OEc-OEf-OPo-OWa-OFo-OGS-OTe-O
Act (A)En-AEc-AEf-APo-AWa-AFo-AGS-ATe-A
Table 2. Correction factors applied in different dimensions.
Correction FactorEndowment CharacteristicsCorresponding Index (K)Factor Type
α E n Dependence on fossil fuelsProportion of fossil energy consumption in primary energy consumption (%) (KEn)+
α E c Carbon intensityCarbon emissions per unit of GDP (t/10,000 yuan) (KEc)+
α E f Social productivityTotal factor productivity (KEf)
α P o Difficulty for city dwellers to transition to low-carbon lifestyleAverage schooling years (year) (KPo)
α W a Water resource abundanceProportion of water area in the urban administrative area (%) (KWa)
α F o Construction difficulty of forest carbon sinkMean annual rainfall (mm) (KFo)
α G S Construction difficulty of green space carbon sinkMean annual rainfall (mm) (KGS)
α T e Development and application ability of low-carbon technologyInvention patent ownership per 10,000 people (KTe)
Table 3. Assessment indicators under the energy structure dimension.
ProcessAssessment IndicatorsExecutive Indicators
En-PEn-P1:Plans for the development and application of non-fossil fuel energyEn-P1-1:Plan content
En-P1-2:Authority of plans
En-P1-3:Reference of plans
En-P1-4:Diversity of the projects in plans
En-P2:Plans for the development of energy technologyEn-P2-1:Plan content
En-P2-2:Authority of plans
En-P2-2:Reference of plans
En-P2-2:Diversity of the projects in plans
En-P3:Plans for the reduction of energy intensityEn-P3-1:Plan content
En-P3-2:Authority of plans
En-P3-3:Reference of plans
En-P3-4:Diversity of the projects in plans
En-DEn-D1:Policy measures needed for implementing planEn-D1-1:Perfection level of the associated policies
En-D1-2:Availability of the associated policies for citizen
En-D2:Resources needed for implementing planEn-D2-1:Strength of fund supports
En-D2-2:Strength of human resource supports
En-D2-3:Strength of technology supports
En-CEn-C1:Policy measures needed for checking En-C1-1:Perfection level of the associated checking policies
En-C1-2:Practices of checking policies
En-C1-3:Performance assessments of energy-relative CO2 emissions
En-C2:Resources needed for checkingEn-C2-1:Strength of fund supports for checking
En-C2-2:Strength of human resource supports for checking
En-C2-3:Strength of technology supports for checking
En-OEn-O1:The performance of energy production and consumption En-O1-1:Per capita energy-relative CO2 emissions
En-O1-2:Energy-relative CO2 emissions in per unit of GDP
En-O1-3:Proportion of non-fossil energy in primary energy consumption
En-O1-4:The proportion of coal burning in energy consumption of industrial enterprises above designated size
En-AEn-A1:Encouragement measures for better energy consumption performanceEn-A1-1:Awards for government sectors based on the performance assessments
En-A1-2:Punitive measures for government sectors based on the performance assessments
En-A2:Penalty measures for poor energy consumption performance En-A2-1:Awards for enterprises, associations and individuals based on the performance assessments
En-A2-2:Punitive measures for enterprises, associations and individuals based on the performance assessments
En-A3:Design for improvement measuresEn-A3-1:Summaries and optimizing strategies published by government
En-A3-2:Summaries and optimizing strategies published by associations
Table 4. Sample of the scoring criteria and scoring rules for qualitative and quantitative executive indicators.
Executive IndicatorsScoring Criteria and Scoring Rules
En-P1-1: Plans for the development and application of non-fossil fuel energy—Plan contentScoring criteria:
Whether there are clear provisions in the city’s planning regarding the following:
① the consumption of non-fossil fuel energy;
② the proportion of non-fossil fuel energy;
③ the proportion of the power generation of non-fossil fuel energy;
④ the optimization goals of energy structure;
⑤ the spatial distribution of energy development.
Scoring rules:
100—when all credit points are met;
80—when any four credit points are met;
60—when any three credit points are met;
40—when any two credit points are met;
20—when any one credit point is met;
0—when none of the credit points are met.
En-O1-1: Per capita energy-relative CO2 emissionsThis executive indicator is a negative quantitative indicator, which is calculated by using the following formula:
V D i j , k   = 100   ,   x k x l x h x k x h x l × 100 ,   x l < x k x h 0   , x k > x h  
V D i j ,   k   represents   the   standardized   value   of   a   specific   LCCP   executive   indicator   k   in   process   j   under   dimension   Di ;   x k   denotes   the   real   value   of   the   executive   indicator   k   for   the   target   city ;   x h   denotes   the   maximum   value   of   k   for   a   sample   of   cities ;   and   x l  denotes the minimum value of k for the sample of cities.
Table 5. The data sources for the characteristic index (K) variables.
DataSource
KEnThe special energy plans or the “14th Five-Year Plan” issued by the sample cities, and government’s official website, etc.
KEcChina city carbon dioxide emissions dataset (2020) of the China City Greenhouse Gas Working Group (CCG)
KEfKEf is calculated according the method proposed by Cheng and Kong [30] and Huang et al. [31]. The data for calculation are collected from the China Urban Statistical Yearbook, China Regional Statistical Yearbook and China Statistical Yearbook.
KPoBulletin of the seventh National Census issued by the sample cities
KWaThe ecological environment bulletin of the sample cities and the results of the second national wetland census
KFo, KGSChina city Statistical Yearbook (2021) [32]
KTeChinese Research Data Services platform
Table 6. The data for the characteristic index (K) for the 36 cities.
CityKEnKEcKEfKPoKWaKFoKGSKTe
Beijing10.400.370.7312.642.26527.10527.1074.14
Tianjin7.701.301.1211.2924.84571.00571.0054.22
Shijiazhuang5.001.770.9810.760.05551.40551.4018.22
Taiyuan6.501.580.2211.842.75542.90542.9022.74
Huhhot11.202.710.0311.301.94367.20367.2015.86
Shenyang8.601.020.6711.391.69658.00658.0023.23
Dalian10.001.110.6410.8228.66714.30714.3023.64
Changchun9.501.020.0810.694.88663.50663.5019.11
Harbin9.001.300.7411.162.35423.00423.0015.52
Shanghai18.002.460.9311.811.921164.501164.5055.93
Nanjing6.500.780.3911.765.231090.001090.0081.76
Hangzhou16.300.511.0010.4111.401721.001721.0077.13
Ningbo20.000.730.419.426.201480.001480.0064.16
Hefei6.300.560.3910.8010.371523.001523.0043.84
Fuzhou21.600.600.8810.3917.381403.001403.0031.26
Xiamen22.000.270.9011.1718.971143.201143.2056.98
Nanchang13.600.500.3711.0117.501600.001600.0028.52
Jinan2.900.810.9010.972.92548.70548.7044.29
Qingdao8.000.570.1510.8312.39662.10662.1057.02
Zhengzhou11.200.530.9511.767.71576.00576.0039.82
Wuhan15.600.540.0311.9619.121269.001269.0047.69
Changsha17.700.340.2511.522.891350.001350.0032.74
Guangzhou29.000.330.0411.6110.711623.601623.6083.05
Shenzhen29.000.160.2411.8623.331932.001932.00125.86
Nanning25.000.700.4510.642.861110.701110.7013.49
Haikou17.400.480.4811.402.191220.001220.0020.90
Chongqing25.000.750.669.802.511184.101184.1017.21
Chengdu44.200.280.2010.852.011229.601229.6031.18
Guiyang21.100.940.3210.762.001156.201156.2025.99
Kunming42.000.430.8211.032.97850.10850.1021.74
Xi’an10.000.460.0311.853.96648.30648.3035.70
Lanzhou13.001.630.5011.330.29300.00300.0021.20
Xining47.002.460.8710.200.08500.00500.0013.17
Yinchuan13.706.900.3211.015.90182.60182.6015.09
Urumqi17.001.890.5011.570.94199.60199.6014.38
Lhasa45.000.680.489.553.83435.00435.0015.75
Table 7. Value of the correction factors for the 36 cities.
CityαEnαEcαEfαPoαWaαFoαGSαTe
Beijing1.150.851.020.981.071.061.060.84
Tianjin1.311.141.020.990.791.051.050.85
Shijiazhuang1.331.200.971.011.291.051.051.17
Taiyuan1.331.191.040.981.041.061.061.09
Huhhot1.111.201.040.991.111.101.101.19
Shenyang1.251.080.980.991.131.031.031.08
Dalian1.161.100.981.010.791.011.011.07
Changchun1.191.081.041.020.941.021.021.15
Harbin1.221.140.991.001.071.101.101.19
Shanghai0.931.201.020.981.110.940.940.84
Nanjing1.331.021.000.980.930.950.950.84
Hangzhou0.960.920.971.030.830.920.920.84
Ningbo0.901.000.981.030.910.920.920.84
Hefei1.330.940.981.010.840.920.920.90
Fuzhou0.870.960.971.030.790.920.920.99
Xiamen0.870.850.971.000.790.950.950.84
Nanchang1.030.921.001.000.790.920.921.01
Jinan1.331.030.971.001.031.061.060.90
Qingdao1.290.951.041.010.821.031.030.84
Zhengzhou1.110.930.970.980.881.051.050.92
Wuhan0.980.931.040.980.790.930.930.88
Changsha0.930.851.010.981.030.920.920.97
Guangzhou0.810.851.040.980.830.920.920.84
Shenzhen0.810.851.000.980.790.920.920.84
Nanning0.831.000.991.021.030.950.951.19
Haikou0.940.910.990.991.080.940.941.12
Chongqing0.831.011.001.031.050.940.941.19
Chengdu0.810.851.041.011.100.940.940.99
Guiyang0.881.060.981.011.100.940.941.04
Kunming0.810.881.021.001.020.990.991.10
Xi’an1.160.901.020.980.971.031.030.95
Lanzhou1.051.191.030.991.291.101.101.11
Xining0.811.201.011.031.291.071.071.19
Yinchuan1.021.201.041.000.911.101.101.19
Urumqi0.951.201.010.981.281.101.101.19
Lhasa0.810.991.001.030.981.101.101.19
Max1.331.201.041.031.291.101.101.19
Min0.810.850.970.980.790.920.920.84
Average1.041.021.001.000.991.001.001.01
Table 8. Comparisons between the original and the corrected low-carbon city performance value rankings under the eight LCC dimensions.
CitiesEnEcEfPoWaFoGSTe
ScoreRankScoreRankScoreRankScoreRankScoreRankScoreRankScoreRankScoreRank
Before/AfterBefore/AfterBefore/AfterBefore/AfterBefore/AfterBefore/AfterBefore/AfterBefore/AfterBefore/AfterBefore/AfterBefore/AfterBefore/AfterBefore/AfterBefore/AfterBefore/AfterBefore/After
Beijing74.28/78.851/187.13/81.661/670.05/70.462/172.86/72.053/364.97/66.188/265.89/67.311/183.13/84.991/168.08/63.841/1
Tianjin66.32/75.274/278.67/82.7114/363.40/63.874/371.20/70.974/456.39/53.7618/2845.57/46.0315/1466.08/67.1020/1654.72/51.657/8
Shijiazhuang47.29/54.7121/1076.58/81.1917/747.18/46.6026/2652.80/53.1319/1947.81/50.3435/3440.76/41.4521/2065.46/66.8321/1743.71/47.2214/11
Taiyuan50.11/57.5219/871.87/76.3325/1840.42/41.0531/3155.00/54.4215/1856.70/57.2817/1725.06/25.4135/3466.70/67.9918/1428.09/29.4932/33
Huhhot41.86/43.5130/2769.30/73.7830/2240.12/40.8332/3347.28/47.0925/2556.26/57.9319/1548.82/50.658/668.12/70.6514/1128.18/31.1031/31
Shenyang43.18/48.2026/1977.11/79.4415/1153.77/53.3017/1750.42/50.1623/2358.29/60.5015/1325.79/25.9434/3365.36/65.9322/2031.94/33.2929/29
Dalian50.47/54.5317/1168.88/71.4231/2857.13/56.8010/1040.89/41.1731/3070.06/64.122/547.76/48.0512/1075.36/75.746/536.87/37.9022/19
Changchun41.32/44.9231/2571.52/73.6227/2350.97/51.8221/2040.45/40.8333/3265.75/64.177/435.58/35.8827/2762.18/62.7325/2332.12/33.8128/27
Harbin42.97/47.2428/2074.24/78.1022/1449.26/49.0823/2338.37/38.3134/3462.18/63.6110/633.78/35.9330/2655.38/57.1534/3430.81/33.5330/28
Shanghai66.83/64.643/581.13/87.467/162.21/62.665/575.85/75.012/253.01/54.4628/2335.07/34.5729/2975.50/73.965/663.46/59.172/3
Nanjing60.59/68.705/483.11/83.684/263.59/63.573/464.71/64.119/1164.01/62.379/940.56/40.1023/2278.95/77.463/360.92/56.513/4
Hangzhou70.76/69.462/382.48/79.945/1070.57/69.701/263.65/64.3711/1075.26/70.331/150.09/48.347/982.46/80.352/256.73/52.546/7
Ningbo58.52/55.656/980.67/80.819/857.67/57.259/963.81/64.5110/968.56/66.104/341.13/39.7520/2368.24/66.1913/1939.11/35.4418/25
Hefei46.75/53.5022/1381.06/79.328/1255.28/54.7513/1343.78/44.0328/2850.05/48.2130/3547.92/46.5110/1266.59/64.4319/2246.79/44.5911/14
Fuzhou43.08/40.2927/2975.86/74.7319/1945.38/44.6527/2846.16/46.7727/2653.67/50.3725/3346.37/44.6714/1563.95/62.2323/2437.27/37.0321/22
Xiamen42.45/39.3529/3172.35/67.7324/3255.29/54.5112/1454.78/54.7118/1668.63/63.133/740.33/39.3224/2477.40/75.834/442.83/40.1016/17
Nanchang52.20/52.9411/1473.76/71.4023/2954.43/54.4014/1543.47/43.5529/2965.80/60.556/1143.99/42.7117/1860.37/58.5828/3145.21/45.4313/13
Jinan51.26/59.7013/771.68/72.5226/2761.00/60.246/850.83/50.9622/2255.63/56.0720/1836.05/36.5925/2569.84/71.1511/1039.37/37.6217/20
Qingdao54.51/62.837/683.90/82.333/559.92/61.007/666.98/67.267/766.30/61.685/1046.64/46.9813/1167.81/68.4415/1350.68/47.289/10
Zhengzhou51.15/53.9914/1275.17/73.1220/2551.82/51.0420/2149.04/48.4324/2454.16/52.1524/2942.56/42.9318/1760.15/61.0629/2736.57/35.4923/24
Wuhan50.55/49.9716/1579.78/77.8311/1553.79/54.8416/1270.37/69.656/654.47/51.0323/3135.67/34.7526/2868.99/67.3512/1550.33/47.6510/9
Changsha50.29/48.2918/1770.45/65.6028/3353.88/54.1115/1654.82/54.4417/1759.51/60.1313/1447.87/46.4911/1360.93/59.4627/3046.63/46.0112/12
Guangzhou53.50/48.288/1879.17/73.9812/2159.64/60.658/770.68/70.225/557.97/54.1316/2645.53/44.1916/1674.22/71.388/934.48/32.1425/30
Shenzhen51.74/46.1912/2376.94/72.9816/2648.93/48.8924/2478.33/77.541/160.74/57.4112/1622.99/22.3836/3674.41/72.017/757.27/53.485/6
Nanning44.18/40.1023/3079.09/78.9513/1350.40/50.2422/2252.44/52.7920/2053.44/53.9026/2759.11/57.653/267.72/66.4416/1838.01/41.4319/16
Haikou43.70/42.1924/2866.93/64.0533/3443.45/43.1429/2938.29/38.0635/3558.75/60.5314/1250.15/48.656/866.89/65.4617/2127.98/29.6233/32
Chongqing50.93/46.1415/2482.09/82.426/452.11/52.1319/1965.09/65.928/861.93/63.1311/758.38/57.062/373.14/71.699/858.59/62.994/2
Chengdu52.97/46.269/2285.90/80.732/955.43/56.5411/1158.82/59.1013/1349.74/50.8933/3242.44/41.1819/2170.10/68.5510/1254.45/54.128/5
Guiyang52.72/49.8010/1675.06/76.8821/1641.72/41.2430/3054.95/55.2516/1552.59/54.2629/2554.12/52.725/563.25/62.0824/2537.46/38.2420/18
Kunming49.08/44.5820/2680.63/76.5010/1747.59/48.0925/2540.48/40.5332/3354.69/55.1622/2054.39/54.064/461.04/60.8026/2832.93/34.0027/26
Xi’an43.24/46.5225/2176.01/73.2018/2444.96/45.3828/2756.80/56.1714/1455.19/54.6521/2248.39/49.029/756.82/57.4032/3343.10/42.1815/15
Lanzhou35.69/36.4235/3367.09/71.0432/3052.53/53.1618/1841.32/41.1030/3149.67/54.3434/2440.60/41.7922/1954.51/56.2435/3534.41/36.0326/23
Xining36.87/32.4734/3657.86/62.1536/3639.68/39.8334/3459.15/59.7912/1249.92/55.5432/1923.28/23.7628/3559.76/61.3030/2624.10/26.8934/34
Yinchuan34.63/34.8936/3470.02/74.1529/2040.09/40.8633/3251.27/51.3321/2153.22/51.5427/3033.56/34.0831/3058.39/60.4131/2935.56/37.5724/21
Urumqi39.49/38.7132/3264.81/69.5934/3138.97/39.1535/3522.91/22.5836/3650.03/54.7531/2127.22/27.9133/3256.26/58.2933/3222.72/24.8535/35
Lhasa37.82/33.3733/3563.10/62.8635/3526.67/26.6436/3646.26/46.7126/2740.31/39.9736/3629.82/30.1132/3152.93/54.6536/3621.65/23.5236/36
Mean Value49.54/50.28 75.32/75.39 51.65/51.74 54.29/54.25 57.66/57.07 42.04/41.80 66.62/66.45 41.48/41.22
SD9.37/11.18 6.58/6.04 9.22/9.21 12.38/12.27 7.27/6.04 10.23/9.99 7.65/7.06 11.92/10.40
CV0.19/0.22 0.09/0.08 0.18/0.18 0.23/0.23 0.13/0.11 0.24/0.24 0.11/0.11 0.29/0.25
Table 9. Comparisons between the original and the corrected low-carbon city performances.
CityScoreRankCityScoreRank
BeforeAfterBeforeAfterVariationBeforeAfterBeforeAfterVariation
Beijing73.2973.17110Wuhan57.9756.6312111
Tianjin62.7963.92651Changsha55.5654.321619−3
Shijiazhuang52.6555.1822166Guangzhou59.4656.87910−1
Taiyuan49.2551.1930273Shenzhen58.956.361012−2
Huhhot49.9951.9428253Nanning55.5855.1915150
Shenyang50.6952.126242Haikou49.5248.962931−2
Dalian55.8856.2214131Chongqing63.3362.6956−1
Changchun50.0450.972728−1Chengdu58.7257.171192
Harbin48.3650.3731292Guiyang53.9453.8120200
Shanghai64.1663.99440Kunming52.6151.722426−2
Nanjing64.5964.56330Xi’an53.0753.072122−1
Hangzhou68.9366.88220Lanzhou46.9748.7733321
Ningbo59.7758.21880Xining45.3945.2234340
Hefei54.854.4218171Yinchuan46.9948.13233−1
Fuzhou51.4850.092530−5Urumqi40.2541.9835350
Xiamen56.7354.341318−5Lhasa33.9839.7336360
Nanchang54.8553.71721−4Mean Value54.7254.78
Jinan54.4955.6119145SD7.566.66
Qingdao62.1562.23770CV0.140.12
Zhengzhou52.6252.2823230
Disclaimer/Publisher’s Note: The statements, opinions and data contained in all publications are solely those of the individual author(s) and contributor(s) and not of MDPI and/or the editor(s). MDPI and/or the editor(s) disclaim responsibility for any injury to people or property resulting from any ideas, methods, instructions or products referred to in the content.

