Article

Differentiation of Carbon Sink Enhancement Potential in the Beijing–Tianjin–Hebei Region of China

1
Academy of Eco-Civilization Development for Jing-Jin-Ji Megalopolis, Tianjin Normal University, Tianjin 300387, China
2
Hebei International Joint Research Center for Remote Sensing of Agricultural Drought Monitoring, Hebei GEO University, Shijiazhuang 050031, China
3
College of Land Science and Spatial Planning, Hebei GEO University, Shijiazhuang 050031, China
4
Graduate School, Hebei GEO University, Shijiazhuang 050031, China
*
Author to whom correspondence should be addressed.
Land 2024, 13(3), 375; https://doi.org/10.3390/land13030375
Submission received: 4 February 2024 / Revised: 12 March 2024 / Accepted: 13 March 2024 / Published: 16 March 2024
(This article belongs to the Special Issue Regional Sustainable Management Pathways to Carbon Neutrality)

Abstract

:
Carbon sink enhancement is of great significance to achieving carbon peak and carbon neutrality. This study firstly estimated the carbon sink in the Beijing–Tianjin–Hebei Region using the carbon absorption coefficient method. Then, this study explored the differentiation of carbon sink enhancement potential with a carbon sink–economic carrying capacity index matrix based on carbon sink carrying capacity and economic carrying capacity under the baseline scenario and target scenario of land use. The results suggested there was a remarkable differentiation in total carbon sink in the study area, reaching 2,056,400 and 1,528,300 tons in Chengde and Zhangjiakou and being below 500,000 tons in Langfang and Hengshui, while carbon sink per unit land area reached 0.66 ton/ha in Qinhuangdao and only 0.28 t/ha in Tianjin under the baseline scenario. Increasing area and optimizing spatial distribution of arable land, garden land, and forest, which made the greatest contribution to total carbon sinks, is an important way of enhancing regional carbon sinks. A hypothetical benchmark city can be constructed according to Qinhuangdao and Beijing, in comparison with which there is potential for carbon sink enhancement by improving carbon sink capacity in Beijing, promoting economic carrying capacity in Qinhuangdao, and improving both in the other cities in the study area.

1. Introduction

The drastic increase in carbon emitted into the atmosphere since the industrial revolution has made a great contribution to climate change, and enhancing carbon sink while promoting economic growth is an important way to achieve the strategic goals of carbon peak by 2030 and carbon neutrality by 2060 for alleviating climate change [1]. Carbon sink refers to the natural or anthropogenic banks of greenhouse gases, including soils, plants and oceans, which can reduce the greenhouse gas concentration in the atmosphere through vegetation restoration and so on [2]. Specifically, land carbon stocks primarily include vegetation and soil carbon stocks in the forest, grassland, deserts, arable land, and wetland [3]. Terrestrial vegetation and soils have currently absorbed approximately 40% of CO2 emissions from human activities, and there is considerable potential to further increase their uptake and storage of CO2 and increase carbon sinks with various management policies and measures [2] The Kyoto Protocol (1997), Copenhagen Accord (2009), and the Glasgow Climate Convention (2021) also suggested that carbon sink enhancement of the terrestrial ecosystem is the most economical and effective technological pathway to improving carbon sinks [3]. The “carbon sink–economic carrying capacity”, as an integration of carbon sink and economic carrying capacity, generally refers to the maximum amount of carbon emissions that an economic system can absorb or offset without causing detrimental environmental impacts [4,5]. Research on carbon sink–economic carrying capacity can provide a valuable reference for understanding and managing the balance between economic growth and sustainable development in different regions of the world, especially in the context of climate change [6,7,8].
Carbon sinks are generally estimated with the land area and carbon emission coefficient, since the carbon sequestration rates and status quo carbon sink capacities vary significantly among different land carbon sinks [9]. For example, the spatial and temporal differentiation patterns of carbon emission and compensation in China have been revealed at the provincial scale with the carbon emission coefficient method [10]. In fact, construction land, e.g., urban villages, industrial and mining land, transportation land, and water conservancy land, may serve as both a carbon source and sink, but its carbon source intensity is generally much higher than its carbon sink intensity [2]. By contrast, arable land, garden land, forest land, grassland, wetland, and watershed are both carbon sinks and carbon sources, but their carbon sink intensity is generally much higher than their carbon source intensity [11].
The core of carbon sink enhancement is to improve the carbon sequestration capacity of terrestrial ecosystems through “optimal ecosystem layout, species allocation and ecosystem management” [12], and territorial spatial planning is widely recognized as an effective way of controlling greenhouse gas emissions from the macro perspective [2,13]. For example, the central government of China has issued the National Outline of Territorial Spatial Planning (2021–2035), which provides an important basis for guiding the planning of national carbon sink function areas and lays an important foundation for macro decision making on the upgrading of ecological carbon sinks [14]. The central government of China has also proposed to implement this planning by adhering to planning and coordination, focusing on constructing a spatial pattern of ecological protection and restoration, with the goal of constructing a national ecological security barrier system [14,15]. However, land and urban–rural planning in the past has primarily focused more on carbon reduction by balancing ecological, agricultural, and urban spaces, rather than the enhancement of carbon sinks by improving land management [16]. Carbon sequestration and sink enhancement have been mentioned in a lot of local planning from the perspective of current territorial planning, but generally with only some ideas and entries [17]. In particular, the current technical framework of territorial spatial planning lacks both clear quantitative coupling methods for carbon emissions and sinks and carbon sink target constraints on the whole [18]. Nevertheless, previous studies have indicated that there is a finite size and duration for carbon sink enhancement potential through changes in land management practices, and it is necessary to explore the potential role of land management and other measures in increasing the global land carbon sink [19].
China has made considerable efforts to enhance land carbon sinks, as deforestation as well as grassland and lake reclamation have been effectively curbed [5]. In fact, China has sequestered approximately 600 million tons of carbon annually through ecosystem management in recent decades [20,21]. In particular, the continuous improvement from main function zoning to integrated ecological protection and restoration, to the realization of Beautiful China has not only led to an increase in carbon sinks but also provided outstanding ecological benefits [20]. In particular, the panel data of carbon emission and sequestration of prefecture-level and above cities in China provided an important foundation for the relevant research of carbon sink enhancement and policy formulation for improving carbon sinks [22,23]. However, the constraints of human activities such as accelerated urbanization have greatly affected vegetation carbon sequestration and resulted in significant uncertainties in understanding future land carbon sink enhancement potential [24].
The Beijing–Tianjin–Hebei Region is an important ecosystem sink project region with high carbon sink potential in China, which is also an important zone for ecological conservation [2]. This region falls under the planning scope of ecological protection and restoration in the northern sand-proof belt and the coastal zone in the “Three Zones and Four Belts” project under the “Overall Planning for The National Important Ecosystem Protection and Restoration “ and the “Two Screens and Three Belts” project under the “National Main Functional Areas Planning” [25]. The continuous improvement from main function zoning to integrated ecological protection and restoration to the realization of a beautiful China not only means that the Beijing–Tianjin–Hebei Region plays an outstanding role in providing ecological benefits, but has also significantly increased the regional carbon sinks [26]. However, there is a significant spatial imbalance of carbon sinks in the Beijing–Tianjin–Hebei Region, and there is still an urgent need for a large amount of spatial resource inputs to improve the carbon sinks and meet economic and social development in this region in the future according to the Beijing–Tianjin–Hebei Synergistic Development Plan Outline [27,28]. It is necessary to reveal the current spatial patterns of carbon sink distribution within the Beijing–Tianjin–Hebei Region. Meanwhile, there is an urgent need to explore the contributions of different ecosystems within this region to the regional carbon sink and their potentials for enhancing the regional carbon sink. This study has therefore aimed to estimate the regional carbon sinks and reveal the differentiation in the carbon sink enhancement potential of the Beijing–Tianjin–Hebei Region for identifying strategies to enhance regional carbon sinks and thereby promote ecological civilization construction and synergistic development in this region.

2. Materials and Methods

2.1. Study Area

The Beijing–Tianjin–Hebei Region consists of Beijing City, Tianjin City, and 11 municipalities in Hebei Province (113°05′–119°50′ E, 36°05′–42°39′ N), covering an area of 218,000 km2 (Figure 1). It is one of the three major urban agglomerations in China, which has undergone the most rapid urbanization in northern China. It is also one of the most densely populated urban agglomerations in China, with a total resident population of 113.07 million by the end of 2019, among which 21.54 million, 15.62 million, and 75.92 million lived in Beijing, Tianjin, and Hebei Province, respectively. The Beijing–Tianjin–Hebei Region as a whole achieved a gross regional Gross Domestic Product (GDP) of CNY 8458 billion, accounting for 8.53% of the national total GDP in 2020 [29]. Meanwhile, it is one of the agglomeration areas of energy consumption and carbon emissions in China, accounting for approximately 11% of the national total carbon emissions, where the carbon emission intensity is about 40% higher than the national average level, making it a key area for carbon emission control and carbon sink enhancement in 2020 [30]. The large amount of carbon dioxide emissions in the Beijing–Tianjin–Hebei Region primarily result from the energy structure, which is dominated by coal, and the industrial structure, which is dominated by high-energy-consuming industries [31]. It is notable that different parts of the Beijing–Tianjin–Hebei Region are at different stages of development and face different challenges of carbon sink enhancement. Although the energy consumption per unit of GDP in Hebei Province has continuously declined during 2013–2020, it is still 1.2 times the national average level. Nevertheless, the Beijing–Tianjin–Hebei Region has continuously enhanced synergistic linkages since the implementation of the Beijing–Tianjin–Hebei Cooperative Development Strategy in 2014, and carbon peak and carbon neutrality policies have been put into practice step by step.

2.2. Data Sources and Processing

The data used in this study mainly include the socio-economic data, land use data, and other data (Table 1). Specifically, the socio-economic data such as the Gross Domestic Product (GDP) were mainly derived from the China Urban Statistical Yearbook (2001–2020), Hebei Economic Yearbook (2001–2020), and Statistical Yearbook of Municipalities (2001–2020). The land use data were all derived from the dataset of the Third National Land Survey, which was carried out during 2017–2020, with 31 December 2019 as the standard time point for summarizing data. In addition, the administrative boundary data and Digital Elevation Model (DEM) were downloaded from the Resources and Environmental Science Data Center, Chinese Academy of Sciences (https://www.resdc.cn/, accessed on 20 May 2022). All these data were processed with ArcGIS 10.8.1.
The land types were classified into arable land; garden land; forest land; grassland; wetland; land for towns, villages, industry, and mines; land for transportation; and land for watersheds and water conservancy facilities in this study. It is notable that the land use data in rural areas were comprehensively retrieved with remote sensing images with a resolution higher than 1 m from satellites such as Gaofen-2 and Beijing-2, WorldView-1 and WorldView-2, while the land data within towns and villages were retrieved with aerial remote sensing data with a resolution higher than 0.2 m. The Third National Land Survey widely used new technologies and strict quality control throughout the entire process, providing an important data basis for grasping a detailed and accurate view of the current situation of land use and changes in natural resources in the Beijing–Tianjin–Hebei Region and the whole country.

2.3. Methods

This study firstly analyzed the carbon source and sink process and then estimated the carbon sink in the study area using the carbon absorption coefficient method. This study thereafter constructed the carbon sink–economic carrying capacity index matrix based on the carbon sink carrying capacity and the economic carrying capacity under the baseline scenario and target scenario of land use to reveal the differentiation of carbon sink enhancement potential in the study area.
(1) Estimation of carbon sinks. Carbon sinks mainly originate from arable land, garden land, forest land, grassland, wetland, and waters (except land for water conservancy facilities), which was calculated using the carbon absorption coefficient method as follows.
C i = G i × f i
where Ci and Gi and are the carbon sink and the area of the ith land type, respectively; and fi is the carbon sink coefficient of the ith land type, the data of which were mainly extracted from previous studies (Table 2) [2,28,29].
(2) Exploration of differentiation of carbon sink enhancement potential. This study explored the differentiation in carbon sink enhancement potential based on the carbon sink carrying capacity and the economic carrying capacity under the baseline scenario and target scenario of land use. This study established the baseline scenario and target scenario of land use according to the specific situation of the study area. The baseline scenario refers to the conditions in which the land use mode and management measures maintain the current development trend and do not aim for a high carbon sink trend in the Beijing–Tianjin–Hebei Region, which can reveal the lower limit of carbon sink under the existing policies. Specifically, the existing economic development and ecological conservation policies will continue as usual under the baseline scenario, without additional measures for improving carbon sink. The target scenario indicates that more positive policies will be carried out to promote the coordination of economic development and ecological conservation, which can more effectively improve carbon sink. Under the target scenario, the carbon sink capacity and soil carbon sequestration capacity will be further effectively improved with various measures such as carbon sink space optimization and governance and integrated protection and ecological restoration projects for mountains, water, forests, arable land, lakes, grasses, and sand land. The carbon sink coefficients under the baseline scenario and target scenario of land use were set as the lower and higher limits of the carbon sink coefficient in Table 2, respectively. For example, the carbon sink coefficients of arable land under the target scenario and the baseline scenario are 1.16 and 0.422, respectively.
The carbon sink carrying capacity ( C A n / L D ) reflects the carbon sink capacity per unit land area, and the economic carrying capacity (GDP/LD) is the ratio of GDP per unit land area. The carbon sink–economic carrying capacity index is the ratio of carbon sink carrying capacity to the economic carrying capacity, which was estimated as follows:
T H D = C A n / L D G D P / L D = C A n / G D P
where THD is the carbon sink–economic carrying capacity index, and CAn, GDP, and LD refer to the carbon sink, gross domestic product, and land area of the nth city of the study area, respectively.
This study constructed the carbon sink–economic carrying capacity index matrix, using CAn/GDP and GDP/LD as the horizontal and vertical coordinate axes, respectively, and their deviation values formed the quadrant diagram. The four quadrants represent “high carbon sink–high GDP”, “low carbon sink–high GDP”, “high carbon sink–low GDP”, and “low carbon sink–low GDP”, respectively, which were used to judge the matching degree of the land carbon sink and economic carrying degree of each city in the study area. Specifically, the “high carbon sink–high GDP” quadrant belongs to the “high matching degree” scenario, the “low carbon sink–low GDP” quadrant belongs to the “low matching degree” scenario, and the other conditions belong to the “poor matching degree” scenario, according to which the differentiation in carbon sink enhancement potential was explored.

3. Results and Discussion

3.1. Carbon Sink Carrying Capacity

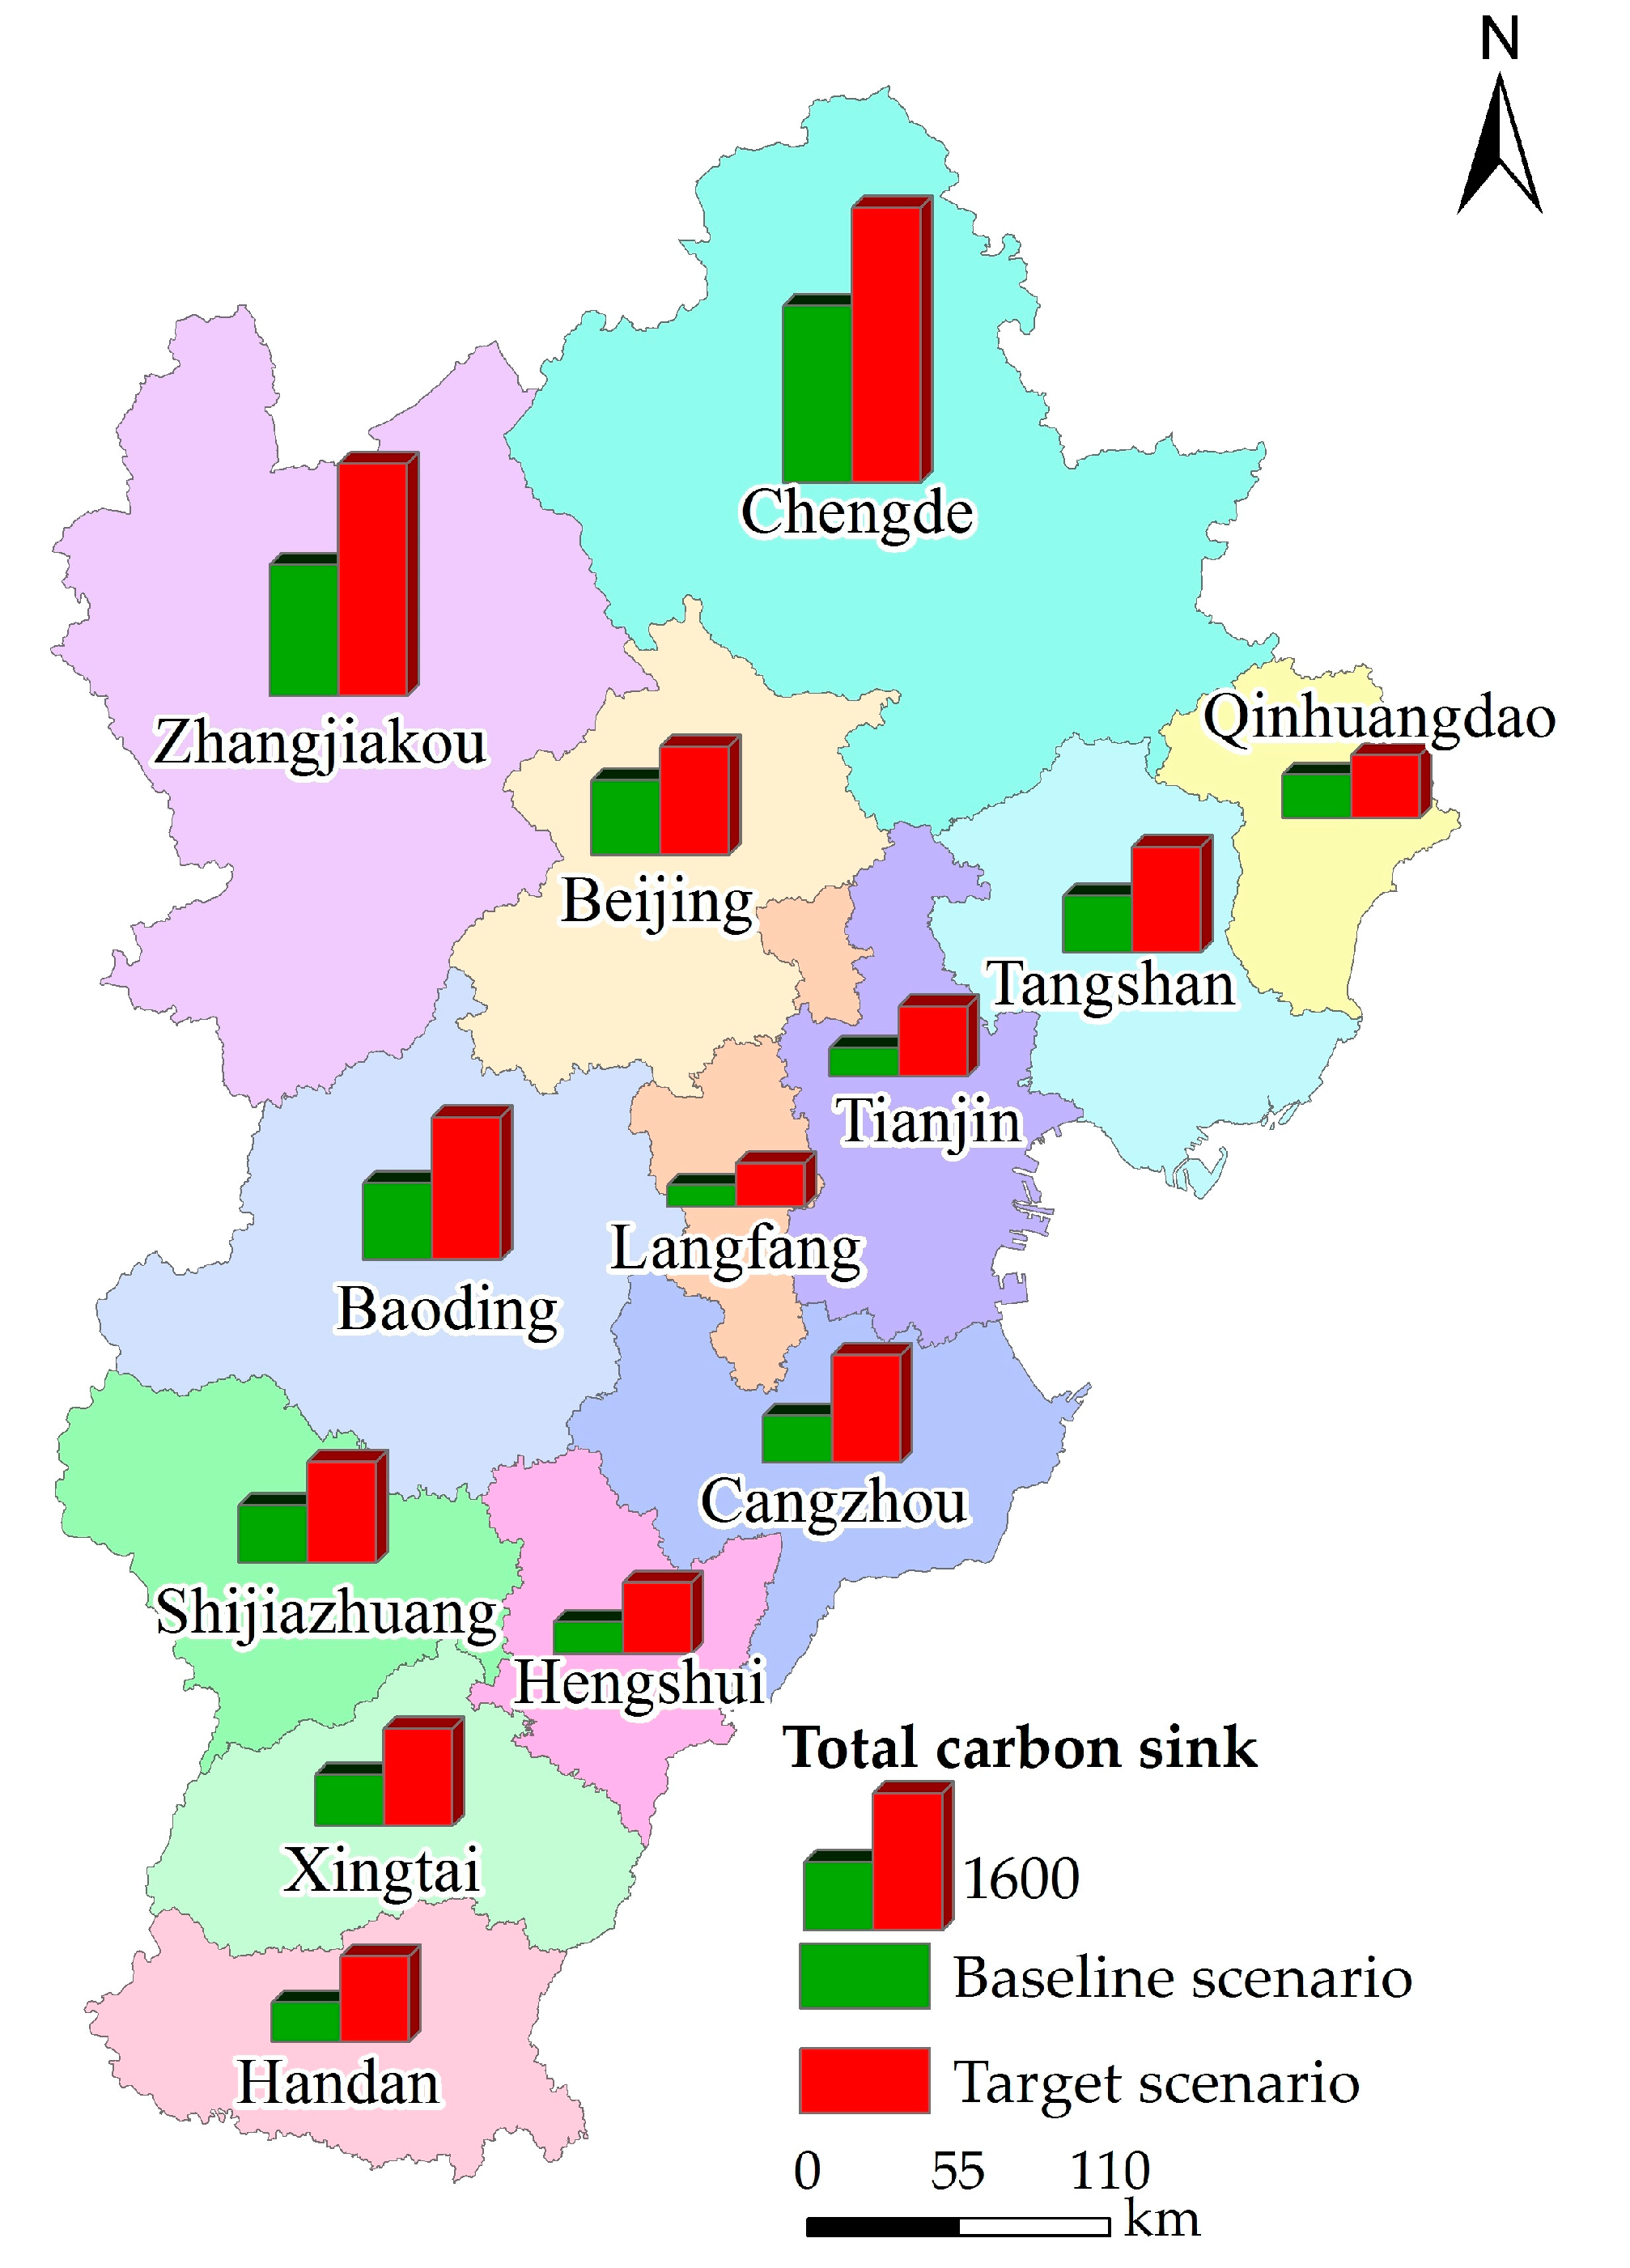
3.1.1. Total Carbon Sink

There was remarkable differentiation of total carbon sink ( C A n ) among different cities under the baseline scenario (Figure 2). Specifically, the total carbon sinks exceeded one million tons in only two cities under the baseline scenario, i.e., Chengde and Zhangjiakou, reaching 2,056,400 and 1,528,300 tons, respectively. It is notable that Chengde and Zhangjiakou had the largest carbon sinks under the baseline scenario, accounting for 38% of the total carbon sink of the study area, while this ranged between 500,000 and 1,000,000 tons in seven cities under the baseline scenario, i.e., Baoding, Beijing, Shijiazhuang, Tangshan, Xingtai, Cangzhou, and Qinhuangdao, reaching 895,400, 870,000, 672,500, 661,900, 594,700, 547,000, and 504,200 tons, respectively. Meanwhile, it was below 500,000 tons in four cities, reaching only 458,900, 367,100, 331,500, and 248,900 tons in Handan, Hengshui, Tianjin, and Langfang, respectively, and the latter two cities had the smallest carbon sinks, accounting for only 7% of the total carbon sink of the study area.
The carbon sink under the target scenario differed significantly from that under the baseline scenario (Figure 2). Specifically, the carbon sink exceeded one million tons in eight cities under the target scenario, i.e., Chengde, Zhangjiakou, Baoding, Beijing, Cangzhou, Tangshan, Shijiazhuang, and Xingtai, reaching 3.216, 2.794, 1.6615, 1.260, 1.2563, 1.228, 1.1806, and 1.1354 million tons, respectively. Meanwhile, it exceeded 500,000 tons in all other cities, reaching 9,960,000 tons, 824,000, 816,100, 736,100, and 507,200 tons in Handan, Hengshui, Tianjin, Qinhuangdao, and Langfang, respectively. In particular, Chengde and Zhangjiakou had the largest amount of carbon sink, accounting for 33.7% of the total regional carbon sink of the study area, which is consistent with that under the baseline scenario, while Langfang and Qinhuangdao had the smallest amount of carbon sink, accounting for only 7% of the total carbon sink of the study area, which is slightly different from that under the baseline scenario.

3.1.2. Carbon Sink Per Unit Land Area ( C A n / L D )

There was remarkable differentiation in the carbon sink per unit land area under the baseline scenario and target scenario (Figure 3). The carbon sink per unit land area was the highest in Qinhuangdao under the baseline scenario, reaching 0.66 ton/ha, and it reached 0.53 tons/ha in Beijing and Chengde. Meanwhile, it ranged between 0.40 and 0.50 ton/ha in six cities, including Shijiazhuang, Xingtai, Tangshan, Zhangjiakou, Hengshui, and Baoding. In particular, it reached 0.39 t/ha in Handan, Langfang, and Cangzhou; however, it was the least in Tianjin, reaching only 0.28 t/ha. By contrast, the carbon sink per unit land area under the target scenario was still the highest in Qinhuangdao, reaching 1.61 ton/ha. Meanwhile, it reached between 1.2 and 1.5 tons/ha in eight cities, including Xingtai, Hengshui, Shijiazhuang, Tangshan, Chengde, Beijing, Cangzhou, and Handan. The carbon sink per unit land in Cangzhou and Hengshui improved significantly under the target scenario compared to that under the baseline scenario. In particular, it was between 1 and 1.2 tons/ha in Langfang, Baoding, and Zhangjiakou, and it remained the least in Tianjin, reaching only 0.97 tons/ha.

3.1.3. Carbon Sink Component

There was a very significant differentiation in the major components of land carbon sink among cities in the study area under the baseline and target scenarios. The major components of land carbon sink consisted of forest in Beijing, Baoding, Zhangjiakou, and Chengde, while it primarily included arable land and garden land in Shijiazhuang and Tangshan, and it mainly included arable land in Tianjin, Handan, Xingtai, Cangzhou, Langfang, and Hengshui. The carbon sink in the study area was therefore dominated by three land use types, namely forest, arable land, and garden land, which accounted for 94.2% and 98% of the total carbon sink of the study area under the baseline scenario and target scenario, respectively. There was also remarkable differentiation in the land use types that made major contributions to the upgrading process of the carbon sink per unit land area from the baseline scenario to the target scenario among these cities in the study area. Specifically, the main contributors were arable land, water bodies, wetland, and forest in most parts of the study area, including Tianjin, Qinhuangdao, Xingtai, Baoding, Chengde, Tangshan, and Cangzhou, while the main contributors in Qinhuangdao, Handan, and Hengshui were arable land, forest, and water bodies, respectively. Meanwhile, the main contributors were primarily arable land, water bodies, and wetland in Shijiazhuang and forest and arable land in Beijing.

3.2. Carbon Sink–Economic Carrying Capacity Index

There was remarkable differentiation in the carbon sink–economic carrying capacity index under the baseline scenario (Figure 4). The origin was (0.45, 34.4) and the quadrant positions of all other cities were determined according to their deviation from the origin. There was significant differentiation in the carbon sink–economic carrying capacity of these 13 cities in the study area, which were unevenly distributed in four quadrants. The results suggested most cities were distributed in the “III-low carbon sink-high GDP” zone, including Shijiazhuang, Tangshan, Chengde, Zhangjiakou, Qinhuangdao, and Xingtai, while only Beijing (0.53, 217.06) was distributed in the “I-high carbon sink-high GDP” zone, and only Tianjin (0.28, 119.8) was distributed in the “II-low carbon sink-high GDP” zone. By contrast, other cities were in the “IV-low carbon sink-low GDP” zone, including Handan, Langfang, Cangzhou, and Hengshui.
There was also remarkable differentiation in the carbon sink–economic carrying capacity under the target scenario (Figure 5), where the origin was (1.29, 34.4), and the results suggested the 13 cities in the study area were still distributed in the four quadrants under the target scenario. Specifically, most cities were also still distributed in the “Ⅲ-high carbon sink-low GDP” zone, including Shijiazhuang, Tangshan, Chengde, Zhangjiakou, Qinhuangdao, Xingtai, and Hengshui. Beijing (1.31, 217.06) was still distributed in the “I-high carbon sink-high GDP” zone, and Tianjin (0.97, 119.06) was still distributed in the “II-low carbon sink-high GDP” zone, while Handan, Langfang, and Cangzhou were in the “IV-low carbon sink-low GDP” zone. It is notable that Hengshui was upgraded from the IV zone to the III zone under the target scenario compared to that under the baseline scenario, while the other zones remained in the same zone. The improvement of the carbon sink–economic carrying capacity in Hengshui primarily resulted from the enhancement of the carbon sink carrying capacity, while the latter was mainly due to the increase in the carbon sink of arable land.
The results suggested various enhancement potentials for the carbon sink per unit land area in most cities of the study area, with Qinhuangdao serving as the benchmark city (1.61 ton/ha) (Table 3). The carbon sink per unit area of these cities can be enhanced in approximately two steps. Specifically, the first step is to upgrade from the carbon sink under the baseline scenario to that under the target scenario, and the second step is to upgrade from the latter to the level of the benchmark city. For example, the first step for Beijing is to upgrade the carbon sink per unit land area from 0.53 ton/ha under the baseline scenario to 1.31 ton/ha under the target scenario, and the second step is to further upgrade it to the level of the benchmark city, i.e., 1.61 ton/ha.
A hypothetical benchmark city of the carbon sink–economic carrying capacity in the study area can be established by taking the carbon sink per unit land area of Qinhuangdao as the horizontal coordinate and the GDP per unit land area of Beijing as the vertical coordinate under the baseline scenario (0.66, 217.06) and the target scenario (1.61, 217.06). Aiming at this hypothetical benchmark city, it is necessary to further improve the carbon sink capacity in Beijing and further improve the economic carrying capacity in Qinhuangdao, while it is necessary to further improve both the carbon sink capacity and economic carrying capacity in other cities.

3.3. Discussion

The land carbon sink estimated in this study is generally consistent with that in previous studies. For example, the carbon sink per unit land area in Chengde and Qinhuangdao with widespread forest under the baseline scenario reached 0.53 and 0.66 ton/ha, respectively, which is approximately consistent with the results of previous studies in China and around the world (e.g., 0.3–0.8 and 0.66 ton/ha) [32,33]. Additionally, the spatial distribution of the total carbon sink in this study is also generally consistent with the results in previous studies [34,35]. Specifically, the total carbon sink was higher in the northern and northwest parts of the study area and lower in the middle and southern parts of the study area, showing remarkable spatial differentiation. In fact, there is generally widespread forest and grassland with high vegetation coverage and higher carbon sink per unit land area in these mountainous areas, with complex terrain in the northern and northwest parts of the study area, e.g., the Bashang Plateau, the Northern Hebei Mountains, and the Taihang Mountains in Zangjiakou and Chengde [34], while there is widespread arable land with relatively lower carbon sink per unit land area in the middle and southern parts of the study area [34]. In particular, there is widespread construction land in these areas, such as Beijing, Tianjin, and coastal areas, the carbon emission per unit land area of which is far higher than the carbon sink per unit land area of the arable land, leading to a core–periphery spatial pattern of carbon emission centering in Beijing–Tianjin–Tangshan [35,36].
There are also some differences between the results of this study and previous studies, which may be primarily due to the differences in the data sources and parameter settings. For example, most previous studies generally used land use data with a spatial resolution of 1 km, which were generally provided by the Data Center for Resources and Environmental Sciences (http://www.resdc.cn, accessed on 28 May 2023) [2,34,36]. By contrast, this study used the land use data derived from the dataset of the Third National Land Survey, with the spatial resolutions of 1 m and even 0.2 m, which are much higher than that of previous studies. Additionally, there are also some differences in the carbon sink settings of the same land use types between this study and some previous studies. For example, some previous study considered arable land as a carbon source [36], while this study took arable land as a carbon sink, which is consistent with the fact that arable land is generally a weak carbon sink [24,37]. Meanwhile, this study took water bodies into account, which were not involved in some previous studies [36]. In addition, this study used the carbon absorption coefficient method, which is consistent with most previous studies, but there is inevitably some limitation of this method. For example, the carbon sink coefficients were set across different land use types, without consideration of the difference of the carbon sink intensity within the same land use types with different vegetation composition [34]. In fact, it is notable that the carbon sink coefficients of the same land use type may vary greatly in different regions, and it is necessary to carry out relevant research on the carbon sink coefficients according to the specific conditions of different regions [38]. Meanwhile, this study also ignored the variations in the carbon sink per unit land area across time, which can generally remain approximately stable during a long-term period but may vary greatly in a short-term period during some short-term disturbances, e.g., extreme climate change [39]. In fact, there was a risk of instability in the land carbon sink due to the impacts of climate change in a number of regions in the world, e.g., eastern Africa, India, and Southeast Asia [40]. In particular, there is strong wind and frequent drought in the spring in the northwest and northern parts of the study area, which can severely limit vegetation growth and consequently lead to the instability of the land carbon sinks [41]. Additionally, the carbon sink per unit land area of the forest varied along with the change in the age of stand [42], which was not considered in this study. In particular, there is a large amount of planted or secondary forest with considerable carbon sink potential after decades of reforestation in the northwest and northern parts of the study area [43,44], but there has been limited research on the carbon sink potential concerning tree growth relationships at fine spatial scales [45]. It is therefore necessary to carry out more in-depth research on changes in carbon sink per unit land area over time based on dynamic carbon sink coefficients and accurate vegetation types by integrating the data of vegetation types, crop types, and forest growth data so as to provide a better understanding of carbon sink enhancement potential in the future [34].

3.4. Management Implications

The urgency of increasing carbon sink varied among different cities in the study area, and proper measures should be taken according to the specific situation to increase carbon sink and ease the pressure of emission reductions so as to realize the strategic goal of “carbon neutrality”.
(1) There is a more urgent need for increasing the carbon sinks in Tianjin and Beijing, which may be met in three ways. First, carbon sinks can be increased through optimizing their structure and spatial layout. For example, it is helpful to increase carbon sinks by increasing the area proportion of garden land, forest, and wetland and controlling the expansion of construction land. The government should strengthen the spatial planning and use control of the national territory, and strictly abide by the red line of ecological protection, strictly control the occupation of ecological space, and stabilize the role of carbon sequestration in existing forest, grassland, wetland, soils, and so on [46]. Second, improving the carbon sink capacity can make some contributions to increasing the carbon sink. For example, adjustment of the planting structure and the multiple cropping index can effectively enhance the carbon sink coefficient of arable land and subsequently increase carbon sinks. Third, ecological restoration projects also provide an important way to increase carbon sinks, and expansion of the green space in urban construction land can play an important role in increasing carbon sinks. For example, the carbon sink coefficients of various land types can be increased through carrying out ecological restoration, thereafter leading to the increase in the total carbon sink.
(2) Some cities, including Shijiazhuang, Tangshan, Chengde, Qinhuangdao, and Xingtai in Hebei Province, should enhance their economic development without reducing their carbon sinks. These cities may achieve proper economic development and meanwhile enhance the carbon sink by optimizing the land carbon sink space and improving the carbon sink capacity. For example, although the carbon sink capacity of forest is higher than that of arable land, the latter lays an important foundation for guaranteeing food security, which is of great significance to the sustainable development of the whole study area. For example, arable land is the main source of carbon sinks for these cities in Hebei Province, which is conducive to realizing the goal of arable land protection. Only by steadily expanding agricultural production space and making every effort to improve the quality of arable land can the study area improve food production and increase carbon sinks at the same time. Additionally, these cities can also improve fruit production and forestry output value by combining the carbon sink improvement with the supply of ecosystem services such as soil and water conservation, headwater conservation, pollution purification. This can contribute to realizing the win–win situation of the carbon sink and ecosystem service development and subsequently improving the economic carrying capacity per unit land.
(3) Other cities, including Handan, Langfang, Cangzhou, Hengshui, Baoding, and Zhangjiakou in Hebei Province, can synchronize their carbon sink improvement with their economic development by improving their carbon sink capacity. In addition to improving the carbon sink capacity and economic output per unit land area, these cities should further improve the economic output capacity per unit land area in the existing construction land. In particular, Zhangjiakou is an essential ecological barrier of the Beijing–Tianjin–Hebei Region, and the government should further implement major ecological protection and restoration projects for the integrated protection and restoration of mountain, water, forest, field, lake, grassland, and sand land [46,47]. The government should also implement forest quality improvement projects to continuously increase the area and volume of forests, and carry out arable land quality improvement actions to enhance the carbon sinks of ecological agriculture [48].

4. Conclusions

There is an urgent need for revealing the differentiation of carbon sink enhancement potential in the Beijing–Tianjin–Hebei Region, which is an important ecosystem sink project region in China. This study has focused on estimating the regional carbon sink and revealing the differentiation of carbon sink enhancement potential in this region based on the carbon sink–economic carrying capacity index matrix. The results of this study can lay a firm foundation for enhancing regional carbon sink and promoting ecological civilization construction and synergistic development of this region. The major conclusions of this study were as follows: (1) There was significant differentiation in the carbon sinks of different cities in the Beijing–Tianjin–Hebei Region. Chengde and Zhangjiakou had the highest total carbon sinks under the baseline scenario, reaching 2,056,400 and 1,528,300 tons, respectively, while Langfang and Hengshui had the least, which were below 500,000 tons. The largest contributions to carbon sinks in the study area were mainly from arable land, garden land, and forest, accounting for 94.2% and 98% of the total carbon sink of the study area under the baseline scenario and target scenario, respectively. (2) There was also remarkable differentiation in the carbon sink per unit land area among different cities in the study area. Qinhuangdao had the highest carbon sink per unit land area, reaching 0.66 ton/ha under the baseline scenario, while Tianjin had the lowest one, reaching only 0.28 t/ha. Optimizing the spatial distribution of land carbon sink is an important way to improve regional carbon sink. (3) A hypothetical benchmark city of the carbon sink–economic carrying capacity can be constructed according to the carbon sink per unit land area of Qinhuangdao and the GDP per unit land area of Beijing. In comparison with this benchmark city, there is potential for carbon sink enhancement by improving the carbon sink capacity in Beijing, promoting the economic carrying capacity in Qinhuangdao, and improving both their carbon sink capacity and their economic carrying capacity in the other cities of the study area.

Author Contributions

Conceptualization, H.Y.; Methodology, X.J.; Software, Z.L.; Validation, Z.Q. (Zhiguo Qi); Formal analysis, Z.Q. (Zhiguo Qi) and X.J.; Resources, Z.L.; Writing—original draft, H.Y.; Writing—review & editing, S.Z. and Z.Q. (Zhanfei Qin); Visualization, Z.Q. (Zhanfei Qin); Project administration, S.Z. All authors have read and agreed to the published version of the manuscript.

Funding

This study was funded by the 333 Talent Project of Hebei Province (C20221028), Youth Top Talent Program of Hebei Education Department (BJ2019045), Natural Science Foundation of Hebei Province (G2023403002, D2020403067), Major Project of Humanities and Social Science Research of Hebei Education Department (ZD201907), and Hebei Province Key Research and Development Program of China (21374201D).

Institutional Review Board Statement

Not applicable.

Informed Consent Statement

Not applicable.

Data Availability Statement

The original contributions presented in the study are included in the article, further inquiries can be directed to the corresponding author.

Conflicts of Interest

The authors declare no conflicts of interest.

References

  1. Sun, L.-L.; Cui, H.-J.; Ge, Q.-S. Will China achieve its 2060 carbon neutral commitment from the provincial perspective? Adv. Clim. Chang. Res. 2022, 13, 169–178. [Google Scholar] [CrossRef]
  2. Huang, Y.; Li, Z.; Shi, M. Prediction of plant carbon sink potential in Beijing-Tianjin-Hebei region of China. Environ. Dev. Sustain. 2022, 26, 3529–3556. [Google Scholar] [CrossRef]
  3. Qiu, S.; Fang, M.; Yu, Q.; Niu, T.; Liu, H.; Wang, F.; Xu, C.; Ai, M.; Zhang, J. Study of spatialtemporal changes in Chinese forest eco-space and optimization strategies for enhancing carbon sequestration capacity through ecological spatial network theory. Sci. Total Environ. 2022, 859, 160035. [Google Scholar] [CrossRef] [PubMed]
  4. Liang, S.; Hurteau, M.D.; Westerling, A.L. Potential decline in carbon carrying capacity under projected climate-wildfire interactions in the Sierra Nevada. Sci. Rep. 2017, 7, 2420. [Google Scholar] [CrossRef] [PubMed]
  5. Yu, Z.; Lin, Q.; Huang, C. Re-measurement of agriculture green total factor productivity in China from a carbon sink perspective. Agriculture 2022, 12, 2025. [Google Scholar] [CrossRef]
  6. Ye, M.; Deng, F.; Yang, L.; Liang, X. Evaluation of regional low-carbon circular economy development: A case study in Sichuan province, China. Int. J. Clim. Chang. Strateg. Manag. 2022, 14, 54–77. [Google Scholar] [CrossRef]
  7. Roxburgh, S.; Wood, S.; Mackey, B.; Woldendorp, G.; Gibbons, P. Assessing the carbon sequestration potential of managed forests: A case study from temperate Australia. J. Appl. Ecol. 2006, 43, 1149–1159. [Google Scholar] [CrossRef]
  8. Zhang, X.; Brandt, M.; Yue, Y.; Tong, X.; Wang, K.; Fensholt, R. The carbon sink potential of southern China after two decades of afforestation. Earth’s Future 2022, 10, e2022EF002674. [Google Scholar] [CrossRef]
  9. Wu, H.; Guo, S.; Guo, P.; Shan, B.; Zhang, Y. Agricultural water and land resources allocation considering carbon sink/source and water scarcity/degradation footprint. Sci. Total Environ. 2022, 819, 152058. [Google Scholar] [CrossRef]
  10. Xiang, S.; Wang, Y.; Deng, H.; Yang, C.; Wang, Z.; Gao, M. Response and multi-scenario prediction of carbon storage to land use/cover change in the main urban area of Chongqing, China. Ecol. Indic. 2022, 142, 109205. [Google Scholar] [CrossRef]
  11. Zhang, C.-Y.; Zhao, L.; Zhang, H.; Chen, M.-N.; Fang, R.-Y.; Yao, Y.; Zhang, Q.-P.; Wang, Q. Spatial-temporal characteristics of carbon emissions from land use change in Yellow River Delta region, China. Ecol. Indic. 2022, 136, 108623. [Google Scholar] [CrossRef]
  12. Yan, H.; Guo, X.; Zhao, S.; Yang, H. Variation of net carbon emissions from land use change in the Beijing-Tianjin-Hebei region during 1990–2020. Land 2022, 11, 997. [Google Scholar] [CrossRef]
  13. Read, D.; Beerling, D.; Cannell, M.; Cox, P.; Curran, P.; Grace, J.; Ineson, P.; Jarvis, P.; Malhi, Y.; Powlson, D.; et al. The Role of Land Carbon Sinks in Mitigating Global Climate Change; Royal Society: London, UK, 2001; pp. 1–27. [Google Scholar]
  14. Zhang, H.; Yang, Q.; Zhang, H.; Zhou, L.; Chen, H. Optimization of land use based on the source and sink landscape of ecosystem services: A case study of fengdu county in the three gorges reservoir area, China. Land 2021, 10, 1242. [Google Scholar] [CrossRef]
  15. Liu, Y.; Zhou, Y. Territory spatial planning and national governance system in China. Land Use Policy 2021, 102, 105288. [Google Scholar] [CrossRef]
  16. Hurlimann, A.; Moosavi, S.; Browne, G.R. Urban planning policy must do more to integrate climate change adaptation and mitigation actions. Land Use Policy 2021, 101, 105188. [Google Scholar] [CrossRef]
  17. Yue, W.; Hou, B.; Ye, G.; Wang, Z. China’s land-sea coordination practice in territorial spatial planning. Ocean Coast. Manag. 2023, 237, 106545. [Google Scholar] [CrossRef]
  18. Wu, J.; Li, B. Spatio-temporal evolutionary characteristics of carbon emissions and carbon sinks of marine industry in China and their time-dependent models. Mar. Policy 2022, 135, 104879. [Google Scholar] [CrossRef]
  19. Ying, J.; Jiang, J.; Wang, H.; Liu, Y.; Gong, W.; Liu, B.; Han, G. Analysis of the income enhancement potential of the terrestrial carbon sink in China based on remotely sensed data. Remote Sens. 2023, 15, 3849. [Google Scholar] [CrossRef]
  20. Fu, B.; Liu, Y.; Meadows, M.E. Ecological restoration for sustainable development in China. Natl. Sci. Rev. 2023, 10, nwad033. [Google Scholar] [CrossRef] [PubMed]
  21. Liu, G.; Cai, B.; Li, Q.; Zhang, X.; Ouyang, T. China’s pathways of CO2 capture, utilization and storage under carbon neutrality vision 2060. Carbon Manag. 2022, 13, 435–449. [Google Scholar] [CrossRef]
  22. Meng, Z.; Li, W.-B.; Chen, C.; Guan, C. Carbon Emission Reduction Effects of the Digital Economy: Mechanisms and Evidence from 282 Cities in China. Land 2023, 12, 773. [Google Scholar] [CrossRef]
  23. Chen, J.; Gao, M.; Cheng, S.; Hou, W.; Song, M.; Liu, X.; Liu, Y.; Shan, Y. County-level CO2 emissions and sequestration in China. Sci. Data 2020, 7, 391. [Google Scholar] [CrossRef]
  24. Wu, L.; Zhang, Y.; Luo, G.; Chen, D.; Yang, D.; Yang, Y.; Tian, F. Characteristics of vegetation carbon sink carrying capacity and restoration potential of China in recent 40 years. Front. For. Glob. Chang. 2023, 6, 1266688. [Google Scholar] [CrossRef]
  25. Hou, W.; Zhai, L.; Walz, U. Identification of spatial conservation and restoration priorities for ecological networks planning in a highly urbanized region: A case study in Beijing-Tianjin-Hebei, China. Ecol. Eng. 2023, 187, 106859. [Google Scholar] [CrossRef]
  26. Wang, C.; Zhan, J.; Chu, X.; Liu, W.; Zhang, F. Variation in ecosystem services with rapid urbanization: A study of carbon sequestration in the Beijing–Tianjin–Hebei region, China. Phys. Chem. Earth Parts A/B/C 2019, 110, 195–202. [Google Scholar] [CrossRef]
  27. Fu, H.; Zhao, S.; Liao, C. Spatial governance of Beijing-Tianjin-Hebei urban agglomeration towards low-carbon transition. China Agric. Econ. Rev. 2022, 14, 774–798. [Google Scholar] [CrossRef]
  28. Ding, H.; Wang, Z.; Huang, C.; Liu, L.; Bedra, K.B. Carbon pressure and economic growth in the urban agglomeration in the Middle Reaches of the Yangtze River: A study on decoupling effect and driving factors. Sustainability 2023, 15, 7862. [Google Scholar] [CrossRef]
  29. Wang, S.; Wang, Y.; Zhou, C.; Wang, X. Projections in Various Scenarios and the Impact of Economy, Population, and Technology for Regional Emission Peak and Carbon Neutrality in China. Int. J. Environ. Res. Public Health 2022, 19, 12126. [Google Scholar] [CrossRef] [PubMed]
  30. Wang, X.; Wang, K.; Zhang, Y.; Gao, J.; Xiong, Y. Impact of Climate on the Carbon Sink Capacity of Ecological Spaces: A Case Study from the Beijing–Tianjin–Hebei Urban Agglomeration. Land 2023, 12, 1619. [Google Scholar] [CrossRef]
  31. Guo, M.; Meng, J. Exploring the driving factors of carbon dioxide emission from transport sector in Beijing-Tianjin-Hebei region. J. Clean. Prod. 2019, 226, 692–705. [Google Scholar] [CrossRef]
  32. Hubau, W.; Lewis, S.L.; Phillips, O.L.; Affum-Baffoe, K.; Beeckman, H.; Cuní-Sanchez, A.; Daniels, A.K.; Ewango, C.E.; Fauset, S.; Mukinzi, J.M. Asynchronous carbon sink saturation in African and Amazonian tropical forests. Nature 2020, 579, 80–87. [Google Scholar] [CrossRef]
  33. Yang, Y.; Shi, Y.; Sun, W.; Chang, J.; Zhu, J.; Chen, L.; Wang, X.; Guo, Y.; Zhang, H.; Yu, L. Terrestrial carbon sinks in China and around the world and their contribution to carbon neutrality. Sci. China Life Sci. 2022, 65, 861–895. [Google Scholar] [CrossRef]
  34. Yu, Y.; Guo, B.; Wang, C.; Zang, W.; Huang, X.; Wu, Z.; Xu, M.; Zhou, K.; Li, J.; Yang, Y. Carbon storage simulation and analysis in Beijing-Tianjin-Hebei region based on CA-plus model under dual-carbon background. Geomat. Nat. Hazards Risk 2023, 14, 2173661. [Google Scholar] [CrossRef]
  35. Xia, S.; Yang, Y. Examining spatio-temporal variations in carbon budget and carbon compensation zoning in Beijing-Tianjin-Hebei urban agglomeration based on major functional zones. J. Geogr. Sci. 2022, 32, 1911–1934. [Google Scholar] [CrossRef]
  36. Wang, C.; Zhan, J.; Zhang, F.; Liu, W.; Twumasi-Ankrah, M.J. Analysis of urban carbon balance based on land use dynamics in the Beijing-Tianjin-Hebei region, China. J. Clean. Prod. 2021, 281, 125138. [Google Scholar] [CrossRef]
  37. Fang, J.; Guo, Z.; Piao, S.; Chen, A. Terrestrial vegetation carbon sinks in China, 1981–2000. Sci. China Ser. D Earth Sci. 2007, 50, 1341–1350. [Google Scholar] [CrossRef]
  38. Li, M.; Liu, H.; Yu, S.; Wang, J.; Miao, Y.; Wang, C. Estimating the decoupling between net carbon emissions and construction land and its driving factors: Evidence from Shandong province, China. Int. J. Environ. Res. Public Health 2022, 19, 8910. [Google Scholar] [CrossRef] [PubMed]
  39. Ruehr, S.; Keenan, T.F.; Williams, C.; Zhou, Y.; Lu, X.; Bastos, A.; Canadell, J.G.; Prentice, I.C.; Sitch, S.; Terrer, C. Evidence and attribution of the enhanced land carbon sink. Nat. Rev. Earth Environ. 2023, 4, 518–534. [Google Scholar] [CrossRef]
  40. Fernández-Martínez, M.; Peñuelas, J.; Chevallier, F.; Ciais, P.; Obersteiner, M.; Rödenbeck, C.; Sardans, J.; Vicca, S.; Yang, H.; Sitch, S. Diagnosing destabilization risk in global land carbon sinks. Nature 2023, 615, 848–853. [Google Scholar] [CrossRef] [PubMed]
  41. Reichstein, M.; Bahn, M.; Ciais, P.; Frank, D.; Mahecha, M.D.; Seneviratne, S.I.; Zscheischler, J.; Beer, C.; Buchmann, N.; Frank, D.C. Climate extremes and the carbon cycle. Nature 2013, 500, 287–295. [Google Scholar] [CrossRef]
  42. Heinrich, V.H.; Dalagnol, R.; Cassol, H.L.; Rosan, T.M.; de Almeida, C.T.; Silva Junior, C.H.; Campanharo, W.A.; House, J.I.; Sitch, S.; Hales, T.C. Large carbon sink potential of secondary forests in the Brazilian Amazon to mitigate climate change. Nat. Commun. 2021, 12, 1785. [Google Scholar] [CrossRef]
  43. Tong, X.; Brandt, M.; Yue, Y.; Ciais, P.; Rudbeck Jepsen, M.; Penuelas, J.; Wigneron, J.-P.; Xiao, X.; Song, X.-P.; Horion, S. Forest management in southern China generates short term extensive carbon sequestration. Nat. Commun. 2020, 11, 129. [Google Scholar] [CrossRef]
  44. Qubaja, R.; Grünzweig, J.M.; Rotenberg, E.; Yakir, D. Evidence for large carbon sink and long residence time in semiarid forests based on 15 year flux and inventory records. Glob. Chang. Biol. 2020, 26, 1626–1637. [Google Scholar] [CrossRef]
  45. He, G.; Zhang, Z.; Zhu, Q.; Wang, W.; Peng, W.; Cai, Y. Estimating carbon sequestration potential of forest and its influencing factors at fine spatial-scales: A case study of Lushan City in Southern China. Int. J. Environ. Res. Public Health 2022, 19, 9184. [Google Scholar] [CrossRef]
  46. Lin, J.; Nie, J.; Wang, T.; Yue, X.; Cai, W.; Liu, Y.; Zhang, Q. Towards carbon-neutral sustainable development of China. Environ. Res. Lett. 2023, 18, 060201. [Google Scholar] [CrossRef]
  47. Liu, Z.; Deng, Z.; He, G.; Wang, H.; Zhang, X.; Lin, J.; Qi, Y.; Liang, X. Challenges and opportunities for carbon neutrality in China. Nat. Rev. Earth Environ. 2022, 3, 141–155. [Google Scholar] [CrossRef]
  48. Qiu, S.; Yu, Q.; Niu, T.; Fang, M.; Guo, H.; Liu, H.; Li, S.; Zhang, J. Restoration and renewal of ecological spatial network in mining cities for the purpose of enhancing carbon sinks: The case of Xuzhou, China. Ecol. Indic. 2022, 143, 109313. [Google Scholar] [CrossRef]
Figure 1. Location of the Beijing–Tianjin–Hebei Region.
Land 13 00375 g001
Figure 2. Total carbon sink under the baseline scenario and target scenario (tons).
Land 13 00375 g002
Figure 3. Carbon sink per unit land area under the baseline scenario and target scenario (tons/ha).
Land 13 00375 g003
Figure 4. Carbon sink–economic carrying capacity index under the baseline scenario: the horizontal coordinate is the carbon sink carrying capacity ( C A n / L D ) (unit: tons/ha), and the vertical coordinate is the economic carrying capacity (GDP/LD) (unit: ten thousand CNY/ha).
Land 13 00375 g004
Figure 5. Carbon sink–economic carrying capacity index under the target scenario: the horizontal coordinate is the carbon sink carrying capacity ( C A n / L D ) (unit: ton/ha), and the vertical coordinate is the economic carrying capacity (GDP/LD) (unit: ten thousand CNY/ha).
Land 13 00375 g005
Table 1. Socio-economic data and land area of the Beijing–Tianjin–Hebei Region in 2019.
CitiesGDP
(CNY 100 Million)
Land Area
(Ten Thousand Hectares)
GDP/LD
(CNY Ten Thousand Per Hectare)
Beijing35,371.3162.96217.06
Tianjin14,104.3117.73119.80
Shijiazhuang3546.6138.225.66
Tangshan3552.6140.0325.37
Qinhuangdao772.776.8110.06
Handan1435.011912.06
Xingtai379.6122.963.09
Baoding1490.3219.026.80
Zhangjiakou760.0364.742.08
Chengde383.0390.110.98
Cangzhou984.7141.276.97
Langfang726.563.7811.39
Hengshui514.387.755.86
Table 2. Carbon sink coefficients of different land use types.
Land Use TypesCarbon Sink Coefficients (ton/ha·a)
Arable land0.422–1.16
Wetland0.67–2.36
Garden land2.10
Forest0.58–0.87
Grassland0.02
Water bodies0.30–0.67
Table 3. Carbon sink per unit land area of each city under the baseline scenario and target scenario in 2019 (unit: ton/ha).
CitiesCarbon Sink per Unit Land Area under the Baseline ScenarioCarbon Sink per Unit Land Area under the Target ScenarioDifference between the Baseline Scenario and Target ScenarioDifference from the Level of the Benchmark City
Beijing0.531.310.780.30
Tianjin0.280.970.690.64
Shijiazhuang0.491.340.850.27
Tangshan0.471.350.880.26
Qinhuangdao0.661.610.950.00
Handan0.391.220.830.39
Xingtai0.481.410.930.20
Baoding0.411.170.760.44
Zhangjiakou0.421.160.740.45
Chengde0.531.350.820.26
Cangzhou0.391.280.890.33
Langfang0.391.190.800.42
Hengshui0.421.360.940.25
Disclaimer/Publisher’s Note: The statements, opinions and data contained in all publications are solely those of the individual author(s) and contributor(s) and not of MDPI and/or the editor(s). MDPI and/or the editor(s) disclaim responsibility for any injury to people or property resulting from any ideas, methods, instructions or products referred to in the content.

