Article

Evaluate Human Perception of the Built Environment in the Metro Station Area

1
School of Architecture and Design, Beijing Jiaotong University, Beijing 100044, China
2
School of Design and Art, Beijing Institute of Technology, Beijing 100081, China
3
Institute of Remote Sensing and Geographic Information System, Peking University, Beijing 100084, China
4
China Academy of Urban Planning and Design, Beijing 100044, China
*
Author to whom correspondence should be addressed.
Land 2024, 13(1), 90; https://doi.org/10.3390/land13010090
Submission received: 23 October 2023 / Revised: 6 January 2024 / Accepted: 9 January 2024 / Published: 12 January 2024
(This article belongs to the Topic Urban Land Use and Spatial Analysis)

Abstract

:
Transit-oriented development (TOD) has become a dominant form of spatial planning and land use in large cities internationally. As the intersections of urban space and rail transportation, metro station areas play a key public service function in the lives of city residents. Based on the “5D” index and Node-Place theory in the metro station area, current research on the built environment in metro station areas focuses on improving the economic and transportation efficiency while neglecting public perception of the construction of station space. Sentiments, as an important part of the individual’s perception, are closely related to the built environment. Therefore, this study takes 187 metro stations within the fifth ring road of Beijing, China, as an example and extracts public sentiment information from social media data using a wide range of natural language processing techniques to quantitatively analyze the distribution of the public’s sentiment characteristics (including intensity, polarity, and category) in the metro station area and deeply explores the spatial correlation with the distribution of the objective built environment elements. The study shows that influenced by the spatial design of the metro station, density, land use functions, etc., the sentiment intensity of the station area within the Fifth Ring Road of Beijing is “strong in the east and weak in the west, strong in the north and weak in the south”, and the sentiment polarity has the characteristic of gradually negative from inside to outside in a circular pattern. Synthesizing the sentiment perception in the metro station area, our study further divided the Beijing metro station area into four major categories and eight specific subtypes.

1. Introduction

In the early 1990s, based on profound reflections on traffic congestion and suburban sprawl in large cities, Peter Calthorpe first proposed the TOD (Transit-Oriented Development) model. Calthorpe pointed out that the TOD is a land use strategy that promotes non-motorized travel, the meaning of which can be summarized as the mixing of commercial, residential, retail, and office spaces in a city within a walkable distance from public transportation stations, making it convenient for residents and employees to take public transportation, bike, walk, etc. [1]. After the TOD concept was proposed, it has been widely applied and practiced in the sustainable planning and construction of big cities around the world. It has become an important model for solving traffic congestion in big cities, driving effective urban land use and development, and promoting sustainable urban development. Based on the TOD concept, many large cities and megacities have gradually built up a public transportation-oriented urban spatial structure, guiding the organic integration of transportation facilities with various urban functions.
Under the guidance of the TOD concept, the metro station area which contains a station node as the core and a certain radius around the site, plays an increasingly important role in urban space. Compared with other non-nodal spaces in the city, the metro station area has a more significant value, characterized by high traffic flow, high accessibility, and high integration of urban public services and urban functions. In 1997, the American scholar Cervero, through the study of TOD in the San Francisco Bay Area, summarized and proposed a “3D” index for the built environment of rail transit stations and their surrounding area, quantifying the built environment characteristics of metro stations area in three dimensions: density, diversity, and design and laying the foundation for the precise development of metro station area [2]. In recent years, experts and scholars all over the world, along with examples of urban metro station area construction, have further revealed the intrinsic correlation between the built environment characteristics of metro station areas and the comprehensive effectiveness of TOD. Based on this, optimization strategies are proposed for the land use and built environment of metro station areas to strengthen the integrated planning of rail transit stations and surrounding space, the comprehensive utilization of metro station areas, and promote the organic integration of transportation facilities and various urban functions.
At present, station area has gradually become an important carrier space for the residents of big cities through comprehensive development, and the construction and development of metro station area should not only consider its transportation and economic efficiency but also take into account the connection between the environment and public perception and sentiment. The latest research on public perception of urban space shows that compared with functional spaces such as urban scenic spots, as well as commercial and cultural leisure spaces, users are more likely to show negative emotions in urban transportation nodes and hospitals [3], meaning that the metro station area has already become the public sentiment nadir of the city. Based on the “5D” index and Node-Place theory in the metro station area, current research on the built environment in metro station areas focuses on improving the economic and transportation efficiency while neglecting public perception of the construction of station space. Further exploring the human subjective perception characteristics is of great significance in promoting the construction of the built environment in the metro station area, enhancing the attractiveness, and optimizing the overall allocation of resources in urban space.
The interaction between humans and the environment has long been of great concern to scholars represented by environmental psychology, exploring human cognition, emotion, and behavior towards the environment, focusing on the influence of the environment on human psychology and behavior, as well as human subjective evaluation and experience of the environment. Based on studies in the environmental psychology field, it has been shown that emotion, as an important part of the individual’s perception of the environment, is closely related to the built environment as it is affected by the built environment and also influences the evaluation of the environment [4]. In the 21st century, social media data, represented by Twitter and Weibo, offers great opportunities to track the geographic location and releasing time of tweets information, and its textual information provides real-time opinions, sentiments, and activities of the users, reflecting the spontaneous and proactive social trend, which are widely explored in the latest researches to explain real-world social phenomena [5]. The data-driven studies about public sentiment have demonstrated the potential value of social media data in measuring the spatial features and elements of the built environment in cities. Meanwhile, the multidisciplinary integration academic environment also provides technical methodologies to accurately identify the public perception information embedded in massive social media data, becoming a powerful foundation to break through the traditional perception information collection dilemma [6]. Therefore, public perception evaluation research based on semantic analysis of social media texts has been gradually applied to multiple disciplines including urban and rural planning, psychology, and economics since 2012, providing a valuable public perspective for planning management and decision-making [7].
Beijing, the first city in China to develop urban rail transit, with 474 metro stations and up to 2.262 billion annual passengers in 2022, has already begun to aggregate a high density of population, jobs, services, and business types in the metro station area. Compared with other cities in China, it has a more mature metro station coverage, a larger flow of people served, and a stronger diversity of urban functions and public services. Therefore, this study takes 187 metro stations within the fifth ring road of Beijing, China, as an example to conduct an empirical quantitative study to evaluate the public sentiment distribution in the metro station areas and analyze the spatial correlation between sentiment distribution and build environment. Public emotions are obtained from social media data by using a wide range of natural language processing techniques, including data preprocessing, feature extraction, and sentiment classification. Through such a big data-driven approach, the specifics of emotional intensity, polarity, and different sentiment categories in the station area are obtained, constructing a systematic evaluation of the study area. Our work can provide meaningful advice and suggestions on the built environment for TOD-oriented urban planning and construction and also offers valuable reference experience for TOD development for other cities.
This paper is organized as follows: it begins with a contextual introduction of the background and meanings of public perception of the construction of the city metro station area. The section of the literature review reviews the foundations of the research: (a) Established research on the built environment of the metro station area. (b) Theoretical foundations and empirical research on the relationship between public sentiment and urban environments. Based on this, the data acquisition, description, analysis, and integration methods of this study are presented in the third section. The following two sections present the results of our empirical study. By taking 187 metro station areas in Beijing, our study illustrates the potential relationship between the built environment and public sentiment perception. It uses the k-means methodology to cluster and then make an evaluation. This paper concludes with suggestions to improve and optimize the built environment in the metro station area to achieve human-oriented development.

2. Literature Review

2.1. The Scope of the Metro Station Area

In response to the suburbanization caused by the prevalence of private cars in the United States at the beginning of the 20th century, Western scholars proposed several theoretical approaches to urban development, such as New Urbanism, of which the most representative one in the field of transportation is the TOD theory proposed by Calthorpe in his book ‘The Next American Metropolis: Ecology, Community, and the American Dream’ in 1993. TOD is a hybrid community development model, which is in a radius of about 400–800 m centered around transit stations or core commercial areas, aiming to limit the endless spread of urban boundaries. TOD theory, as an urban planning concept contrary to sprawl planning, has the real focus of establishing a livable built environment through the theory of sustainability and can apply to most metropolitan areas [8]. Over the years, the TOD pattern has been effective in alleviating urban issues such as traffic congestion, deterioration of old urban areas, and traffic mobility [9].
As major cities and megacities in the world have continuously improved the TOD construction mode, strengthened integrated planning of rail transit stations and surrounding space, and promoted the organic integration of transportation facilities and various urban functions, the metro station area has begun to receive widespread attention from numerous fields. The metro station area is the urban space around rail transit stations with an influence on human behavior and psychology and is also known as “urban rail station area”, “station influence area”, etc. In existing research, the metro station area is usually a circle scope with a rail station node as the center and a certain distance as the radius [10]. At present, there is no exact value for the definition of distance, and Calthorpe was the first to consider 400 m as the most appropriate radius of a rail station [1]; in 2014, the American scholar Guerra found that the 500 m radius will have a high level of public transport sharing rate [11]. Generally, scholars draw up the radius size and boundary shape of the metro station area according to the actual needs of the study, with some also calculating the walking distance in a certain time range of 5–15 min [12]. In summary, most related studies have chosen a circular area with a radius of 400–800 m from the rail station as the scope of their research [13,14] Table 1.

2.2. Research on the Built Environment of the Metro Station Area

As an important urban public space, the comprehensive impact of the built environment on the metro station area has long been the focus of scholars in different fields. Early studies of transport infrastructure projects mainly focused on their economic and social benefits on urban land use and development. In 1997, the American scholar Cervero pointed out that most metro station areas are compact, pedestrian and bicycle friendly, and adjacent to public space, while the sites are generally functional centers of the community [15]. The “3D” principle was further developed in an empirical study of the San Francisco Bay Area in the United States, showing positive effects on the development of the city. At the beginning of the 21st century, the theory of “smart growth theory” and TOD theory were learned and integrated, forming a compact land use pattern oriented to public transportation. Cevero gradually expanded the “3D” index to “5D” and “7D” [16] to quantify the built environment of metro station areas through “density”, “diversity”, “design”, “accessibility to destinations”, and “proximity to public transportation”, laying the foundation for quantitative research related to the built environment of the metro station area.
In recent years, on the one hand, related research focused on the optimization of the built environment of the metro station area based on “3D” and “5D” frameworks proposed by Cervero and the node-place model proposed by Bertolini [17] and mainly involving the contents of location and distance of the station node [18], the diversity of POI facilities [19], the land use [20], road network connectivity [21], and accessibility [22]; on the other hand, it involved many interdisciplinary fields, utilizing various big data and constructing evaluation indexes to quantitatively analysis TOD construction and development effectiveness in metro station area [23]. For example, urban economics focuses on the economic efficiency of metro station areas. The gravity model and hedonic price model are used to analyze the relationship between the built environment indicators and estate price, population characteristics [24], and other factors. In addition, with the increasing emphasis on sustainable development, a multi-scale geographical weighted regression model is constructed to explore the influencing factors such as traffic flow [25] and carbon emissions [26] on spatial ecological efficiency in the metro station area.
With the acceleration of urbanization and the increase in urban population, various urban diseases have become prominent in parallel with the significant improvement of people’s living standards. The correlation between the built environment of urban space and the mental health of residents has become an international hot issue. Tost et al. in Nature Neuroscience pointed out that a type of urban built environment with a character of high complexity, high heterogeneity, and high rate of change is the major stressed source affecting the public’s mental health [27], and it is well understood that the metro station area is the intersection of the urban functional space and the transport space, which is typical of the complexity characteristics [28]. In recent years, studies of public sentiment performance in urban spaces have also found that metro station areas have become a typical emotional low spot in urban spaces compared to other urban functional spaces such as commercial and cultural areas. An empirical study of city TOD in Indonesia and Sydney points out that public satisfaction with the construction of transportation infrastructure in metro station areas reflects the social benefits while existing studies tend to focus more on the economic benefits of rail lines [29]. Because of the neglect of public perception in the construction of the metro station area, it becomes a weak link in the current TOD development.

2.3. The Relationship between Public Sentiment and the Urban Environment
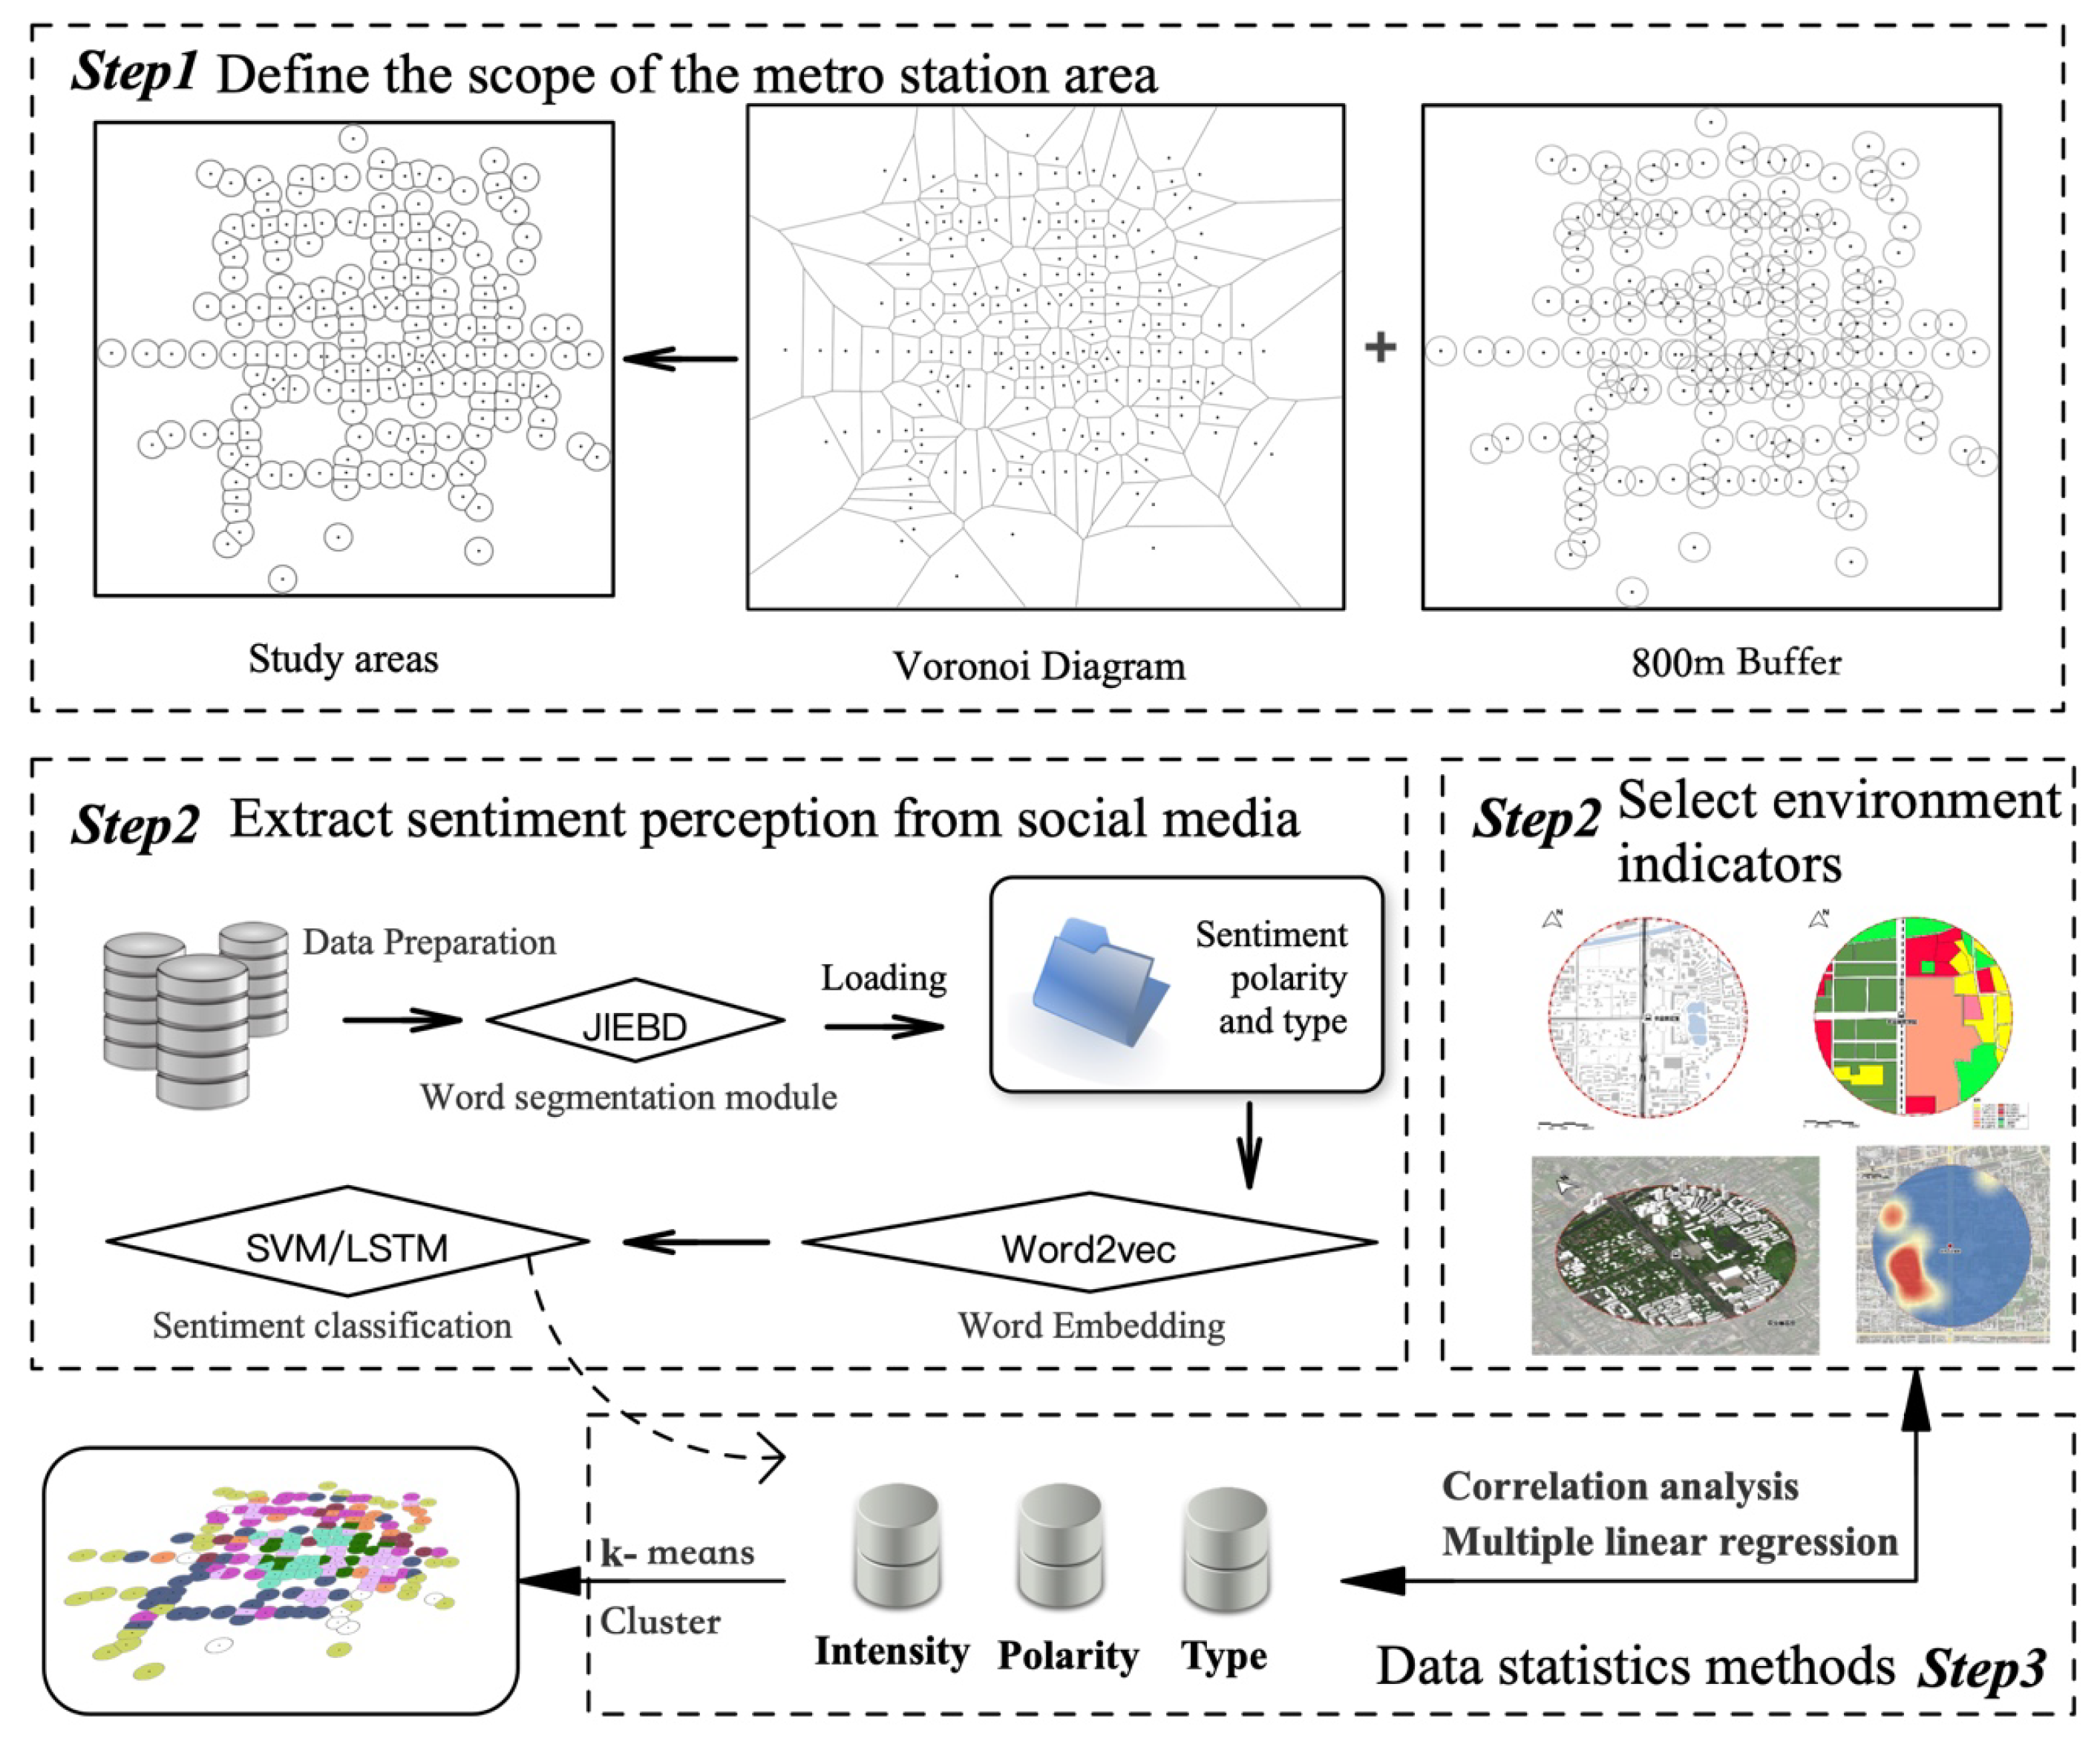
The urban built environment affects the public’s subjective perceptions, and research on the relationship between the above two can be traced back to the 1960s, which is a field that has been multidisciplinary from the beginning [30]. Many concepts in social sciences attempt to describe the interaction between humans and the environment [31]. Low and Altman [32] listed a range of concepts with various mixes of cognitive, affective and conative (i.e., behavioral) facets. Place attachment, place identity [33,34], and place dependence [35] are constructs that most often appear in environmental psychology literature. Shamai [36] has argued that these place concepts can be included under the umbrella term “sense of place”. Sense of place research encompasses a range of variables describing human-environment interactions. Theoretical models of the 21st-century attempt to quantify dimensions of sense of place [37,38]. Generally speaking, the current theory regarding sense of place can be organized into an overlapping four-dimensional model involving the physical environment, the psychology of the self, the sociocultural circumstances, and the course of time [39]. The self is largely based on theoretical models of environmental psychology that describe an individual’s sense of place as consisting of two affective aspects [40,41]. Jorgensen et al., using Attitude theory to provide a basis for the quantification of the sense of place, proposed that sense of place is a multidimensional construct involving affective, cognitive, and conative components [42]; “affective and emotion can be conceptualized as the felt and sensed reaction that arises in the midst of the (inter) corporal exchange between self and world” [43]. In summary, emotions are important components of an individual’s perception of place.
The field of psychology has long been concerned with the study of environmental influences on the causes, intensity, and different sentiment categories. Strongman, K. T. proposed the concept of emotion and stated that emotions potentially enter human-environment-behavioral practices through cognitive processes that are integral to the environment, and thus the influence of the environment on emotions is indisputable [44]. Environmental perception and contemporary perception theory state that rooms or cities can be friendly, frustrating, abhorrent, and trigger a variety of emotional states [45,46]. Environmental psychology focuses on how various sentiments occur. Mehrabian and Russell proposed that the three basic sentiment dimensions of “pleasure”, “arousal”, and “dominance” [47] effectively summarize the aspects of the environment that evoke sentiment, pointing out that the environment has a direct impact on an individual’s emotional state. Environmental aesthetics theory argues that once visual perception has occurred, the first response to the environment is sentiment [48]. At the individual level, based on an interactional-constructivist viewpoint and transactional perspective, in any person-environment episode, individuals engage in a knowing or a perceptual-cognitive process through which they acquire, synthesize, and integrate environmental information with internal sources of knowledge to form a contextual arena basis for experience and behavior. However, in the real world, the presence of norms or feeling rules leads to broad similarities in emotional responses to certain environments from a group perspective [49].
On the measure of sentiment, Collins concludes that sentiment can be measured and calculated for vectors, types and polarities, and intensity [50]. The vectors of sentiment can be text, audio, video, and images. The polarities of sentiment consist of neutral, positive, and negative categories, which can be further divided into different sentiment types. Intensity is often combined with specific polarities and types, which can be classified into different levels [51]. There are no agreed criteria for classifying sentiment; the American psychologist Ekman et al. found that human sentiments can be divided into the six most basic types of happiness, sadness, anger, fear, disgust, and surprise in a facial recognition and physiological monitoring research program [52]. Later, the American psychologist Plutchik added two sentiments of trust and expectation, constituting eight basic sentiment types, arguing that other complex sentiments are a mixture of the eight basic types [53]. However, generally speaking, intensity, polarity, and type are three important attributes that can measure public sentiment perceptions.
In recent years, massive social media data have entered the public view, which contains rich information on sentiment perception and personal opinions, making it possible to collect the perception of public groups in real-time and on a large scale. Twitter data are increasingly seen as a “social sensor” to better understand social phenomena in the real world [6]. With the rapid development of Internet technology, artificial intelligence techniques, deep learning algorithms, and the cross-development of brain and cognitive sciences [54], the accuracy of subjective information such as text, expressions, videos, and image, acquisition and analysis has also gradually increased [55,56]. Moreover, using computational techniques to obtain textual semantic information from social media data is more precise.
Twitter social media data are often a spontaneous expression reflecting the immediate experience of users. So, social media-based quantification of emotions does not reflect an individual’s internal emotional processes but rather an outward reflection of a group’s sentiment characteristic [57]. We are able to noninvasively, remotely sense the exhibited sentiment perception of very large numbers of people via their written, open, web-scale output [58]. Meanwhile, along with the promotion and popularization of GIS and other technology applications, the public perception and spatiotemporal behavior contained in social media data began to be more widely used in the analysis of urban built environments and the evaluation of spatial functional area distribution [3,59], becoming an important tool to improve urban quality. At regional and city scales, a National Pulse Project in the U.S. produced the first nationwide sentiment map combining Twitter data at Northeastern University [60], followed by a proliferation of related studies based on social media data, with Bertrand et al. finding that the most positive places for New York residents’ perception were parks and the most negative places were transportation facilities [61]. After conducting a thorough analysis of the geography of Twitter themes in London, Lansley and Longley [62] discovered that the subjects covered by tweets differed greatly depending on the time of day and type of land used in Inner London. Moreover, it is possible to classify urban land use types with some degree of accuracy by utilizing the movement patterns of Twitter users [63]. Based on users’ online assessments of locations, Quercia et al. (2014) suggested more emotionally charged route options for users instead of the shortest routes on map services [64].
Yang suggests that sentiment analysis of social media data can contribute to urban planning and policy in two ways. On the one hand, it serves as valuable social-spatial reference data to monitor and investigate various human-environment relationships in the urban space. On the other hand, it can provide a real-time reflection of the daily life status of urban residents, reflecting some parts of urban management that are often neglected [65]. Existing research on social media data has demonstrated the potential value of public sentiment characteristics for measuring key spatial features and built environment elements in cities and regions and also provided us with a methodology for big data-driven research on emotional distribution and built environment. Overall, based on the existing research on the built environment in the metro station area, this study takes 187 metro stations within the fifth ring road of Beijing, China, as an example and extracts public sentiment information from social media data using a wide range of natural language processing techniques to quantitatively analyze the distribution of the public’s sentiment characteristics (including intensity, polarity, and category) in the metro station area and deeply explores the spatial correlation with the distribution of the objective built environment elements. Finally, relying on the distribution patterns of the built environment and public sentiment, 187 transit station areas are clustered, and based on the classification, from a group perception perspective, suggestions are given, respectively, for the development and optimization of the built environment construction in the metro station area.

3. Method

The framework of the research methodology in this paper consists of three steps Figure 1. The first step is to define the scope of the metro station area based on the previous studies in reference. The second step is to select built environment indicators of the study area and extract sentiment perceptions from social media, which contain intensity, polarity, and percentages of six specific sentiment types: happy, excited, pleased, scared, disgusted, and anxious. In the third step, data analysis is used to further explore the relationship between the built environment and sentiment perception through correlation analysis and multiple linear regression analysis, with the k-means method applied to cluster and help evaluate a total of 187 Beijing metro station areas.

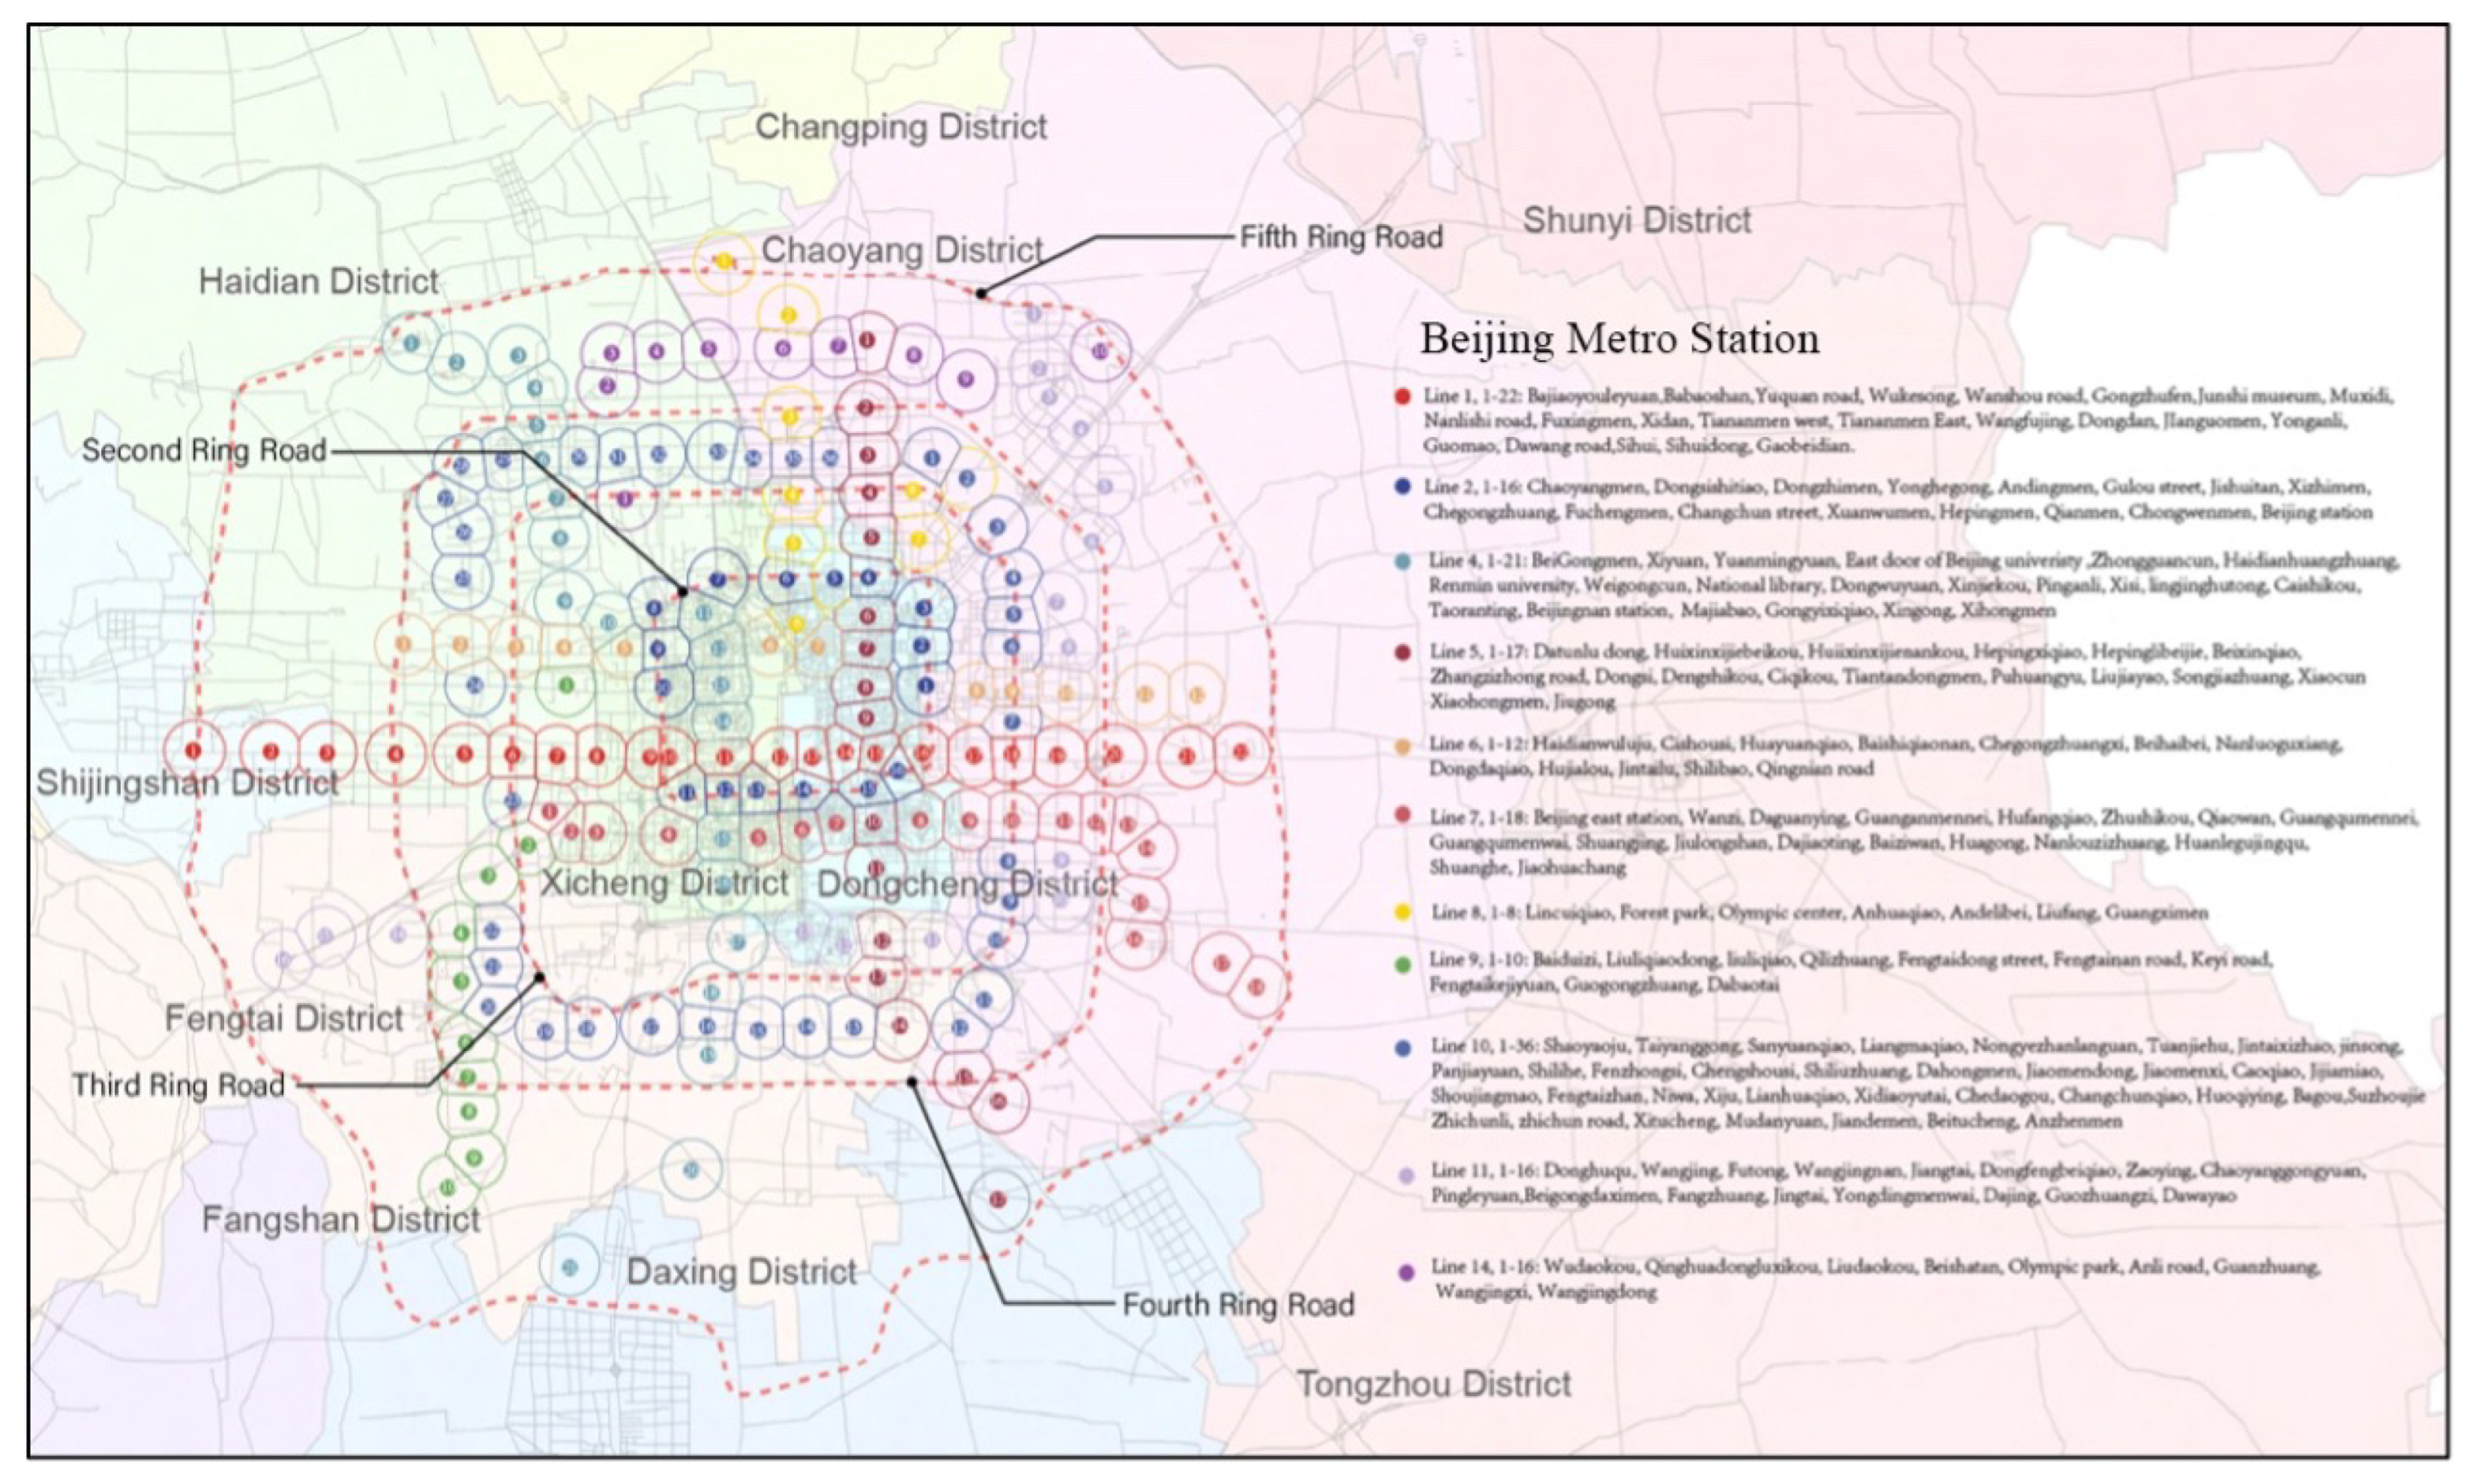
3.1. Define the Scope of the Metro Station Area

Beijing has 27 metro lines and 474 stations in operation in 2022, and the urban pattern is formed by a ring-shaped radial road network and shows a clear circle structure. Taking the Fifth Ring Road as the boundary, there are significant differences in urban morphology, with neatly arranged and high-density rail stations within the Fifth Ring Road and sparse and discrete stations outside the Fifth Ring Road. In addition, there is also a large difference in the established time of the metro stations inside and outside the Fifth Ring Road. Therefore, in order to ensure the comparability of the built environment, we chose all 186 metro stations inside the Fifth Ring Road as the preliminary study subjects of this paper. As for the scope of the metro station area, by combining the existing research on the spatial radiation range of the metro station a circular area with the station geometric hub as the center and a radius of 800 m is built. Due to the condition that some stations have overlapping coverage in the 800 m range of the station area, Voronoi polygons are used to further divide space to form separate station domains. Voronoi diagrams divide the surface on the principle of closest proximity and consist of a set of continuous polygons consisting of perpendicular bisectors of lines connecting two neighboring points, and are often used to segment space. Let p = p 1 , p 2 , , p n be a set of n ( 2 n ) distinct points in S which indicates a finite region of two-dimensional space, d p , p i is the Euclidean Distance from p to p i , then the Voronoi diagrams (OVP) can be described formally as
V p i = p p S ; d p , p i d p , p j , j i , j = 1 , , n ,
where V ( p i ) is the Voronoi region for a point p i , representing the geometric centers of 187 metro stations within Beijing’s Fifth Ring Road, the finalized scope of the study area is shown in Figure 2.

3.2. Select Built Environment Indicators of the Metro Station Area

To correlate the built environment of the metro station area with the subjective perception of the public, it is necessary to convert environmental characteristics into quantitative indicators. The most comprehensive and influential indicator system in the metro station area is the “5D” index proposed by Cervero et al. [2], which summarizes the built environment in categories of density, diversity, design, destination accessibility, and public transportation proximity. As mentioned in the previous section, the effectiveness of 5D indicators for the comprehensive evaluation of the built environment in the station area has been demonstrated through extensive use in many studies.
Because the main scope of the study is the station areas of urban rail transit, and the focus is on the correlation between the built environment of station areas and public sentiment perception in the urban built-up areas within the Fifth Ring Road, this study considers the actual situation to delete and expand the existing indicators. Firstly, because the study area is based on the 800 m buffer zone of the metro station, sample station areas have similar metro proximity and locational proximity, so both are excluded. Secondly, since the urban built-up areas within the Fifth Ring Road of Beijing were developed earlier, some of their functional facilities distribution does not match the actual land use situations. This paper removed the indicators related to land use attributes and used the distribution density of education, culture, medical, and other format POI points around the metro station area as the actual functional diversity of land use. The data of 216,216 Baidu POIs located within the metro station areas in 2019 were selected to represent land use diversity by including nine major categories: shopping centers, education, sports, hospitality, recreation, culture, living services, parks, and restaurants. Finally, considering that the influence of the number of station entrances and passenger flow also has a dynamic influence on the perception of the public sentiment, the indicators related to the station node itself are included. In summary, 21 indicators in six categories were formed to further quantify the built environment of the metro station area, Table 2.

3.3. Extract Sentiment Perception from Social Media

Social media data contain spatial location and public sentiment information, which needs to be processed in two main steps: text pre-processing and sentiment word extraction and classification [66]. Text pre-processing is a natural language processing technique of massive text data for word separation, removal of discontinued words, de-punctuation and blank characters, lexical annotation, etc. The classification techniques can be roughly divided into two categories: classification methods based on string matching such as JIEBA can divide the text according to the existing dictionaries, which has the advantages of simple and convenient operation and is the commonly used classification method for Chinese text but has certain limitations for ambiguous words and unregistered words. Sequential statistical models have better recognition ability for unregistered words, with the disadvantage of being complicated and difficult to operate, and representative models contain the NLPIR-ICTCLAS system of CAS and the LTP system of HUST [67].
Text processed by word separation can further extract the sentiment information. Currently, there are many effective methods such as SVM, KNN, and Bayesian classification for sentiment extraction. Mohammad et al. used a combination of SVM and SMO for sentiment analysis of Twitter text data [68], and Catal et al. used a combination of Bayesian and SVM to extract and classify sentiment elements in Turkey [69]. Previously, an increasing number of Nonlinear Programming Language (NPL) tasks have introduced LSTM methods [70,71]. Su et al. used the LSTM technique to extract and classify sentiment into seven categories, greatly improving the accuracy of traditional sentiment analysis [72].
Sina Weibo is currently the largest Chinese social media platform, and the “2020 Weibo User Development Report” mentions that people aged 18–40 are the main users of Weibo, with the number of users continuously expanding. Beijing, the capital of China, has 78.9% of the resident population aged 18–59 (CNNIC, 2021). The use rate of Weibos is among the highest in China and has a large coverage and representativeness, so this paper selects Sina Weibo data as the basis of public sentiment analysis. Weibo labeled data contain information about the geographic location of people, i.e., at that location, people use Weibo to post personal text messages, so the number of labeled data reflects the intensity of human activities at specific locations. Social media labeled data are now widely used to capture the intensity of social and economic activities and as a symbol of urban vitality [73,74,75]. Data were integrated into the matched metro station area based on geographic coordinate information of Weibo labeled data. The total number of Weibo labeled data per unit area of the station space was used as an indicator of the sentiment intensity of the metro station area, the more text information, the stronger the sentiment intensity of the metro station area. Sentiment polarity and the percentage of each type of sentiment need to be further analyzed by semantic analysis.

3.3.1. Data Preprocessing

Weibo dynamics labeled text from 1 to 30 April 2020 were cleaned to remove text that does not have valid subjective content such as repetitive advertisements, URLs, and numbers, thus removing deactivated words, punctuation, and blank characters and marking lexical information. Because of the characteristics of short length and novel vocabulary of Weibo labeled text, we chose the JIEBA word separation system (https://github.com/fxsjy/jieba (accessed on 1 May 2020)) to implement the above operations. After processing, a total of 145,567 valid Weibo labeled texts were obtained, including ID, posting time, latitude and longitude of the location, tweet text, and emojis.

3.3.2. Data Feature Extraction

After the data are pre-processed, they become a collection with vocabulary as the basic unit. Sentiment feature extraction involves annotating and extracting words with sentiment attributes from the vocabulary. The Word2Vec tool is applied to obtain the set of word vectors, and then the word frequency information statistics (TD-IDF) is run on the word separation results to extract the sentiment elements of the text.

3.3.3. Sentiment Classification

Sentiment classification is used to classify the extracted sentiment elements into several categories. In this study, we choose to use the sentiment classification method proposed by Gaoyong and his team [3], and the average accuracy of the results was 85%, reaching 96% on extremely polar sentiment. First, tweet data are identified with three polarities: positive, neutral, and negative, and then the sentiment is classified into six types: happy, excited, pleased, scared, disgusted, and anxious.
According to the classification results, we can get the polarity score of each metro station area, with a median score of 50, 49–51 points means polarity is not significant, and it is judged as neutral sentiment; 0–49 points indicate negative perception, and the lower the score, the more obvious the negative sentiment is; more than 51 points are positive perception, the higher the score, the more obvious the positive sentiment is. At the same time, we obtain the proportion of the six types of sentiments in the metro station area, i.e., happy, excited, pleased, scared, disgusted, and anxious. According to the geographic location information of labeled text, sentiment intensity, polarity, and six types of sentiment performance were correlated into 187 metro station areas, and it was found that eight stations without data information fell into it, including Xingu, Chengshousi, Xiaohongmen, Shuanghe, Xiaocun, Shilihe, Wanshoulu, and Bagou. In order to reduce the influence on the statistical analysis of data, the eight stations without sentiment information were removed, and finally, 178 stations were identified. In addition, there were no cases of COVID-19 infection in Beijing during the period when the data were obtained for this study, so the public’s sentiment expression was not related to the epidemic, but the methodology is also applicable to extract and analyze the public’s sentiment during the epidemic. The sentiment intensity, polarity, and the proportion of each type of sentiment in the metro station area were divided into ten levels with the natural breakpoint method and then a spatial visualization was made. The natural breakpoint method is a common data grouping method, that can comprehensively consider the span and range of data, maximizing the similarity of each group and the dissimilarity between different groups, and it can also take the number of data between groups into account, which is commonly used for the ranking of GDP in each province and city, etc.

3.4. Data Analysis Method

The arousal of public sentiment perception is the result of the combined effect of various built environment indicators. In order to explore the potential relationship between the built environment of metro station areas and the public sentiment intensity, polarity, and different sentiment types, and to conduct a comprehensive evaluation of Beijing metro station areas, this paper first uses correlation analysis to find the relationship between the built environment indicators and the sentiment attributes, then uses the multiple linear regression model to further explore the built environment’s influence on public perception. Finally, we used the k-means method to cluster the study area. The specific method is as follows.
Pearson correlation is used to describe the extent of linear correlation between two variables. It is suitable for two variables independent of each other, and the observations of the two variables should be paired. Pearson correlation coefficient is a common and robust choice, especially when the data can be deemed close to Gaussian (Hlinka et al., 2017 [76]). According to the method in reference [77,78], this paper uses Pearson correlation coefficients to measure the association of metro station area built environment indicators with sentiment intensity, polarity, and types, the Pearson correlation coefficient r is defined as
r = i = 1 n x i x ¯ y i y ¯ i = 1 n x i x ¯ 2 i = 1 n y i y ¯ 2
where x i and y i are the i-th sample values of variables X and Y, respectively; X represents indicators of the built environment in the metro station area, Y represents the sentiment attributes of the built environment in the metro station area; x ¯ y ¯ are the sample mean values and n is the number of observations; when P 0.1 , the variable X Y is considered to have a more statistically significant correlation, if r > 0, the two variable indicators are positively correlated, and the closer the value is to 1, the stronger the correlation is, r < 0 is negatively correlated, with the same variation relationship as above.
Based on correlation analysis, we utilize multiple regression models, with built environment indicators that exhibit significant correlations with sentiment attributes, as independent variables. Sentiment intensity and the percentage of six types of sentiment perception are used as dependent variables in the models.
The main aim of cluster analysis is to classify data into clusters with similar characteristics [79]. K-means clustering [80] is among the most widely used clustering analysis methods. K-means clustering analysis seeks to partition the n individuals in a set of multivariate data into K clusters. As a hard partitioning algorithm, K-means clustering analysis is an iterative process. It proceeds by selecting K initial cluster centers and refining them based on the minimization of a performance index [81,82]. Because the dimension of clustering indicators involved is different, the indicators are standardized before clustering. Let min A and max A be the minimum and maximum values, respectively, then map the original value x of A to the value x [0,1]. The standardized method is as follows:
x = x min A max A min A
Based on the standardized results of the built environment and the public sentiment perception data, 178 stations within the Fifth Ring Road of Beijing were divided into different clusters K, and the most optimal cluster group K was found using the Elbow method. In order to facilitate comparison, based on the indicators’ standardized results, the natural breakpoint method is still used to divide the index into 10 levels to establish spatial visualization. By visualizing the spatial distribution of public sentiment perception information, the study further analyzed and evaluated the heterogeneous effects of public perception under different built environments in the metro station area.

4. Results

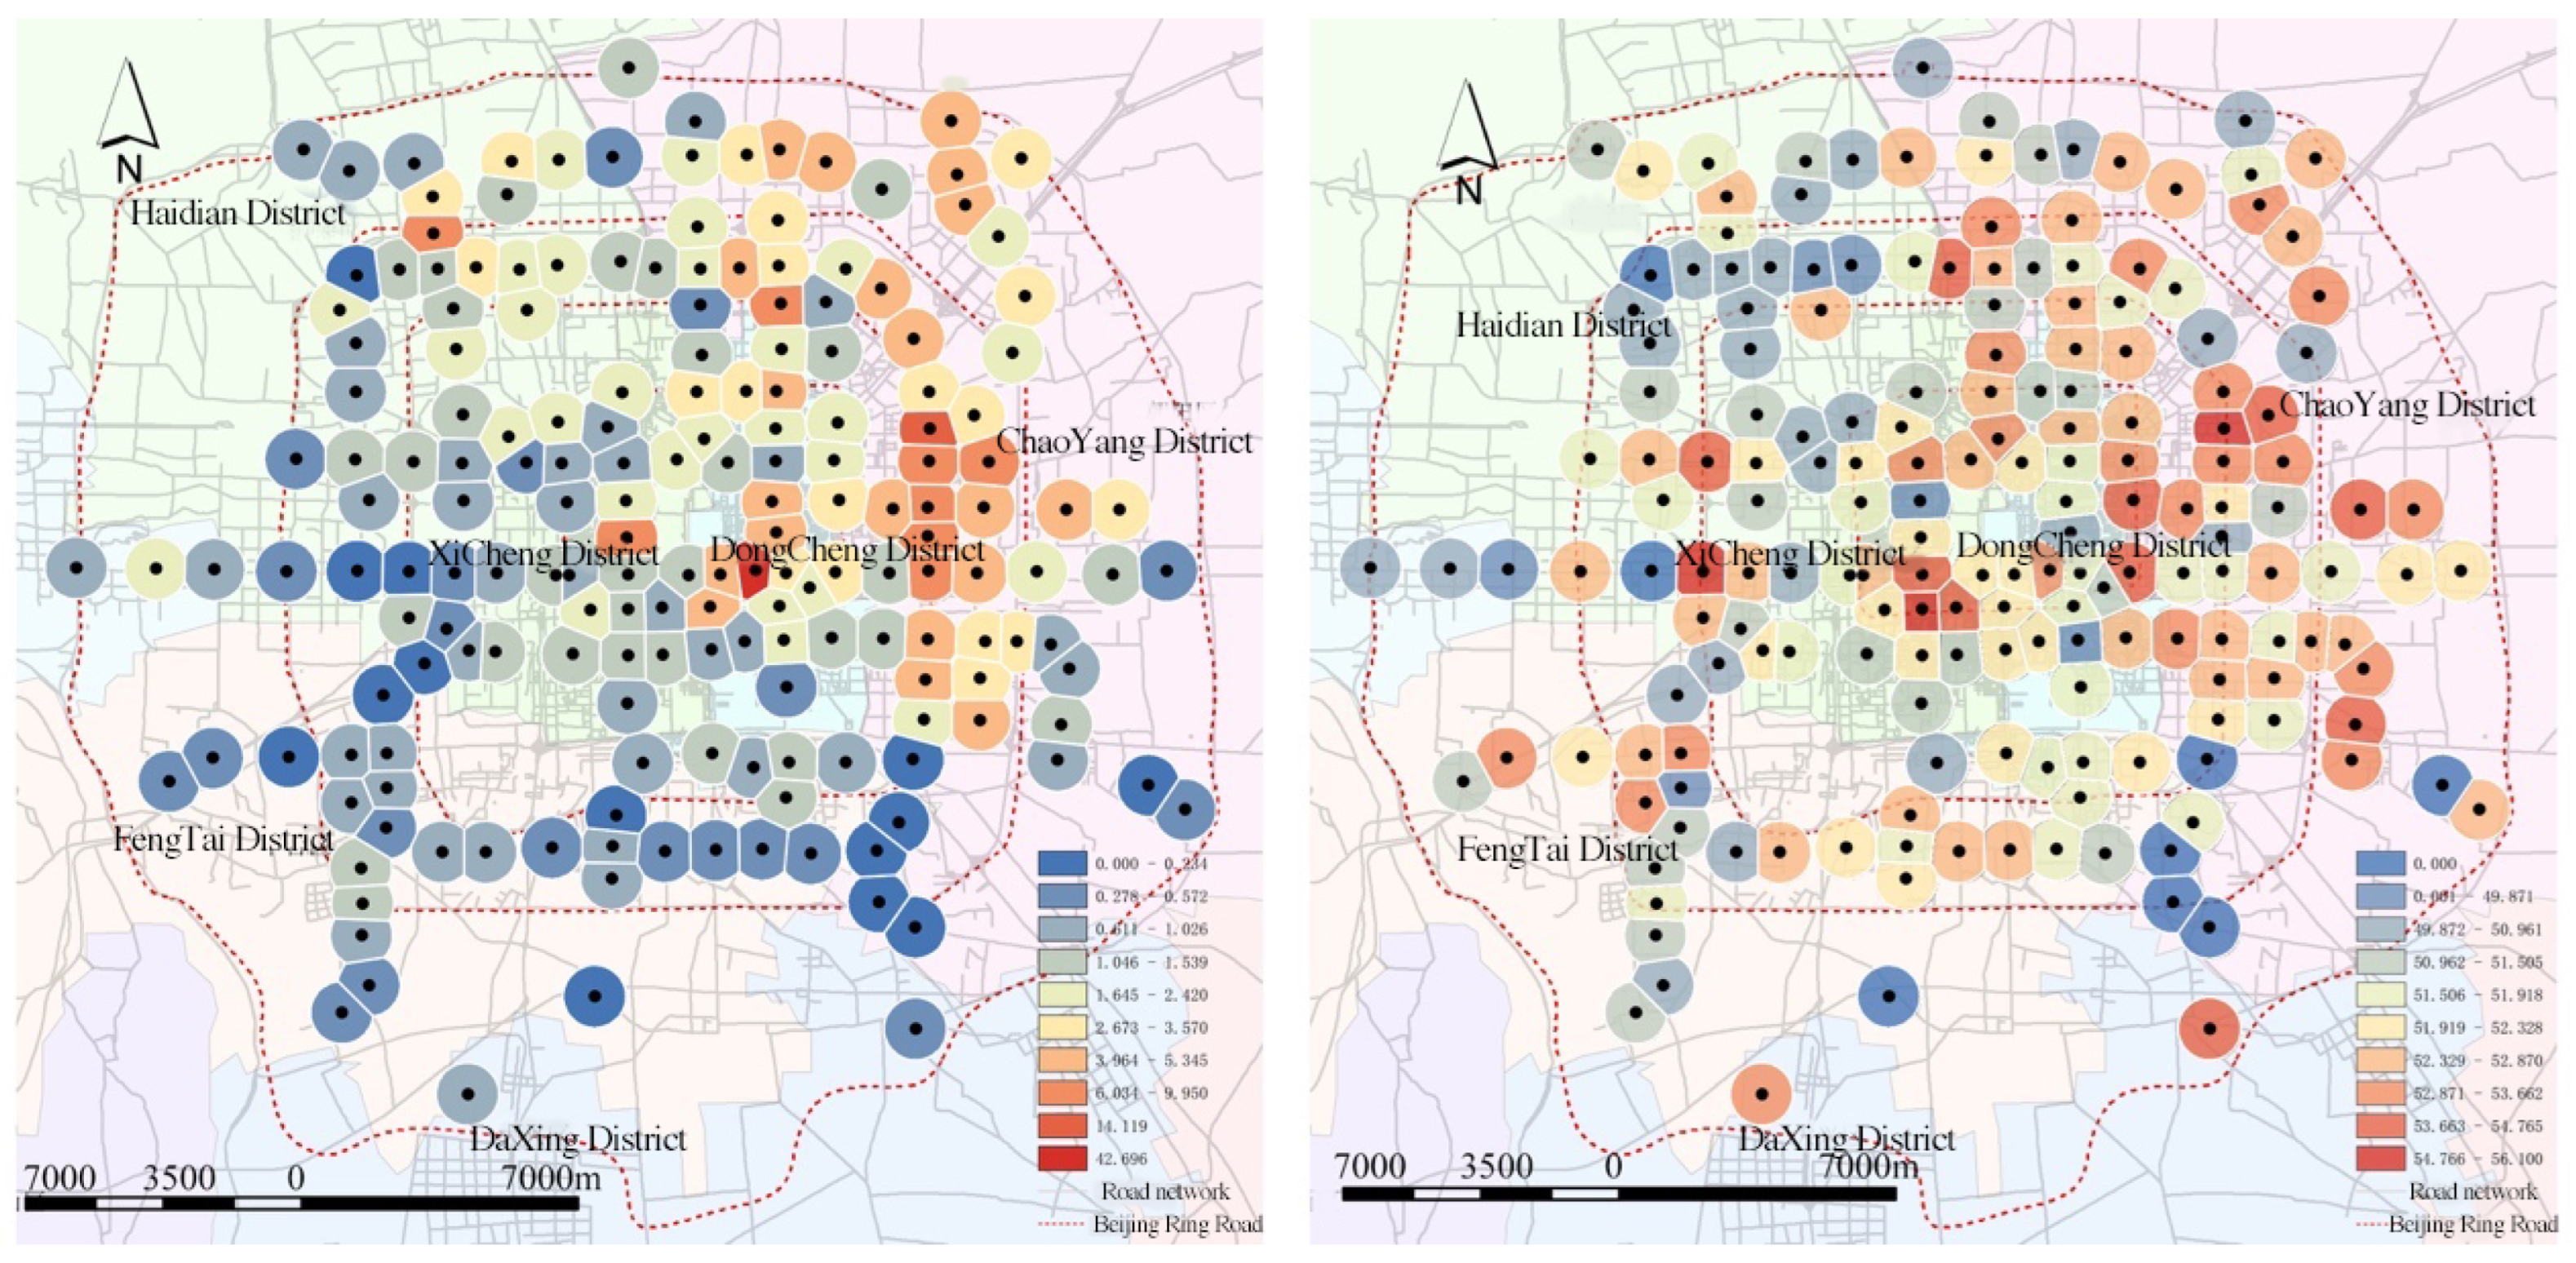
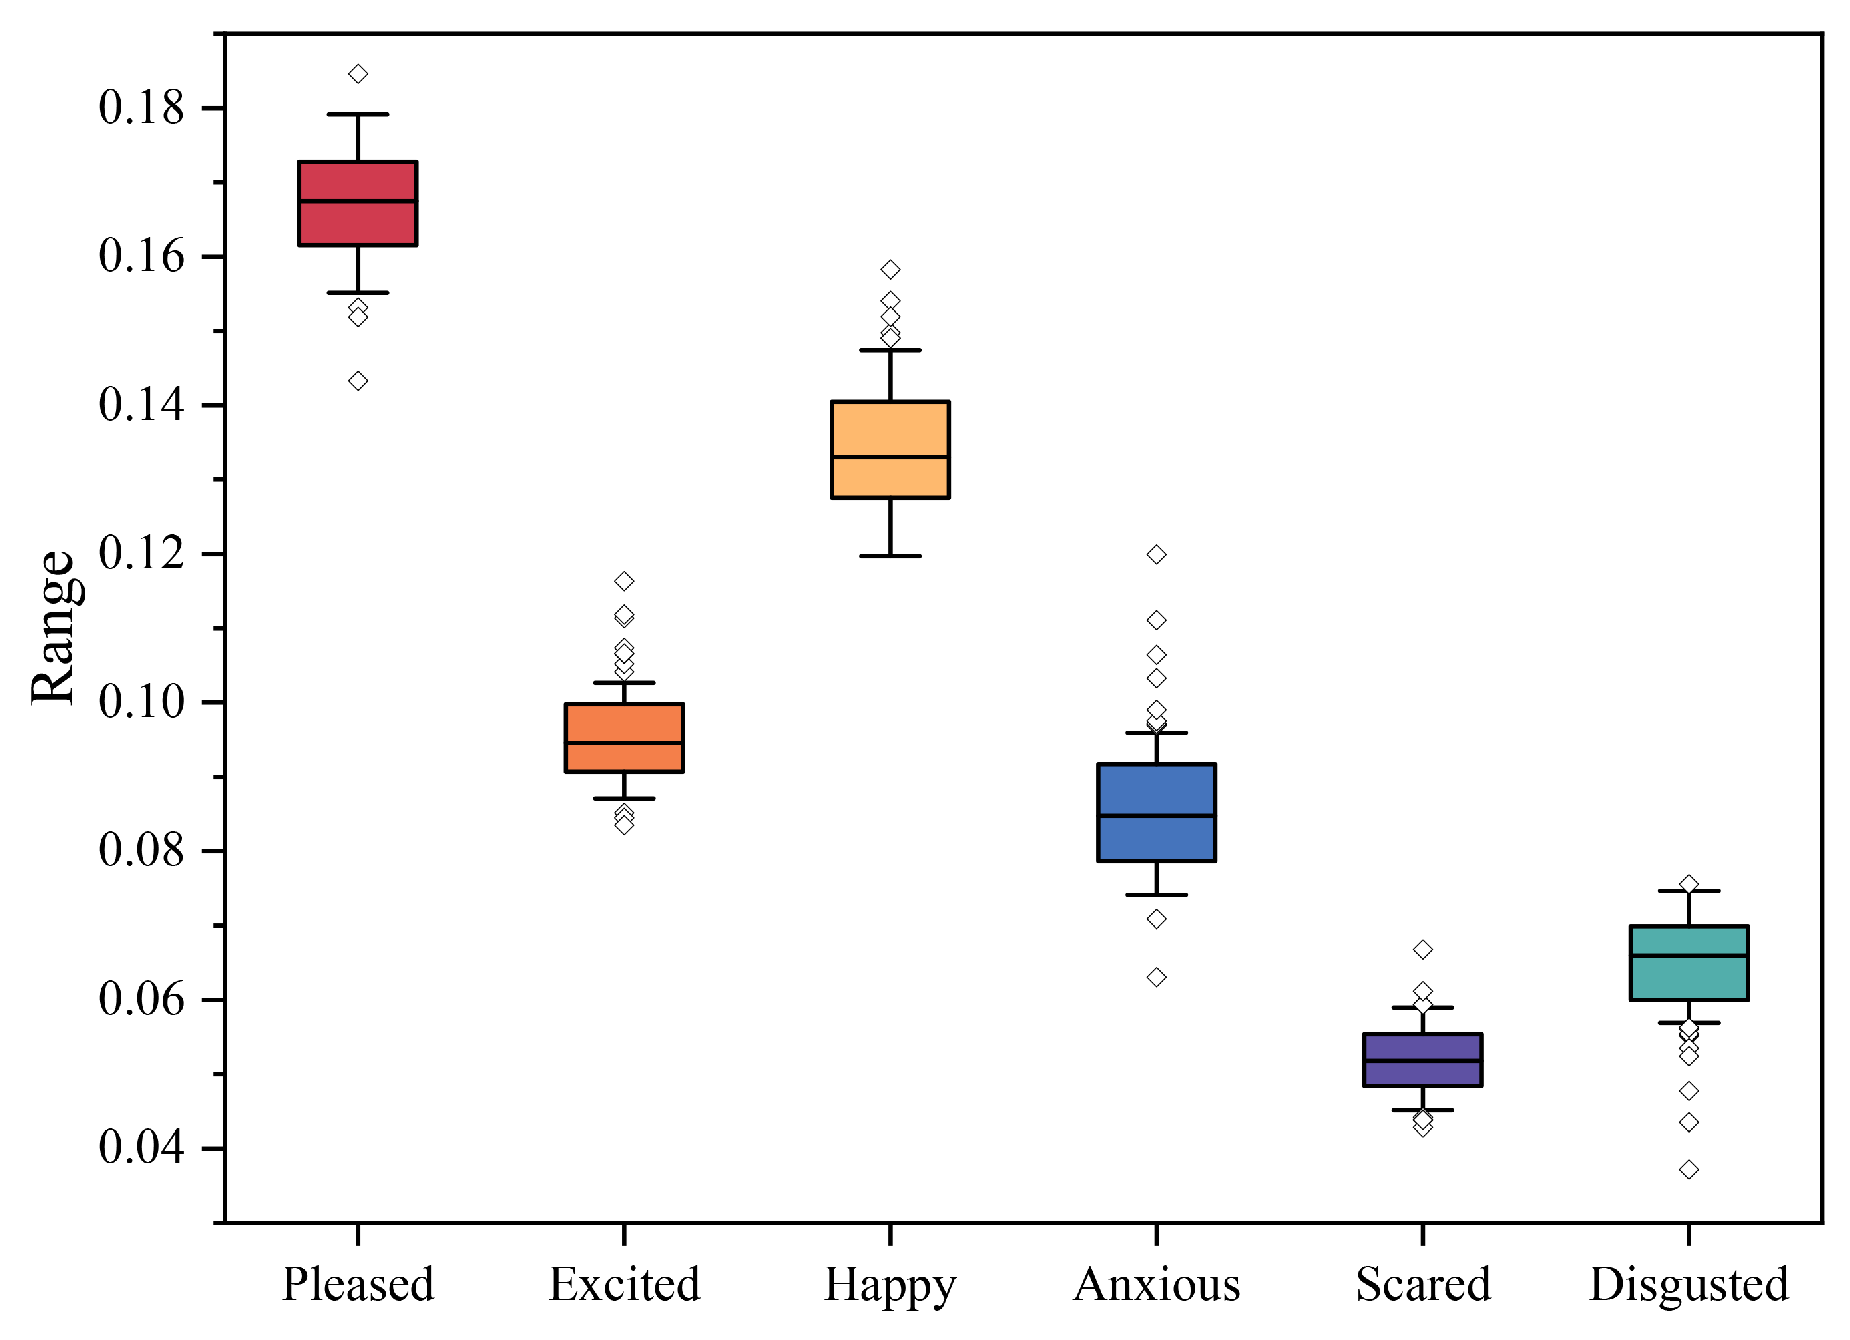
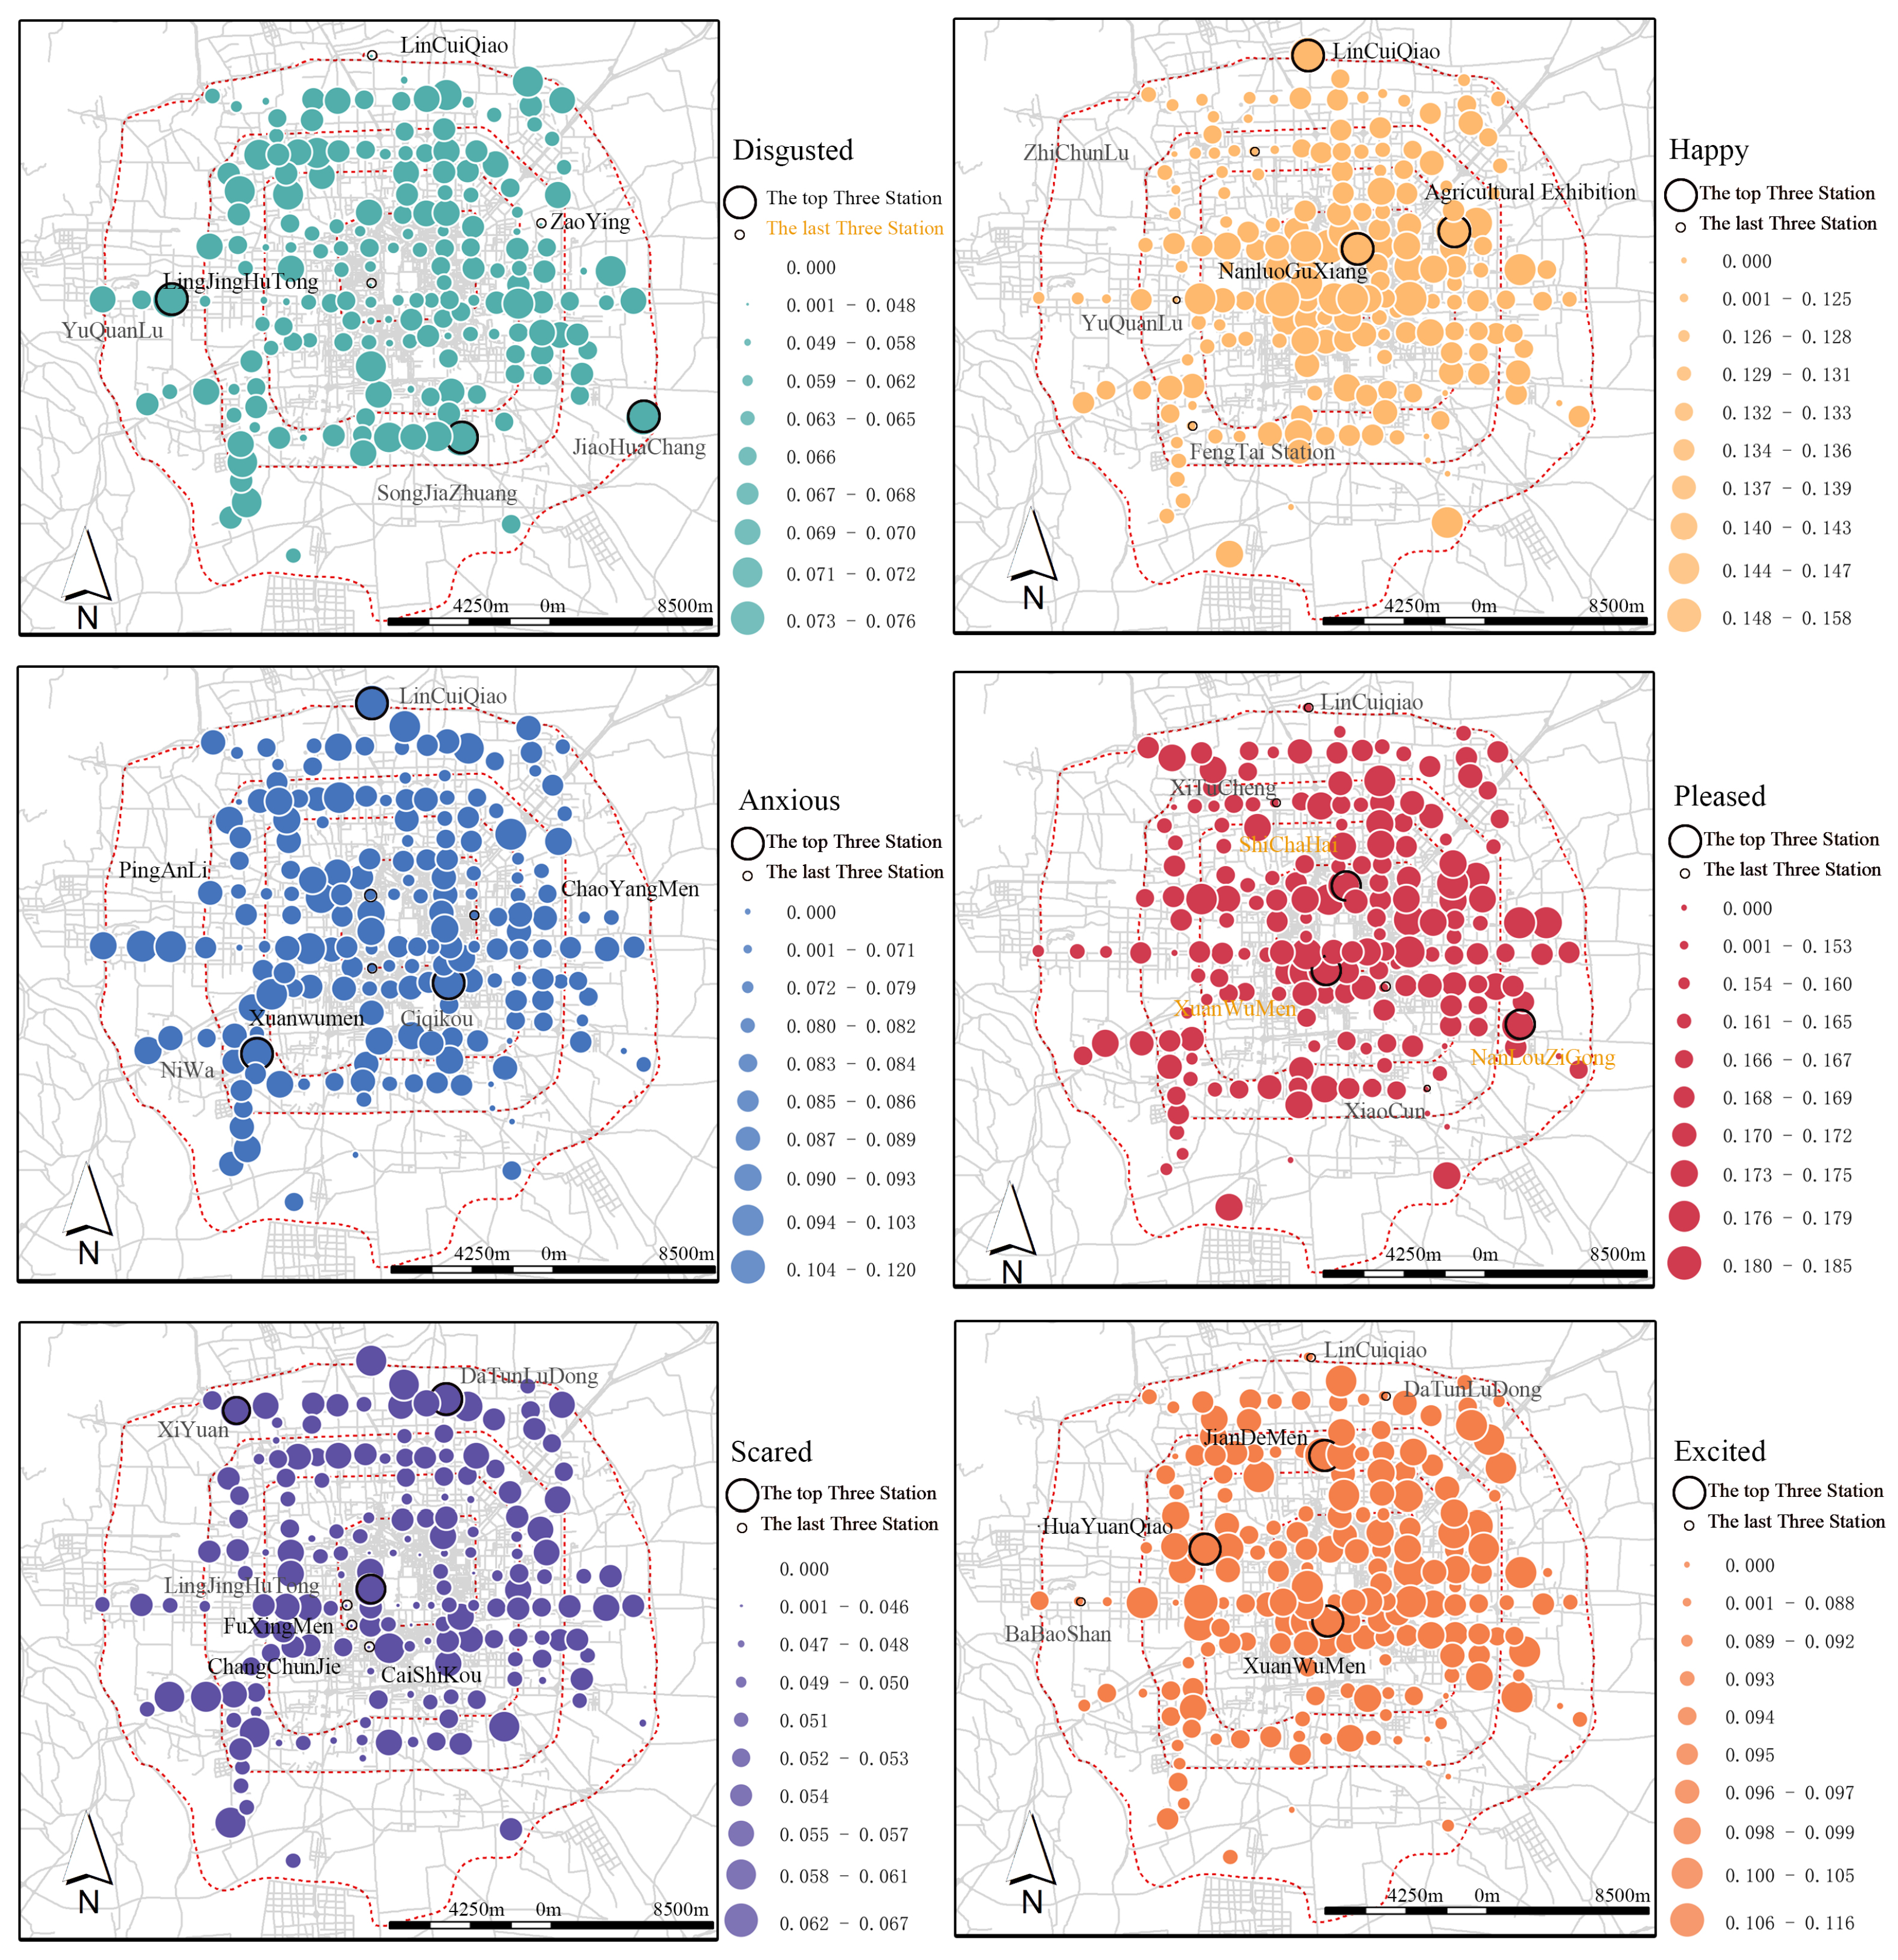
4.1. The Spatial Distribution Patterns of Sentiment Identity, Polarity, and Types in the Metro Station Area

Through the spatial distribution of social media sentiment intensity, it can be seen that the overall intensity of the Beijing metro station area shows a “strong in the east and weak in the west, strong in the north and weak in the south” pattern, in which the sentiment intensity in the northeast is significantly different from other regions Figure 3, intensity in the northwest is at the middle value, while the south part of Beijing formed a low-value zone. The northeast of Beijing is distributed with Beijing’s core business offices, commercial and cultural entertainment, and financial and art parks. Among the high sentiment intensity areas in the northeast, three multi-point clusters of higher sentiment intensity emerge in Wangfujing, Guomao, Wangjing, and Shuangjing stations; Zhongguancun Science City and University Campuses are densely clustered in the northwest part of Beijing, among which Zhongguancun and Tsinghua University are sentiment intensity high peaks in metro station area; the high-intensity clusters in northeast and northwest Beijing laterally reflect the higher perception value of the core business office area and university city cluster area. The urban function in the southwestern region is represented by the Beijing South Railway Station transportation hub, wholesale markets, and some other residential clusters, specifically forming an extremely low value of public sentiment near the Zhongguancun West Science and Technology Park and the southeastern agricultural wholesale production and coking plants. Moreover, compared with the metro station area of the northern Fourth Ring Road rail transit, the southern Fourth Ring Road stations form a continuous band space of low sentiment intensity value, reflecting the reality of low public perception activity of the southern group. In conclusion, the intensity distribution of sentiment shows a strong consistency with the urban functional zoning plan, reflecting the intrinsic correlation and mutual influence between the metro station area and the urban area.
The spatial distribution of the sentiment polarity and the six basic types of happy, excited, pleased, scared, disgusted, and anxious are used to further explore the public sentiment perception in the Beijing metro station area. The average polarity of the Weibo text is 52.03 points, which is more than 50 points, so the overall performance in the Beijing metro station area is still positive. The cumulative percentages of three types of positive sentiments, happy, excited, and pleased, were 73%, and the cumulative percentages of three types of negative sentiments, scared, disgusted, and anxious, were 37%, further confirming the results of the semantic analysis for sentiment polarity Figure 4. Combining the sentiment intensity spatial distribution reveals that the northeastern part of Beijing is a highly positive sentiment cluster, while the northwestern part is a highly negative sentiment cluster; the low-intensity band space in the southern part has no significant sentiment polarity. However, it is noteworthy that a positive sentiment cluster has begun to emerge in the Lize Business District which is under construction in the southwest.
From the proportion and spatial distribution of the six types of sentiment, Figure 5 divided by the five rings roads, the six types of sentiment percentages show certain circle distribution characteristics, with happy sentiment being the most obvious. The distribution of “Happy” is highly concentrated, with the Dongcheng District and Xicheng District within the Second Ring Road as the center and a radial decreasing distribution in all the surrounding areas. Most are near natural and cultural attractions such as Nanluoguxiang and Shichahai. The three stations of Nanluoguxiang, Agricultural Exhibition Hall, and Linzui Bridge ranked among the top three in Beijing in terms of happy sentiment.
The overall spatial distribution of two categories of sentiments, pleased and excited, also has some correlation with the five Ring Roads but is less significant than happy. The distribution of “pleased” shows a pattern of multi-point clustering and there are obvious characteristics of spatial differentiation. The Dongcheng District, Xicheng District, and Chaoyang District within the Second Ring Road tend to have a higher proportion of “like” sentiment, and the new business and leisure spaces in the southwest and the stations around the two imperial gardens in the northwest, the summer palace, and the Old Summer Palace tend to show a scattered distribution of “like” sentiment clusters. The distribution of excited and pleased sentiments has some similarities, with more in the Dongcheng District and Xicheng District within the Second Ring Road and Chaoyang District, but the excited sentiment is significantly higher than the pleased sentiment in the Olympic Sports Center, while excited sentiment is lower than pleased sentiment near the Summer Palace and Yuanmingyuan.
In contrast to the distribution of happy sentiment, the disgust sentiment in the metro station area shows an obvious tendency to gather around the periphery and is mostly distributed in the metro station areas between the third and Fourth Ring Road, including the university groups near Renmin University and Wudaokou in Haidian District, Songjiazhuang in the southeast, Xiao Village, Beijing South Station surrounding areas, and Fengtai Science and Technology Park group in the southwest, while the disgusted sentiment in the inner city within the second ring is less. Anxious and scared sentiments are mainly scattered in the periphery of the Second Ring Road, forming three highly anxious sentiment clusters including Linzui Bridge in the northern part, Naiwa Station in the southwestern part, and Ciqikou in the southeastern part, with three highly scared clusters in Xiyuan, Datun Road East, and Fengtai Science and Technology Park between the Fourth and Fifth Rings.

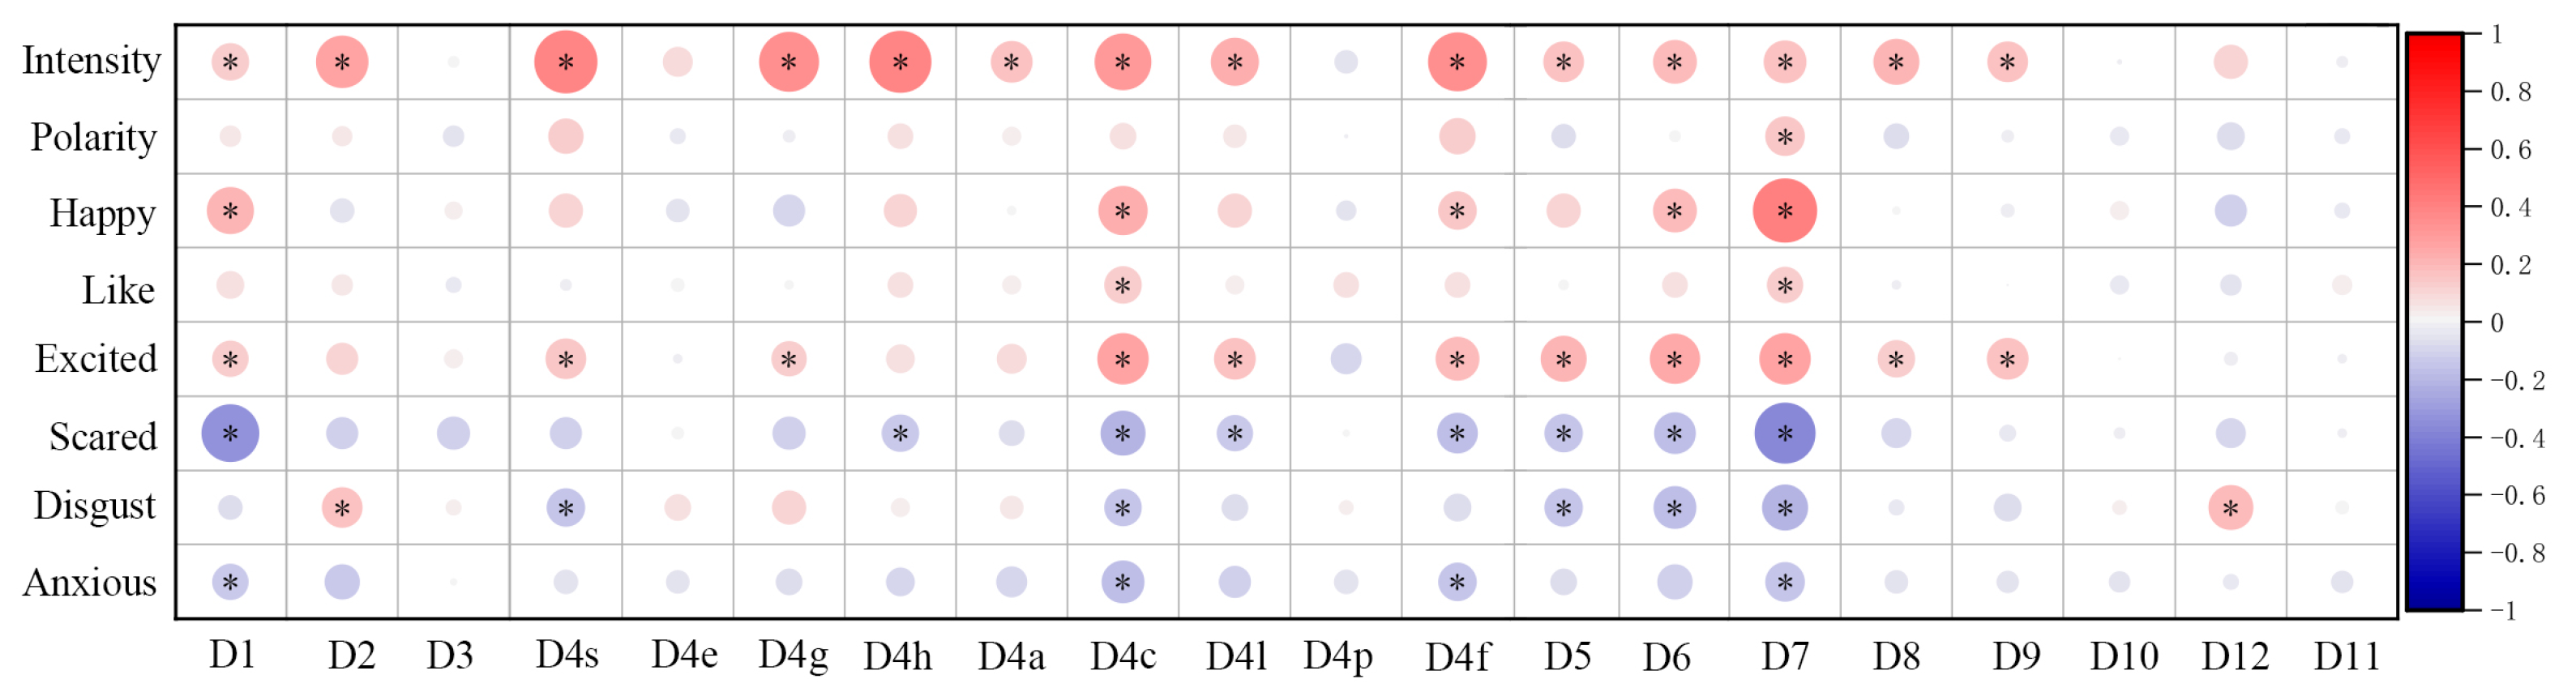
4.2. Correlation Analysis between Built Environment Indicators and Sentiment Performance in the Metro Station Area

Correlation analysis between the indicators of the built environment and the public’s sentiment perception Figure 6 was used to analyze their relationship. The significant correlation confirmed the close relationship between environment and human sentiment intensity; the results of the quantitative analysis also reflect the differences in influencing factors among different sentiment attributes. First of all, the sentiment intensity in the metro station area shows a significant correlation with the indicators in density, diversity, design, and the distribution of various functions. Specific to the six types of sentiments, the positive sentiments (happy and excited) and the negative sentiments (scared and disgust) were significantly correlated with building density, POI point density of cultural space, restaurant point density, and built environment design, with two types of positive sentiments showing a significant positive correlation, while two types of negative sentiment showed a significant negative correlation.
Pleased and anxious sentiments were poorly correlated with the built environment indicators in the metro station area, with pleased sentiment showing only a weak positive correlation with the density of cultural POI points and distance from the station to the city center, and anxious sentiment showing a weak negative correlation with building density, the density of cultural and restaurant POI points, and distance from the station to the city center. This means that pleased and anxious perception is influenced by more factors and thus the data are more complex compared to the other four sentiment types. At the same time, the sentiment polarity is a combined superposition of multiple types, which are less directly influenced by built environment variables and are also difficult to directly explain. However, correlation analysis revealed significant connections between sentiment intensity and four categories of sentiments: happy, excited, scared, and disgusted, as well as several indicators of the built environment in the station area. Furthermore, multiple linear regression analysis was used to explore the actual influence of built environment indicators on public sentiment perceptions. Before conducting the regression analysis, the independent variables were tested for multicollinearity using VIF (variance inflation factor) to exclude the influence of linear correlation between the independent variables on the accuracy of the regression results. Generally, when the VIF value is less than 10, it is considered that there is no multicollinearity, it was found that the VIF of the built environment index in the study area was less than 5, allowing further regression analysis.
The regression analysis shows that the density of functional distribution is an important factor affecting public sentiment perception, and when there are more shopping, medical, and cultural locations in the metro station area, the sentiment intensity is higher. Entertainment and leisure activities, shopping malls, medical venues, exhibition halls, and other cultural venues are more likely to induce public sentiment expressions. This further explains the gathering of high sentiment intensity clusters in northeast Beijing, centered on Wangfujing, Guomao, Wangjing, and Shuangjing, and in Haidian District centered on Zhongguancun and the west exit of Tsinghua University. This is due to the integration of more functional spaces and shopping, medical, and cultural business facilities. The regression analysis also reflects that there is a significant negative correlation between sentiment intensity and the density of buildings and life service facilities POI points in metro station areas. Through the analysis of the spatial distribution of sentiment intensity in the metro station area, the current Beijing south Fourth Ring Road station area forms a continuous band of low sentiment value space, reflecting that it is mostly a residential area with high building density surrounded by basic life service facilities, with a single functional mode and low public sentiment intensity, Table 3.
The regression analysis of built environment indicators with the percentage of happy, excited, scared, and disgusted in metro station areas shows that the public’s perception and sentiment performance is directly influenced by the built environment, Table 4. Among the indicators of the built environment in the metro station area, distance from the city center is the dominant factor of the built environment acting on all four categories of sentiments; the closer the station is to the outer ring, the greater the proportion of negative sentiment perception. Among the density of different functional POI points indicators in the metro station area, the increase in the proportion of life services and cultural facilities contributes to the positive sentiment, while the design indicators of the station built environment also prove that the increase in the density of road intersections increases the “happy” perception to some extent. Scared and disgusted are two negative sentiments, in addition to the distance from the city center, the high average daily passenger flow at the station is also an important factor in the generation of negative sentiments, especially the disgusted perception of the public. In addition, scared is more likely to be influenced by the built environment than disgusted sentiment, and “scared” is significantly higher in station areas with a lower density of buildings and life service facilities. Especially when there are fewer ground-floor commercial facilities in the metro station area, safety at night will be a constraint to station vitality.
The correlation analysis revealed that the association between pleased and anxious sentiment and the built environment indicators was weak, and the two categories did not pass the regression significance test, further demonstrating that pleased and anxious are actually less directly influenced by the established built indicators and more subjective. In the correlation analysis, the density of cultural facilities’ POI points and distance from the city center showed a more significant positive correlation with the pleased sentiment, thus objectively reflecting that art galleries and exhibition spaces more easily induce a deep-rooted pleased sentiment compared to other spaces. The anxious sentiment was positively and negatively correlated with passenger flow and distance to the city center, respectively. However, through regression analysis, passenger flow does not directly trigger anxiety for all stations, and it is speculated that the built environment indirectly affects anxiety, e.g., crowded platforms and noisy environments can transform shallow negative emotions into deep anxiety.

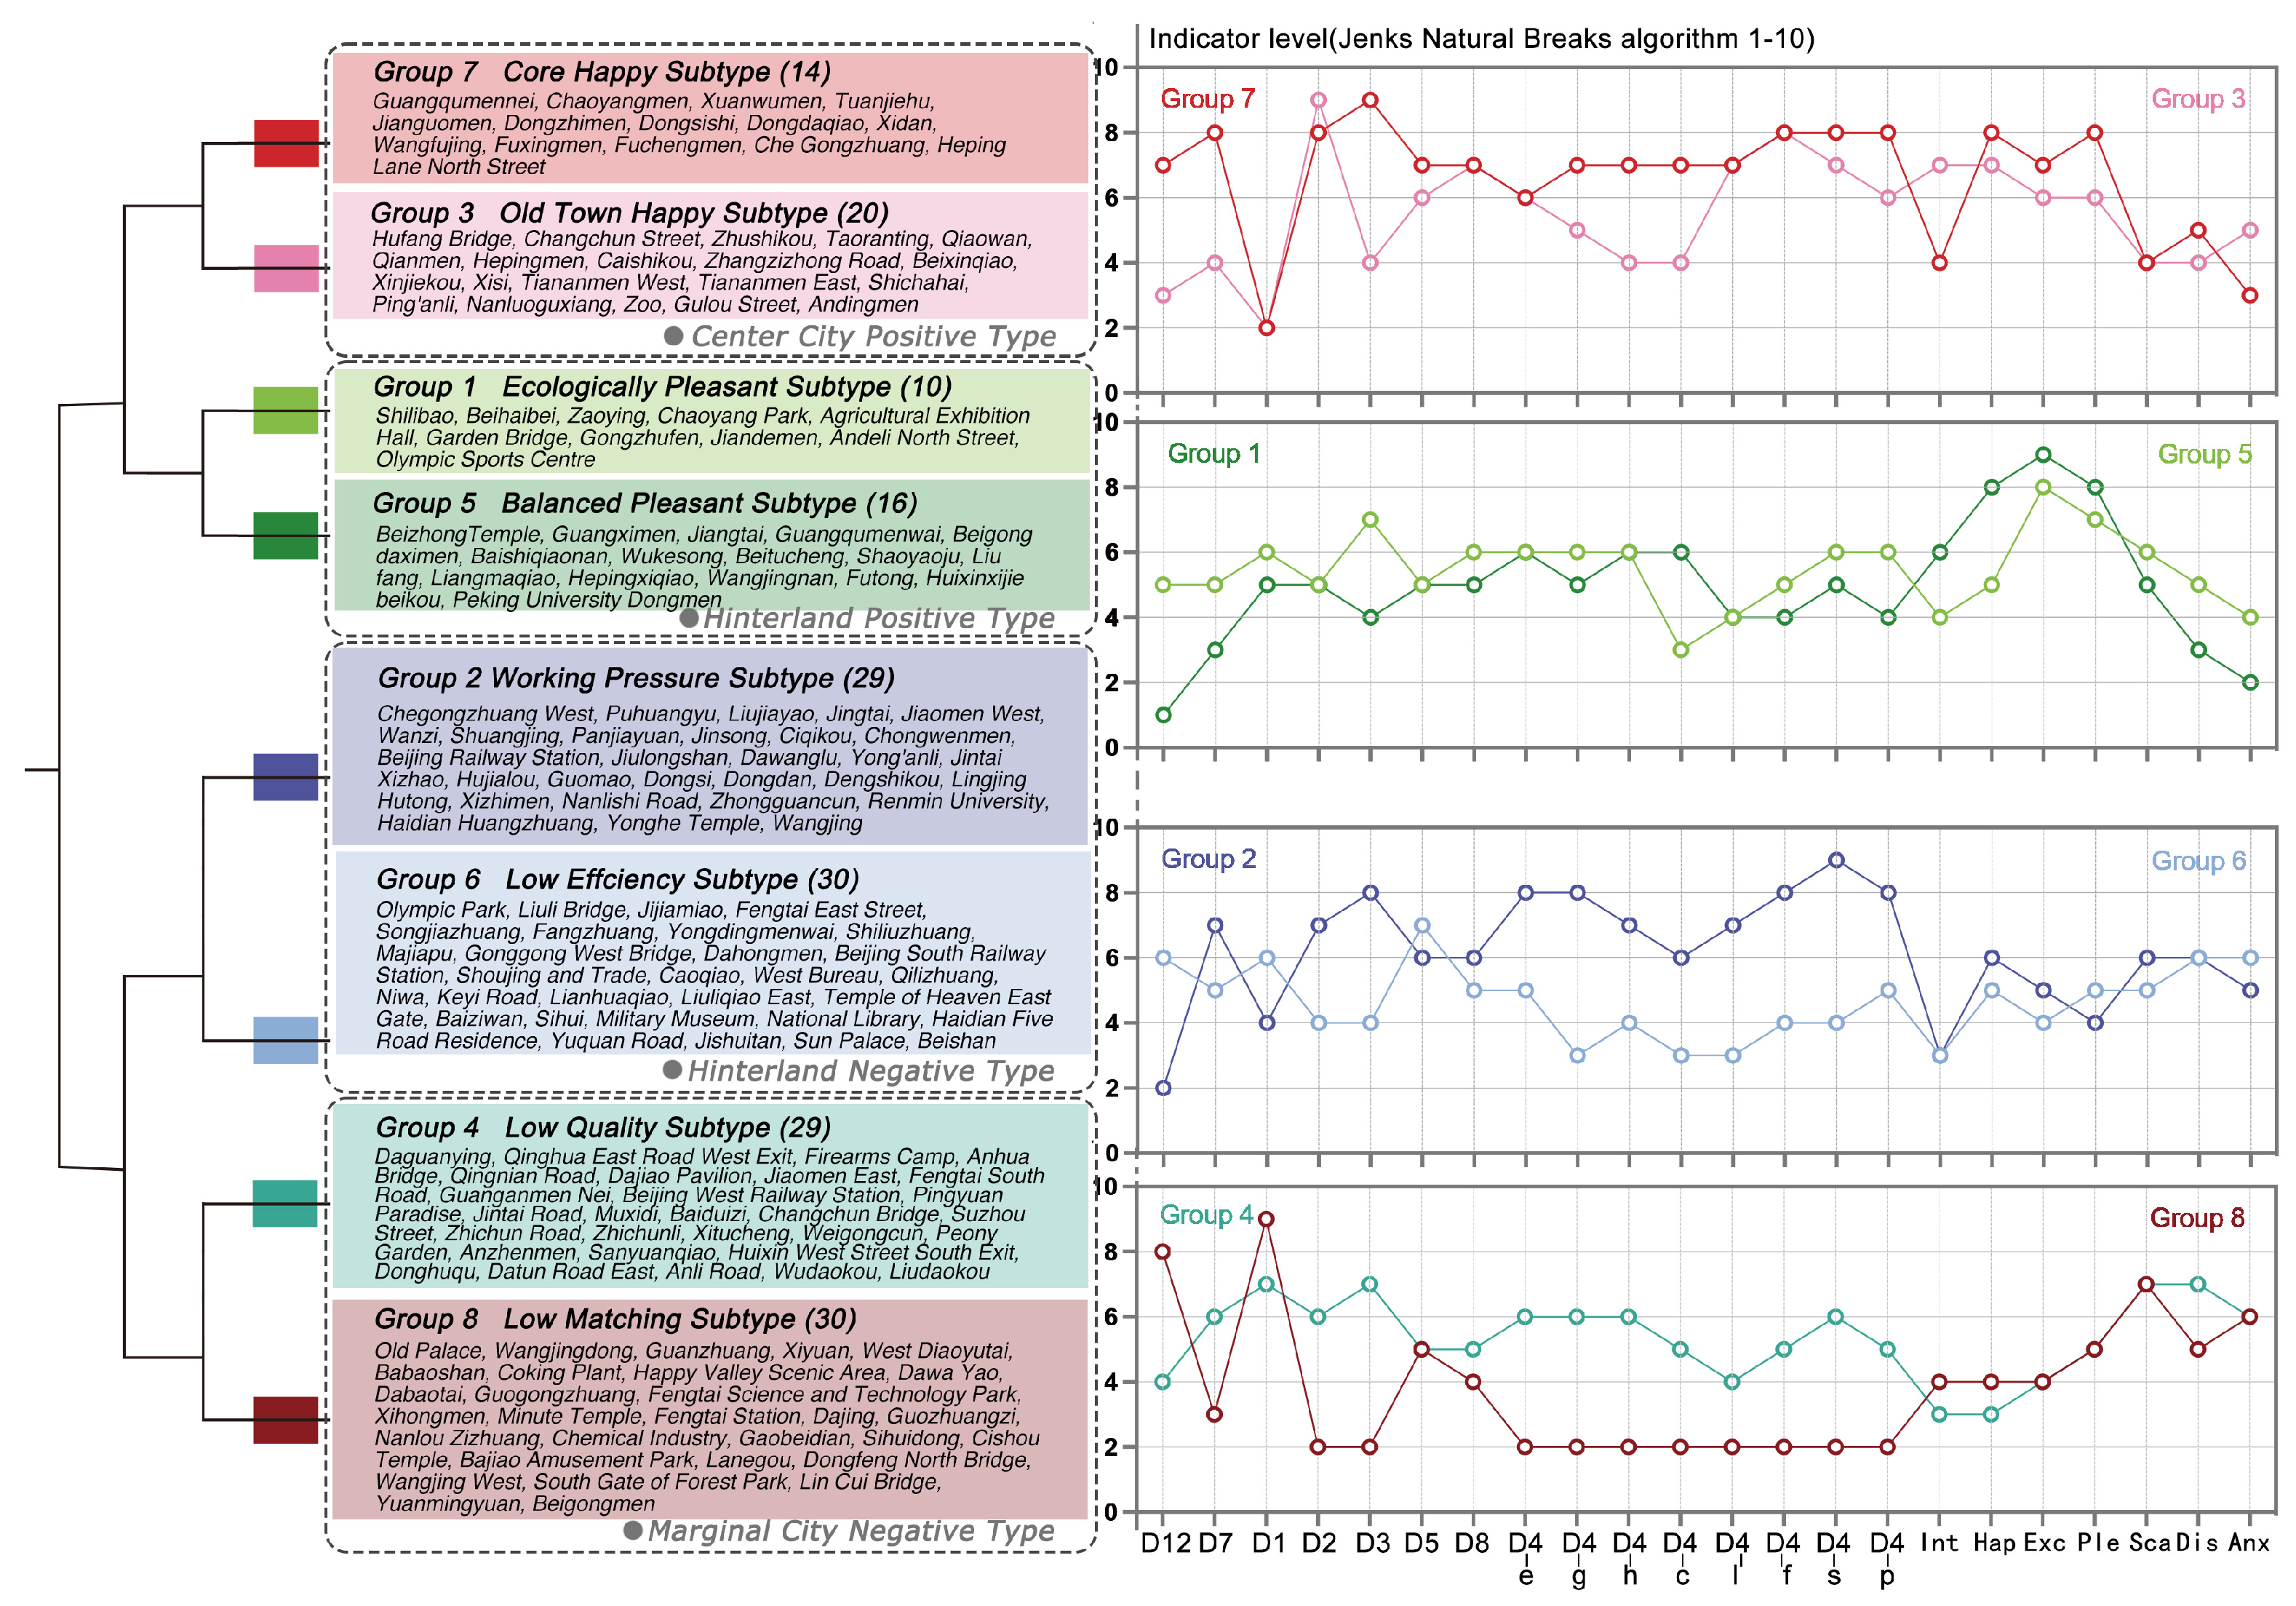
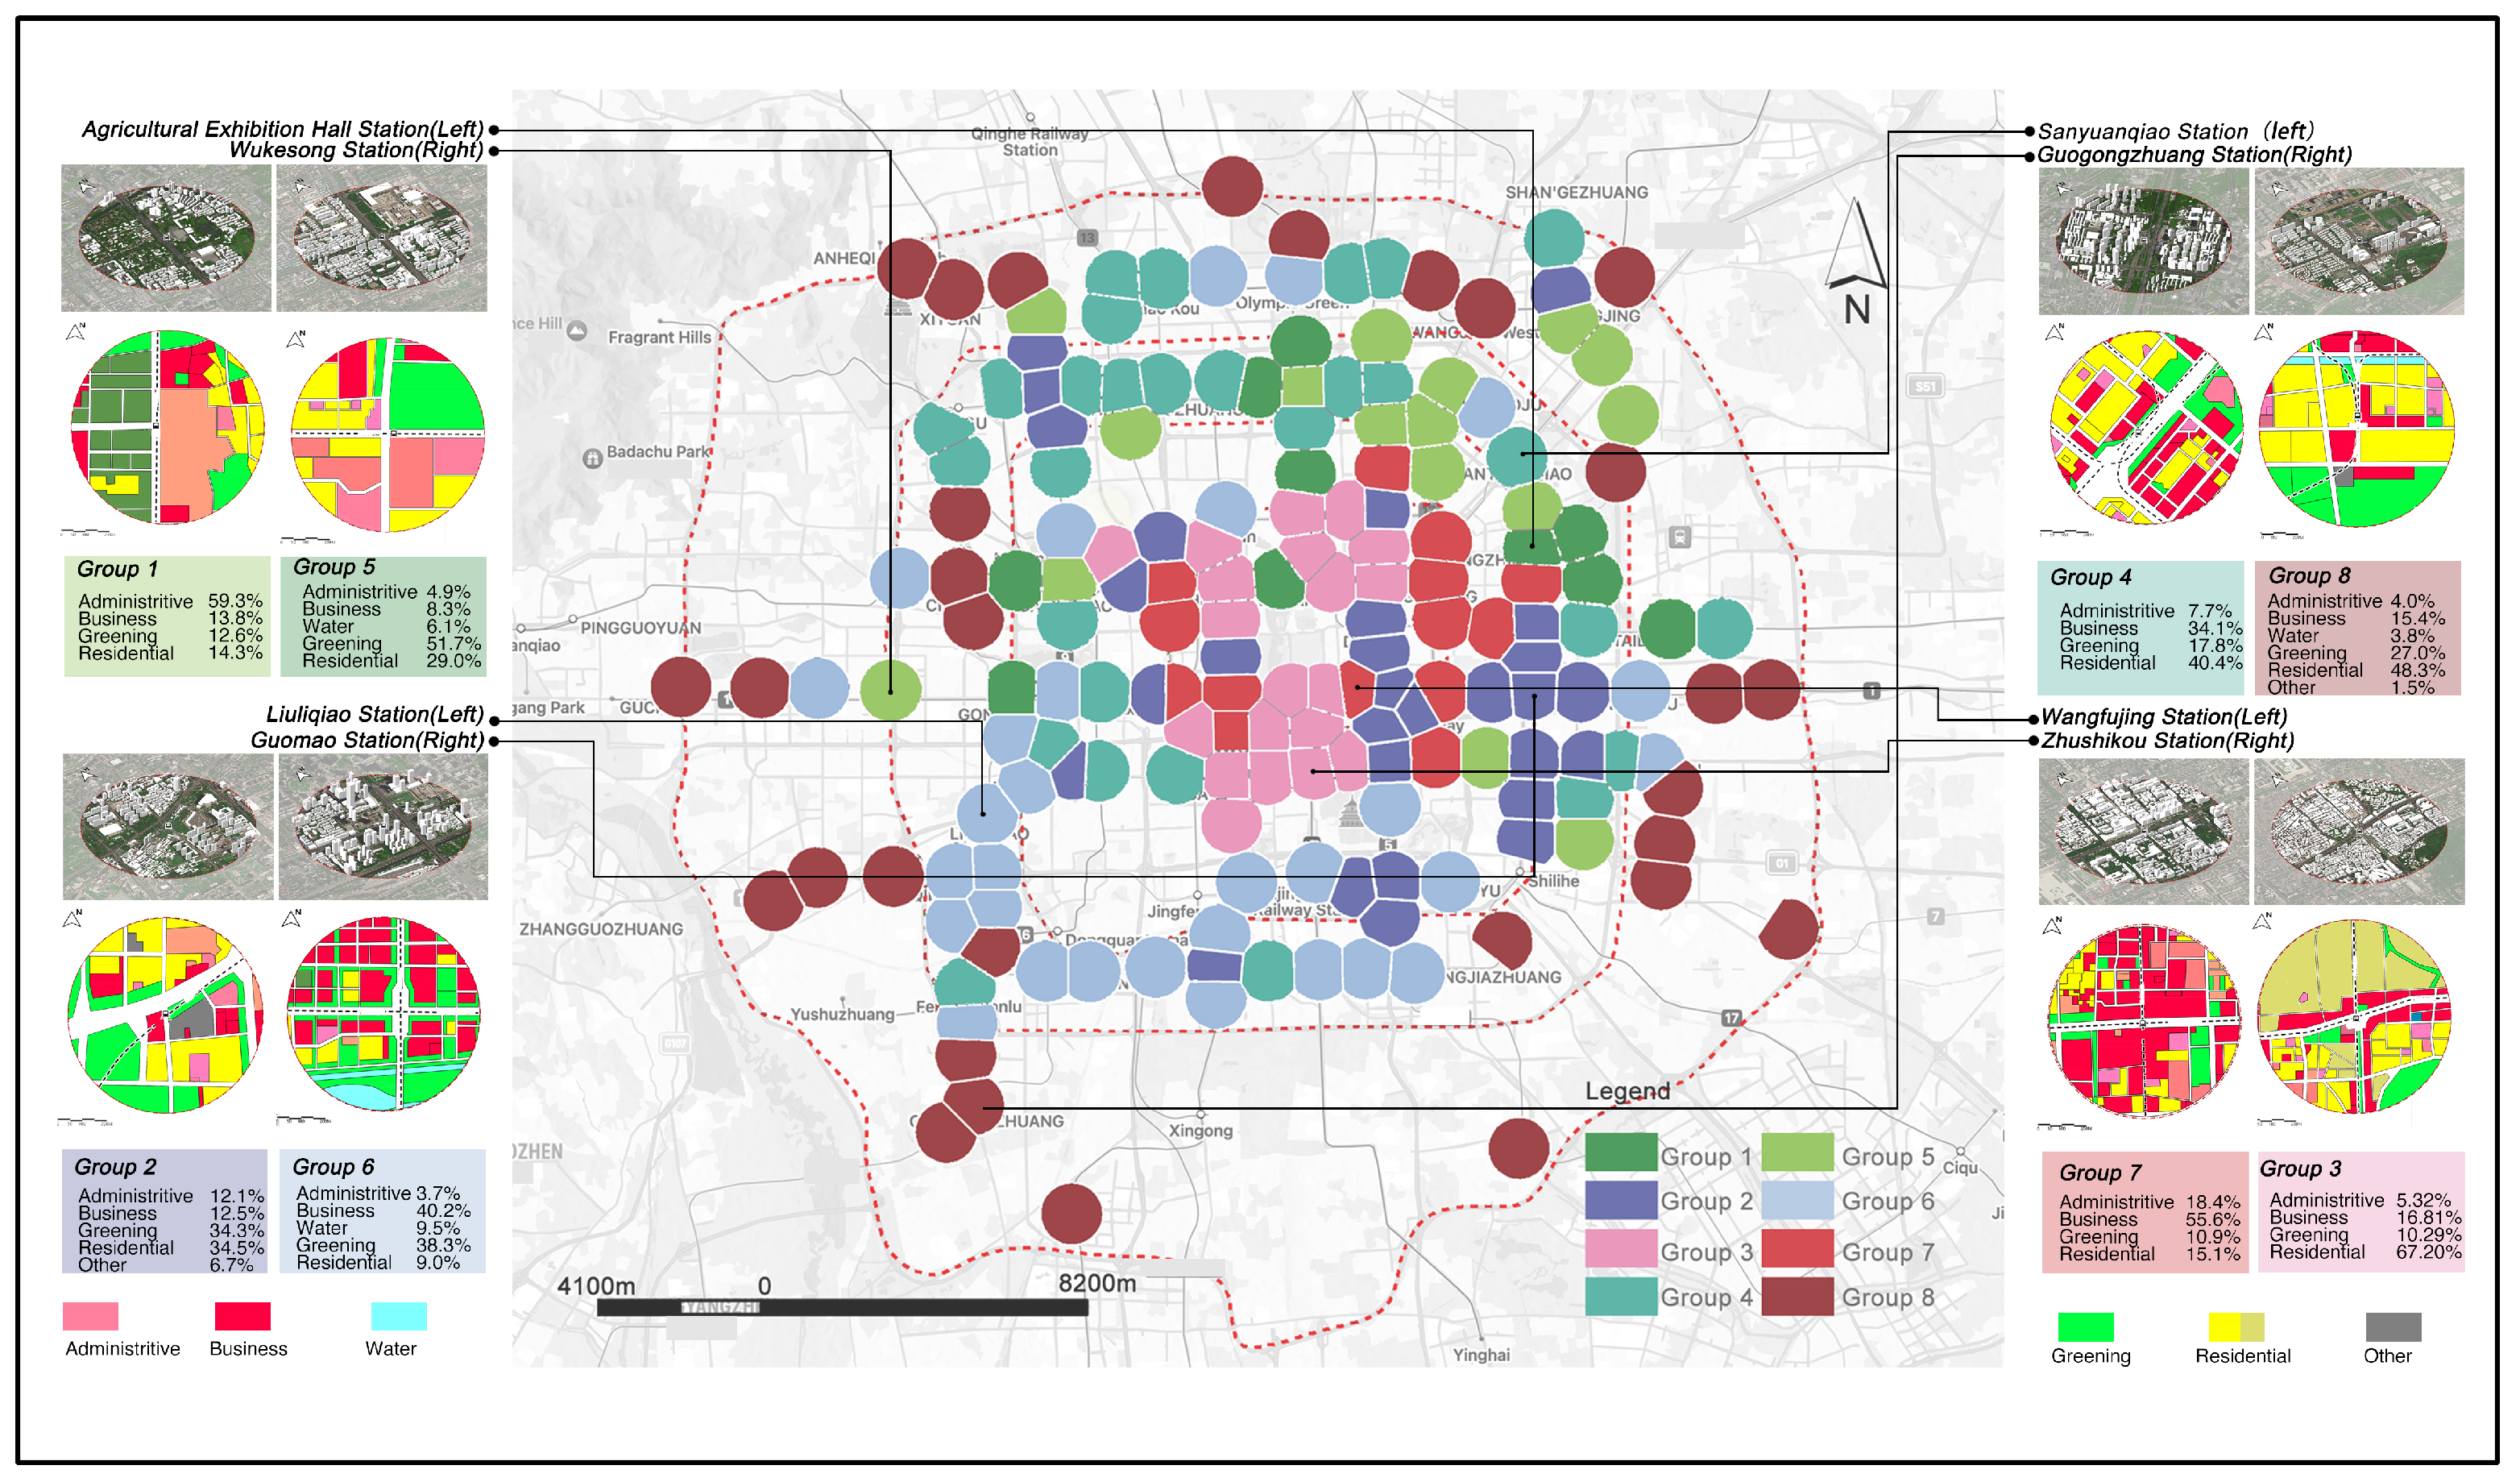
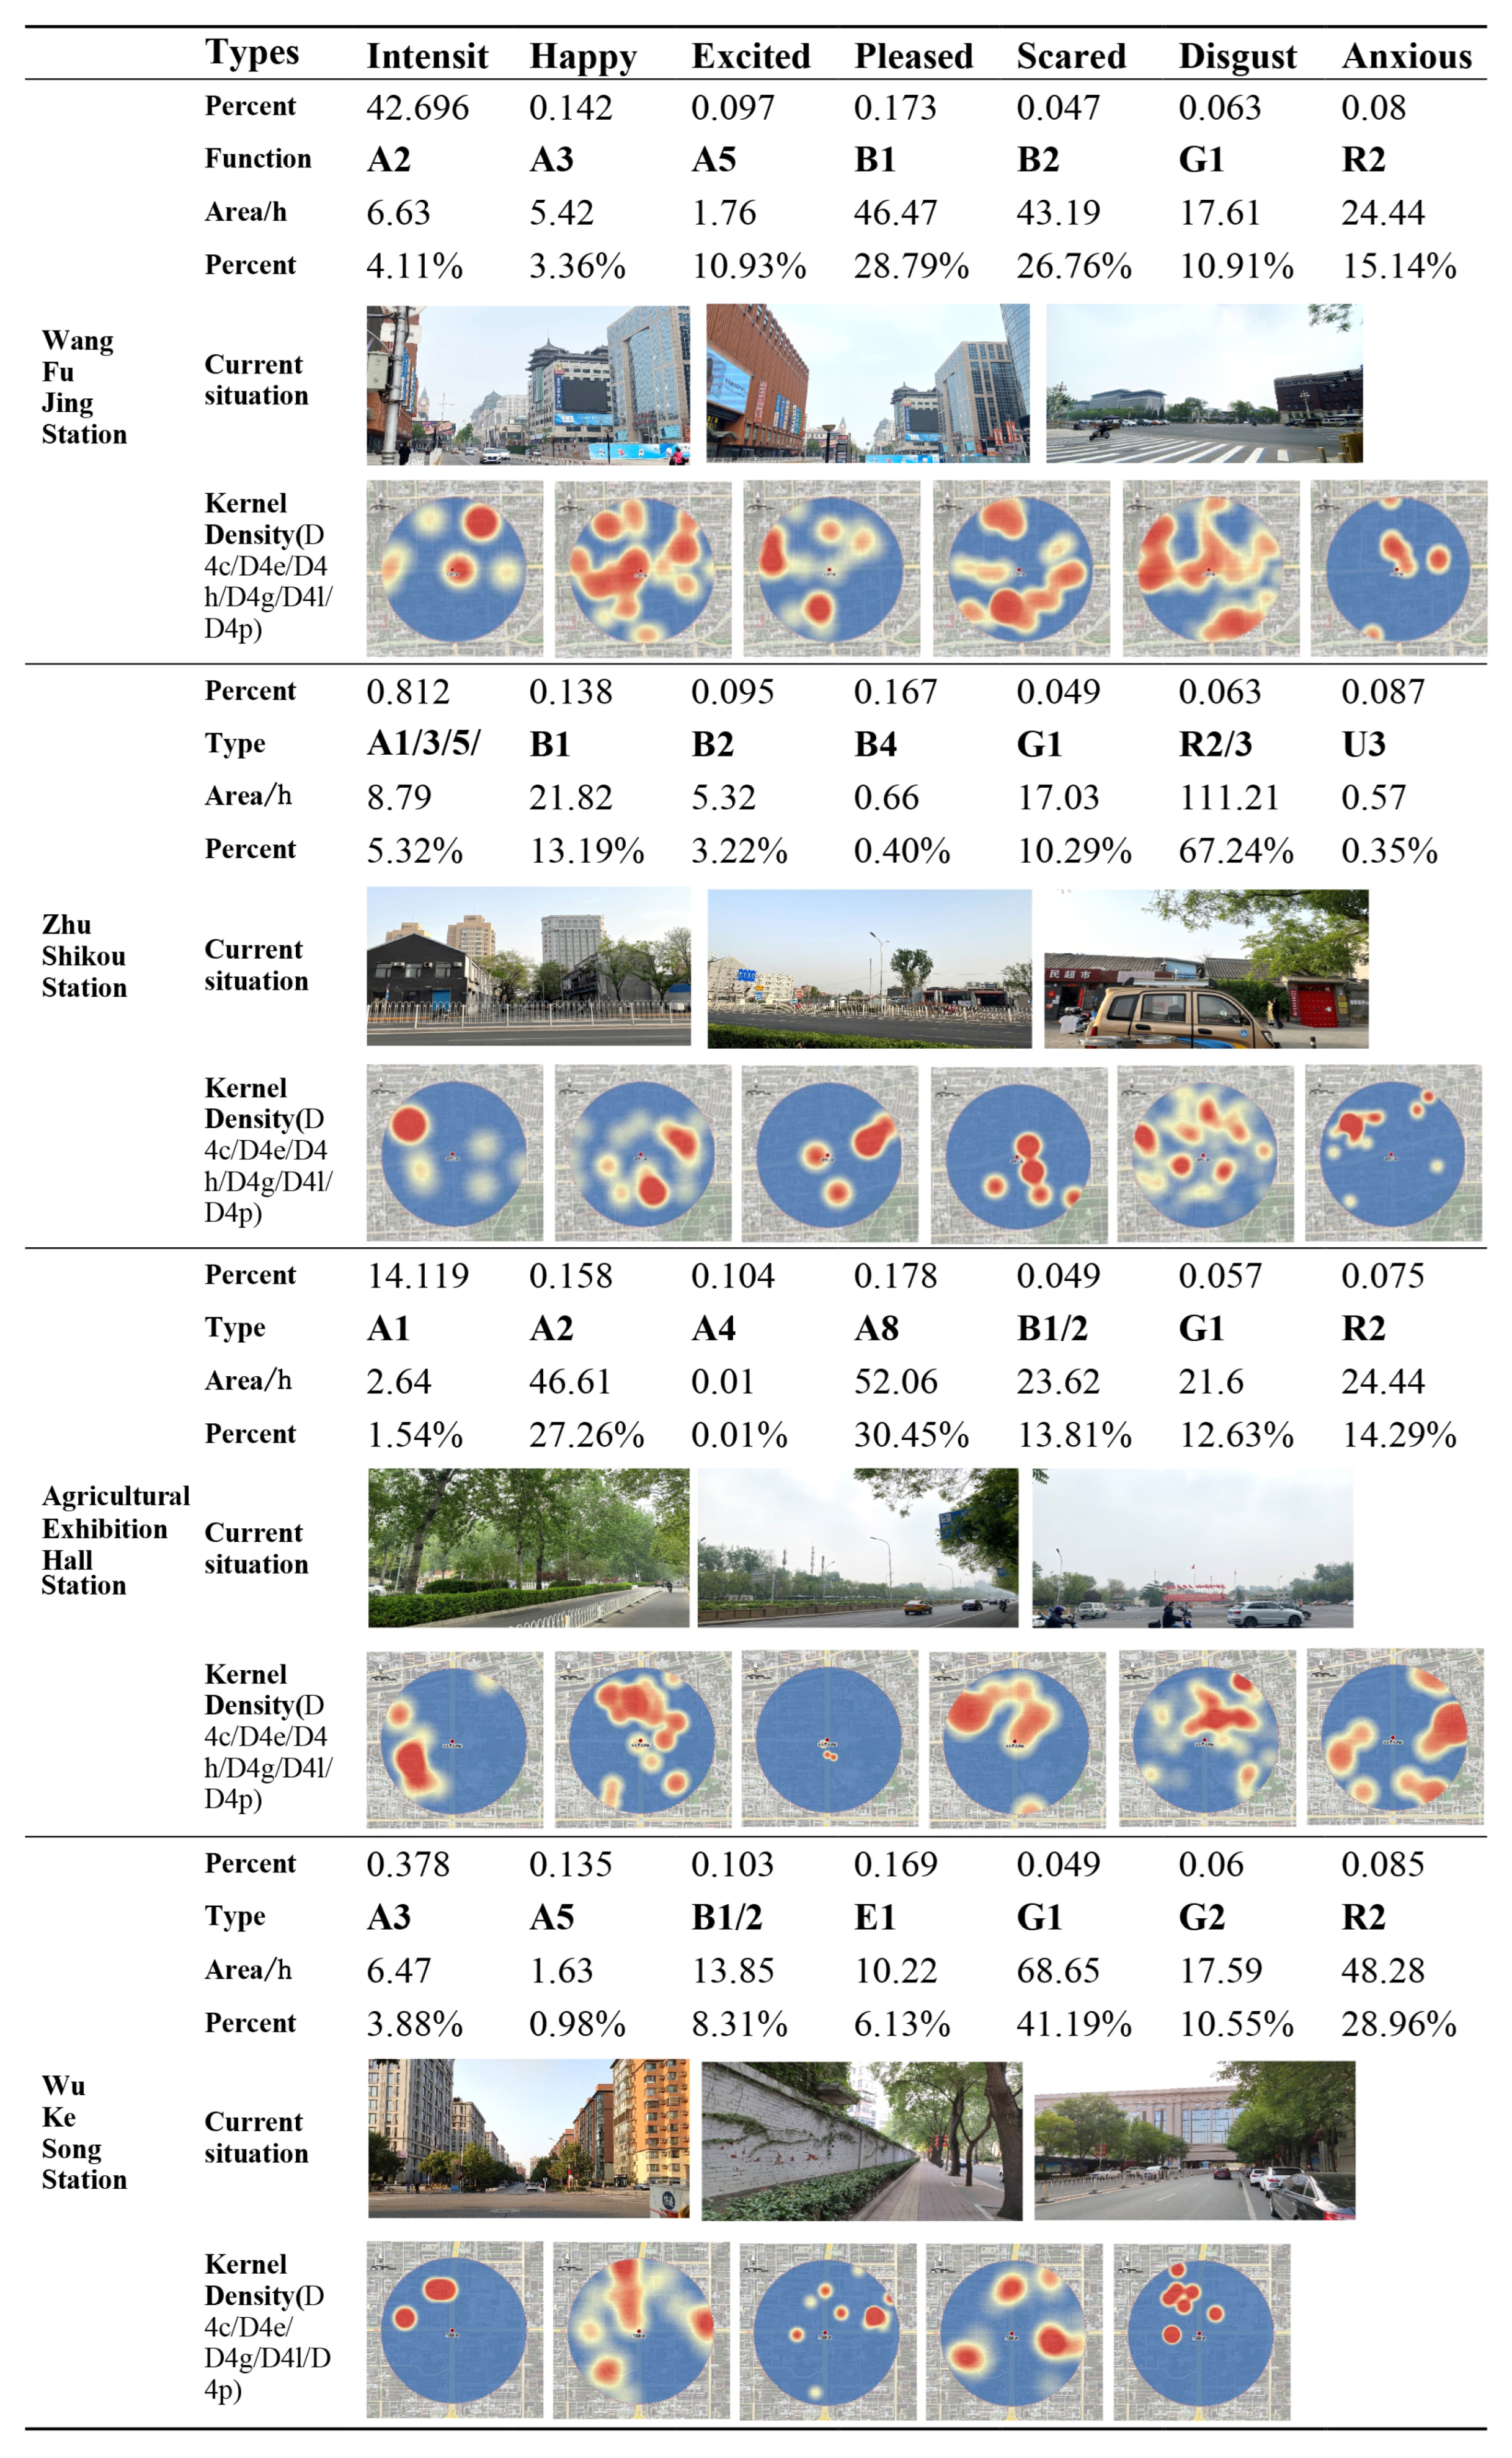
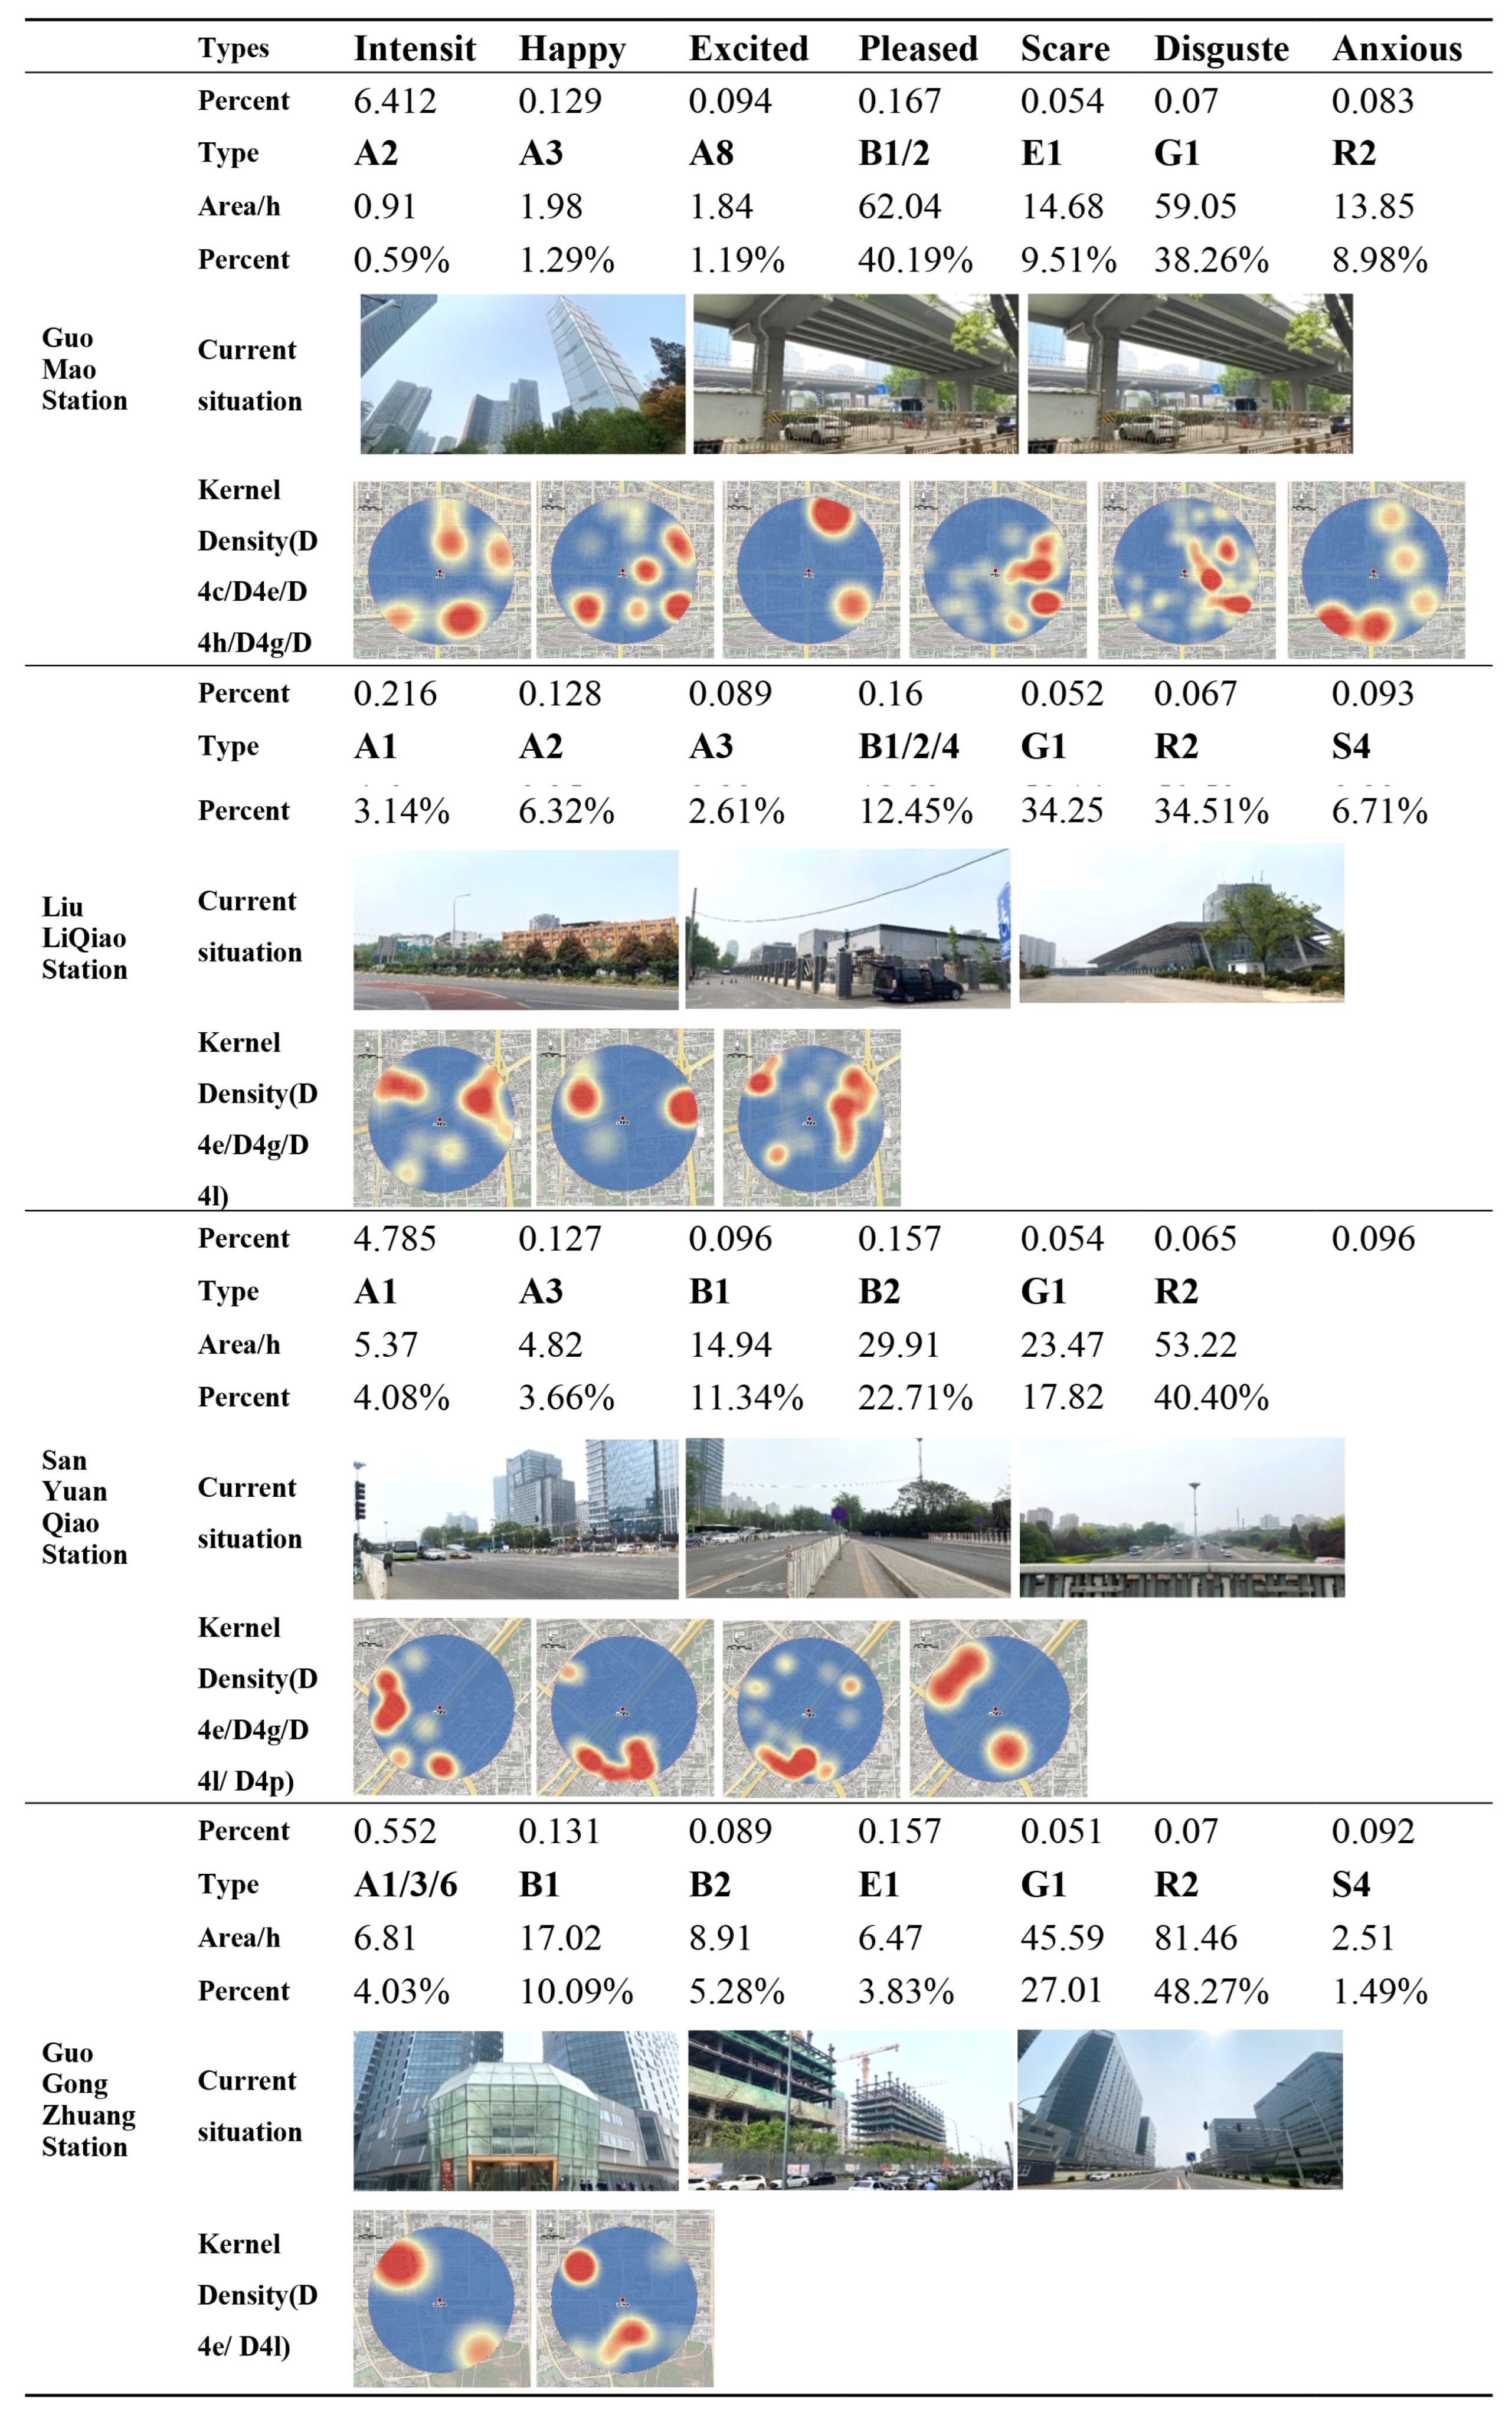
4.3. Public Sentiment Perception Distribution Characteristics in Beijing Metro Station Area

The correlation and regression analysis between built environment indicators and sentiment attributes empirically demonstrated the direct or indirect influence of the environment on various perceptions. It also identified 15 detail indicators’ significant influence, including distance from the city center, land use mix, density indicators of various functional services POI points, and density of road networks and intersections in “density”, “diversity”, “design”, and “destination accessibility” four dimensions. In order to further understand public sentiment perception distribution characteristics in the Beijing metro station area, the K-Means clustering method was used to cluster 178 stations. According to the Elbow Method, when K = 8, the trend of the sum of squares of errors in clusters tends to be smooth, so when K = 8, it is a relatively stable optimal cluster number.
According to cluster analysis, groups 1, 3, 5, and 7 were the dominant groups of positive sentiment, while groups 2, 4, 6, and 8 were more negative Figure 7. The inner city within the Second Ring Road clusters positive sentiments, while the hinterland of the Third and Fourth Ring Roads is dominated by negative clusters 4 and 6, in addition, cluster 8 is mainly located on the periphery of the Fifth Ring Road. Therefore, combined with the characteristics of the built environment and public sentiment perception in the study area, the eight types of station space are specifically integrated into four types, including the center city positive type, the hinterland positive type, the hinterland negative type, the marginal city negative type, and eight subtypes, namely: “7-core happy subtype”, “3-old town happy subtype”, “1-ecological pleasant subtype”, “5-balanced pleasant subtype”, “2-work pressure subtype”, “6-low efficiency subtype”, “4-low quality subtype”, and “8-low matching subtype”. Based on the investigation of the actual built environment of the stations, we chose two representative stations in each cluster, and the land use and environmental characteristics of the stations are analyzed and summarized as follows Figure 8.
The core happy subtype represented by Wangfujing Station and the old town happy subtype represented by Zhushikou Station are mostly distributed in the center city space of Beijing within the Third Ring Road, mainly in the Second Ring Road, and the built environment characteristics of their station space can reflect the inherent urban landscape and spatial characteristics of the old Beijing city. The former is mainly concentrated in Beijing’s commercial and business centers, and the land use functions of the station area are more comprehensive, while the latter covers a large area of residential space in the old town quadrangle, but has the commonality of balanced and convenient services of various facilities, higher building density and road network density, and higher quality of the built environment. The ecological pleasant subtype represented by the Agricultural Exhibition Center and the balanced pleasant subtype represented by Wukesong Station is mainly located within the Fourth Ring Road, with the former containing large parks or squares and other leisure facilities and the latter mainly located on the north side of Line 1. This kind of station area has moderate spatial dimensions, or there is no large park but the greening rate in the area is also high; the building density and road network density are lower than the former, but the morphology is regular, the landscape and environment are pleasant, the density of facilities and services can meet the demand guarantee, and the density of education and cultural facilities has space to be raised Figure 9.
The work pressure subtype represented by Guomao Station and the low-efficiency subtype represented by Liuliqiao Station are widely distributed, mostly gathered in groups, and there are always “pressure sources” in the space of these stations, mostly office areas and research institutes, with irregular spatial forms, chaotic and uneven distribution of road networks, and low building density. The latter is mainly distributed in Fengtai District, with a poor spatial sense, irregular road network, low density, a railroad cut-off space, various service facilities, and supporting density at a low level, and the mixing degree of different functional land use has much room for improvement. Both the low-quality subtype represented by Sanyuanqiao and the low-matching subtype represented by Guogongzhuang Station are high-volume and high-density living spaces outside the Fourth Ring Road. The former is within a built-up urban area, the latter is still under construction. The low-quality subtype is distributed in the form of “More in the north and less in the south”, and the low-matching subtype is mostly located at the end of rail lines, with two or three stations as a group, and the public sentiment perception is the most negative. It is necessary to improve the density of all kinds of facilities and improve the comprehensive vitality of the metro station area by fine control of the residential buildings and space morphology Figure 10.

5. Conclusions

In the context of advocating human-centered urban space construction, the rapid development of Beijing’s rail transit has highlighted some problems such as the degradation of station space environment quality and the uneven development of station space. This paper summarizes public sentiment perception and spatial characteristics in Beijing metro station space based on sentiment intensity, polarity, and six sentiment types extracted from Weibo, which is the most popular social media platform in China. The results show that the sentiment distribution in the metro station area within Fifth Ring Road in Beijing is characterized by a “strong in the east and weak in the west, strong in the north and weak in the south” spatial pattern, which is coupled with the urban functional zone planning. At present, highly positive sentiment clusters have been formed in the northeast of Beijing, while highly negative sentiment clusters have been formed in the northwest of Beijing, showing the influence of urban function and land use basements on the metro station area.
On the basis of correlation analysis and multiple regression analysis, this study further demonstrates the intrinsic relationship between the spatial differentiation characteristics and the built environment in the metro station area. This study shows that the density of the built environment represented by the building density and the functional mix of the station area space such as the proportion of various types of functional facilities, as well as the design of the road network, the distance from the city center, and other indicators, have an impact on the intensity of the public sentiment perception. Among them, a closer distance to the city center and a dense area of shopping, medical, and cultural facilities usually induced the expression of highly intense positive sentiment, while the empty and loosely functional density of the terminal station area outside the Fifth Ring Road of Beijing is more likely to induce negative sentiment such as scared and disgusted.
Based on the sorting of subjective perceptions, the clustering of the Beijing metro station area is carried out from the perspective of objective built environment indicators and public sentiment perception characteristics. Therefore, the 178 stations within the Fifth Ring Road can be divided into four types: the center city positive type, the hinterland positive type, the hinterland negative type, the marginal city negative type, and eight subtypes: “core happy subtype”, “old town happy subtype”, “ecological pleasant subtype”, “balanced pleasant subtype”, “work pressure subtype”, “low efficiency subtype”, “low quality subtype”, and “low matching subtype”. Through the research and analysis of typical cases in each category, it is concluded that there is still potential for improvement in density, diversity, and design in the built environment of the metro station area in the hinterland and peripheral areas from the Third Ring to the Fifth Ring in Beijing, leading to better promoting the vitality of the station area and enhancing the development of the surrounding urban space.
Overall, in the context of TOD-oriented development, the construction of metro station areas is biased toward maximizing economic and transportation effectiveness while ignoring human perception. From the group perception perspective, this paper applies a big data-driven method to launch a systematic evaluation of 187 metro station areas in Beijing. The results confirmed that, on the one hand, the close correlation between the distribution of residents’ sentiment perceptions and built environment elements in metro station spaces, reflecting the existing characteristics and spatial patterns of station space development. On the other hand, based on public sentiment perceptions distribution and various built environment indicators of different station spaces, the station spaces were further clustered, and specific suggestions for optimizing the construction of station spaces were provided. The innovation and significance of this paper are that in the context of the existing orientation and background of the metro station construction, this paper provides a systematic approach to evaluate the built environment of metro station areas based on people’s subjective sentiments by utilizing interdisciplinary theories and methods. The large-scale mining of group sentiment characteristics helps to promote public participation in urban decision-making and can help to improve and supplement the comprehensive indexes for the design and evaluation of metro station areas and provide ideas and methods for improving the quality of the urban built environment.
Nevertheless, there are still some limitations in the study: firstly, the population of Weibo users is not enough to cover all residents, especially some elderly groups. At the same time, sentiment is an important aspect of human perception, but it cannot cover all perception processes. Secondly, human sentiment perception itself is affected by many factors and is complex and there are inevitable errors in the extraction of text data by semantic analysis. In addition, social media-based quantification of sentiment does not reflect an individual’s internal emotional processes but rather an outward reflection of a group’s sentiment characteristic in a certain regional scope. Therefore, it is difficult for us to accurately analyze the causes of sentiment from an individual perspective. In the future, more in-depth research can be conducted by incorporating research methods from the field of environmental psychology. However, based on the public sentiment of the Beijing metro station area, this study lays the foundation for analyzing the behaviors of station space users at the medium and micro levels and helps to further promote the integration of station space land use and achieve a higher quality spatial organization and balance between supply and demand.

Author Contributions

Conceptualization, W.G. and X.S.; methodology, W.G., Y.G., X.S. and H.D.; software, H.D. and X.S.; writing—original draft preparation, X.S.; writing—review and editing, W.G., M.Z., X.S. and H.D.; supervision W.G. and Y.G. All authors have read and agreed to the published version of the manuscript.

Funding

This work is financially supported by the Humanities and Social Science Foundation of the Ministry of Education (Grant No. 18YJA760015) and the National Natural Science Foundation of China (Grant No. 41971331).

Institutional Review Board Statement

Not applicable.

Informed Consent Statement

Informed consent was obtained from all subjects involved in the study.

Data Availability Statement

The data presented in this study are available on request from the corresponding author. The data are not publicly available due to the full results of the project have not yet been fully publicized, and the data are still confidential.

Conflicts of Interest

The authors declare no conflict of interest.

References

  1. Calthorpe, P. The Next American Metropolis: Ecology, Community, and the American Dream; Princeton Architectural Press: New York, NY, USA, 1993. [Google Scholar]
  2. Cervero, R.; Rood, T.; Appleyard, B. Tracking accessibility: Employment and housing opportunities in the San Francisco Bay Area. Environ. Plan. A 1999, 31, 1259–1278. [Google Scholar] [CrossRef]
  3. Gao, Y.; Chen, Y.; Mu, L.; Gong, S.; Zhang, P.; Liu, Y. Measuring urban sentiments from social media data: A dual-polarity metric approach. J. Geogr. Syst. 2022, 24, 199–221. [Google Scholar] [CrossRef]
  4. Arnold, M.B. Feelings and Emotions: The Loyola Symposium; Academic Press: Cambridge, MA, USA, 2013; Volume 7. [Google Scholar]
  5. Liu, Y.; Liu, X.; Gao, S.; Gong, L.; Kang, C.; Zhi, Y.; Chi, G.; Shi, L. Social sensing: A new approach to understanding our socioeconomic environments. Ann. Assoc. Am. Geogr. 2015, 105, 512–530. [Google Scholar] [CrossRef]
  6. Galesic, M.; Bruine de Bruin, W.; Dalege, J.; Feld, S.L.; Kreuter, F.; Olsson, H.; Prelec, D.; Stein, D.L.; van Der Does, T. Human social sensing is an untapped resource for computational social science. Nature 2021, 595, 214–222. [Google Scholar] [CrossRef] [PubMed]
  7. Lansley, G.; Longley, P.A. The geography of Twitter topics in London. Comput. Environ. Urban Syst. 2016, 58, 85–96. [Google Scholar] [CrossRef]
  8. Zhuang, Y.; Zhang, L. Station-Urban Synergy: Accessibility and Spatial Usage in Metro Station Area; Tongji University Press: Shanghai, China, 2016. [Google Scholar]
  9. Carlton, I. Histories of Transit-Oriented Development: Perspectives on the Development of the TOD Concept; Technical Report, Working Paper; University of California, Institute of Urban and Regional Development (IURD): Berkeley, CA, USA, 2009. [Google Scholar]
  10. Tao, G.; Bo, L.; Lei, T.; An, S. Research on TOD Reasonable Area around Urban Rail Traffic Site—A Case Study of West Jiangnan Station on Guangzhou No.2 Subway Line. Planners 2008, 24, 75–78. [Google Scholar]
  11. Guerra, E.; Cervero, R. Is a Half-Mile Circle the Right Standard for TODs? In University of California Transportation Center Working Papers; University of California Transportation Center (UCTC): Berkeley, CA, USA, 2013. [Google Scholar]
  12. hongfeng, F.; zhifang, W. A Study on the Emotional Characteristics and Influencing Factors of Urban Park Users: Taking South China Botanical Garden and Yuexiu Park as Examples. Acta Sci. Nat. Univ. Pekin. 2021, 57, 1108–1120. [Google Scholar]
  13. Boroski, J.; Faulkner, T.; Arrington, G.B. Statewide Transit-Oriented Development (TOD) Study: Factors for Success in California: Special Report, Parking and TOD: Challenges and Opportunities; California Department of Transportation: Sacramento, CA, USA, 2002. [Google Scholar]
  14. Zhonghua, Z.; Pei, Z.; Xingzhong, W.; Kanhua, Y.U. A Study on the Research Progress of Sustainable Urban Space in Foreign Countries. Urban Plan. Forum 2009, 22, 99–107. [Google Scholar]
  15. Cervero, R.; Kockelman, K. Travel demand and the 3Ds: Density, diversity, and design. Transp. Res. Part D Transp. Environ. 1997, 2, 199–219. [Google Scholar] [CrossRef]
  16. Ralph, K.; Voulgaris, C.T.; Brown, A. Travel and the Built Environment. Transp. Res. Rec. J. Transp. Res. Board 2017, 2653, 1–9. [Google Scholar] [CrossRef]
  17. Bertolini, L. Spatial development patterns and public transport: The application of an analytical model in the Netherlands. Plan. Pract. Res. 1999, 14, 199–210. [Google Scholar] [CrossRef]
  18. El-Geneidy, A.; Levinson, D.; Diab, E.; Boisjoly, G.; Verbich, D.; Loong, C. The cost of equity: Assessing transit accessibility and social disparity using total travel cost. Transp. Res. Part A Policy Pract. 2016, 91, 302–316. [Google Scholar] [CrossRef]
  19. Christian, H.E.; Bull, F.C.; Middleton, N.J.; Knuiman, M.W.; Divitini, M.L.; Hooper, P.; Amarasinghe, A.; Giles-Corti, B. How important is the land use mix measure in understanding walking behaviour? Results from the RESIDE study. Int. J. Behav. Nutr. Phys. Act. 2011, 8, 55. [Google Scholar] [CrossRef]
  20. Badland, H.; Mavoa, S.; Boulangé, C.; Eagleson, S.; Gunn, L.; Stewart, J.; David, S.; Giles-Corti, B. Identifying, creating, and testing urban planning measures for transport walking: Findings from the Australian national liveability study. J. Transp. Health 2017, 5, 151–162. [Google Scholar] [CrossRef]
  21. Kamruzzaman, M.; Baker, D.; Washington, S.; Turrell, G. Advance transit oriented development typology: Case study in Brisbane, Australia. J. Transp. Geogr. 2014, 34, 54–70. [Google Scholar] [CrossRef]
  22. Higgins, C.D.; Kanaroglou, P.S. A latent class method for classifying and evaluating the performance of station area transit-oriented development in the Toronto region. J. Transp. Geogr. 2016, 52, 61–72. [Google Scholar] [CrossRef]
  23. Xiao, L.; Lo, S.; Liu, J.; Zhou, J.; Li, Q. Nonlinear and synergistic effects of TOD on urban vibrancy: Applying local explanations for gradient boosting decision tree. Sustain. Cities Soc. 2021, 72, 103063. [Google Scholar] [CrossRef]
  24. Tao, Z.; Zhou, J.; Lin, X.; Chao, H.; Li, G. Investigating the impacts of public transport on job accessibility in Shenzhen, China: A multi-modal approach. Land Use Policy 2020, 99, 105025. [Google Scholar] [CrossRef]
  25. Nasri, A.; Zhang, L. The analysis of transit-oriented development (TOD) in Washington, D.C. and Baltimore metropolitan areas. Transp. Policy 2014, 32, 172–179. [Google Scholar] [CrossRef]
  26. Lee, S.; Lee, B. The influence of urban form on GHG emissions in the U.S. household sector. Energy Policy 2014, 68, 534–549. [Google Scholar] [CrossRef]
  27. Tost, H.; Champagne, F.A.; Meyer-Lindenberg, A. Environmental influence in the brain, human welfare and mental health. Nat. Neurosci. 2015, 18, 1421. [Google Scholar] [CrossRef] [PubMed]
  28. Zhengwei, X.; Ye, Z.; Leiqing, X. Influencing Factors and Improvement Strategies of TOD Performance in Rail Transit Station Area. Planners 2019, 22, 5–12. [Google Scholar]
  29. Mathur, S.; Ninan, J.; Vuorinen, L.; Ke, Y.; Sankaran, S. An Exploratory Study of the Use of Social Media to Assess Benefits Realization in Transport Infrastructure Projects. Proj. Leadersh. Soc. 2021, 2, 100010. [Google Scholar] [CrossRef]
  30. Craik, K.H. Environmental psychology. Annu. Rev. Psychol. 1973, 24, 403–422. [Google Scholar] [CrossRef]
  31. Jorgensen, B.S.; Stedman, R.C. A comparative analysis of predictors of sense of place dimensions: Attachment to, dependence on, and identification with lakeshore properties. J. Environ. Manag. 2006, 79, 316–327. [Google Scholar] [CrossRef] [PubMed]
  32. Altman, I.; Low, S. Place Attachment; Plenum Press: New York, NY, USA, 1992. [Google Scholar]
  33. Proshansky, H.M. The city and self-identity. Environ. Behav. 1978, 10, 147–169. [Google Scholar] [CrossRef]
  34. Proshansky, H.M. Place identity: Physical world socialisation of the self. J. Environ. Psychol. 1983, 3, 299–313. [Google Scholar] [CrossRef]
  35. Stokols, D. People in Places: A Transactional View of Settings. In Cognition, Social Behavior, and the Environment. 1981. Available online: https://escholarship.org/uc/item/48v387g7 (accessed on 11 January 2024).
  36. Shamai, S. Sense of place: An empirical measurement. Geoforum 1991, 22, 347–358. [Google Scholar] [CrossRef]
  37. Jorgensen, B.S.; Stedman, R.C. Measuring the spatial component of sense of place: A methodology for research on the spatial dynamics of psychological experiences of places. Environ. Plan. B Plan. Des. 2011, 38, 795–813. [Google Scholar] [CrossRef]
  38. Kyle, G.; Chick, G. The social construction of a sense of place. Leis. Sci. 2007, 29, 209–225. [Google Scholar] [CrossRef]
  39. Beidler, K.J.; Morrison, J.M. Sense of place: Inquiry and application. J. Urban. Int. Res. Placemaking Urban Sustain. 2016, 9, 205–215. [Google Scholar] [CrossRef]
  40. Schreyer, R.; Jacobs, G.; White, R.G. Environmental meaning as a determinant of spatial behaviour in recreation. In Proceedings of the Applied Geography Conferences, Volume 4; Department of Geography, State University of New York: Buffalo, NY, USA, 1981; pp. 294–300. [Google Scholar]
  41. Williams, D.R.; Roggenbuck, J.W. Measuring place attachment: Some preliminary results. In Proceedings of the NRPA Symposium on Leisure Research, San Antonio, TX, USA, 20–22 October 1989; Volume 9. [Google Scholar]
  42. Jorgensen, B.S.; Stedman, R.C. Sense of place as an attitude: Lakeshore owners attitudes toward their properties. J. Environ. Psychol. 2001, 21, 233–248. [Google Scholar] [CrossRef]
  43. Davidson, J.; Cameron, L.; Smith, M.M.; Bondi, L. Emotion, Place and Culture; Ashgate Publishing, Ltd.: Farnham, UK, 2012. [Google Scholar]
  44. Strongman, K.T. The Psychology of Emotion: Theories of Emotion in Perspective; John Wiley & Sons: Hoboken, NJ, USA, 1996. [Google Scholar]
  45. Sonnenfeld, J. Environment and Cognition. Ann. Assoc. Am. Geogr. 1974, 64, 338–340. Available online: http://www.jstor.org/stable/2562530 (accessed on 11 January 2024).
  46. Ittelson, W.H.; Proshansky, H.M.; Rivlin, L.G.; Winkel, G.H. An Introduction to Environmental Psychology; Holt, Rinehart & Winston: Austin, TX, USA, 1974. [Google Scholar]
  47. Mehrabian, A.; Russell, J.A. An Approach to Environmental Psychology; The MIT Press: Cambridge, MA, USA, 1974. [Google Scholar]
  48. Ulrich, R.S. Aesthetic and affective response to natural environment. In Behavior and the Natural Environment; Springer: Berlin/Heidelberg, Germany, 1983; pp. 85–125. [Google Scholar]
  49. Amedeo, D. Emotions in person-environment-behavior episodes. In Advances in Psychology; Elsevier: Amsterdam, The Netherlands, 1993; Volume 96, pp. 83–116. [Google Scholar]
  50. Collins, C.; Hasan, S.; Ukkusuri, S.V. A Novel Transit Rider Satisfaction Metric A Novel Transit Rider Satisfaction Metric: Rider Sentiments Measured from Online Social Media Data. J. Public Transp. 2013, 16, 21–45. [Google Scholar] [CrossRef]
  51. Izard, C.E. Basic Emotions, Natural Kinds, Emotion Schemas, and a New Paradigm. Perspect. Psychol. Sci. 2007, 2, 260. [Google Scholar] [CrossRef]
  52. Ekman, P.; Friesen, W. Constants across cultures in the face and emotion. J. Personal. Soc. Psychol. 1971, 172, 124–129. [Google Scholar] [CrossRef]
  53. Plutchik, R. A Theory of Ego Defenses. 1995. Available online: https://books.google.co.jp/books?id=YiRhdsC8L7IC (accessed on 11 January 2024).
  54. Valtchanov, D.; Ellard, C.G. Cognitive and affective responses to natural scenes: Effects of low level visual properties on preference, cognitive load and eye-movements. J. Environ. Psychol. 2015, 43, 184–195. [Google Scholar] [CrossRef]
  55. Mitchell, L.; Frank, M.R.; Harris, K.D.; Dodds, P.S.; Danforth, C.M. The Geography of Happiness: Connecting Twitter Sentiment and Expression, Demographics, and Objective Characteristics of Place. PLoS ONE 2013, 8, e64417. [Google Scholar] [CrossRef]
  56. Wakamiya, S.; Lee, R.; Sumiya, K. Urban Area Characterization Based on Semantics of Crowd Activities in Twitter; Springer-Verlag: Berlin, Germany, 2011. [Google Scholar]
  57. Kahneman, D.; Krueger, A.B.; Schkade, D.; Schwarz, N.; Stone, A.A. Would you be happier if you were richer? A focusing illusion. Science 2006, 312, 1908–1910. [Google Scholar] [CrossRef]
  58. List, J.A. Field experiments: A bridge between lab and naturally occurring data. BE J. Econ. Anal. Policy 2007, 6, 0000102202153806371747. [Google Scholar] [CrossRef]
  59. Achillas, C.; Vlachokostas, C.; Moussiopoulos, N.; Banias, G. Prioritize strategies to confront environmental deterioration in urban areas: Multicriteria assessment of public opinion and experts’ views. Cities 2011, 28, 414–423. [Google Scholar] [CrossRef]
  60. Wakamiya, S.; Lee, R.; Sumiya, K. Urban area characterization based on semantics of crowd activities in twitter. In Proceedings of the GeoSpatial Semantics: 4th International Conference, GeoS 2011, Brest, France, 12–13 May 2011; Proceedings 4. Springer: Berlin/Heidelberg, Germany, 2011; pp. 108–123. [Google Scholar]
  61. Bertrand, K.Z.; Bialik, M.; Virdee, K.; Gros, A.; Bar-Yam, Y. Sentiment in new york city: A high resolution spatial and temporal view. arXiv 2013, arXiv:1308.5010. [Google Scholar]
  62. Lansley, G.; Longley, P. Deriving age and gender from forenames for consumer analytics. J. Retail. Consum. Serv. 2016, 30, 271–278. [Google Scholar] [CrossRef]
  63. Soliman, A.; Soltani, K.; Yin, J.; Padmanabhan, A.; Wang, S. Social sensing of urban land use based on analysis of Twitter users’ mobility patterns. PLoS ONE 2017, 12, e0181657. [Google Scholar] [CrossRef] [PubMed]
  64. Quercia, D.; Schifanella, R.; Aiello, L.M. The shortest path to happiness: Recommending beautiful, quiet, and happy routes in the city. In Proceedings of the 25th ACM Conference on Hypertext and Social Media, Santiago, Chile, 1–4 September 2014; pp. 116–125. [Google Scholar]
  65. Yang, L.; Duarte, C.M.; Ciriquián, P.M. Quantifying the relationship between public sentiment and urban environment in Barcelona. Cities 2022, 130, 103977. [Google Scholar] [CrossRef]
  66. Xiangru, Y. Internet GIS Approach to Interoperability of Heterogeneous Geographic Information Processing Environment. J. Wuhan Tech. Univ. Surv. Mapp. 1999, 24, 194–198. [Google Scholar]
  67. Liu, Y.; Li, Z.; Xiong, H.; Gao, X.; Wu, J. Understanding of Internal Clustering Validation Measures. In Proceedings of the ICDM 2010, the 10th IEEE International Conference on Data Mining, Sydney, Australia, 14–17 December 2010. [Google Scholar]
  68. Mohammad, S.M.; Kiritchenko, S. Using Hashtags to Capture Fine Emotion Categories from Tweets. Comput. Intell. 2015, 31, 301–326. [Google Scholar] [CrossRef]
  69. Catal, C.; Nangir, M. A sentiment classification model based on multiple classifiers. Appl. Soft Comput. 2017, 50, 135–141. [Google Scholar] [CrossRef]
  70. Ghahramani, M.; Galle, N.J.; Ratti, C.; Pilla, F. Tales of a city: Sentiment analysis of urban green space in Dublin. Cities 2021, 119, 103395. [Google Scholar] [CrossRef]
  71. Ghahramania, M.; Pillaa, F. Leveraging Artificial Intelligence to Analyze the COVID-19 Distribution Pattern based on Socio-economic Determinants. Sustain. Cities Soc. 2021, 69, 102848. [Google Scholar] [CrossRef]
  72. Su, M.H.; Wu, C.H.; Huang, K.Y.; Hong, Q.B. LSTM-based Text Emotion Recognition Using Semantic and Emotional Word Vectors. In 2018 First Asian Conference on Affective Computing and Intelligent Interaction (ACII Asia); IEEE: Piscataway, NJ, USA, 2018; pp. 1–6. [Google Scholar]
  73. Zhang, F.; Zu, J.; Hu, M.; Zhu, D.; Huang, Z. Uncovering inconspicuous places using social media check-ins and street view images. Comput. Environ. Urban Syst. 2020, 81, 101478. [Google Scholar] [CrossRef]
  74. Huang, G.; Liu, Z.; Van Der Maaten, L.; Weinberger, K.Q. Densely Connected Convolutional Networks. In Proceedings of the 2017 IEEE Conference on Computer Vision and Pattern Recognition (CVPR), Honolulu, HI, USA, 21–26 July 2017; pp. 2261–2269. [Google Scholar] [CrossRef]
  75. Jia, C.; Du, Y.; Wang, S.; Bai, T.; Fei, T. Measuring the Vibrancy of Urban Neighborhoods Using Mobile Phone Data with an Improved PageRank Algorithm; John Wiley & Sons, Ltd.: Hoboken, NJ, USA, 2019. [Google Scholar]
  76. Hlinka, J.; Hartman, D.; Jajcay, N.; Tomeček, D.; Tintěra, J.; Paluš, M. Small-world bias of correlation networks: From brain to climate. Chaos Interdiscip. J. Nonlinear Sci. 2017, 27, 035812. [Google Scholar] [CrossRef] [PubMed]
  77. Lotfi, N.; Javaherian, M.; Kaki, B.; Darooneh, A.H.; Safari, H. Ultraviolet solar flare signatures in the framework of complex network. Chaos 2020, 30, 043124. [Google Scholar] [CrossRef] [PubMed]
  78. Feng, Q.Y.; Dijkstra, H. Are North Atlantic multidecadal SST anomalies westward propagating? Geophys. Res. Lett. 2014, 41, 541–546. [Google Scholar] [CrossRef]
  79. Fraley, C.; Raftery, A.E. How Many Clusters? Which Clustering Method? Answers Via Model-Based Cluster Analysis. Comput. J. 1998, 41, 578–588. [Google Scholar] [CrossRef]
  80. Macqueen, J. Some methods for classification and analysis of multivariate observations. In Proceedings of the Fifth Berkeley Symposium on Mathematical Statistics and Probability, Berkeley, CA, USA, 27 December 1965–7 January 1966; Volume 1. [Google Scholar]
  81. Han, K.S.; Champeaux, J.L.; Roujean, J.L. A land cover classification product over France at 1 km resolution using SPOT4/VEGETATION data. Remote Sens. Environ. 2004, 92, 52–66. [Google Scholar] [CrossRef]
  82. Wagstaff, K.; Cardie, C.T.; Rogers, S.O.; Schrödl, S. Constrained K-means Clustering with Background Knowledge. In Proceedings of the Eighteenth International Conference on Machine Learning, Williamstown, MA, USA, 28 June–1 July 2001; Volume 1, pp. 577–584. [Google Scholar]
Figure 1. Research Framework.
Land 13 00090 g001
Figure 2. The scope of the metro station area.
Land 13 00090 g002
Figure 3. Left: spatial distribution of sentiment intensity Right: spatial distribution of sentiment polarity.
Land 13 00090 g003
Figure 4. Boxplot of the percentage of six types of sentiments in the metro station area.
Land 13 00090 g004
Figure 5. The spatial distribution of six types of sentiment in metro station areas.
Land 13 00090 g005
Figure 6. Correlation analysis between built environment indicators and sentiment performance (* p ≤ 0.05).
Land 13 00090 g006
Figure 7. Cluster analysis and characteristic grade graph of each cluster.
Land 13 00090 g007
Figure 8. The results of k-means cluster and representative stations in each cluster.
Land 13 00090 g008
Figure 9. The metro station areas dominated by positive sentiment perception.
Land 13 00090 g009
Figure 10. The metro station areas dominated by negative sentiment perception.
Land 13 00090 g010
Table 1. The scope of Metro station area in different cities.
CitiesTOD Metro Station Area
Washington, DCAbout 800 m from the rail transit station
and about 400 m from the general bus line
CalgaryAbout 600 m from the rail transit station
SantiagoAbout 600 m from the rail transit station
PortlandAbout 400 m from the rail transit station
SeattleAbout 400 m from the rail transit station
Table 2. Select built environment indicators of the metro station area.
NumberCatagloryIndicatorIndicator Calculation Method
D1DensityBuilding desityD1 = The base area of building/total area in each metro station area
D2 Floor Area Ratio (FAR)D2 = Total building floor area/gross lot area
D3DiversityLand-use mixtureD3 = Entropy Index of differerernt functional land use in metro station area
D4 Density of various
functional format
D4 = The number of various functional facilities POI points/
total area
D4s = The density of shopping center POI points
D4e = The density of education POI points
D4g = The density of exercise and sports related function
POI points
D4h = The density of medical related function POI points
D4a = The density of lesisure and entertainment related function
POI points
D4c = The density of culture related function POI points
D4l = The density of life service related function POI points
D4p = The density of park POI points
D4f = The density of restaurant POI points
D5DesignRoad network densityD5 = Total length of roads/total area
D6 Road intersection densityD6 = Number of road intersections/total area
D7Destination AccessibilityDistance to city centerD7 = Euclidean distance from each station to Tiananmen
D8Proximity of public transportationDensity of bus stationsD8 = Number of bus stops in each metro station area/total area
D9 Density of bus linesD9 = Number of bus lines in each metro station area/total area
D10Attributes of metro stationTransfer station or notD10 = Take 0 at ordinary stations and 1 at transfer stations
D11 Number of metro station entrances and exitsD11 = Number of metro station entrances and exits
D12 Station passenger flowD12 = The sum of the average daily passengers’ number in a week
Table 3. Multiple Regression Analysis of Sentiment Intensity and Built Environment Indicators.
IndicatorsBetaSig.VIF
D1−0.17 *0.102.84
D20.060.582.94
D3−0.090.221.28
D4s0.34 ***0.002.13
D4e0.090.201.20
D4g0.100.312.21
D4h0.29 ***0.001.67
D4a−0.140.212.92
D4c0.27 ***0.012.15
D4l−0.25 *0.084.65
D4p−0.010.871.09
D50.010.922.60
D60.060.612.70
D70.010.933.12
D80.140.283.70
D9−0.080.503.52
D10−0.030.721.66
D120.070.451.88
D11−0.090.251.50
RR-squareAdjusted R-squareDurbin-Watson
0.569a0.320.2431.96
Note: Independent variables: D1–D12 (include D4s,e,g,h,a,c,l,p); Dependent variable Sentiment intensity; *** at the 0.01 level, the correlation is highly significant; * at the 0.1 level, the correlation is relatively weak.
Table 4. Multiple Regression Analysis of the percentage of four types of sentiments and Built Environment Indicators.
HappyExcitedScaredDisgusted
BetaSig.BetaSig.BetaSig.BetaSig.
D1−0.180.11−0.120.36−0.224 *0.070.207 *0.09
D2−0.0660.560.100.420.0190.880.1870.12
D3−0.0530.48−0.040.630.0220.780.0510.52
D5−0.0850.42−0.010.970.0370.75−0.0370.75
D60.0480.660.140.260.0040.98−0.0710.55
D4s−0.0310.77−0.010.960.1630.16−0.283 ***0.01
D4e0.0360.610.000.970.0130.860.0270.72
D4g−0.3 ***0.00−0.020.85−0.0640.560.179 *0.10
D4h0.0750.38−0.060.55−0.0290.750.0670.46
D4a−0.0770.51−0.050.680.120.33−0.0410.74
D4c0.1470.130.160.15−0.1060.31−0.0130.90
D4l−0.396 ***0.01−0.190.290.382 **0.030.130.44
D4p−0.0340.63−0.080.29−0.0070.920.0240.74
D4f0.474 ***0.010.210.27−0.1590.39−0.180.32
D70.623 ***0.000.23 *0.08−0.397 ***0.00−0.31 ***0.01
D80.1220.34−0.060.66−0.1920.160.0530.69
D9−0.130.290.160.260.130.33−0.1340.31
D12−0.1010.28−0.130.20−0.1520.130.264 ***0.01
D11−0.0580.47−0.060.480.0090.910.0310.72
D100.090.290.010.890.0520.57−0.0610.50
Note: Independent variables: D1–D12 (include D4s,e,g,h,a,c,l,p,f); Dependent variable: Four sentiment types; *** at the 0.01 level, the correlation is highly significant; ** at the 0.05 level, the correlation is more significant, * at the 0.1 level, the correlation is relatively weak.
Disclaimer/Publisher’s Note: The statements, opinions and data contained in all publications are solely those of the individual author(s) and contributor(s) and not of MDPI and/or the editor(s). MDPI and/or the editor(s) disclaim responsibility for any injury to people or property resulting from any ideas, methods, instructions or products referred to in the content.

