
Spatial and Temporal Variation Characteristics of Ecological Environment Quality in China from 2002 to 2019 and Influencing Factors
 , and
, and
Abstract
:1. Introduction
2. Data
Data Sources
3. Methods
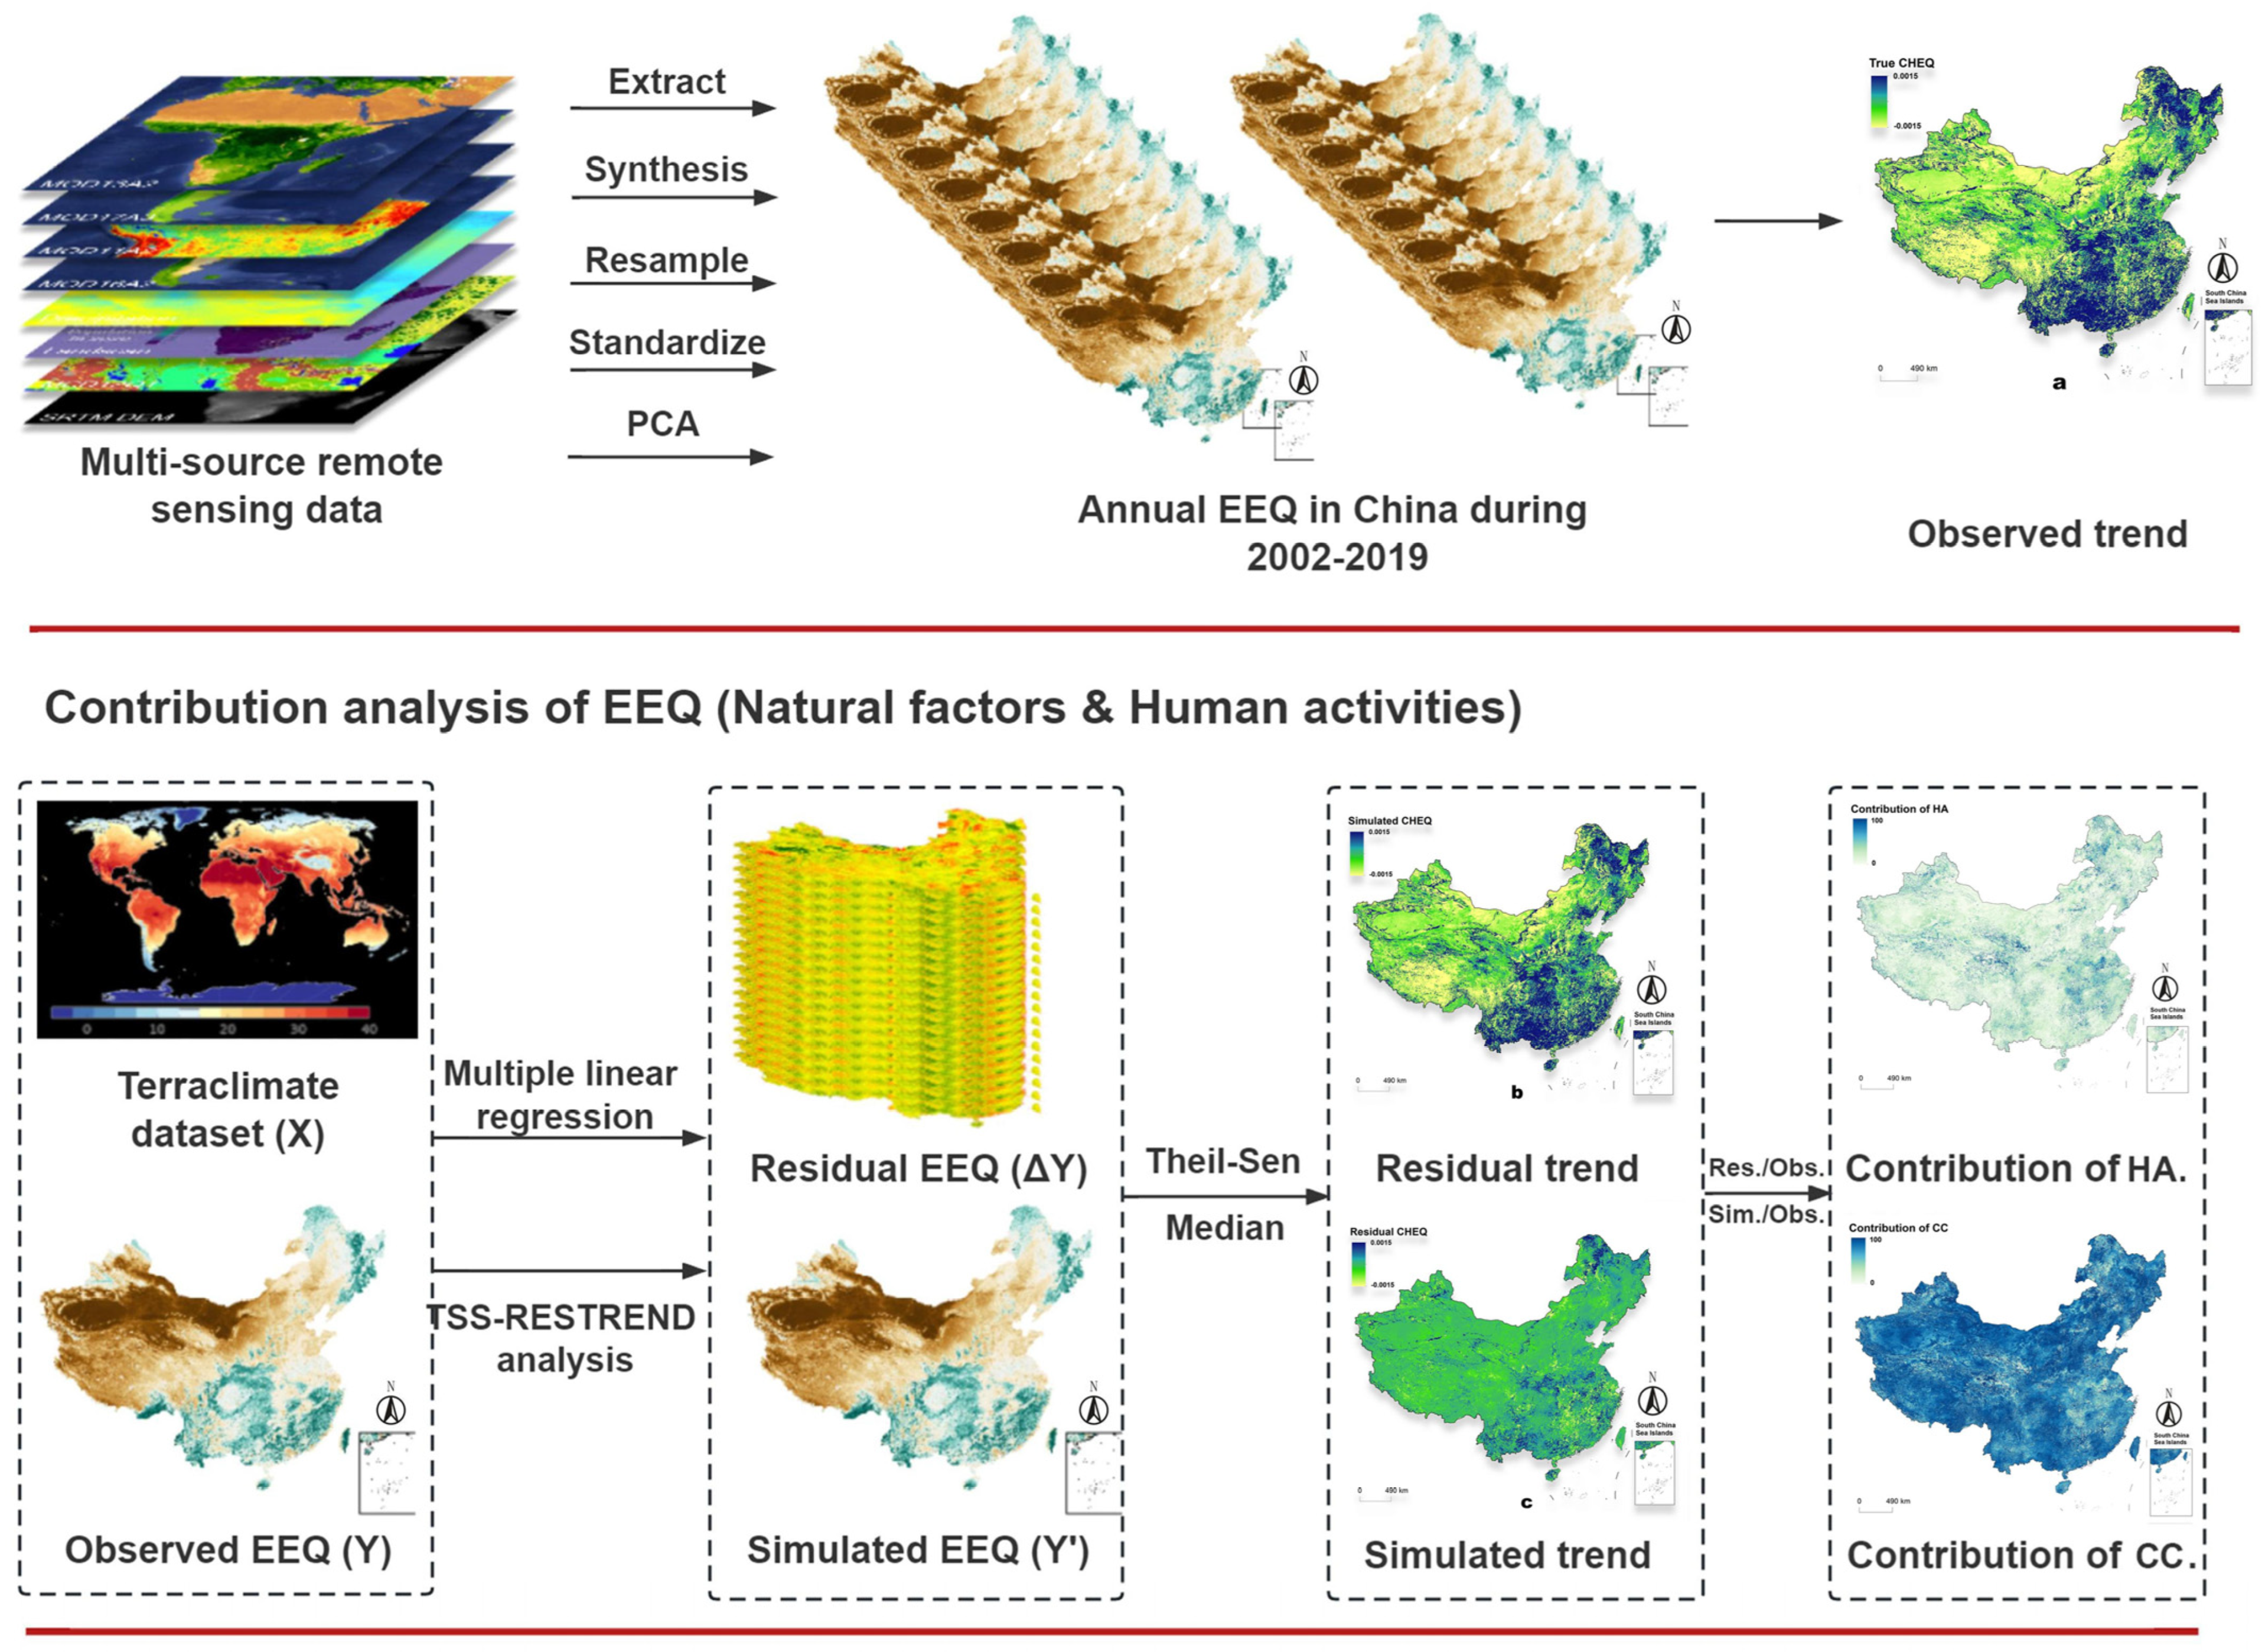
3.1. Estimation of EEQ
3.2. Theil–Sen Median Trend Analysis
3.3. Mann–Kendall Model
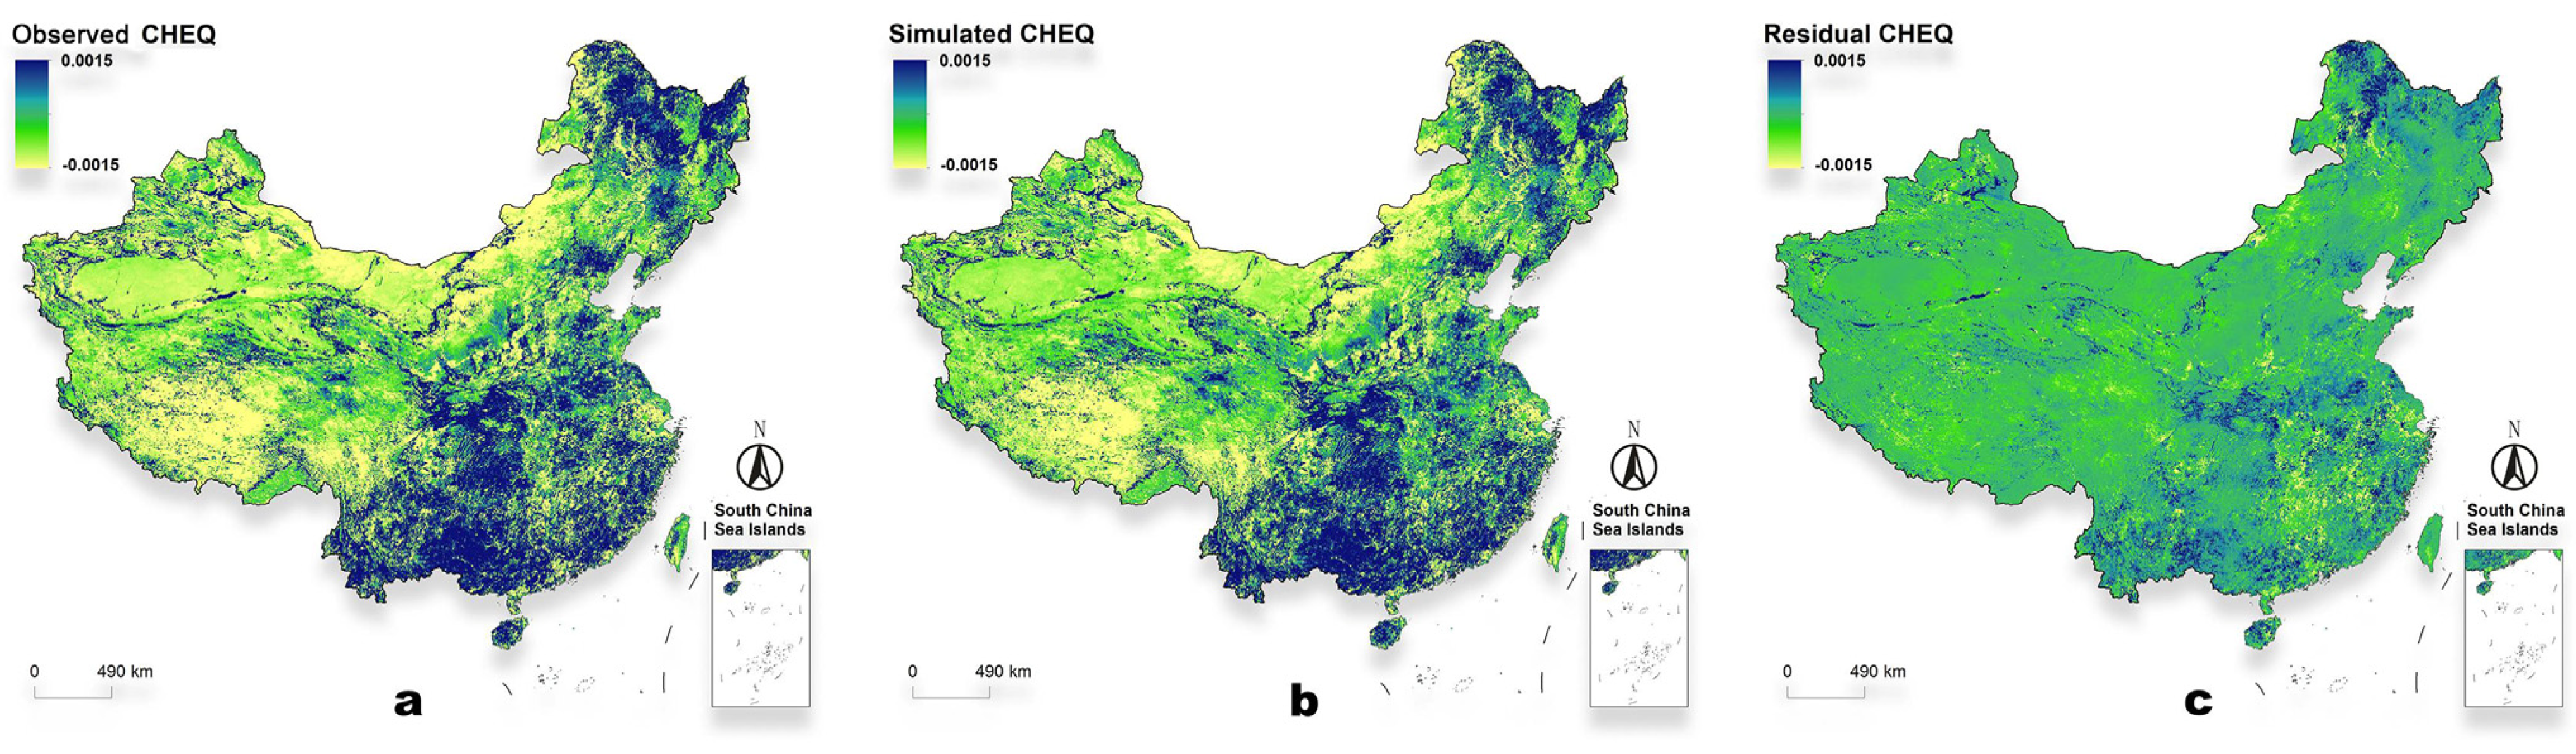
3.4. Multiple Regression Residual Analysis
- A multivariate linear regression model was constructed to establish the interrelation between climate factor indicators and CHEQ, utilizing CHEQ as the dependent variable. This model encompassed diverse factors—TEMP, PRE, AET, PET, DEF, RO, PDSI, VAP, VPD, SRAD, VS, and SOIL—as independent variables. Through this approach, the regression link between climate factor indicators and CHEQ was established.
- By integrating the regression model coefficients with climate data, the anticipated CHEQ value (denoted as CHEQCC: CHEQ influenced solely by climate change) was computed.
- To distinctly delineate the CHEQ impact attributable solely to human activities, the disparity between the observed CHEQ value and the projected CHEQ value was computed as the CHEQ residual (designated as CHEQHA).
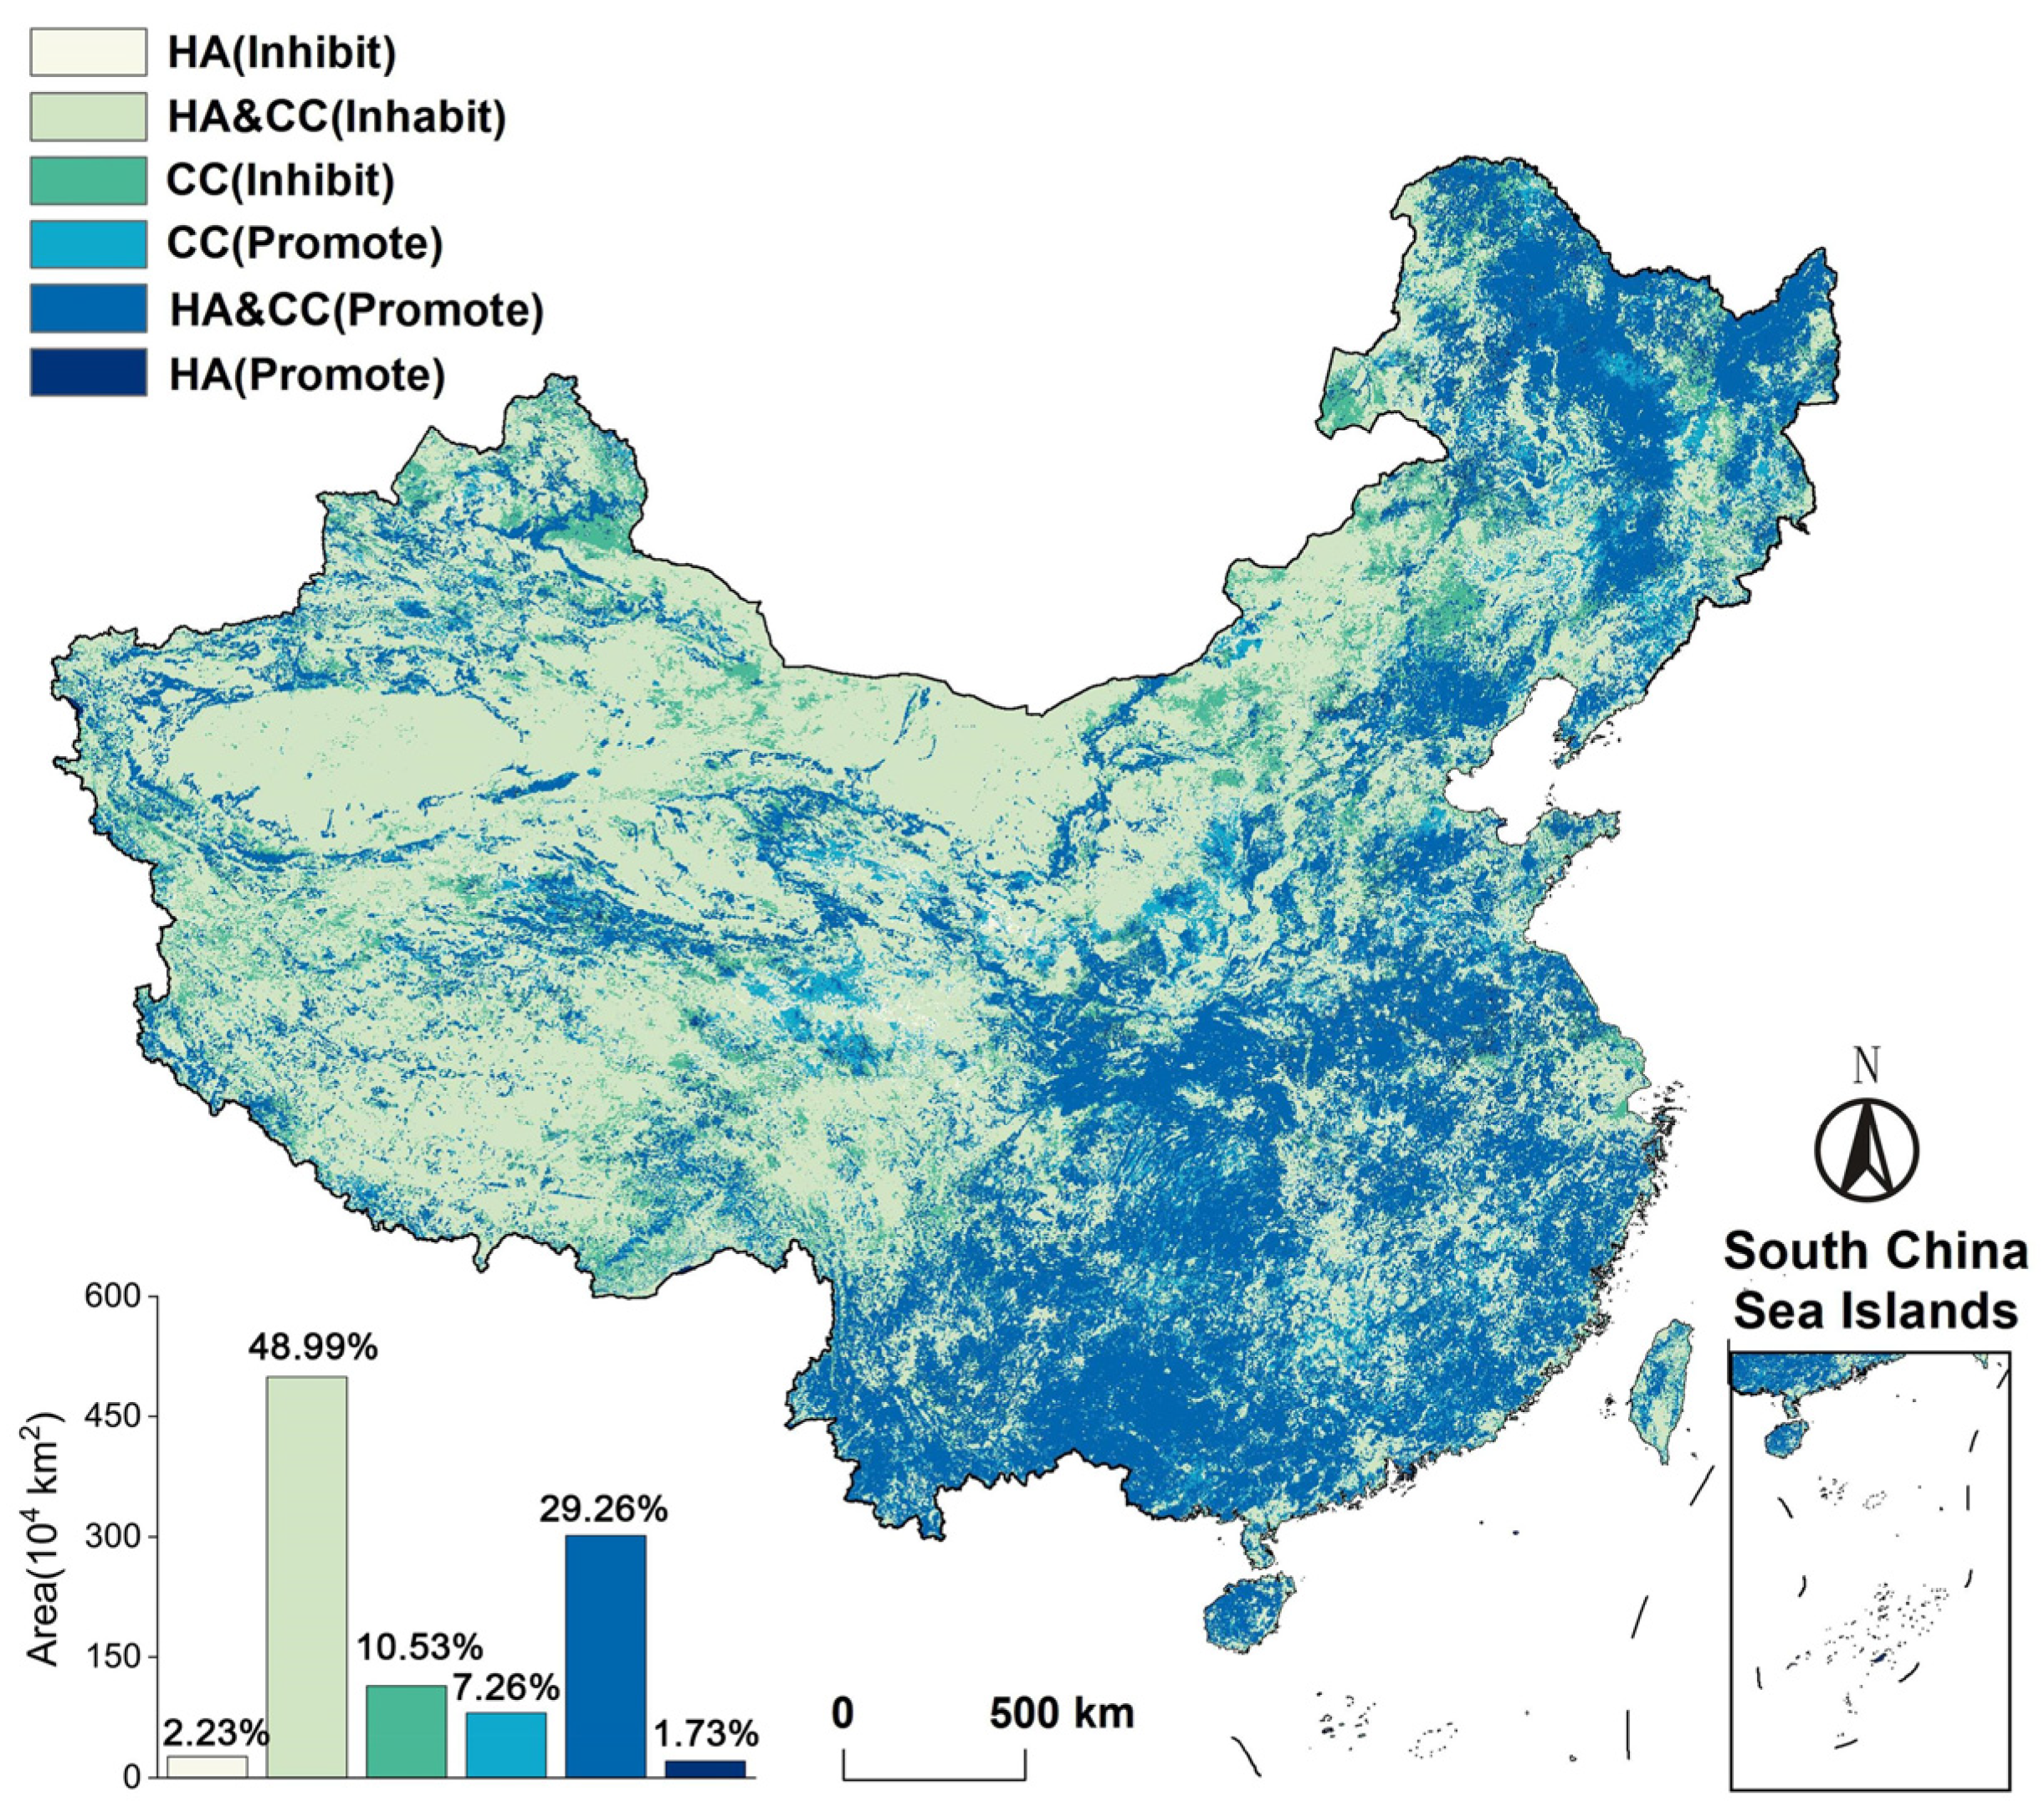
3.5. Analysis of the Determination of the Drivers of CHEQ Changes
3.6. Hurst Index
4. Results and Analysis
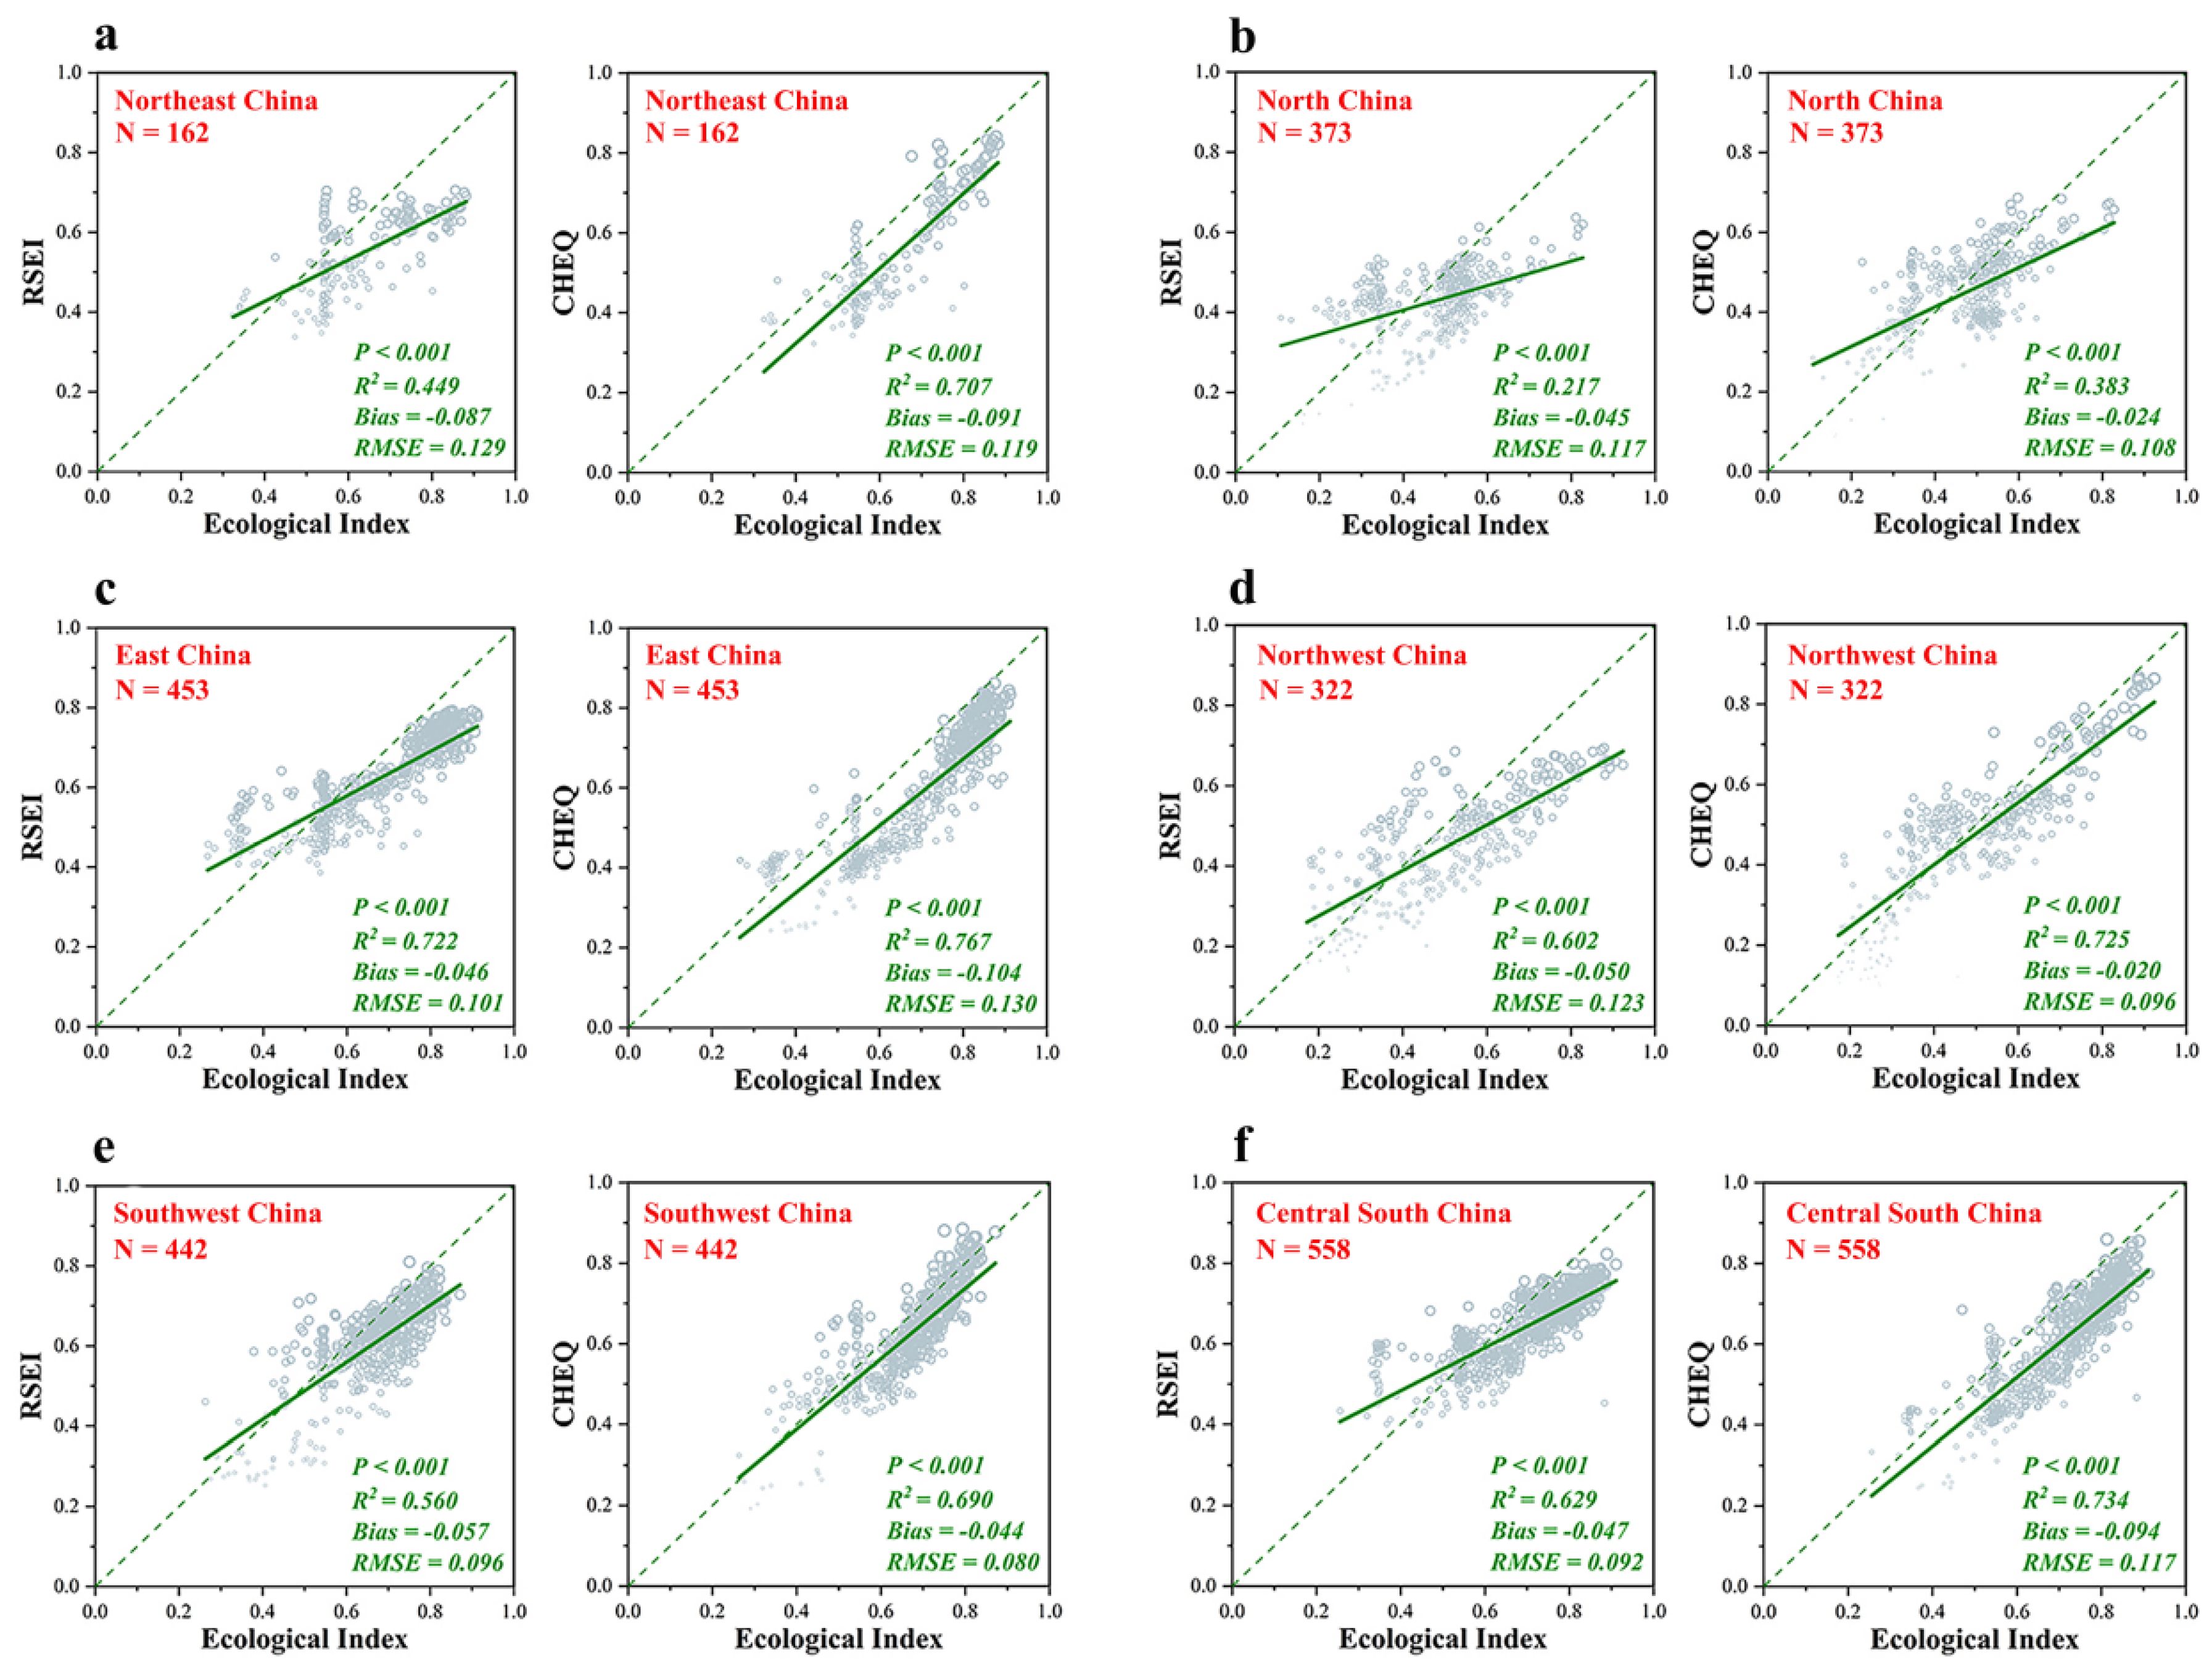
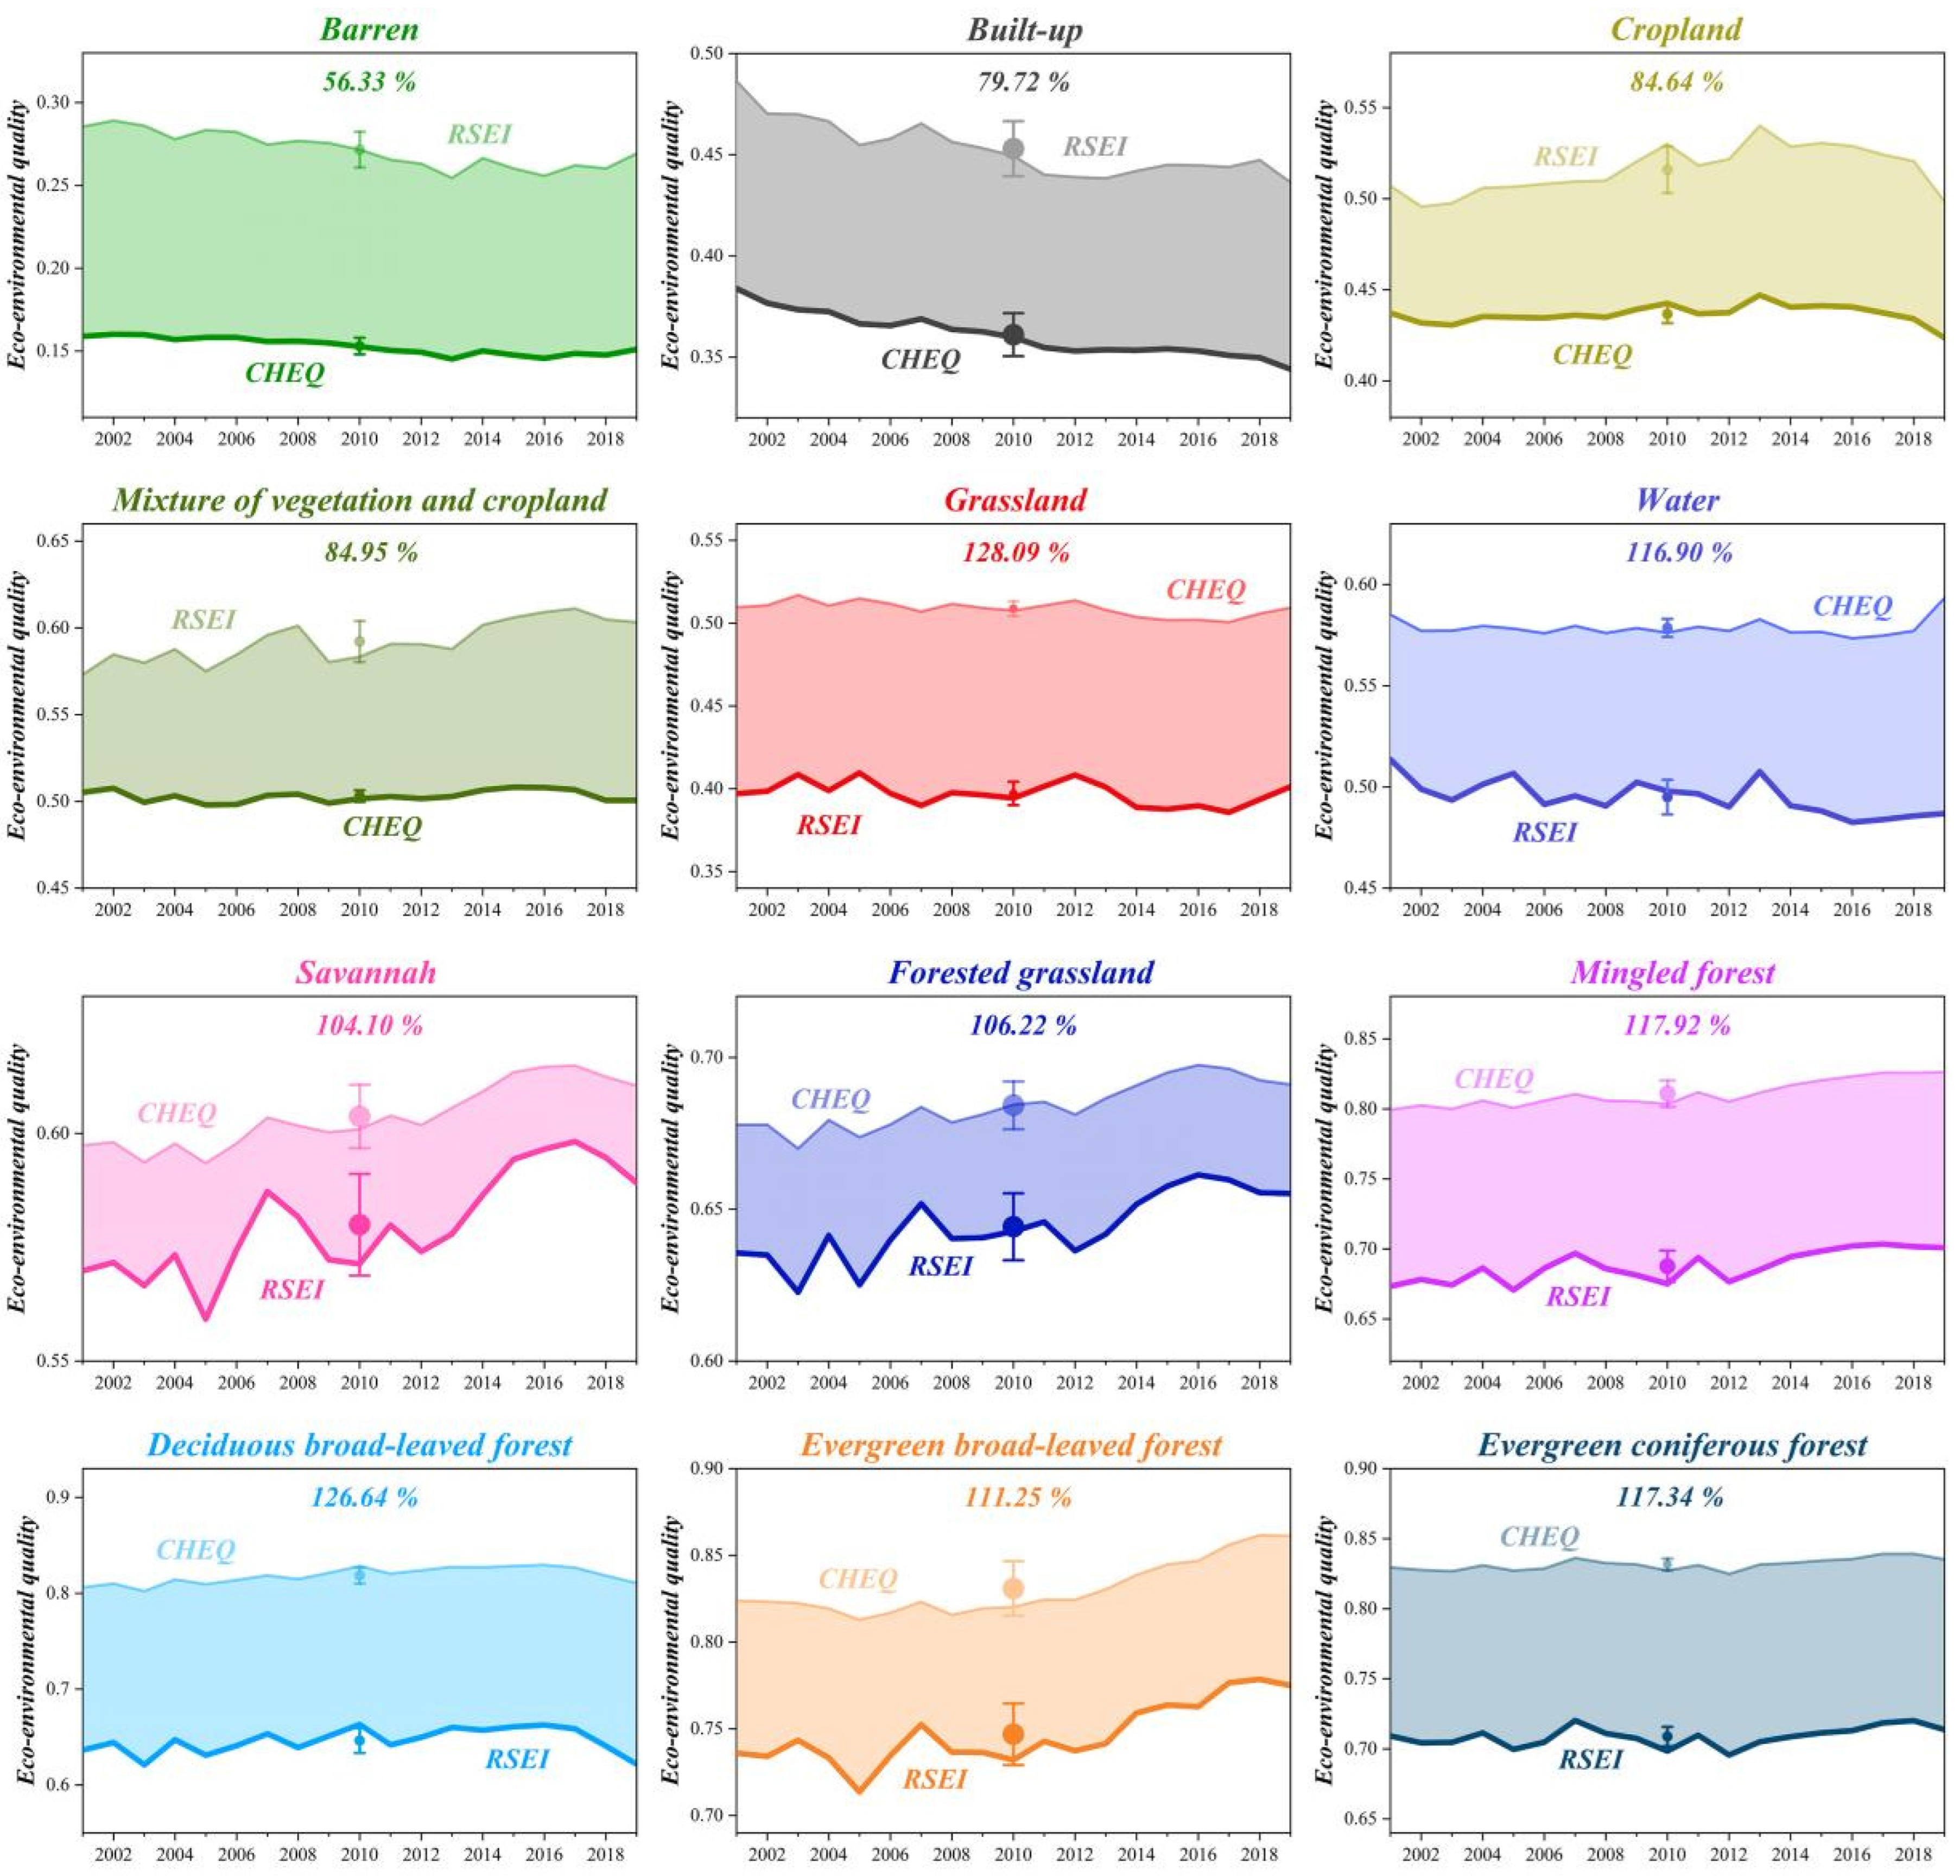
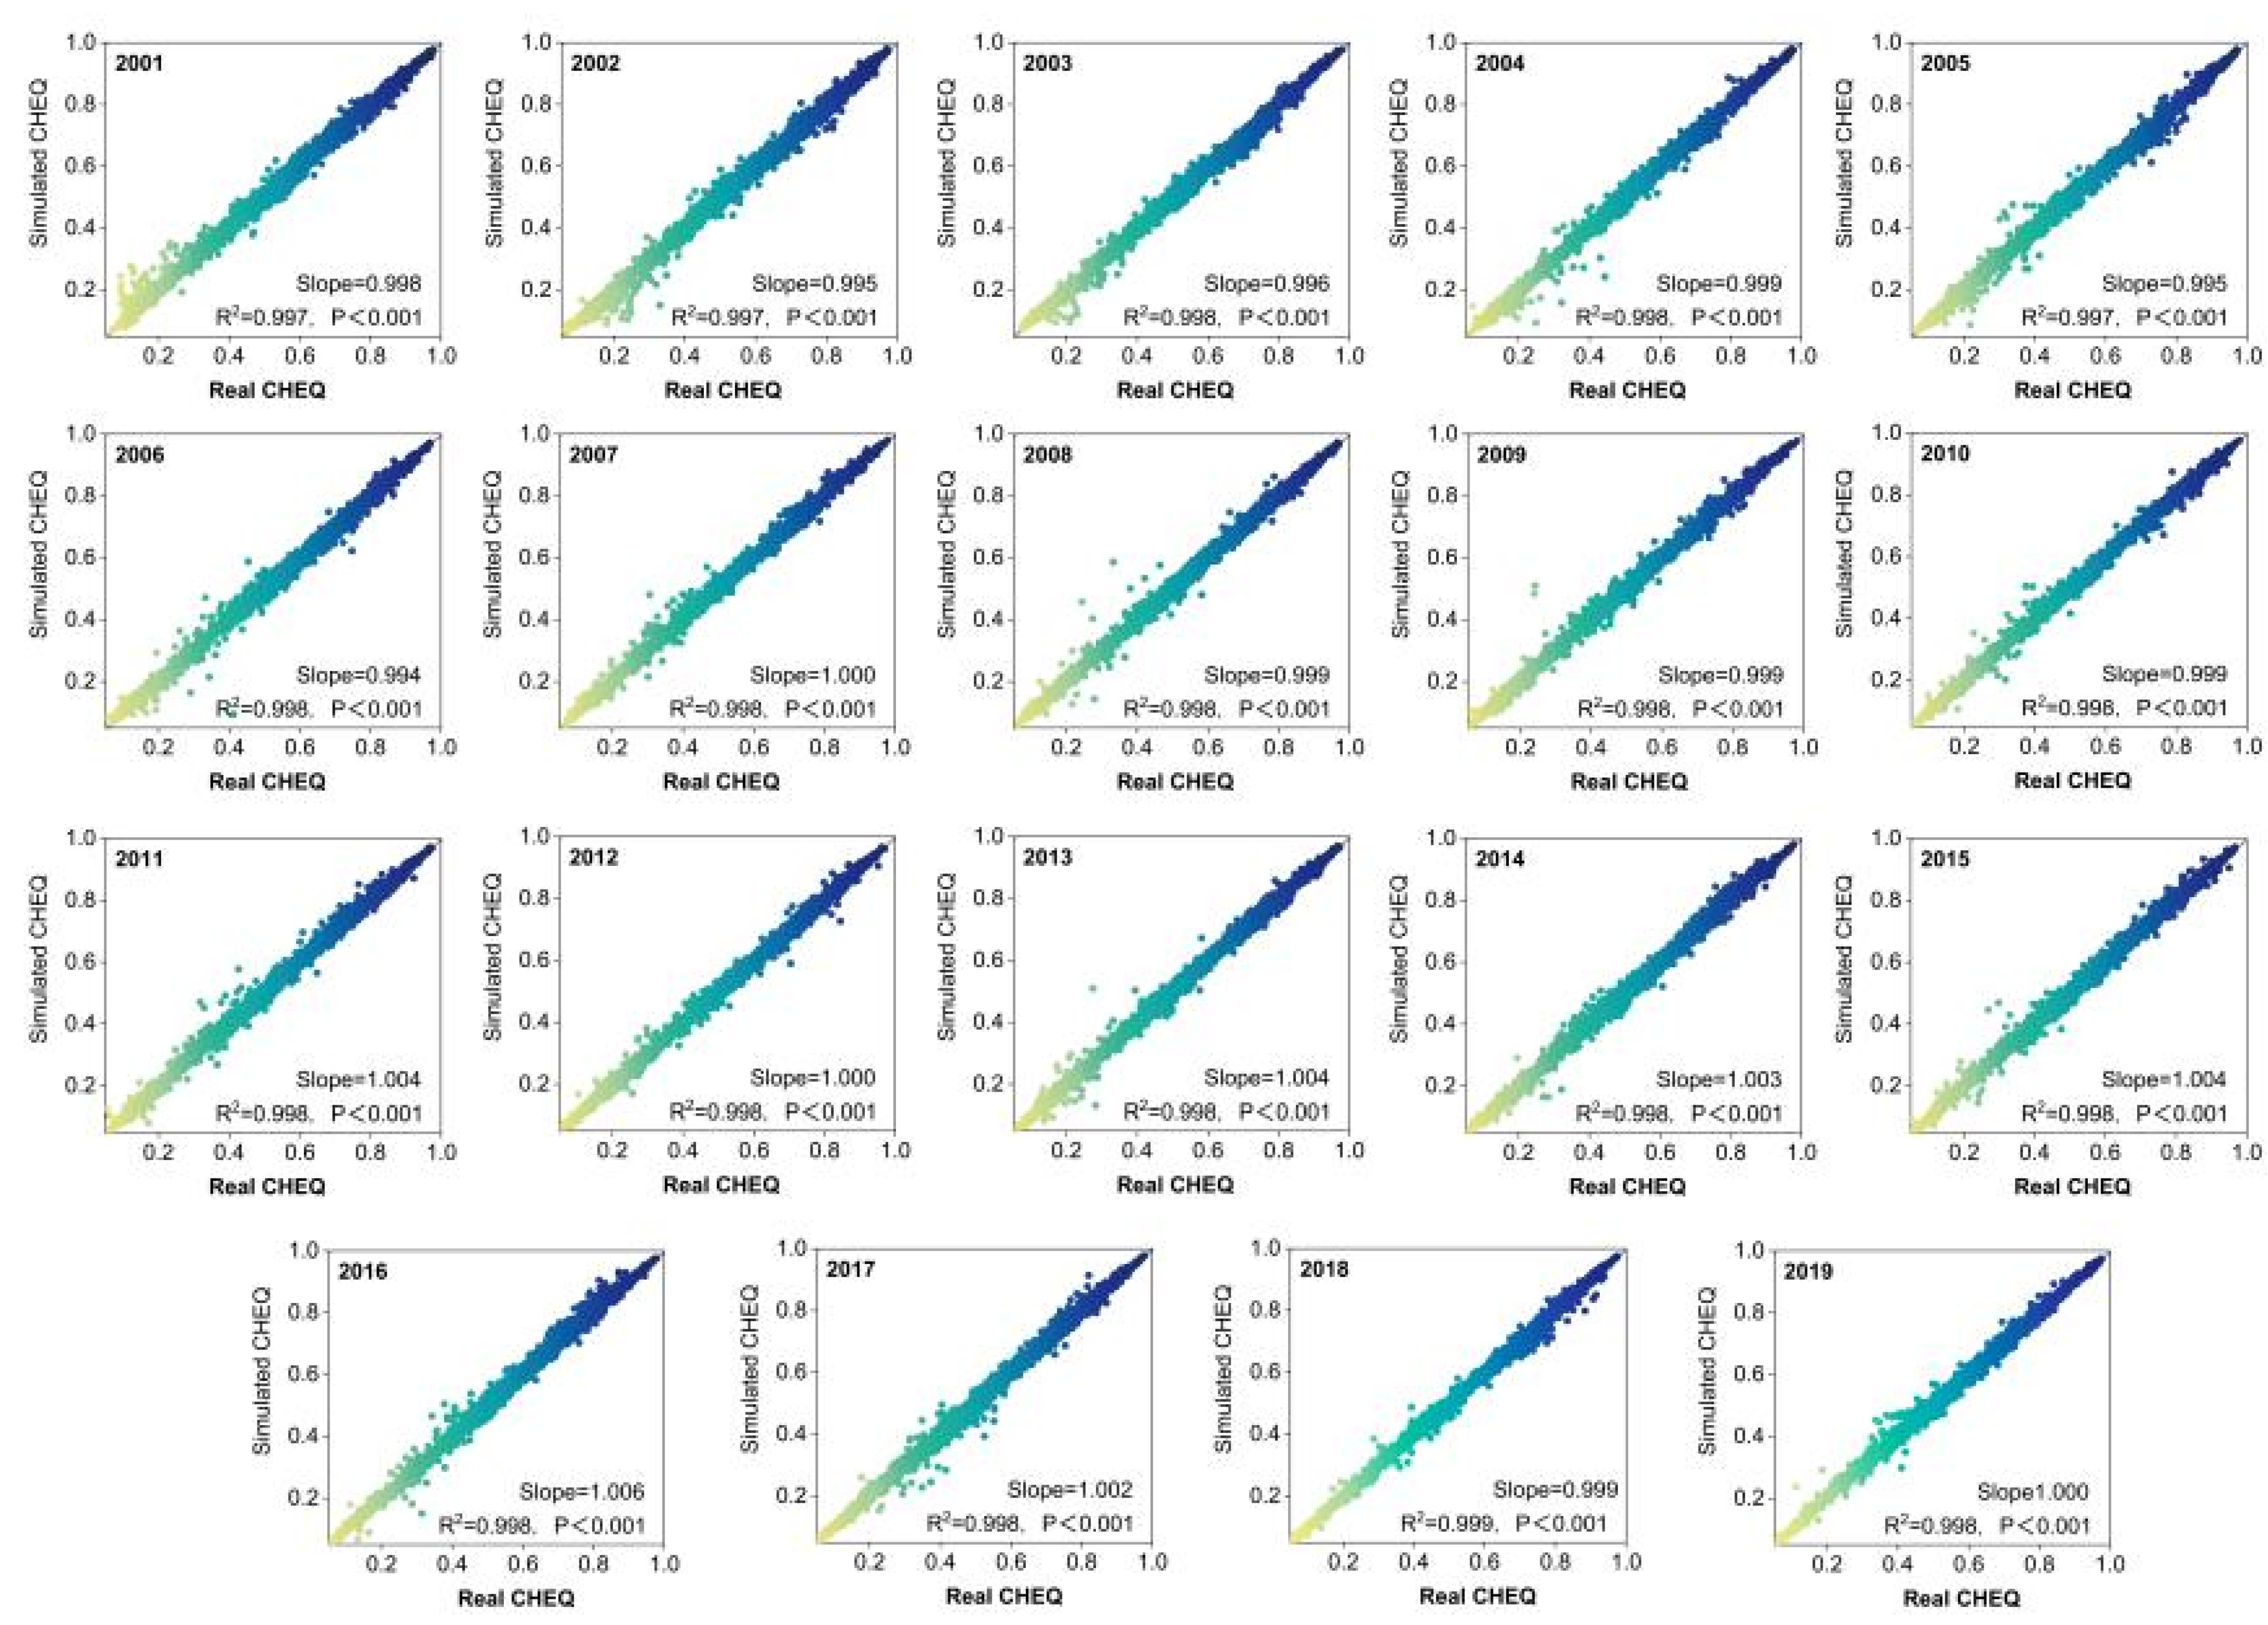
4.1. Accuracy Verification of EEQ
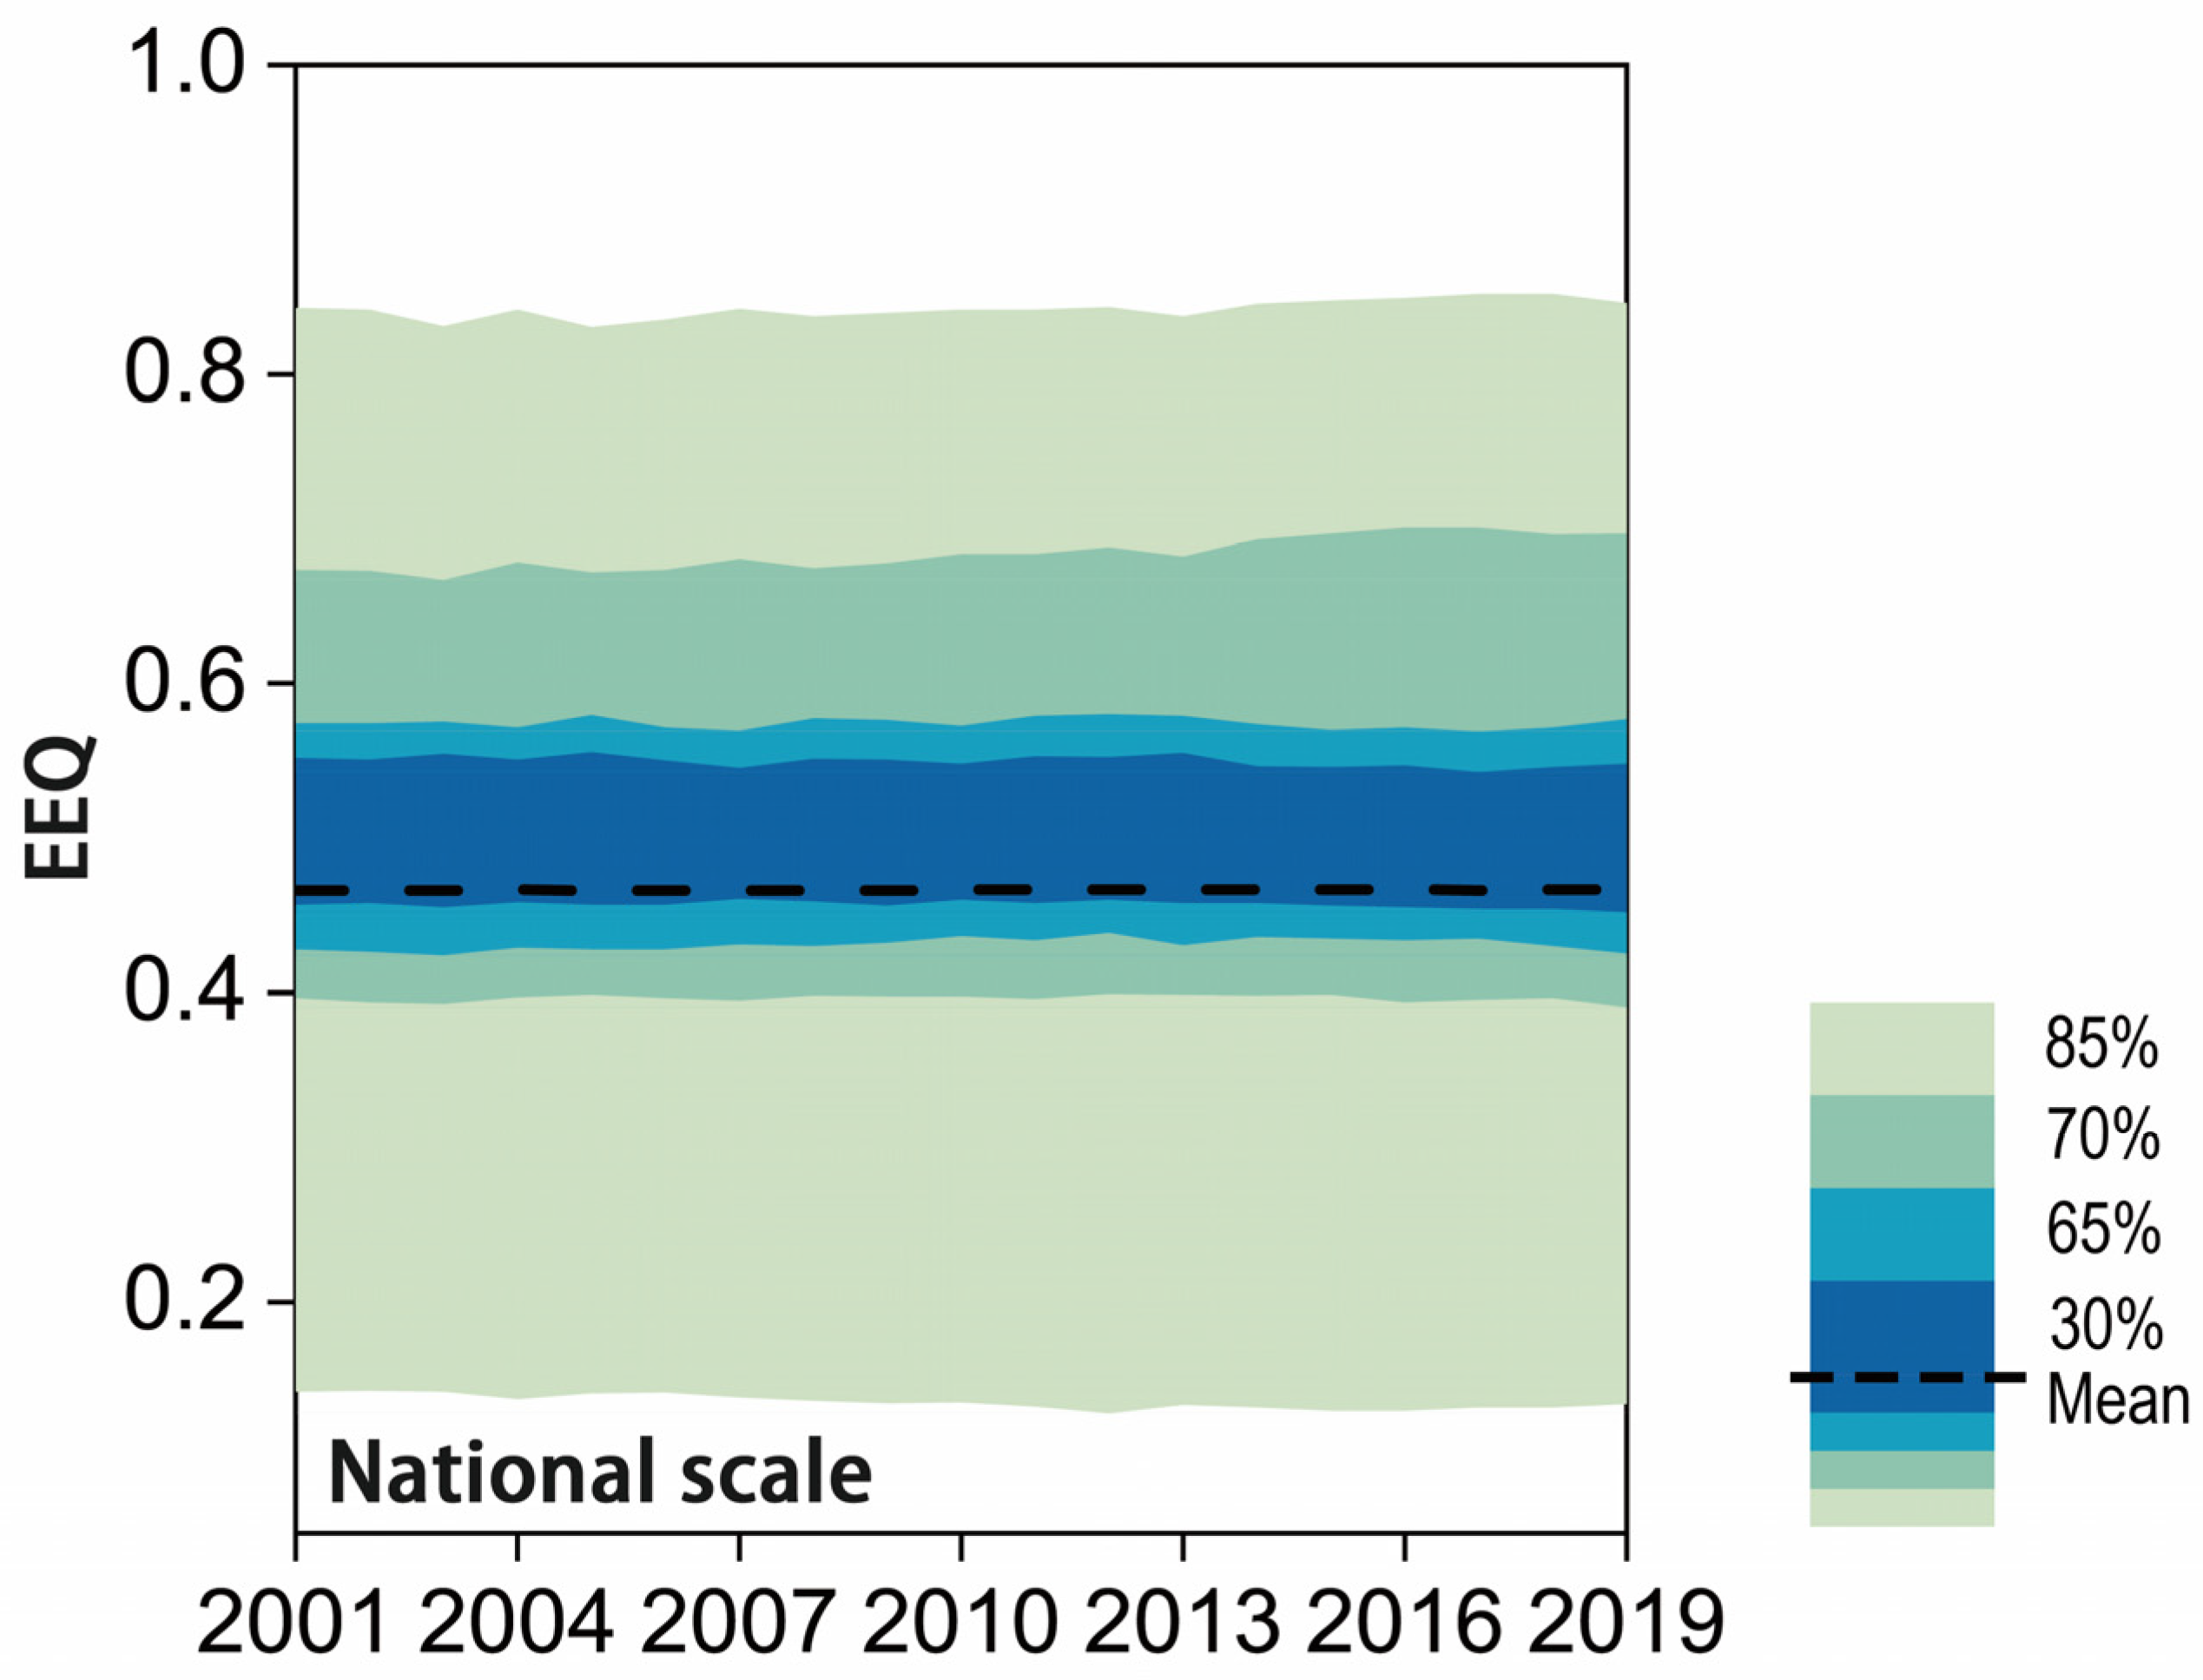
4.2. Characteristics of Spatial and Temporal Changes in the EEQ
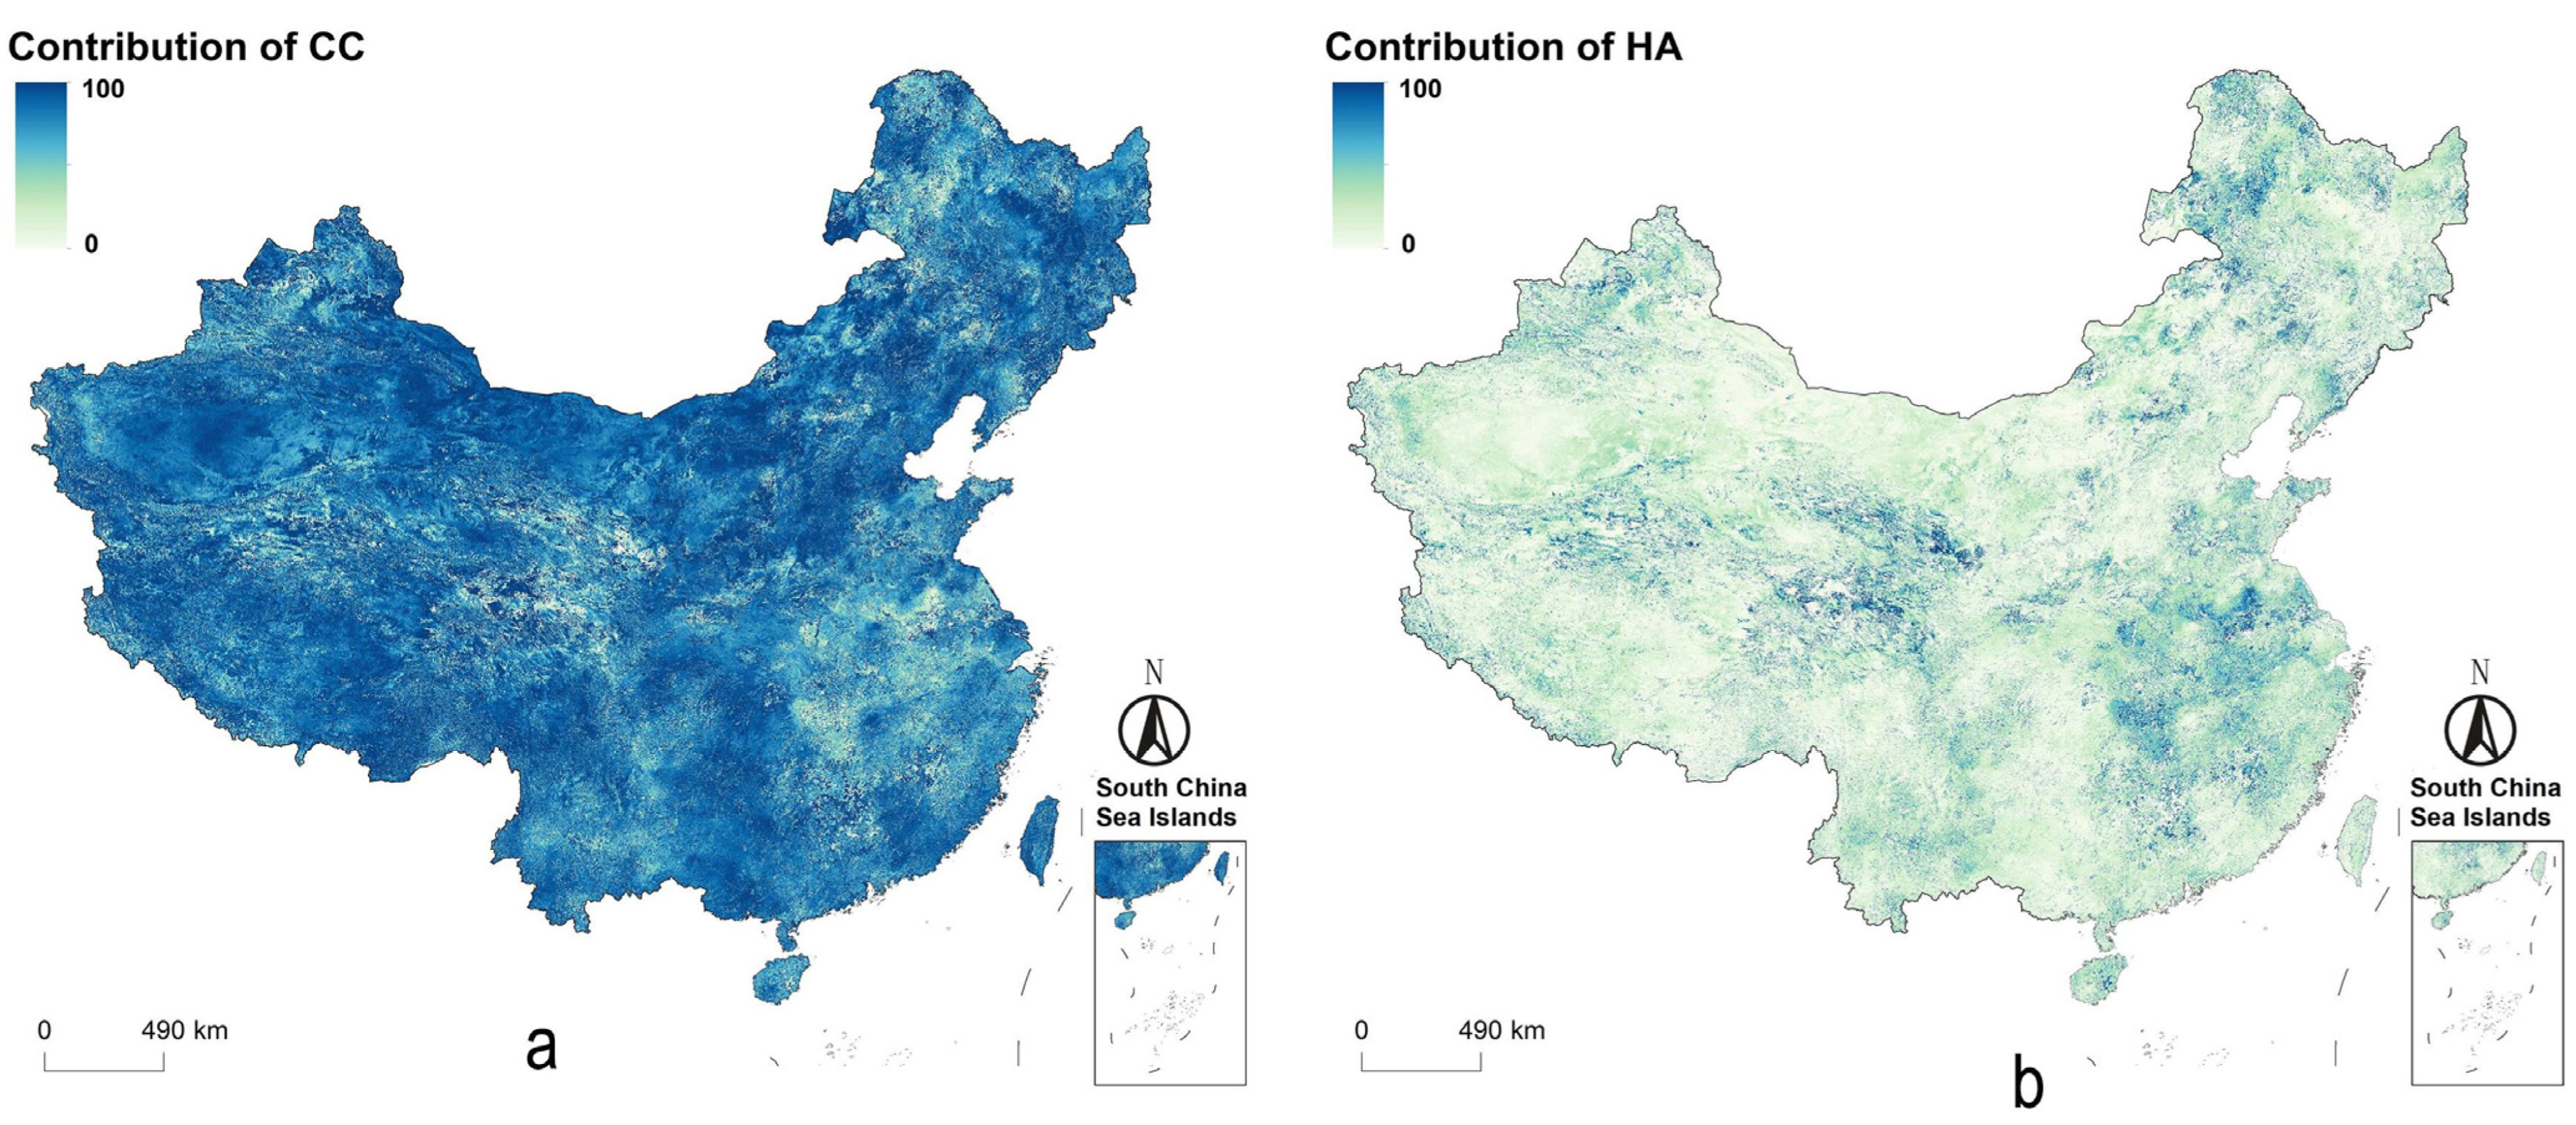
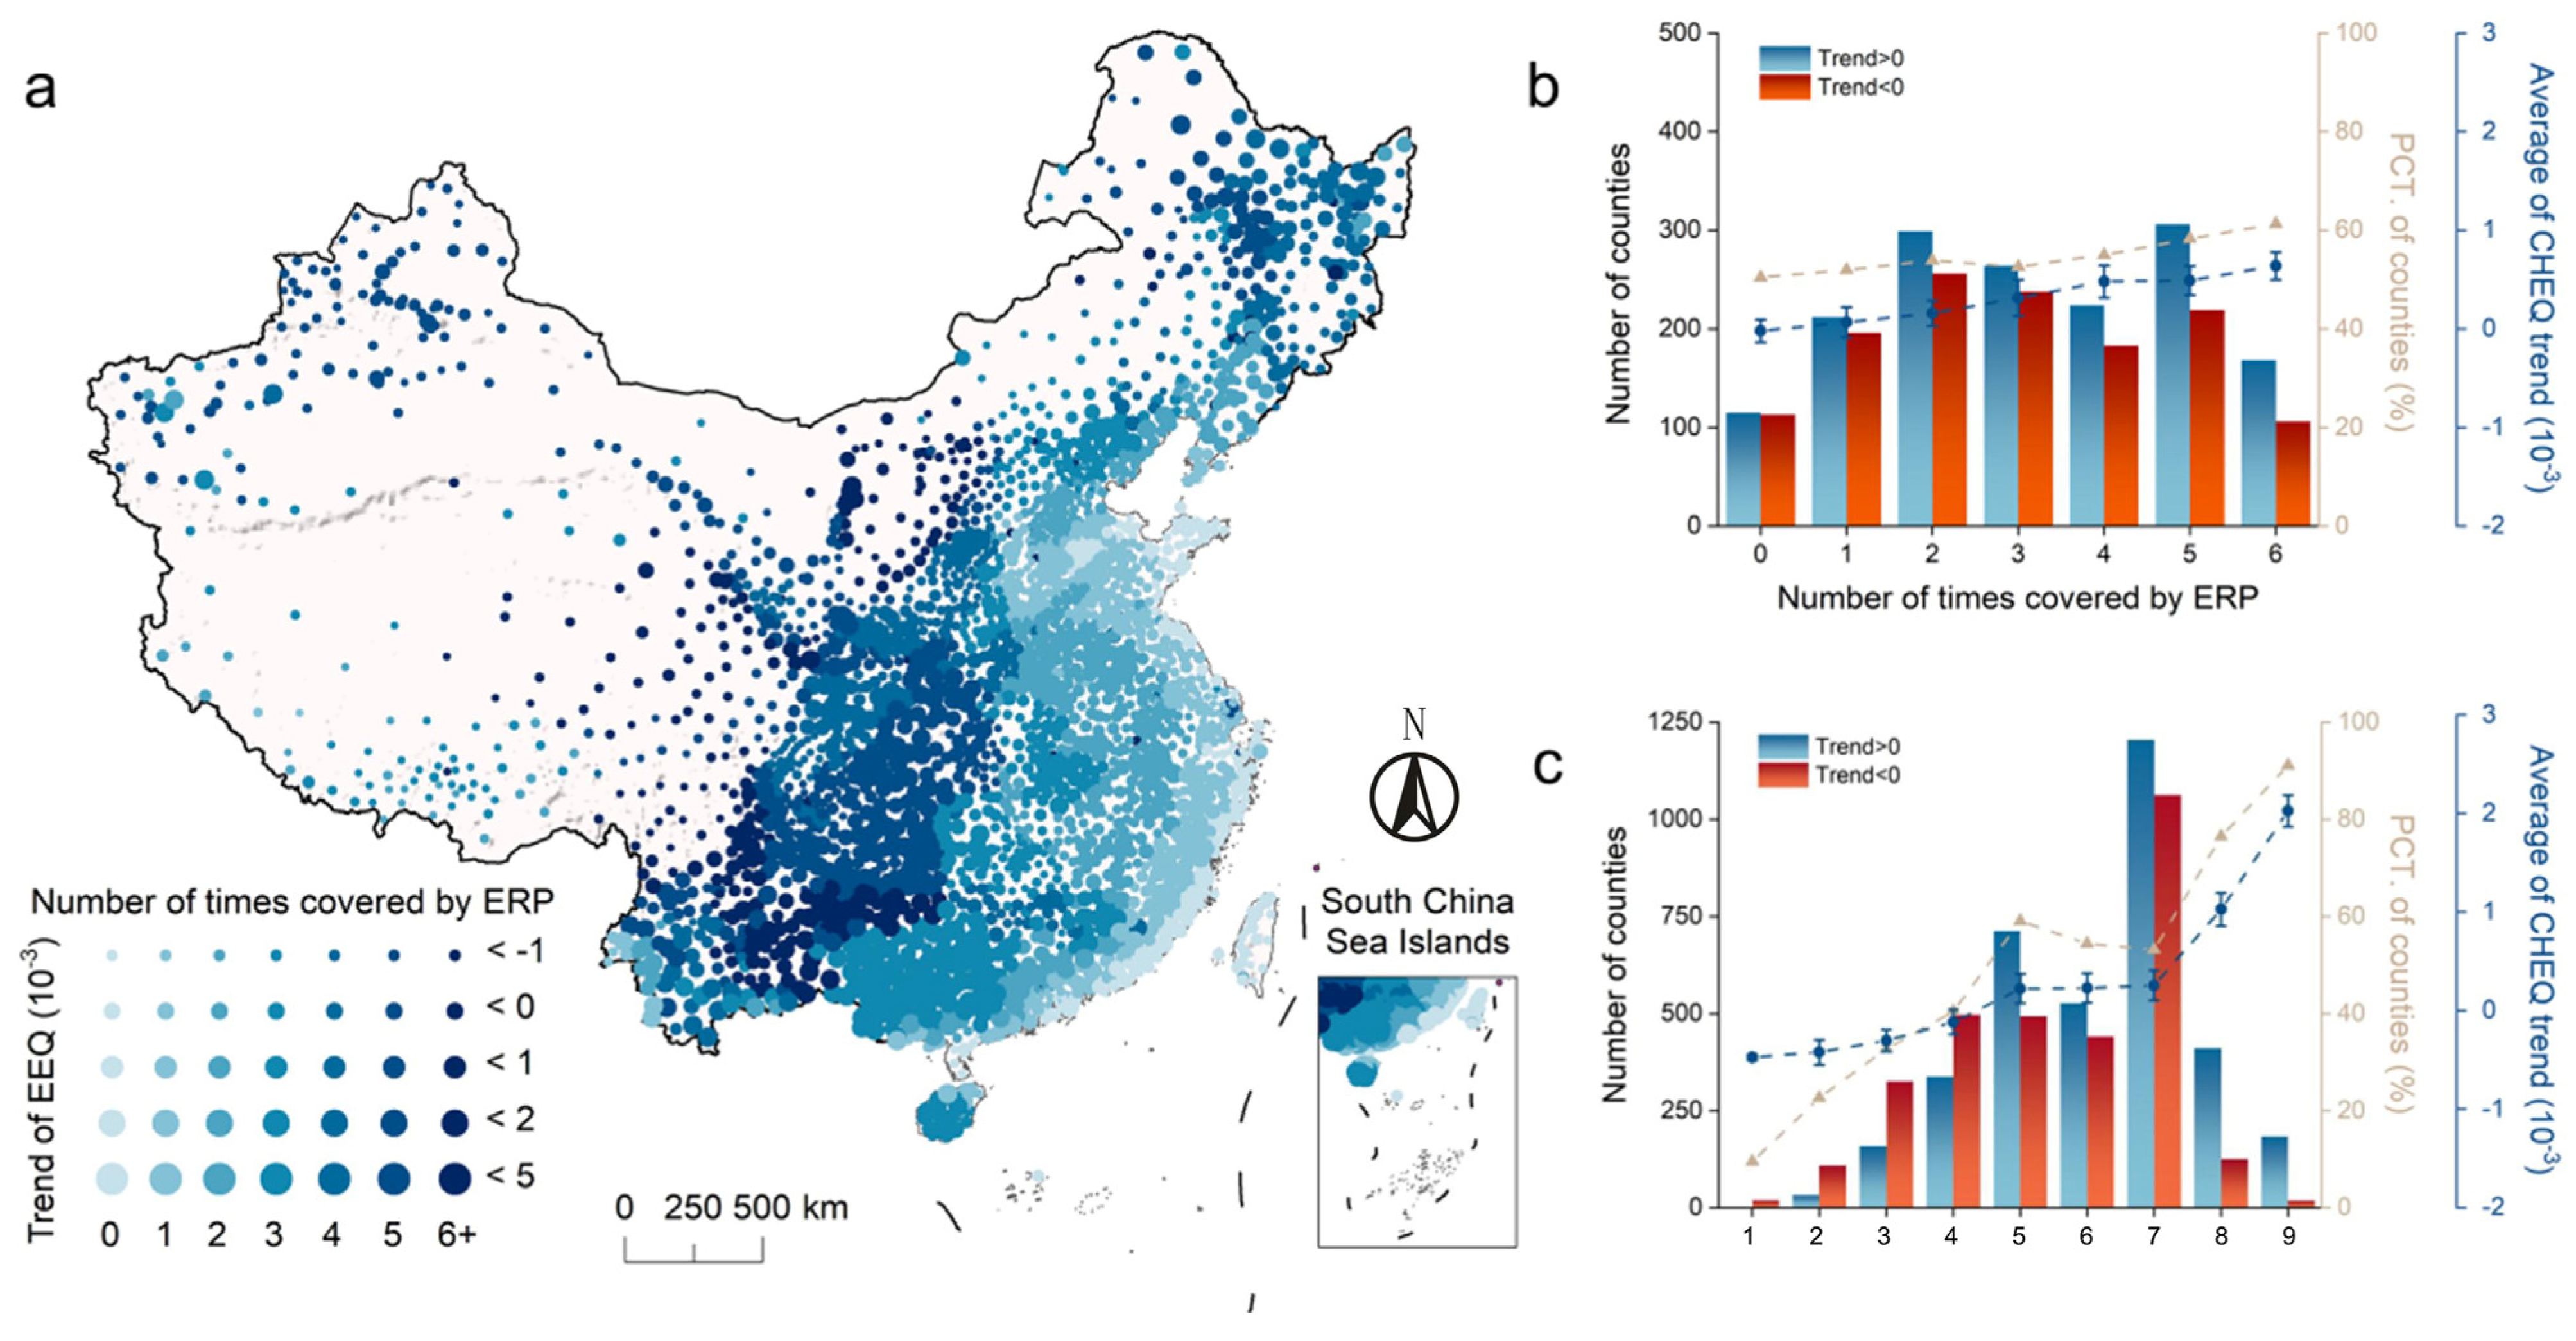
4.3. Contribution of Human Activities and Natural Factors
5. Discussion
5.1. Ecological and Environmental Benefits of ERPs
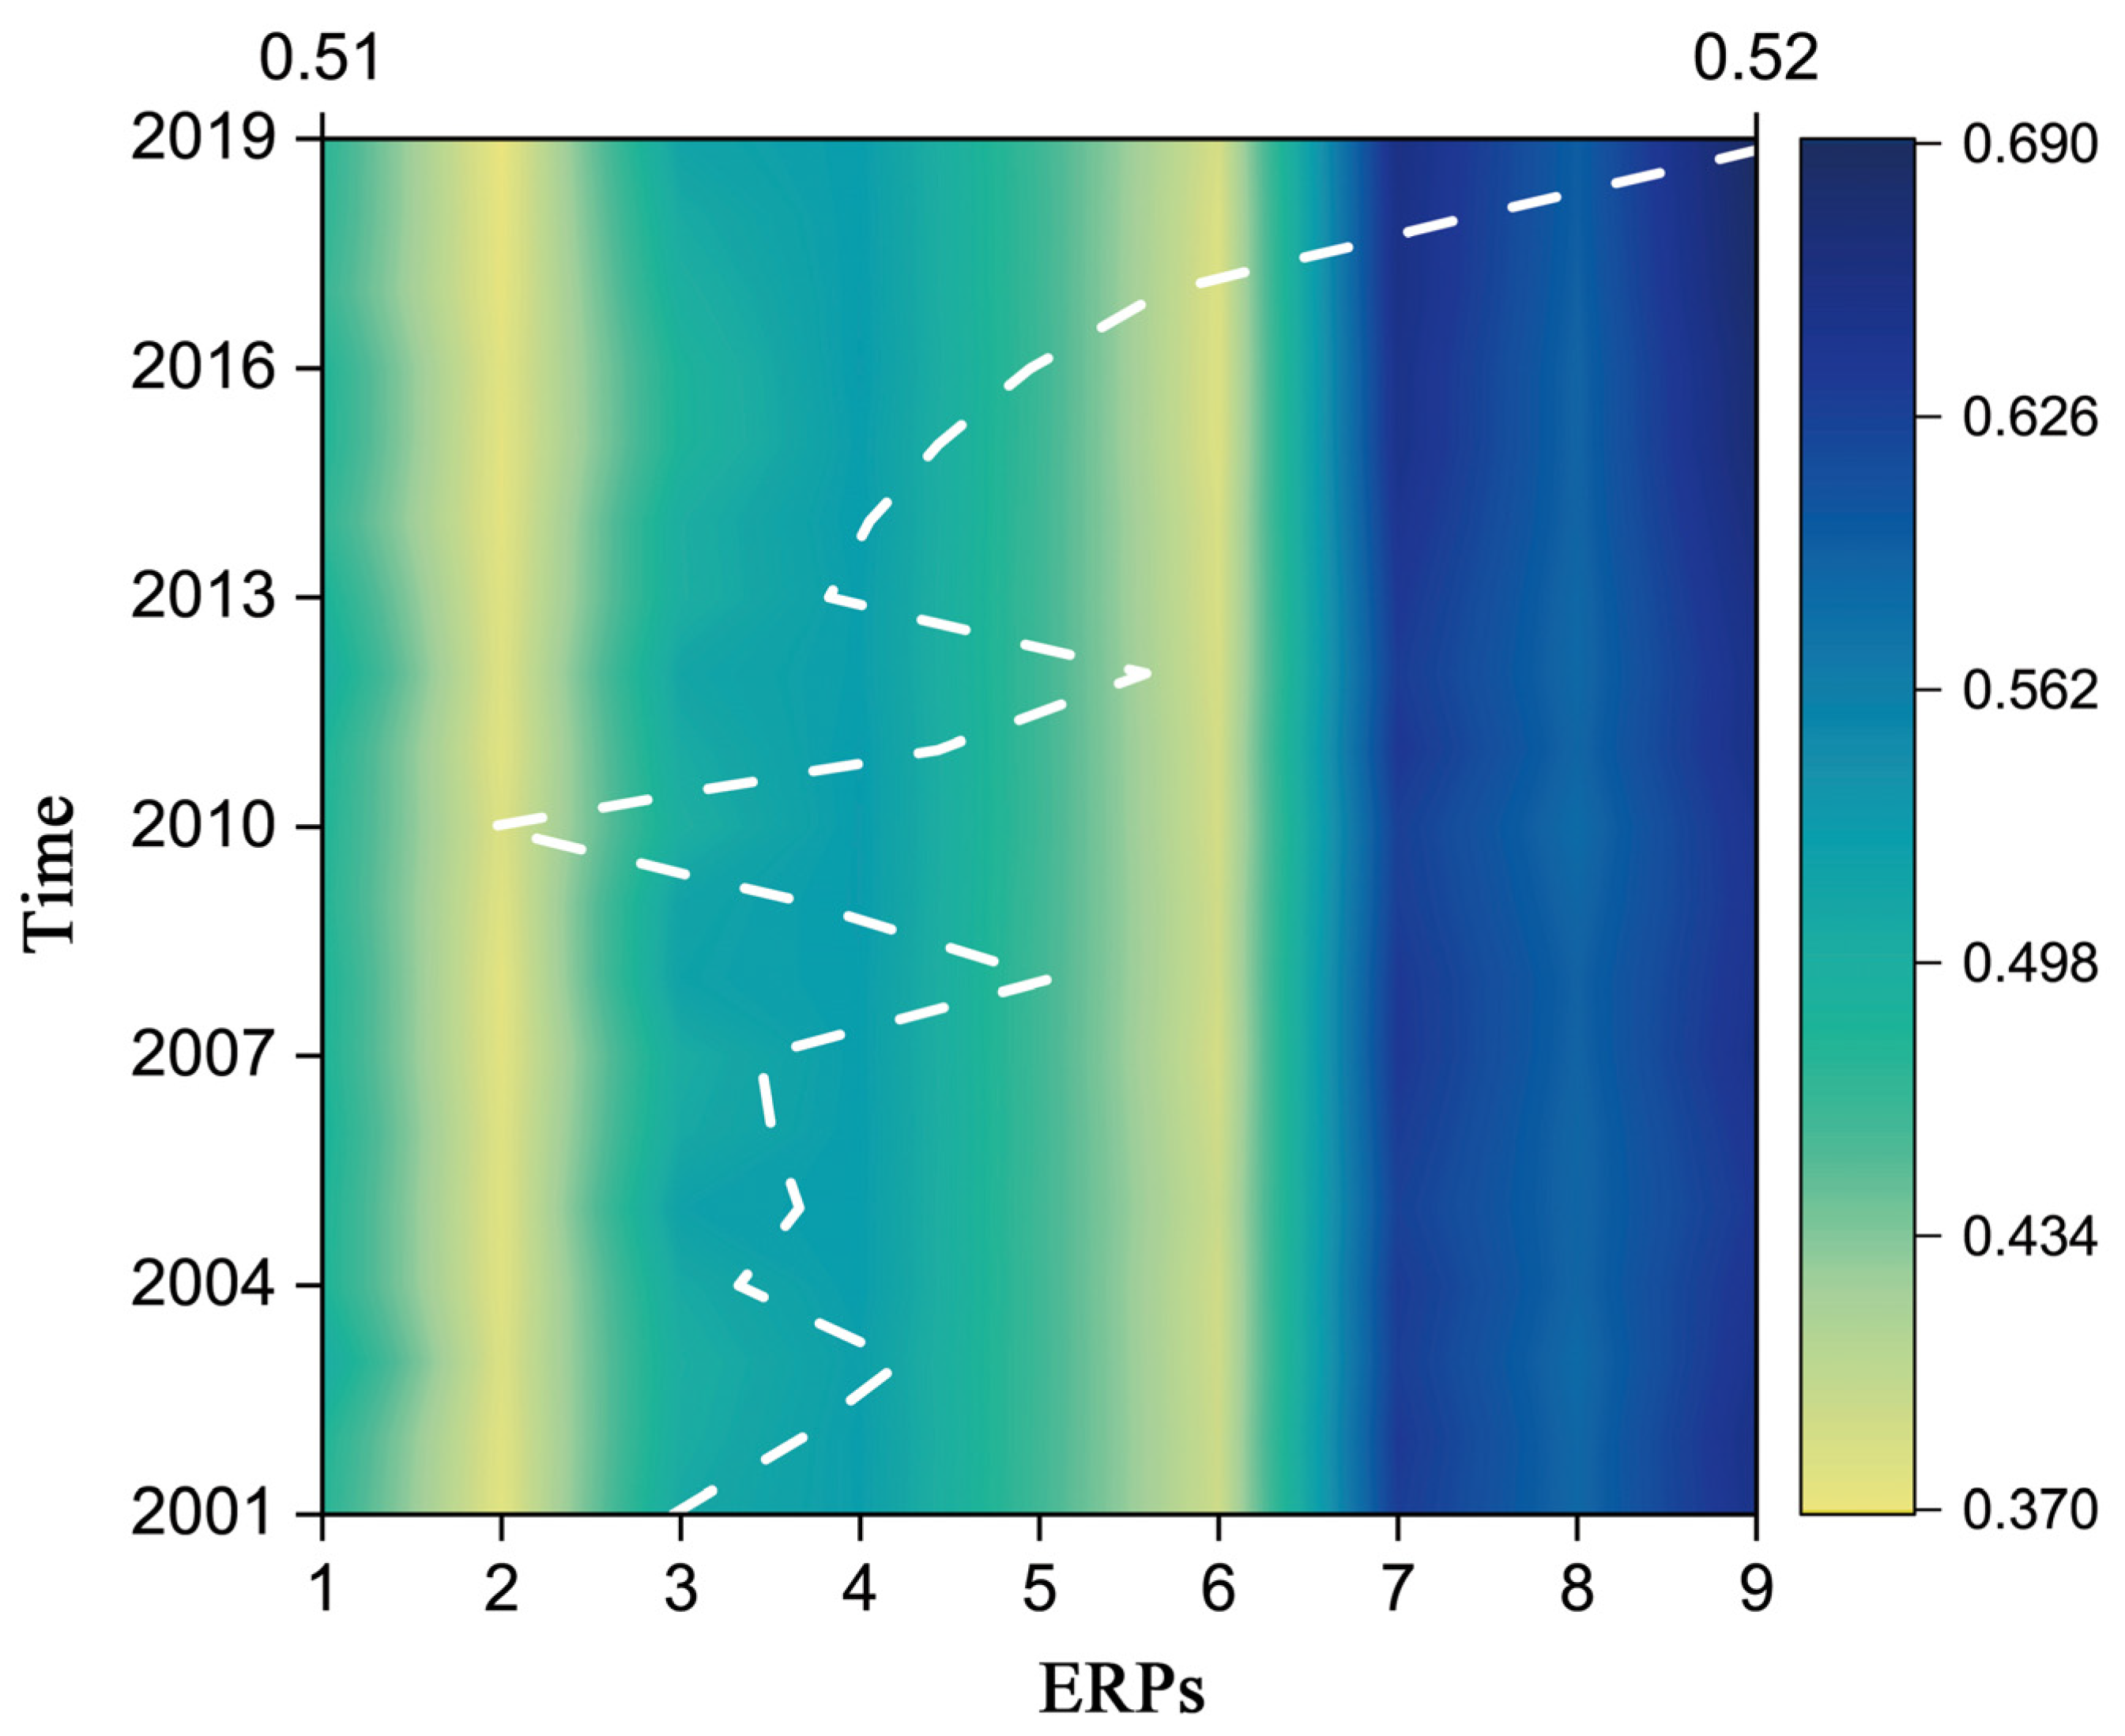
5.2. Trends in EEQ for ERPs
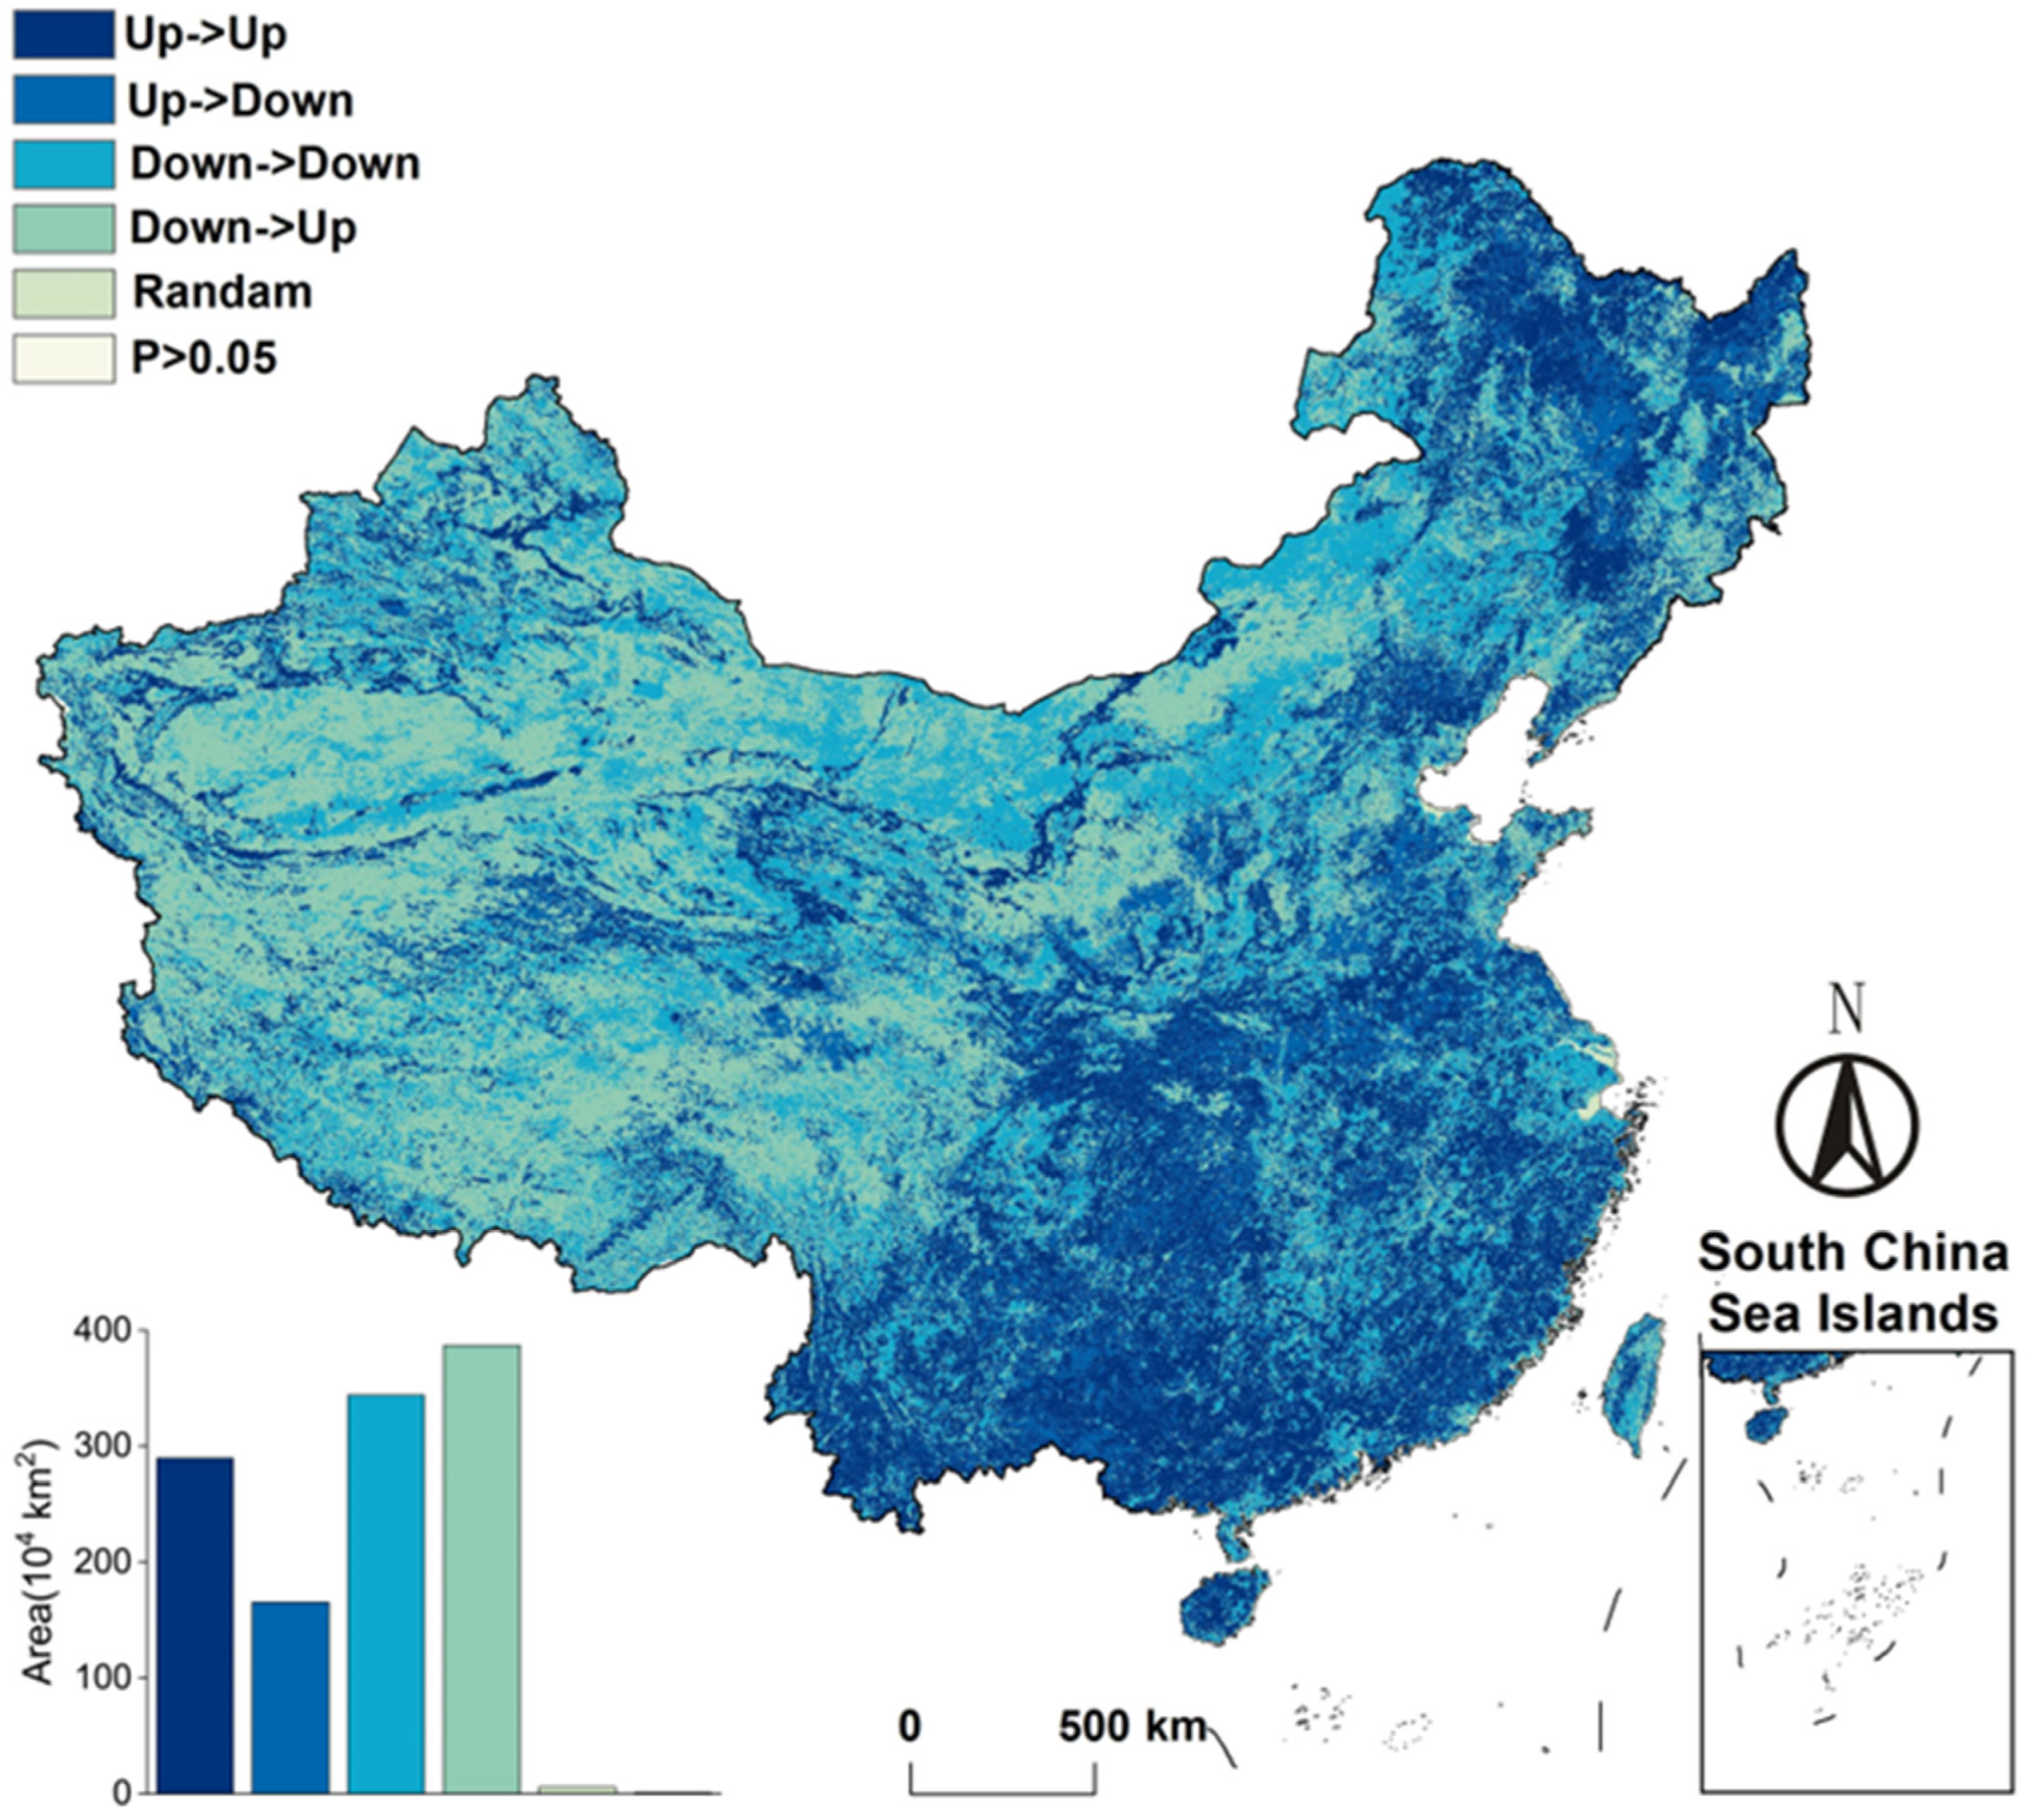
5.3. China’s Future EEQ Forecast
5.4. Contribution of the Study
6. Recommendation and Conclusions
6.1. Recommendation
6.2. Conclusions
Author Contributions
Funding
Institutional Review Board Statement
Informed Consent Statement
Data Availability Statement
Conflicts of Interest
Abbreviations
| EEQ | Ecological environment quality |
| ERPs | Ecological restoration projects |
| HA | Human activities |
| CC | Climatic factors |
| CHEQ | Chinese High-Resolution Ecological Quality Dataset |
| EI | Ecological Environment Status Index |
| RSEI | Remote Sensing Ecological Index |
| NDVI | Normalized Vegetation Index data |
| NPP | Net primary productivity |
| PRE | Precipitation |
| AET | Actual evapotranspiration |
| PET | Potential evapotranspiration |
| SRAD | Solar radiation |
| VAP | Atmospheric pressure |
| VPD | Saturated water vapor pressure difference |
| VS | Wind speed |
| RO | Surface runoff |
| DI | Drought index |
| SOIL | Soil moisture |
| PDSI | Drought index |
| DEF | Water deficit |
| TEMP | Surface temperature |
| TMMN | Maximum temperature |
| TMMX | Minimum temperature |
| PCA | Principal component analysis |
| TSM | Theil–Sen median |
| TEMP | Temperature |
| NDBSI | Normalized Difference Built-Up Index |
| LST | Land surface temperature |
| WET | Humidity |
| AI | Abundance index |
| H | Hurst index |
| Root Mean Square Error | RMSE |
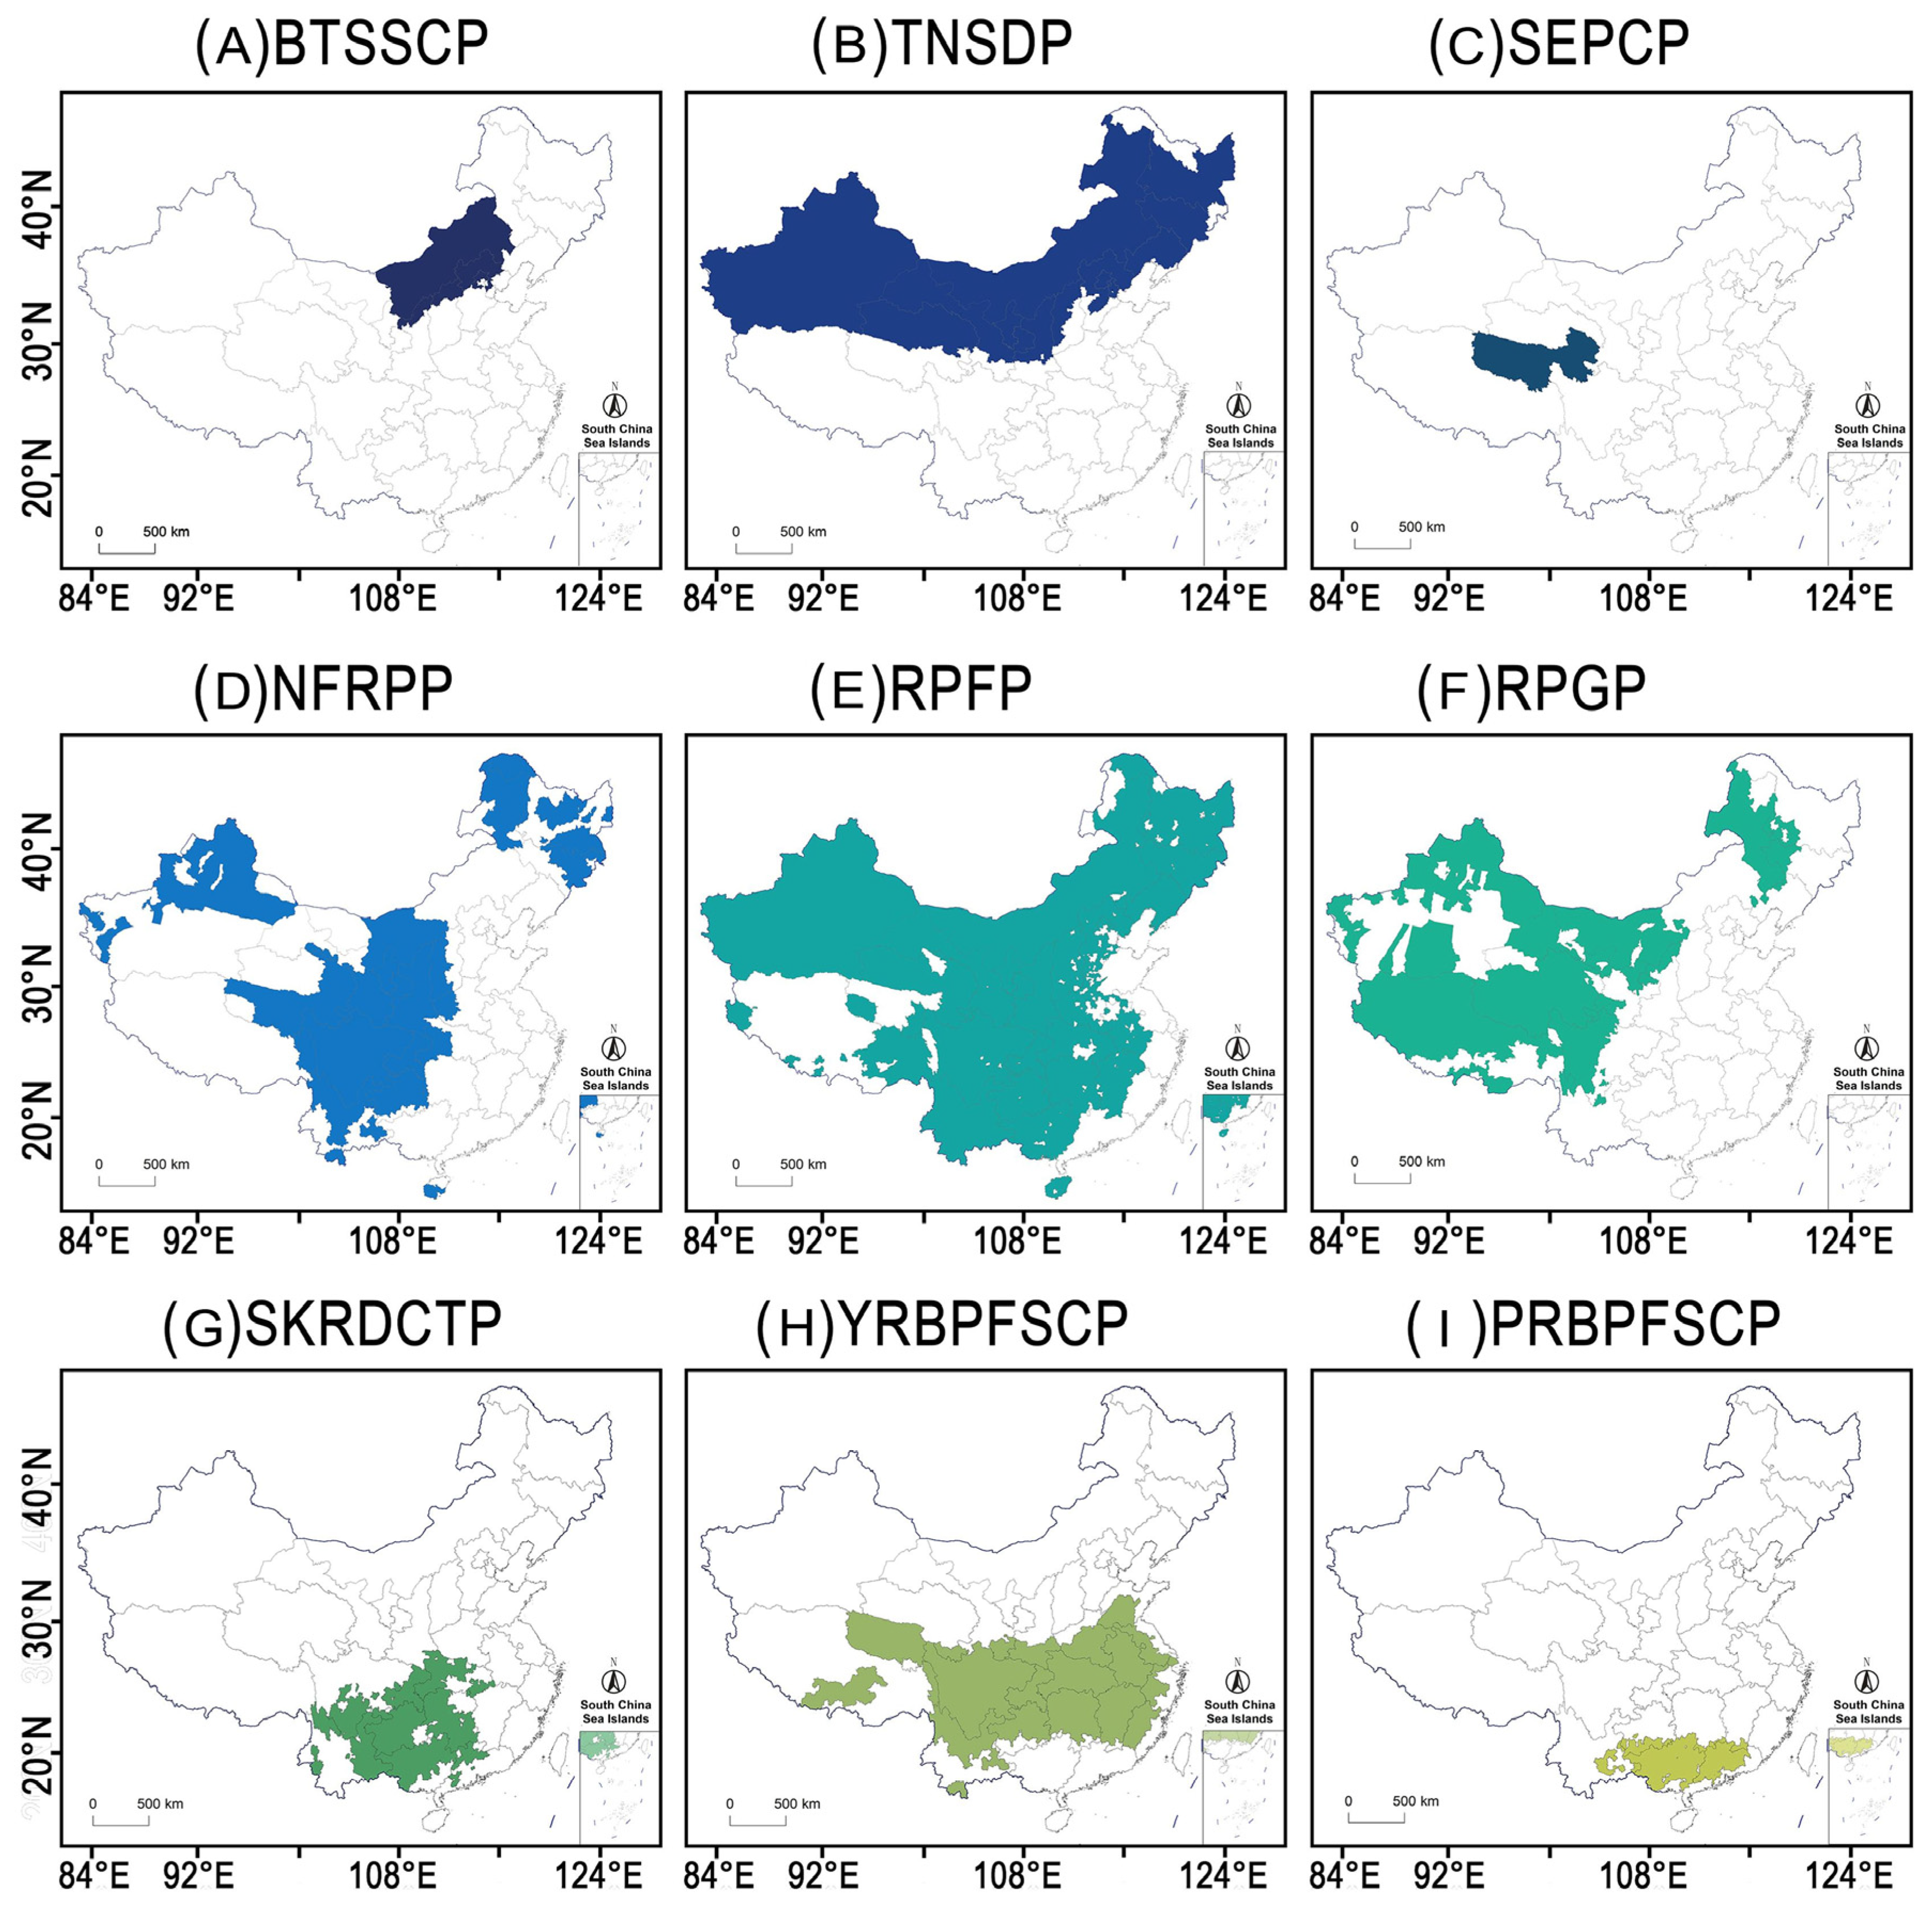
| BTSSCP | The Beijing–Tianjin Sand Source Comprehensive Control Project |
| TNSDP | The Three-North Protective Forest Construction Project |
| SEPCP | The Sanjiangyuan Ecological Protection and Construction Project |
| NFRPP | The Natural Forest Resource Protection Project |
| RPFP | The Returning Ploughland to Forestry Project |
| RPGP | The Returning Pasture to Grassland Project |
| SKRDCTP | The Southwestern Karst Desertification Comprehensive Treatment Project |
| YRBPFSCP | The Yangtze River Basin Protection Forest System |
| PRBPFSCP | The Pearl River Basin Protection Forest System, and several other major projects |
Appendix A

| Restore Object | ERPs | Period | Pilot Area | Investment (Billion CNY) |
|---|---|---|---|---|
| Forest | Natural Forest Protection project | 1998–2010 | Yunnan, Sichuan, Chongqing, Guizhou, Hunan, Hubei, Jiangxi, Shanxi, Shannxi, Gansu, Qinghai, Ningxia, Xinjiang, Inner Mongolia, Jilin, Heilongjiang, Hainan, Henan | 962.02 |
| Reclaimed Farmland to Forest project | 1999–2021 | Gansu, Inner Mongolia, Guizhou, Shanxi, Shannxi, Hunan, Hubei, Sichuan, Chongqing, Yunnan | 4311.30 | |
| Three-North Shelter Forest Program | 2001–2010 | Xinjiang, Qinghai, Gansu, Ningxia, Inner Mongolia, Shannxi, Shanxi, Hebei, Liaoning, Jilin, Heilongjiang, Beijing, Tianjin | 354.12 | |
| Shelter Forest System in the Yangtze River Basin | 2001–2010 | Jiangxi, Hubei, Hunan, Sichuan, Guizhou, Yunnan, Shannxi, Gansu, Qinghai | 205.61 | |
| Beijing–Tianjin Sandstorm Source Control Project | 2001–2010 | Beijing, Tianjin, Hebei, Shanxi, Inner Mongolia | 558.65 | |
| Coastal Shelter Forest System Project | 2001–2010 | Liaoning, Heibei, Zhejiang, Fujian, Guangdong, Hainan, Guangxi | 39.09 | |
| Taihang Mountain Greening Project | 2001–2010 | Shanxi, Hebei, Henan, Beijing | 35.97 | |
| Plain Greening Project | 2001–2010 | More than 900 plains in China | 12.47 | |
| Coastal Shelter Forest Project | 2006–2015 | Liaoning, Heibei, Zhejiang, Fujian, Guangdong, Hainan, Guangxi | 99.84 | |
| Wetland | National Wetland Protection Project | 2005–2010 | 473 wetlands in China | 90.04 |
| Reclaimed Farmland to Lake | 1998–2005 | Cover the whole country | — | |
| Grassland | Reclaimed Pasture to Grass | 2003–2007 | Xinjiang, Xizang, Inner Mongolia, Qianghai, Gansu, Ningxia | 143.00 |
| Important ecological functions | Ecological Protection and Construction of Sanjiangyuan Nature Reserve | 2005–2010 | Qinghai | 75.00 |
| National Nature Reserve | 1999–2010 | Cover the whole country | 4.80 |
References
- Yang, W.; Zhao, J. Study on China’s economic development from the perspective of strong sustainability. Singap. Econ. Rev. 2020, 65, 161–192. [Google Scholar] [CrossRef]
- Shao, Q.; Liu, S.; Ning, J.; Liu, G.; Yang, F.; Zhang, X.; Niu, L.; Huang, H.; Fan, J.; Liu, J. Remote sensing assessment of ecological benefits of major ecological projects in China from 2000 to 2019. J. Geogr. 2022, 77, 2133–2153. [Google Scholar]
- Chen, C.; Park, T.; Wang, X.H.; Piao, S.L.; Xu, B.D.; Chaturvedi, R.K.; Fuchs, R.; Brovkin, V.; Ciais, P.; Fensholt, R.; et al. China and India lead in greening of the world through land-use management. Nat. Sustain. 2019, 2, 122–129. [Google Scholar] [CrossRef] [PubMed]
- Fu, B.; Liu, Y.; Meadows, M.E. Ecological restoration for sustainable development in China. Natl. Sci. Rev. 2023, 10, nwad033. [Google Scholar] [CrossRef] [PubMed]
- Lu, F.; Hu, H.; Sun, W.; Zhu, J.; Liu, G.; Zhou, W.; Zhang, Q.; Shi, P.; Liu, X.; Wu, X.; et al. Effects of national ERPs on carbon sequestration in China from 2001 to 2010. Proc. Natl. Acad. Sci. USA 2018, 115, 4039–4044. [Google Scholar] [CrossRef] [PubMed]
- China National Forestry and Grass Administration. Available online: http://www.forestry.gov.cn (accessed on 2 May 2023).
- Liu, T.; Yu, L.; Chen, X.; Wu, H.; Lin, H.; Li, C.; Hou, J. Environmental laws and ERPs enhancing ecosystem services in China: A meta-analysis. J. Environ. Manag. 2023, 327, 116810. [Google Scholar] [CrossRef]
- Shan, W.; Jin, X.; Ren, J.; Wang, Y.; Xu, Z.; Fan, Y.; Gu, Z.; Hong, C.; Lin, J.; Zhou, Y. EEQ assessment based on remote sensing data for land consolidation. J. Clean. Prod. 2019, 239, 118126. [Google Scholar] [CrossRef]
- Bai, T.; Cheng, J.; Zheng, Z.; Zhang, Q.; Li, Z.; Xu, D. Drivers of eco-environmental quality in China from 2000 to 2017. J. Clean. Prod. 2023, 396, 136408. [Google Scholar] [CrossRef]
- Wang, Z.; Bai, T.; Xu, D.; Kang, J.; Shi, J.; Fang, H.; Wang, D. Temporal and Spatial Changes in Vegetation Ecological Quality and Driving Mechanism in Kökyar Project Area from 2000 to 2021. Sustainability 2022, 14, 7668. [Google Scholar] [CrossRef]
- Hanqiu, X. Creation of urban remote sensing ecological index and its application. J. Ecol. 2013, 33, 7853–7862. [Google Scholar]
- Xu, D.; Yang, F.; Yu, L.; Zhou, Y.; Li, H.; Ma, J.; Huang, J.; Wei, J.; Xu, Y.; Zhang, C.; et al. Quantization of the coupling mechanism between eco-environmental quality and urbanization from multisource remote sensing data. J. Clean. Prod. 2021, 321, 128948. [Google Scholar] [CrossRef]
- Cai, Y.; Zhang, F.; Duan, P.; Jim, C.Y.; Chan, N.W.; Shi, J.; Liu, C.; Wang, J.; Bahtebay, J.; Ma, X. Vegetation cover changes in China induced by ecological restoration-protection projects and land-use changes from 2000 to 2020. Catena 2022, 217, 106530. [Google Scholar] [CrossRef]
- National Earth System Science Data Center. National Science & Technology Infrastructure of China. Available online: http://www.geodata.cn (accessed on 2 May 2023).
- Didan, K. MOD13A2 MODIS/Terra Vegetation Indices 16-Day L3 Global 1 km SIN Grid vo06; NASA EOSDIS Land Processes DAAC: Sioux Falls, SD, USA, 2015. [CrossRef]
- Running, S.; Mu, Q.; Zhao, M. MOD17A3H MODIS/Terra Net Primary Production Yearly L4 Global 500 m SIN Grid vo06; NASA EOSDIS Land Processes DAAC: Sioux Falls, SD, USA, 2015. [CrossRef]
- Yin, R.; Rothstein, D.; Qi, J.; Liu, S. Methodology for an Integrative Assessment of China’s Ecological Restoration Programs; Springer: Dordrecht, The Netherlands, 2009. [Google Scholar]
- Sen, P.K. Estimates of the regression coefficient based on Kendall’s tau. J. Am. Stat. Assoc. 1968, 63, 1379–1389. [Google Scholar] [CrossRef]
- Theil, H. A rank-invariant method of linear and polynomial regression analysis. Indag. Math. 1950, 12, 173. [Google Scholar]
- Mann, H.B. Nonparametric tests against trend. J. Econom. Soc. 1945, 245–259. [Google Scholar] [CrossRef]
- Kendall, M.G. Rank Correlation Methods; American Psychological Association: Washington, DC, USA, 1948; Available online: https://psycnet.apa.org/record/1948-15040-000 (accessed on 2 May 2023).
- Zhou, Y.; Fu, D.; Lu, C.; Xu, X.; Tang, Q. Positive effects of ecological restoration policies on the vegetation dynamics in a typical ecologically vulnerable area of China. Ecol. Eng. 2021, 159, 106087. [Google Scholar] [CrossRef]
- Du, H.; Liu, X.; Jia, X.; Li, S.; Fan, Y. Assessment of the effects of ERPs on soil wind erosion in northern China in the past two decades. Catena 2022, 215, 106360. [Google Scholar] [CrossRef]
- Li, Z.; Ning, K.; Chen, J.; Liu, C.; Wang, D.; Nie, X.; Hu, X.; Wang, L.; Wang, T. Soil and water conservation effects driven by the implementation of ERPs: Evidence from the red soil hilly region of China in the last three decades. J. Clean. Prod. 2020, 260, 121109. [Google Scholar] [CrossRef]
- Sun, W.; Song, X.; Mu, X.; Gao, P.; Wang, F.; Zhao, G. Spatiotemporal vegetation cover variations associated with climate change and ecological restoration in the Loess Plateau. Agric. For. Meteorol. 2015, 209, 87–99. [Google Scholar] [CrossRef]
- Burrell, A.L.; Evans, J.P.; Liu, Y. Detecting dryland degradation using time series segmentation and residual trend analysis (TSS-RESTREND). Remote Sens. Environ. 2017, 197, 43–57. [Google Scholar] [CrossRef]
- Gao, A.; Yang, S.L.; Li, G.; Li, P.; Chen, S.L. Long-term morphological evolution of a tidal island as affected by natural factors and human activities, the Yangtze estuary. J. Coast. Res. 2010, 26, 123–131. [Google Scholar] [CrossRef]
- Campbell, B.M.; Hansen, J.; Rioux, J.; Stirling, C.M.; Twomlow, S. Urgent action to combat climate change and its impacts (SDG 13): Transforming agriculture and food systems. Curr. Opin. Environ. Sustain. 2018, 34, 13–20. [Google Scholar] [CrossRef]
- Davies, R.B.; Harte, D.S. Tests for Hurst effect. Biometrika 1987, 74, 95–101. [Google Scholar] [CrossRef]
- Ndayisaba, F.; Guo, H.; Bao, A.; Guo, H.; Karamage, F.; Kayiranga, A. Understanding the spatial temporal vegetation dynamics in Rwanda. Remote Sens. 2016, 8, 129. [Google Scholar] [CrossRef]
- Liao, W.; Jiang, W. Evaluation of the spatiotemporal variations in the eco-environmental quality in China based on the remote sensing ecological index. Remote Sens. 2020, 12, 2462. [Google Scholar] [CrossRef]
- Li, S.; Liang, W.; Fu, B.; Lü, Y.; Fu, S.; Wang, S.; Su, H. Vegetation changes in recent large-scale ERPs and subsequent impact on water resources in China’s Loess Plateau. Sci. Total Environ. 2016, 569, 1032–1039. [Google Scholar] [CrossRef]
- Zhao, J.; Yang, Y.; Zhao, Q.; Zhao, Z. Effects of ERPs on changes in land cover: A case study on the Loess Plateau in China. Sci. Rep. 2017, 7, 44496. [Google Scholar] [CrossRef]
- Qu, S.; Wang, L.; Lin, A.; Zhu, H.; Yuan, M. What drives the vegetation restoration in Yangtze River basin, China: Climate change or anthropogenic factors? Ecol. Indic. 2018, 90, 438–450. [Google Scholar] [CrossRef]
- Wu, M.; Liu, Y.; Xu, Z.; Yan, G.; Ma, M.; Zhou, S.; Qian, Y. Spatio-temporal dynamics of China’s ecological civilization progress after implementing national conservation strategy. J. Clean. Prod. 2021, 285, 124886. [Google Scholar] [CrossRef]
- Zhang, J.; Gangopadhyay, P. Dynamics of environmental quality and economic development: The regional experience from Yangtze River Delta of China. Appl. Econ. 2015, 47, 3113–3123. [Google Scholar] [CrossRef]
- Su, X.; Zhou, Y.; Li, Q. Designing ecological security patterns based on the framework of ecological quality and ecological sensitivity: A case study of Jianghan Plain, China. Int. J. Environ. Res. Public Health 2021, 18, 8383. [Google Scholar] [CrossRef]
- Yin, R.; Yin, G. China’s primary programs of terrestrial ecosystem restoration: Initiation, implementation, and challenges. Environ. Manag. 2010, 45, 429–441. [Google Scholar] [CrossRef]
- Lü, Y.; Fu, B.; Feng, X.; Zeng, Y.; Liu, Y.; Chang, R.; Sun, G.; Wu, B. A policy-driven large scale ecological restoration: Quantifying ecosystem services changes in the Loess Plateau of China. PLoS ONE 2012, 7, e31782. [Google Scholar] [CrossRef] [PubMed]
- Wang, L.J.; Ma, S.; Zhao, Y.G.; Zhang, J.C. ERPs did not increase the value of all ecosystem services in Northeast China. For. Ecol. Manag. 2021, 495, 119340. [Google Scholar] [CrossRef]
- Zhang, J.; Mengting, L.; Hui, Y.; Xiyun, C.; Chong, F. Critical thresholds in ecological restoration to achieve optimal ecosystem services: An analysis based on forest ecosystem restoration projects in China. Land Use Policy 2018, 76, 675–678. [Google Scholar] [CrossRef]
- Zhang, S.; Zhao, K.; Ji, S.; Guo, Y.; Wu, F.; Liu, J.; Xie, F. Evolution characteristics, eco-environmental response and influencing factors of production-living-ecological space in the Qinghai–Tibet Plateau. Land 2022, 11, 1020. [Google Scholar] [CrossRef]
- He, L.; Shen, J.; Zhang, Y. Ecological vulnerability assessment for ecological conservation and environmental management. J. Environ. Manag. 2018, 206, 1115–1125. [Google Scholar] [CrossRef]
- Li, C.; Zhang, S.; Cui, M.; Wan, J.; Rao, T.; Li, W.; Wang, X. Improved Vegetation Ecological Quality of the Three-North Shelterbelt Project Region of China during 2000–2020 as Evidenced from Multiple Remotely Sensed Indicators. Remote Sens. 2022, 14, 5708. [Google Scholar] [CrossRef]
- Wang, X.M.; Zhang, C.X.; Hasi, E.; Dong, Z.B. Has the Three Norths Forest Shelterbelt Program solved the desertification and dust storm problems in arid and semiarid China? J. Arid Environ. 2010, 74, 13–22. [Google Scholar] [CrossRef]
- Hasan, S.S.; Zhang, Y.; Chu, X.; Teng, Y. The role of big data in China’s sustainable forest management. For. Econ. Rev. 2019, 1, 96–105. [Google Scholar] [CrossRef]
- Qinghai Forestry and Grassland Bureau. Available online: http://www.qinghai.gov.cn (accessed on 2 May 2023).
- Li, Y.; Bai, X.; Wang, S.; Tian, Y. Integrating mitigation measures for karst rocky desertification land in the Southwest mountains of China. Carbonates Evaporites 2019, 34, 1095–1106. [Google Scholar] [CrossRef]
- Jiang, Z.; Lian, Y.; Qin, X. Rocky desertification in Southwest China: Impacts, causes, and restoration. Earth Sci. Rev. 2014, 132, 1–12. [Google Scholar] [CrossRef]
- Liu, S.; Zhang, J.; Zhang, J.; Guo, Y. Simultaneously tackling ecological degradation and poverty challenges: Evidence from desertified areas in northern China. Sci. Total Environ. 2022, 815, 152927. [Google Scholar] [CrossRef] [PubMed]


| Data Name | Time Period | Date Type | Spatial Resolution | Time Scale | Data Sources |
|---|---|---|---|---|---|
| Ecological Restoration Project Boundary Data | / | shp | / | / | NTPDC a |
| EI | 2018 | / | / | Annual | MEE ab |
| MOD13A2 | 2002–2019 | HDF | 1000 m | Annual | NASA c |
| MOD17A3 | 2002–2019 | HDF | 1000 m | Annual | NASA c |
| MOD09A1 | 2002–2019 | HDF | 1000 m | Annual | NASA c |
| MCD12Q1 | 2002–2019 | HDF | 1000 m | Annual | NASA c |
| TerraClimate | 2002–2019 | Necdef | 4600 m | Monthly | GEE d |
| Trend (CHEQobs) | Driving Factors | Classification Criteria for Driving Factors | Contribution Rate of Driving Factors/% | ||
|---|---|---|---|---|---|
| Trend (CHEQCC) | Trend (CHEQHA) | Climatic Factors | Human Activities | ||
| Greater than 0 | CC&HA | >0 | >0 | ||
| CC | >0 | <0 | 100 | 0 | |
| HA | <0 | >0 | 0 | 100 | |
| Less than 0 | CC&HA | >0 | <0 | ||
| CC | >0 | >0 | 100 | 0 | |
| HA | <0 | <0 | 0 | 100 | |
Disclaimer/Publisher’s Note: The statements, opinions and data contained in all publications are solely those of the individual author(s) and contributor(s) and not of MDPI and/or the editor(s). MDPI and/or the editor(s) disclaim responsibility for any injury to people or property resulting from any ideas, methods, instructions or products referred to in the content. |
© 2024 by the authors. Licensee MDPI, Basel, Switzerland. This article is an open access article distributed under the terms and conditions of the Creative Commons Attribution (CC BY) license (https://creativecommons.org/licenses/by/4.0/).
Share and Cite
Li, J.; Peng, X.; Tang, R.; Geng, J.; Zhang, Z.; Xu, D.; Bai, T. Spatial and Temporal Variation Characteristics of Ecological Environment Quality in China from 2002 to 2019 and Influencing Factors. Land 2024, 13, 110. https://doi.org/10.3390/land13010110
Li J, Peng X, Tang R, Geng J, Zhang Z, Xu D, Bai T. Spatial and Temporal Variation Characteristics of Ecological Environment Quality in China from 2002 to 2019 and Influencing Factors. Land. 2024; 13(1):110. https://doi.org/10.3390/land13010110
Chicago/Turabian StyleLi, Junjie, Xiangbin Peng, Ruomei Tang, Jing Geng, Zipeng Zhang, Dong Xu, and Tingting Bai. 2024. "Spatial and Temporal Variation Characteristics of Ecological Environment Quality in China from 2002 to 2019 and Influencing Factors" Land 13, no. 1: 110. https://doi.org/10.3390/land13010110