
Metropolitan Expansion and Migrant Population: Correlation Patterns and Influencing Factors in Chengdu, China

Abstract
:1. Introduction
2. Research Methods and Data Sources
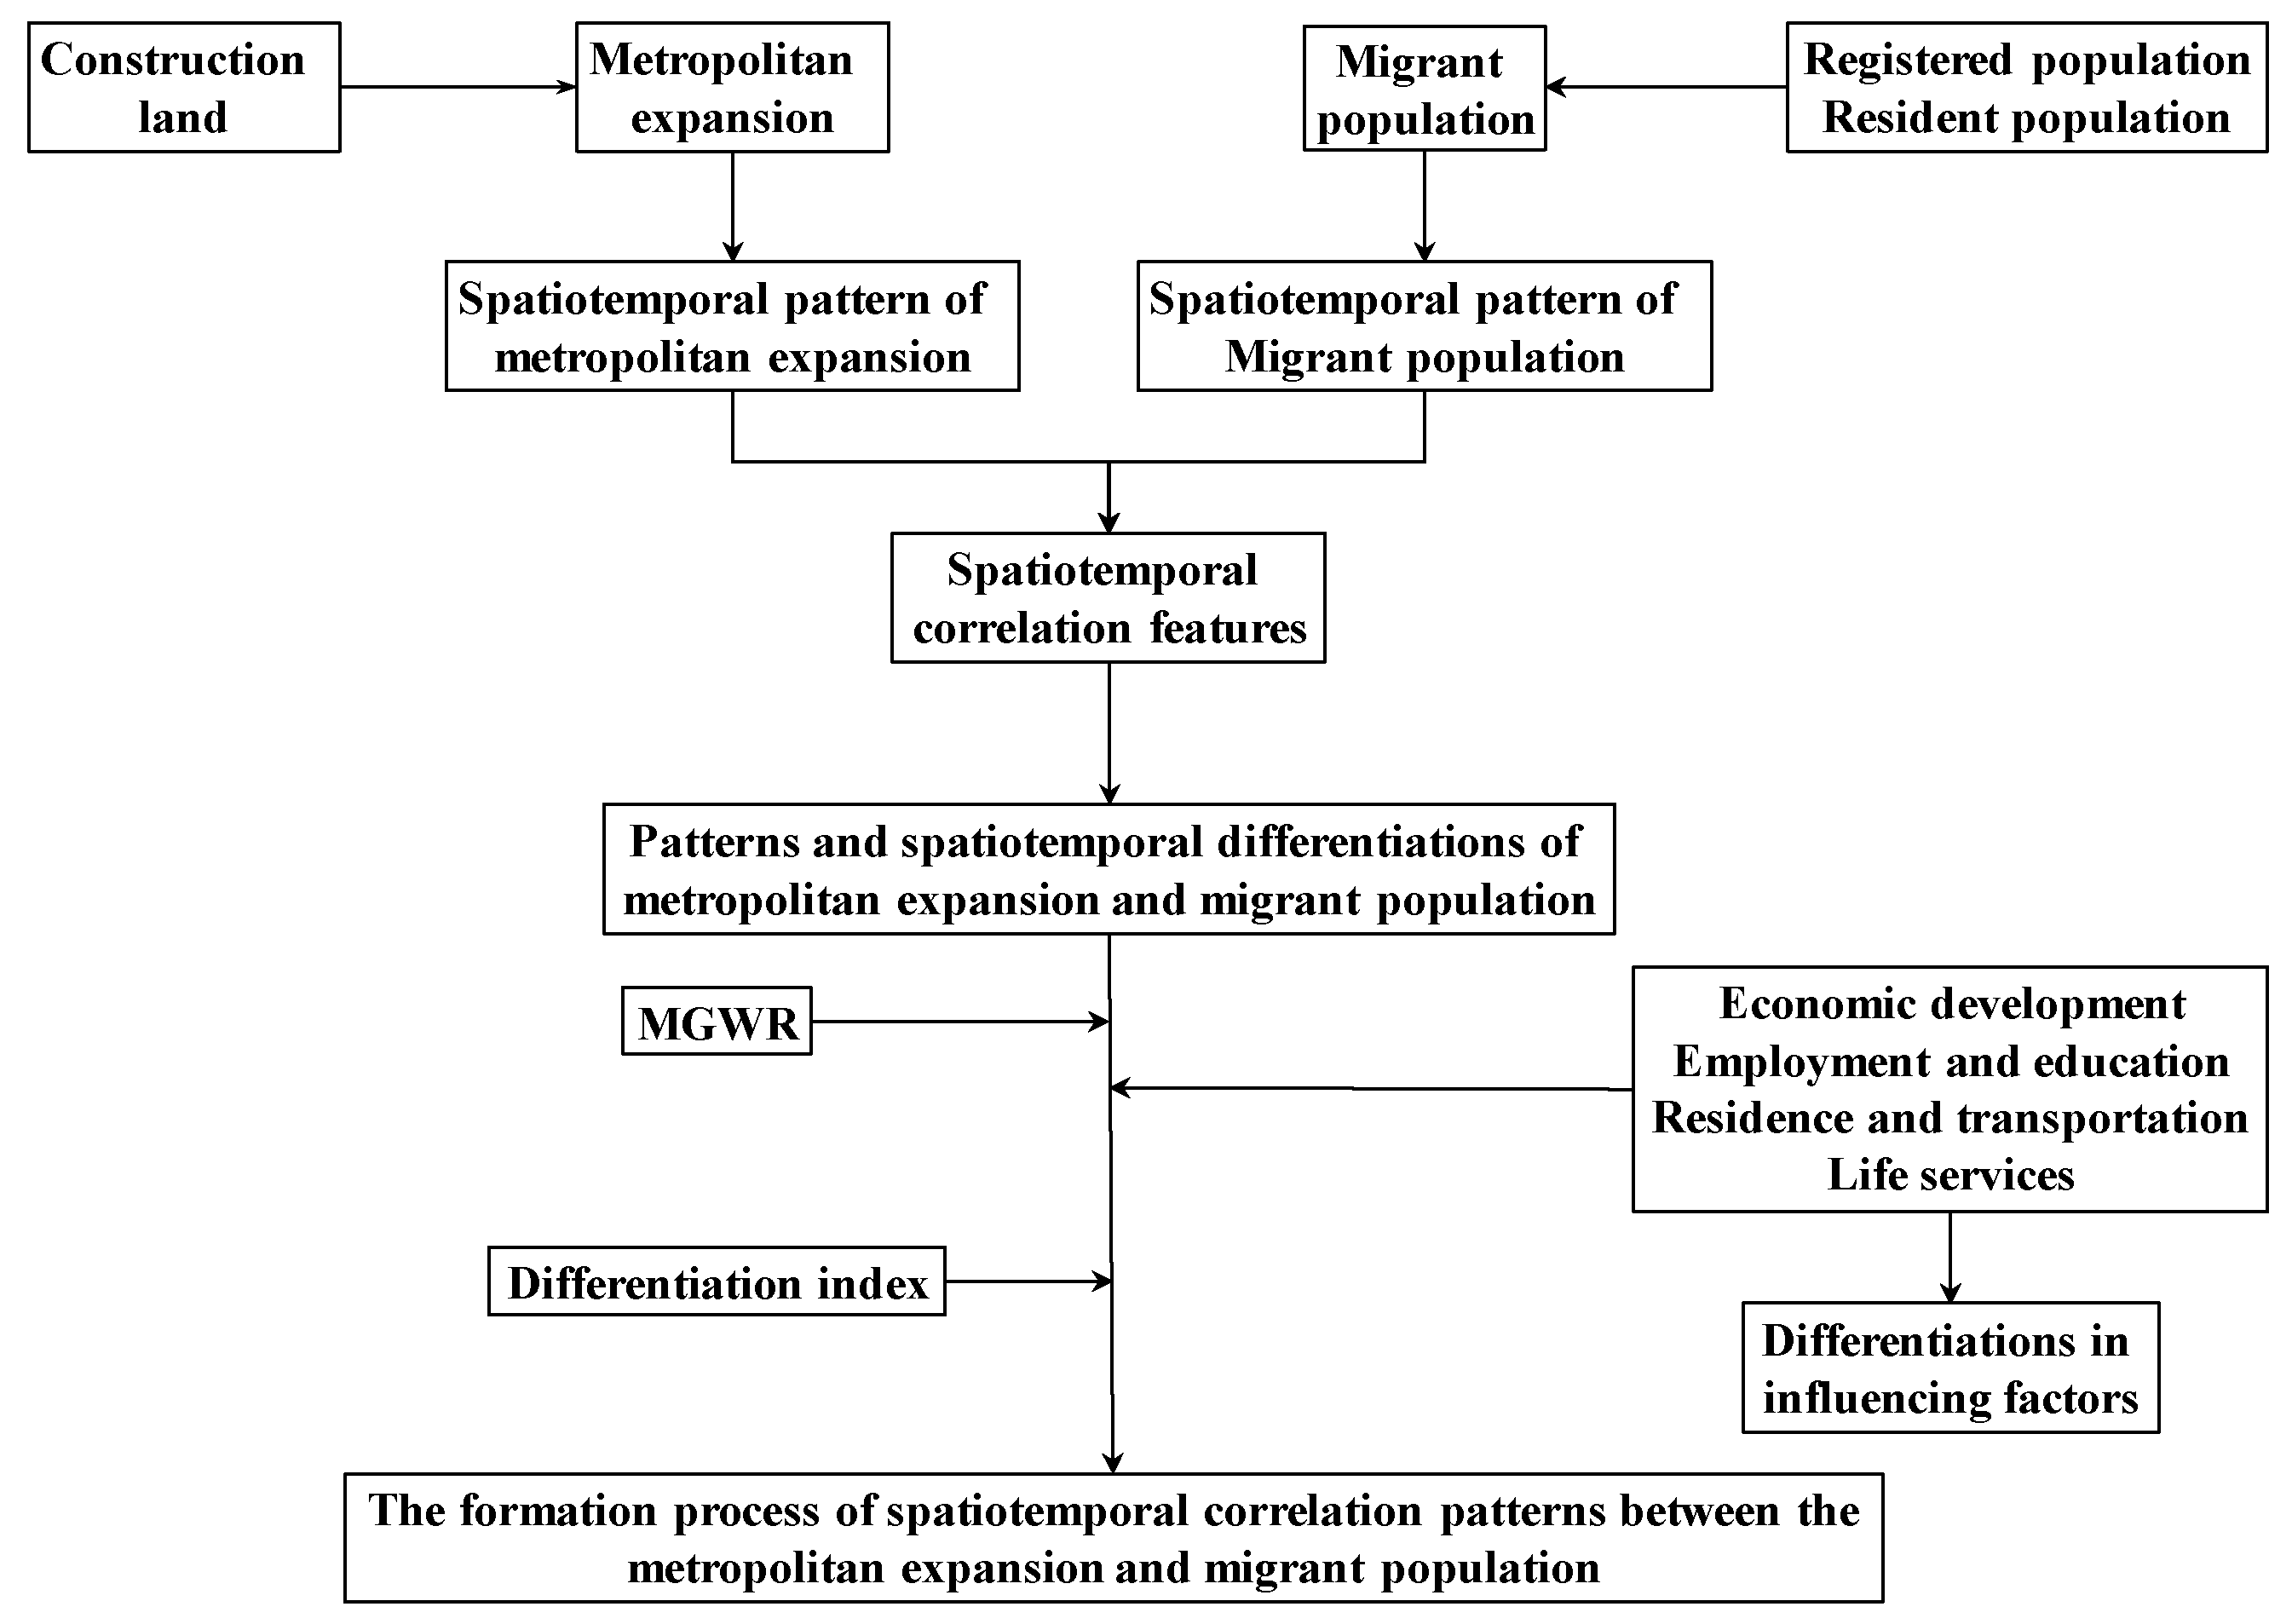
2.1. Research Design
2.2. Overview of the Study Area
2.3. Data Source and Processing
2.4. Research Methods
2.4.1. Coupling Coordination Degree (CCD)
2.4.2. Multiscale Geographically Weighted Regression (MGWR)
2.4.3. Differentiation Index
3. Results
3.1. Spatiotemporal Patterns of Metropolitan Expansion and Migrant Population in the Chengdu Metropolitan Area
3.1.1. Spatiotemporal Patterns of Metropolitan Expansion
3.1.2. Spatiotemporal Patterns of Migrant Population
3.2. Correlation Patterns and Metropolitan Expansion and Migrant Population Models of the Chengdu Metropolitan Area
3.2.1. Correlation Index between Metropolitan Expansion and Migrant Population
3.2.2. Correlation Patterns between the Metropolitan Expansion and Migrant Population
3.3. Influencing Factors of the Correlation Patterns of Metropolitan Expansion and Migrant Population
3.3.1. Influencing Factors on the Spatiotemporal Correlation Patterns of Metropolitan Expansion and Migrant Population
3.3.2. Differentiations of the Influencing Factors on Correlation Patterns
4. Discussion and Conclusions
4.1. Discussion
4.1.1. The Process of Forming the Mechanism of Differential Correlation Features
4.1.2. Policy Inspiration for Empirical Research in the Chengdu Metropolitan Area
4.2. Conclusions and Insights
- (1)
- From 2010 to 2020, the built-up space of the Chengdu metropolitan area doubled, and the southward expansion trend was prominent; during the same period, the migrant population showed a slowing trend regarding the agglomeration of old cities and an accelerating trend regarding the agglomeration of new cities, and the circle-type balanced expansion transitioned to southward focused expansion. The spatiotemporal correlation between the expansion of metropolitan areas and the migrant population in the past 10 years has exhibited a low-high-low center–periphery circle pattern, and can be divided into a mature development pattern, rapid expansion pattern, urban–rural transformation development pattern, and built-up area expansion ahead of schedule pattern.
- (2)
- From 2010 to 2020, the influencing factors of the spatial and temporal correlation between metropolitan area expansion and the migrant population showed a center-circle pattern. Among them, the influence of GDP, housing quantity, employment, road network and life services decreased from the inside to the outside, while the influence of educational resources and transportation stations increased from the inside to the outside, and they all exhibit a southward trend.
- (3)
- The increasing differentiation of economic growth, employment opportunities, and residential markets has intensified the differentiation of the spatiotemporal correlation pattern between metropolitan area expansion and migrant population, while the balanced development of public services, such as education and transportation, has alleviated this spatiotemporal differentiation to some extent. The mature development pattern is mainly affected by the increased differentiation of economic development and residential space, while the increased balance of educational resources weakens the differentiation of the fast-growing spatiotemporal correlation pattern. The enhanced differentiation of economic growth and the balance of public transportation exert negative impacts on the spatiotemporal relationship of this pattern of area. The complex differentiation of the correlation pattern exerts a strong shaping effect. The correlation pattern of the advanced expansion of built-up areas is increasingly affected by education and transportation.
- (4)
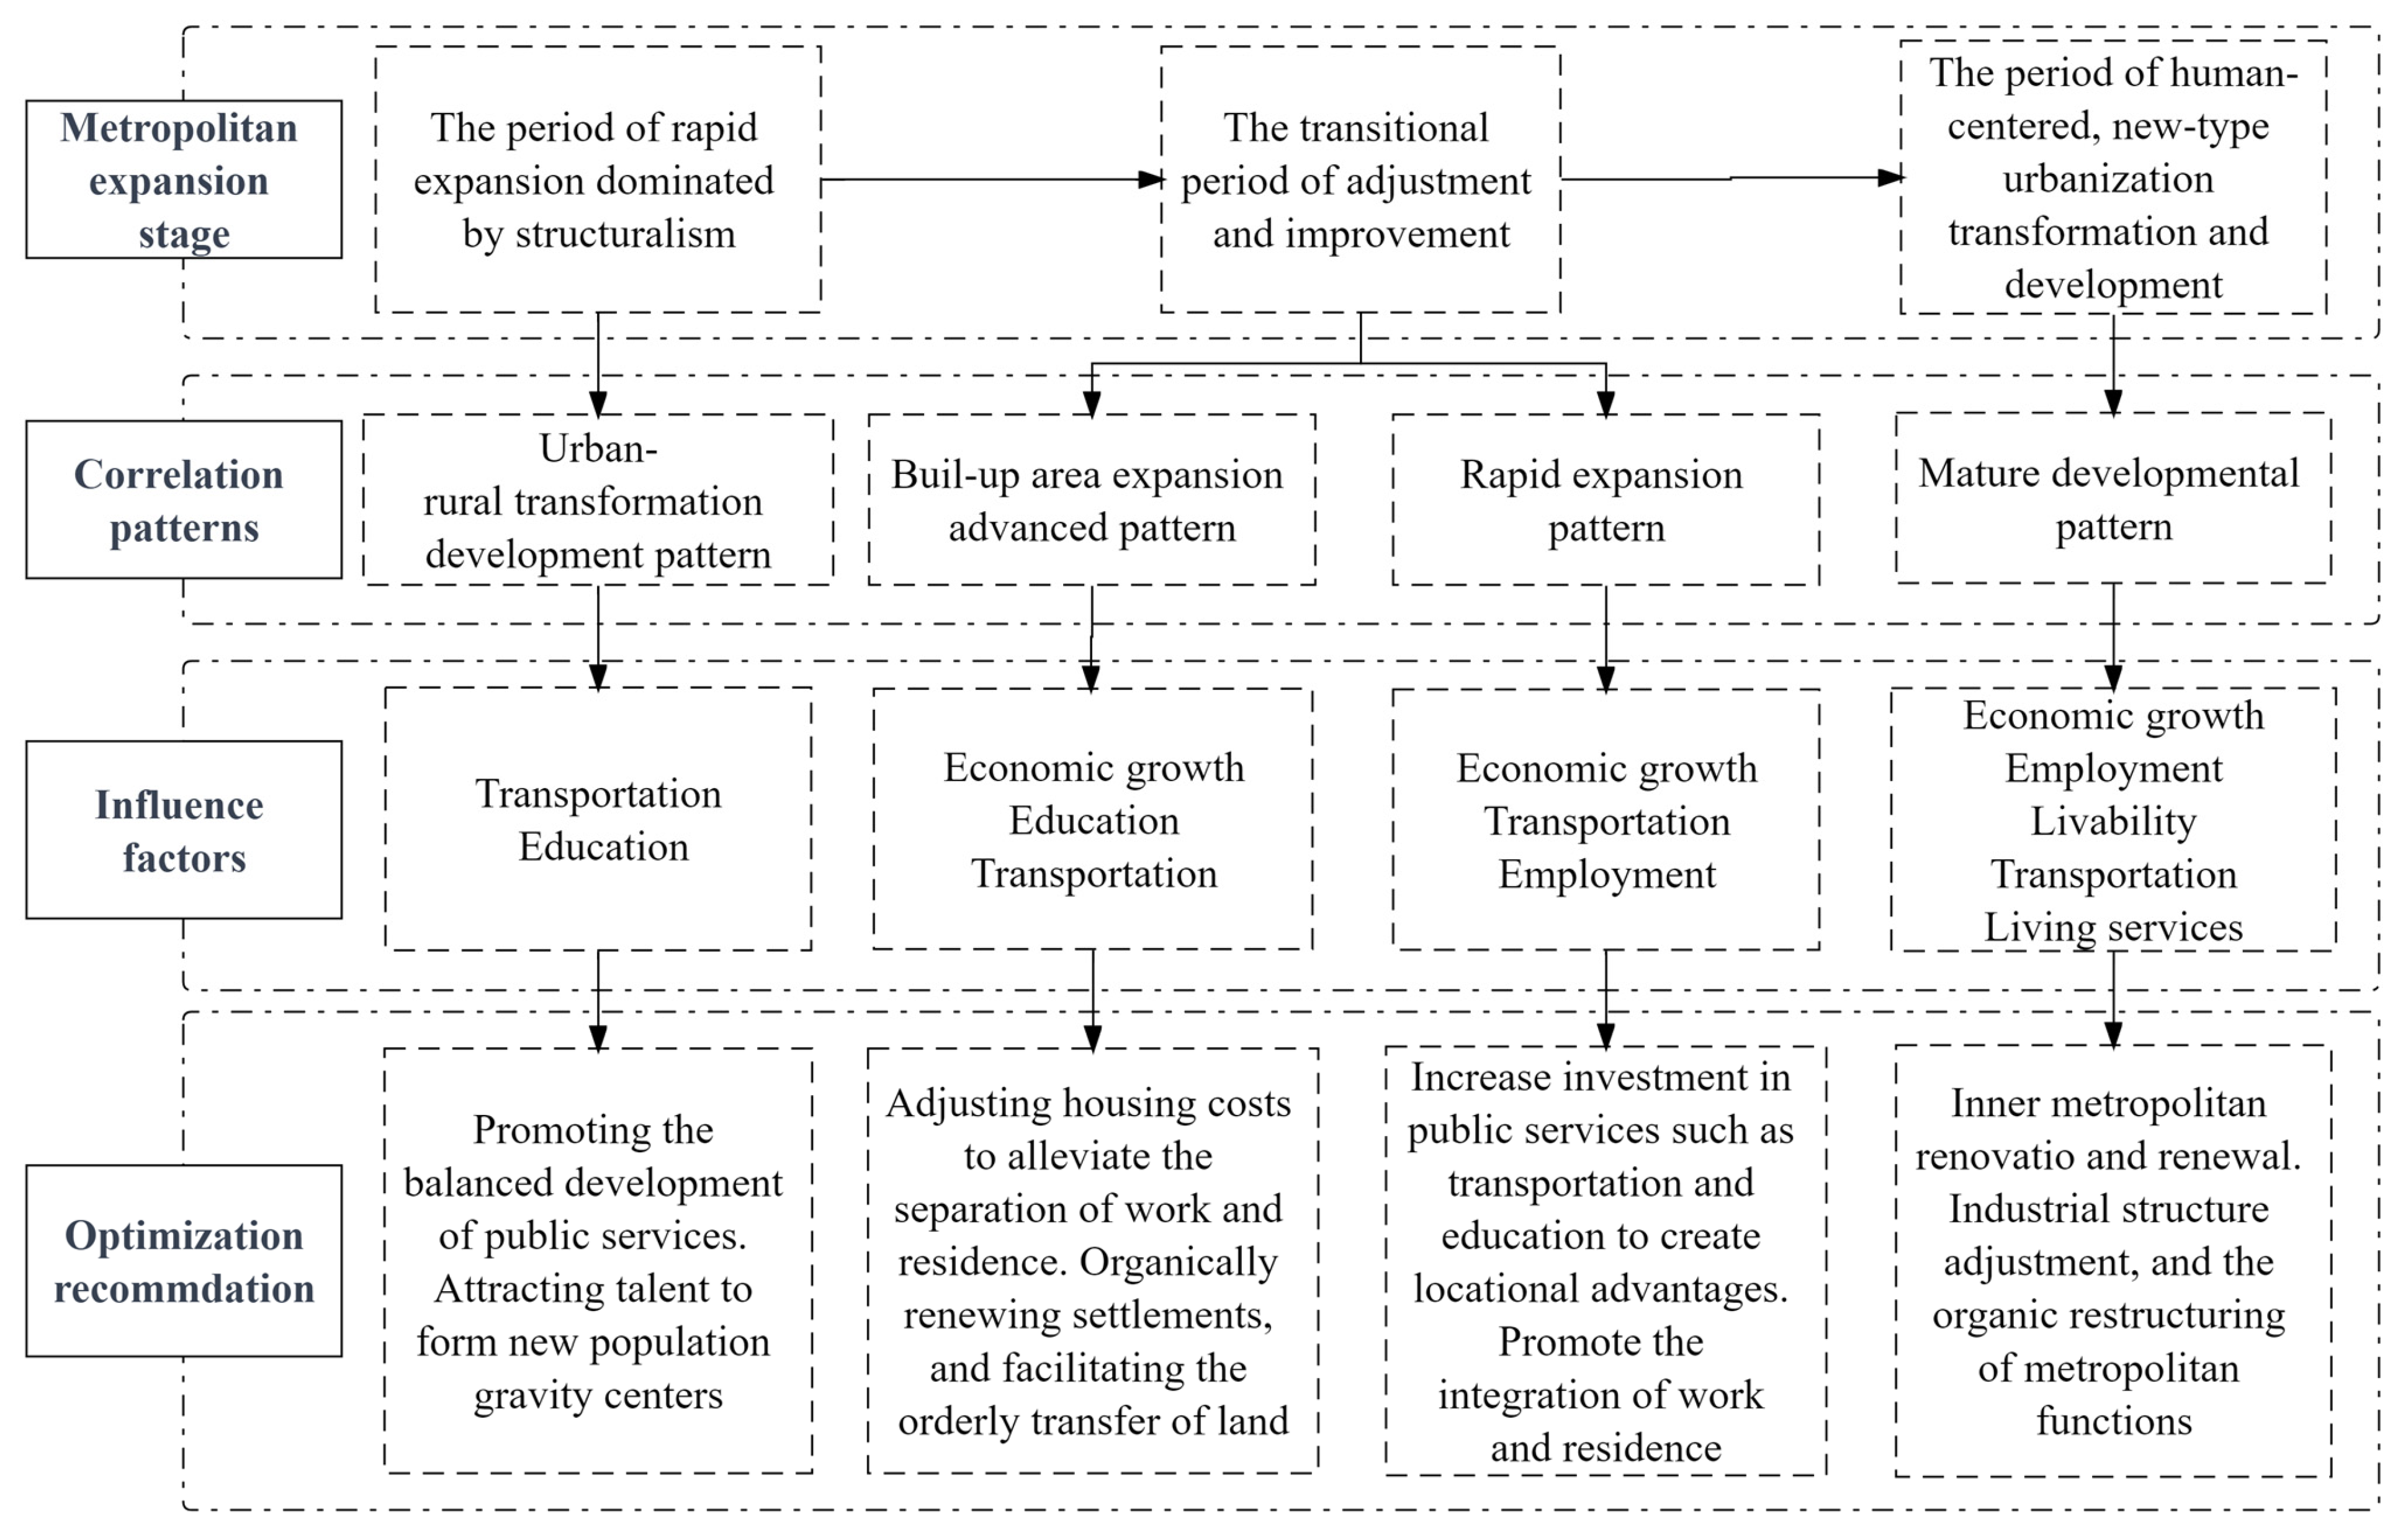
- The ongoing urban spatial transformation contributes to a more intricate and varied spatiotemporal correlation pattern between metropolitan area expansion and the migrant population. Chengdu is in a transitional phase, progressing from the rapid expansion characteristic of structuralism to the emerging era of people-centric urbanization and displaying a discernible staged and center–periphery circle pattern. In essence, the evolution of the spatiotemporal correlation pattern reflects the intricate interplay and negotiations between governmental and market forces. Consequently, the judicious planning of industrial and public service layouts can implement these strategies can elevate the standard of human-oriented urban spatial governance, achieve coordinated and balanced development between built-up and residential spaces, and advance the high-quality, sustainable, and inclusive development of metropolitan areas.
Author Contributions
Funding
Data Availability Statement
Conflicts of Interest
References
- Kim, J.U. A Bumpy Road to Cities: Analysis of the Obstacles and Limits of China’s New Urbanization. Pac. Focus 2015, 30, 372–388. [Google Scholar] [CrossRef]
- Egidi, G.; Cividino, S.; Quarantai, G.; Alhuseen, A.; Salvati, L. Land mismatches, urban growth and spatial planning: A contribution to metropolitan sustainability. Environ. Impact Assess. Rev. 2020, 84, 106439. [Google Scholar] [CrossRef]
- Huang, Q.S.; Zhou, Q.; Song, W.X. Multidimensional turn and scale response in the study of urban residential differentiation in the new era. Prog. Geogr. 2023, 42, 573–586. [Google Scholar] [CrossRef]
- Boterman, W.R.; Van Gent, W.P.C. Housing Liberalisation and Gentrification: The Social Effects of Tenure Conversions in Amsterdam. Tijdschr. Voor Econ. En Soc. Geogr. 2014, 105, 140–160. [Google Scholar] [CrossRef]
- Li, H.; Wang, Q.; Shi, W.; Deng, Z.; Wang, H. Residential clustering and spatial access to public services in Shanghai. Habitat Int. 2015, 46, 119–129. [Google Scholar] [CrossRef]
- Ouyang, W.; Wang, B.; Tian, L.; Niu, X. Spatial deprivation of urban public services in migrant enclaves under the context of a rapidly urbanizing China: An evaluation based on suburban Shanghai. Cities 2017, 60, 436–445. [Google Scholar] [CrossRef]
- Gu, H.; Liu, Z.; Shen, T. Spatial pattern and determinants of migrant workers’ interprovincialhukou transfer intention in China: Evidence from a National Migrant Population Dynamic Monitoring Survey in 2016. Popul. Space Place 2020, 26, e2250. [Google Scholar] [CrossRef]
- Wachter, G.G.; Fleischmann, F. Settlement intentions and immigrant integration: The case of recently arrived EU-Immigrants in the netherlands. Int. Migr. 2018, 56, 154–171. [Google Scholar] [CrossRef]
- Garriga, C.; Hedlund, A.; Tang, Y.; Wang, P. Rural-urban migration, structural transformation, and housing markets in China. Am. Econ. Assoc. 2023, 15, 413–440. [Google Scholar] [CrossRef]
- Massey, D.S.; Akresh, I.R. Immigrant intentions and mobility in a global economy: The attitudes and behavior of recently srrived U.S. immigrants. Soc. Sci. Q. 2006, 87, 954–971. [Google Scholar] [CrossRef]
- Elburz, Z.; Nijkamp, P.; Pels, E. Public infrastructure and regional growth: Lessons from meta-analysis. J. Transp. Geogr. 2017, 58, 1–8. [Google Scholar] [CrossRef]
- Gu, H.Y.; Liu, Z.L.; Shen, T.Y. The Employment Trend of Rural Floating Population and the Choice of Public Policy. Popul. Space Place 2019, 39, 1702–1710. [Google Scholar] [CrossRef]
- Zhou, J. The New Urbanisation Plan and permanent urban settlement of migrants in Chongqing, China. Popul. Space Place 2018, 24, e2144. [Google Scholar] [CrossRef]
- Silva Cruz, I.; Katz-Gerro, T. Urban public transport companies and strategies to promote sustainable consumption practices. J. Clean. Prod. 2016, 123, 28–33. [Google Scholar] [CrossRef]
- Järv, O.; Müürisepp, K.; Ahas, R.; Derudder, B.; Witlox, F. Ethnic differences in activity spaces as a characteristic of segregation: A study based on mobile phone usage in Tallinn, Estonia. Urban Stud. 2015, 52, 2680–2698. [Google Scholar] [CrossRef]
- Hao, L. Impact of Relaxing the Hukou Constraints on Return Migration Intentions: Evidence from China. Popul. Res. Policy Rev. 2022, 41, 583–607. [Google Scholar] [CrossRef]
- Wu, K.; Zhang, H. Land use dynamics, built-up land expansion patterns, and driving forces analysis of the fast-growing Hangzhou metropolitan area, eastern China (1978–2008). Appl. Geogr. 2012, 34, 137–145. [Google Scholar] [CrossRef]
- Sun, Y.; Cui, Y. Analyzing the Coupling Coordination among Economic, Social, and Environmental Benefits of Urban Infrastructure: Case Study of Four Chinese Autonomous Municipalities. Math. Probl. Eng. 2018, 2018, 8280328. [Google Scholar] [CrossRef]
- Shen, J.; Xiao, Y. Emerging divided cities in China: Socioeconomic segregation in Shanghai, 2000–2010. Urban Stud. 2020, 57, 1338–1356. [Google Scholar] [CrossRef]
- Luo, J.; Zhang, X.; Wu, Y.; Shen, J.; Shen, L.; Xing, X. Urban land expansion and the floating population in China: For production or for living? Cities 2018, 74, 219–228. [Google Scholar] [CrossRef]
- Feng, W.; Liu, Y.; Qu, L. Effect of land-centered urbanization on rural development: A regional analysis in China. Land Use Policy 2019, 87, 104072. [Google Scholar] [CrossRef]
- Thissen, M.; De Graaff, T.; Van Oort, F. Competitive network positions in trade and structural economic growth: A geographically weighted regression analysis for European regions. Pap. Reg. Sci. 2016, 95, 159–180. [Google Scholar] [CrossRef]
- Taylor, P.J.; Derudder, B. Central flow theory: Comparative connectivities in the world-city network. Reg. Stud. 2018, 52, 1029–1040. [Google Scholar] [CrossRef]
- Huang, L.; Yang, P.; Zhang, B.; Hu, W. Spatio-Temporal Coupling Characteristics and the Driving Mechanism of Popula-tion-Land-Industry Urbanization in the Yangtze River Economic Belt. Land 2021, 10, 400. [Google Scholar] [CrossRef]
- Xu, F.; Wang, Z.; Chi, G.; Zhang, Z. The impacts of population and agglomeration development on land use intensity: New evidence behind urbanization in China. Land Use Policy 2020, 95, 104639. [Google Scholar] [CrossRef]
- Krivo, L.J.; Washington, H.M.; Peterson, R.D.; Browning, C.R.; Calder, C.A.; Kwan, M.P. Social Isolation of Disadvantage and Advantage: The Reproduction of Inequality in Urban Space. Soc. Forces 2013, 92, 141–164. [Google Scholar] [CrossRef]
- Deng, H.; Zhang, K.; Wang, F.; Dang, A. Compact or disperse? Evolution patterns and coupling of urban land expansion and population distribution evolution of major cities in China, 1998–2018. Habitat Int. 2021, 108, 102324. [Google Scholar] [CrossRef]
- Zhu, C.; Zhang, X.; Wang, K.; Yuan, S.; Yang, L.; Skitmore, M. Urban–rural construction land transition and its coupling relationship with population flow in China’s urban agglomeration region. Cities 2020, 101, 102701. [Google Scholar] [CrossRef]
- Yan, Y.H.; Guo, Z.Y. Empirical analysis on impacts of migration with and without hukou Change on China’s Urbanization. China Popul. Resour. Environ. 2015, 25, 103–110. [Google Scholar]
- Wang, Y.; Wang, Z.; Zhou, C.; Liu, Y.; Liu, S. On the Settlement of the Floating Population in the Pearl River Delta: Understanding the Factors of Permanent Settlement Intention versus Housing Purchase Actions. Sustainability 2020, 12, 9771. [Google Scholar] [CrossRef]
- Shi, W.; Tian, J.; Namaiti, A.; Xing, X. Spatial-temporal evolution and driving factors of the Coupling Coordination between urbanization and urban resilience: A case study of the 167 counties in Hebei province. Int. J. Environ. Res. Public Health 2022, 19, 13128. [Google Scholar] [CrossRef] [PubMed]
- Fan, Q.Y.; Yang, S.; Hu, X. Spatial and temporal characteristics and interaction mechanisms of urbanization coordination in the Yangtze River Delta Region from a coupling perspective. Geogr. Res. 2020, 39, 289–302. [Google Scholar] [CrossRef]
- Huang, Q.; Liu, Y. The Coupling between Urban Expansion and Population Growth: An Analysis of Urban Agglomerations in China (2005–2020). Sustainability 2021, 13, 7250. [Google Scholar] [CrossRef]
- Fotheringham, A.S.; Yang, W.; Kang, W. Multiscale Geographically Weighted Regression (MGWR). Ann. Am. Assoc. Geogr. 2017, 107, 1247–1265. [Google Scholar] [CrossRef]
- Tiyan, S.; Hanchen, Y.; Lin, Z.; Hengyu, H.; Honghao, H. The influence mechanism of second-hand residential prices in Beijing-Based on Mul-ti-scale Geographically Weighted Regression Model (MGWR). Econ. Geogr. 2020, 40, 75–83. [Google Scholar] [CrossRef]
- Nie, X.; Shi, P.; Zhang, X.; Lv, R.; Zhu, Y.; Wei, W. Research on rurality evaluation and the driving mechanism in Arid Regions of Northwest China: A case study of Wuwei City in Gansu Province. Geogr. Sin. 2017, 37, 585–594. [Google Scholar] [CrossRef]
- Zhang, P.; Wang, M.; Deng, G. Evolutionary Game Analysis of Resilient Community Construction Driven by Government Regulation and Market. Sustainability 2023, 15, 3251. [Google Scholar] [CrossRef]
- Black, B. The corporate governance behavior and market value of Russian firms. Emerg. Mark. Rev. 2001, 2, 89–108. [Google Scholar] [CrossRef]
- Brown, L.A.; Chung, S.Y. Spatial segregation, segregation indices and the geographical perspective. Popul. Space Place 2006, 12, 125–143. [Google Scholar] [CrossRef]
- Jian, I.Y.; Luo, J.; Chan, E.H.W. Spatial justice in public open space planning: Accessibility and inclusivity. Habitat Int. 2020, 97, 102122. [Google Scholar] [CrossRef]
- Moroni, S. The just city. Three background issues: Institutional justice and spatial justice, social justice and distributive justice, concept of justice and conceptions of justice. Plan. Theory 2020, 19, 251–267. [Google Scholar] [CrossRef]
- Han, H.; Li, H. Coupling Coordination Evaluation between Population and Land Urbanization in Ha-Chang Urban Ag-glomeration. Sustainability 2020, 12, 357. [Google Scholar] [CrossRef]
- Taylor, J.R. The China Dream is an Urban Dream: Assessing the CPC’s National New-Type Urbanization Plan. J. Chin. Political Sci. 2015, 20, 107–120. [Google Scholar] [CrossRef]
- Morelli, V.G.; Rontos, K.; Salvati, L. Between suburbanisation and re-urbanisation: Revisiting the urban life cycle in a Medi-terranean compact city. Urban Res. Pract. 2014, 7, 74–88. [Google Scholar] [CrossRef]
- Hanzl, M. Urban Sprawl in Europe: Landscapes, Landuse Change and Policy. Plan. Pract. Res. 2010, 2, 273–274. [Google Scholar] [CrossRef]


| Category | Major Categories | Minor Categories | Year | Data Source |
|---|---|---|---|---|
| 1 | Migrant population | - | 2010, 2020 | The Sixth and Seventh Population Censuses and Statistical Yearbooks |
| 2 | Land use data | - | 2000, 2010, 2020 | China 30 m Resolution Land Cover Dataset |
| 3 | Economic growth | GDP | 2010, 2020 (the data for the year 2020 is replaced by the data from 2019) | Resource and Environmental Science and Data Center (https://www.resdc.cn/ (accessed on 3 July 2022)) |
| Night lighting | 2010, 2020 | Institute of Tibetan Plateau Research Chinese Academy of Sciences (http://data.tpdc.ac.cn/zh-hans/ (accessed on 3 July 2022)) | ||
| 4 | Employment and educational situation | Employment opportunities | 2010, 2020 | Gaode map (https://ditu.amap.com/ (accessed on 19 July 2022)) |
| Educational resources | 2010, 2020 | |||
| 5 | Quality of life services | Life service facilities | 2010, 2020 | |
| 6 | Residential and transportation conditions | Residential quantity | 2010, 2020 | |
| Transportation stations | 2010, 2020 | |||
| Road network density | 2010, 2020 | Resource and Environment Science and Data Center (https://www.resdc.cn/ (accessed on 16 July 2022)) |
| Index | Correlation between Metropolitan Expansion and Migrant Population | ||||||
|---|---|---|---|---|---|---|---|
| 2010 | 2020 | ||||||
| Band Width | Mean Coefficient | Correlation Coefficient | Band Width | Mean Coefficient | Correlation Coefficient | ||
| Economic growth | GDP | 120 | −0.36 (0.44) | −0.067 ** | 75 | −1.59 (0.23) | −0.002 ** |
| Night lighting | 125 | 0.55 (0.61) | 0.274 ** | 127 | 0.93 (0.69) | 0.360 ** | |
| Employment and education | Employment opportunities | 9 | −0.38 (0.62) | 0.230 * | 64 | −0.59 (0.57) | 0.409 ** |
| Education resources | 18 | 0.48 (0.41) | 0.590 ** | 27 | 0.29 (0.48) | 0.661 ** | |
| Residence and transportation | Quantity of residential properties | 81 | 0.01 (0.68) | 0.316 * | 86 | −0.39 (1.08) | 0.532 ** |
| Transportation stations | 112 | 0.26 (0.85) | 0.222 ** | 117 | 0.78 (1.28) | 0.662 ** | |
| Road network density | 127 | 0.18 (1.13) | −0.394 * | 127 | −0.47 (0.57) | 0.360 ** | |
| Lifestyle services | Life service facilities | 121 | −0.14 (0.46) | 0.178 ** | 124 | −0.31 (0.20) | 0.029 * |
| AICc | - | −109.77 | −135.75 | ||||
| Adjusted R-squared | - | 0.62 | 0.69 | ||||
| Residual sum of squares | - | 2.33 | 1.71 | ||||
| Correlation Pattern | Main Influencing Factors | |
|---|---|---|
| 2010 | 2020 | |
| Mature developmental pattern | Night lighting, education resources, transportation stations, road network density | Night lighting, transportation stations |
| Rapid expansion pattern | Transportation stations, road network density, life service facilities | Education resources, transportation stations |
| Urban–rural transformation development pattern | GDP, residential quantity, life service facilities | GDP, employment opportunities, residential quantity, road network density, life service facilities |
| Built-up area expansion advanced pattern | Employment opportunities, transportation stations | Night lighting, education resources, transportation stations |
| Index | DI Value | |||
|---|---|---|---|---|
| 2010 | 2020 | Change Value | ||
| Economic growth | GDP | 0.28 | 0.40 | 0.12 |
| Night lighting | 0.30 | 0.54 | 0.24 | |
| Employment and education | Employment opportunities | 0.32 | 0.52 | 0.20 |
| Education resources | 0.38 | 0.25 | −0.13 | |
| Housing and transportation | Quantity of residential properties | 0.26 | 0.47 | 0.21 |
| Transportation stations | 0.31 | 0.26 | −0.05 | |
| Road network density | 0.47 | 0.37 | −0.10 | |
| Daily life services | Life service facilities | 0.22 | 0.14 | −0.08 |
Disclaimer/Publisher’s Note: The statements, opinions and data contained in all publications are solely those of the individual author(s) and contributor(s) and not of MDPI and/or the editor(s). MDPI and/or the editor(s) disclaim responsibility for any injury to people or property resulting from any ideas, methods, instructions or products referred to in the content. |
© 2024 by the authors. Licensee MDPI, Basel, Switzerland. This article is an open access article distributed under the terms and conditions of the Creative Commons Attribution (CC BY) license (https://creativecommons.org/licenses/by/4.0/).
Share and Cite
Wang, J.; Zhang, S.; Deng, W.; Zhou, Q. Metropolitan Expansion and Migrant Population: Correlation Patterns and Influencing Factors in Chengdu, China. Land 2024, 13, 101. https://doi.org/10.3390/land13010101
Wang J, Zhang S, Deng W, Zhou Q. Metropolitan Expansion and Migrant Population: Correlation Patterns and Influencing Factors in Chengdu, China. Land. 2024; 13(1):101. https://doi.org/10.3390/land13010101
Chicago/Turabian StyleWang, Junfeng, Shaoyao Zhang, Wei Deng, and Qianli Zhou. 2024. "Metropolitan Expansion and Migrant Population: Correlation Patterns and Influencing Factors in Chengdu, China" Land 13, no. 1: 101. https://doi.org/10.3390/land13010101